Article

Hybrid Energy Storage System for Regenerative Braking Utilization and Peak Power Decrease in 3 kV DC Railway Electrification System

by
Adam Szeląg
*,
Włodzimierz Jefimowski
,
Tadeusz Maciołek
,
Anatolii Nikitenko
,
Maciej Wieczorek
and
Mirosław Lewandowski
Electrical Power Engineering Institute, Warsaw University of Technology, ul. Koszykowa 75, 00-662 Warsaw, Poland
*
Author to whom correspondence should be addressed.
Electronics 2025, 14(9), 1752; https://doi.org/10.3390/electronics14091752
Submission received: 28 December 2024 / Revised: 16 March 2025 / Accepted: 19 March 2025 / Published: 25 April 2025
(This article belongs to the Special Issue Railway Traction Power Supply, 2nd Edition)

Abstract

:
This paper proposes the sizing optimization method and energy management strategy for a stationary hybrid energy storage system dedicated to a DC traction power supply system. The hybrid energy storage system consists of two modules—a supercapacitor, mainly dedicated to regenerative energy utilization, and a Li-ion battery, aimed to peak power reduction. The sizing method and energy management strategy proposed in this paper aim to reduce the aging effect of lithium-ion batteries. It is shown that the parameters of both modules could be sized independently. The supercapacitor module parameters are sized based on the results of a simulation determining the regenerative power, resulting in limited catenary receptivity. The simulation model of the DC electrification system is validated by comparing the results of the simulation with the measurements of 15 min average power in a 24 h cycle as average values of one year. The battery module is sized based on the statistical data of 15 min substation power value occurrences. The battery energy capacity, its maximum discharge C-rate, and the conditions determining its operation are optimized to achieve the maximum ratio of annual income resulting from peak power reduction to annual operating cost resulting from the battery aging process and total life cycle. The case study prepared for a typical 3 kV DC substation with mixed railway traffic shows that peak power could be reduced by ~1 MW, giving a ~10-year payback period for battery module installation, while the energy consumption could be decreased by 1.9 MWh/24 h, giving a ~7.5-year payback period for supercapacitor module installation. The payback period of the whole energy storage system (ESS) is ~8.4 years.

1. Introduction

Over the last several years, intensively increasing emissions of CO2 resulting from the burning of fossil fuels have led to climate changes exerting an influence on both ecosystems and public health [1]. This has put pressure on improving the energy efficiency of all stages of energy conversion and utilization, including railway transportation systems [2], in order to limit CO2 emissions. In this area, the introduction of a rolling stock with regenerative braking on a wide scale has played a significant role in the last several years. In DC electrification systems, regenerative energy could be used under conditions of high catenary receptivity. Otherwise, regenerative energy is converted into heat in the braking resistors of trains. High catenary receptivity could be ensured by other trains drawing power mode or by stationary devices, such as ESS [3,4] or regenerative inverters [5]. Among the stationary energy storage systems used for the purpose of regenerative power utilization, the most perspective are supercapacitors due to their high power density, large number of charge–discharge cycles, and decreasing prices [2,6].
In addition to high energy consumption, the crucial problem of the up-to-date electric power systems is the appearance of load demand peaks [7]. The problem is especially significant in traction substations, whose power demand may be described as a stochastic process since it depends on the railway traffic and its fluctuation on the track supplied by the substation. In many countries, peak power for big consumers is considered as energy consumption in half-hourly measurement periods; however, in Poland, for instance, the duration of the measurement period is 15 min. The peak power demand charge in the case of traction substations consists of 10–40% of the total electricity charge [8]; hence, it is highly desirable to decrease the quantity from a financial point of view. The fact stated above indicates the need to maximize the use of recuperated energy to improve the energy efficiency of rail transport. In particular, the implementation of energy storage systems is one of the main methods to improve energy efficiency, and the effectiveness of their use depends on many factors, such as energy storage parameters, location, and the energy management strategy.
Numerous authors have taken on the optimization problems of sizing, locating, and determining the energy management strategy (EMS) of trackside supercapacitor energy storage. In [9], Iannuzzi et al. proposed and experimentally validated an optimization approach to ESS sizing. The approach considers minimization of line losses, improvement of voltage profile, and minimization of storage device size and mass volume. In [10], Barrero et al. showed a deep analysis of the improvement of energy efficiency in the metro line for the stationary energy storage for its variable size. The influence of traffic on the effectiveness of energy storage operation has been investigated. In [11], Jalali and Farjah proposed the use of artificial intelligence methods of energy storage location optimization. Finally, in [12], Sirmelis et al. discussed the optimization of stationary supercapacitor ESS sizing optimization based on cost analysis.
At the same time, the problem of peak shaving has been investigated by numerous researchers. One of the most up-to-date methods of peak power reduction is the use of energy storage [7]. In [13], Chua et al. introduced the fuzzy-control-based method to forecast power demand peaks based on the previous day’s measurement results. The effectiveness of the approach has been confirmed experimentally. A significant contribution was made by Fossati et al. in [14], where the genetic-algorithm-based optimization model dedicated to the sizing of ESS was introduced. Additionally, an EMS based on the fuzzy expert system has been optimized jointly with the parameters of ESS. Moreover, the aging effect has been taken into account. A specific solution for peak power reduction based on battery energy storage dedicated to traction load was introduced by Jarnut et al. in [15]. In [16], Ovalle et al. introduced the sizing methodology for energy storage systems dedicated to a DC railway system as an alternative to new traction substation installation. In [17], Graber et al. proposed a finance-based method to quantify the size and location of the battery in trackside ESSs to minimize the annual cost of energy.
In [18], the authors presented an optimization method based on a fuzzy logic-dedicated traction substation with energy storage and a renewable power source. In [19], Ciccarelli et al. proposed a simplified control strategy for a trackside ESS to save energy, reduce voltage drops, and maximize line current reduction. In [20], Zheng et al. proposed the implementation of hybrid energy storage consisting of supercapacitor and Li-ion battery on board of the rail transit vehicle. Li et al. in [21] proposed deep reinforcement learning based on energy management strategy for hybrid energy storage system applied in several DC traction substation. The proposed algorithm led to a decrease in energy consumption and daily cost reduction. Hybrid energy storage has been deeply investigated as a solution for autonomous electric vehicles [22], the chosen concepts of EMS used in that area could be successfully transferred into the area of stationary ESS hybrid.
The significant effort has been made to investigate the influence of energy management strategies on the aging effect of Li-ion batteries, especially for stationary battery energy storage systems (BESS) which is mainly related to the integration of renewable energy sources. Zhen et al. in [23] presented the thorough investigation of BESS in grid applications in modeling aspects of aging processes and economic feasibility. Grimaldi et al. in [24] have presented the detailed results of aging processes of the real world BESS application. In this work the state of health (SOH) of batteries have been compared for different profiles of charge-discharge cycles. At the same time calendar fade effects for different profiles have been compared based on the experimental results. Additionally, in this paper heat efficiency and heat aspects were widely discussed. Kortelmann at all in [25] introduced the energy management strategy dedicated to the hybrid energy storage system containing different battery types. The result of the implementation of what? shows great influence of the algorithm parameters on the operation performance, especially on aging effect and efficiency.
This paper introduces the sizing methodology and energy management strategy for the hybrid energy storage system designed for two purposes: utilization of regenerative energy and reduction of peak power. Regenerative energy utilization is carried out by a supercapacitor part while? peak power demand is being decreased by discharging Li-ion battery in case if a 15-min substation power exceeds the given limit (trigger power PTR). During the operation of Li-ion battery, a supercapacitor also takes part in battery peak current limitation therefore reducing aging process. The sizing methodology is based on the 24-h profile substation instantaneous power obtained from the simulation (for supercapacitor sizing) and the 15-min power values obtained from the last year’s measurements (for battery sizing). The histogram of the 15-min power values of traction substation enables to predict the number of charge/discharge cycles of the battery per year and depth of discharge. Both factors determine the aging process intensity for the given degree of peak power reduction (ΔPAVR) after installing of energy storage. The procedure is based on the aging model of the given Li-ion battery.
The validation has been carried out by comparing measurement data with simulation results. The measured data is average 15-min power profile of traction substation for 1-year period is.
The conception of analyzed hybrid energy storage is presented in the scheme in Figure 1:
1. The ESS consists of two modules: a supercapacitor—1 and a Li–ion battery—2. Both energy storages are connected to 3 kV DC busbar via DC/DC converters.

2. The Procedure of Energy Storage Parameters Optimization

The procedure for energy storage parameters sizing is presented in Figure 2 and consists of the following steps:
(a)
carrying out the measurements of the 15-min substation traction power for one year (the historical data of 15-min average power, hence? the values are registered according to the agreement with the DNO),
(b)
conducting the simulation of the railway line based on the timetable of the trains’ operation in order to obtain the instantaneous values of the traction power for 24-h cycle, including the available regeneration power. Regeneration power is available as the result of the limited overhead catenary receptivity. The 24-h cycle of instantaneous power profile is needed to carry out the evaluation of the annual regenerative energy,
(c)
comparing the 15-min power obtained from the simulation in point (b) above with the average 15-min power measured in the real substation in order to validate the correctness of the simulation model. This point is not necessary for the sizing procedure but provides the validation of the simulation model with the real model.
(d)
conducting the second simulation of 24-h operation of the traction substation with the traffic concentration near the analyzed substation, which will give the comparable value to the maximum 15-min power during 1-year measurements. This process requires the modification of the train timetable such a way as to obtain the peak power demand close to the value obtained in the measurements as the sizing process requires the time profile of substation power for 24 h cycle containing available regenerative power (negative values) and peak power obtained due to ? traffic concentration,
(e)
sizing the parameters of supercapacitor module (energy capacity and nominal power of DC/DC converter) based on the criterion of payback period value [12],
(f)
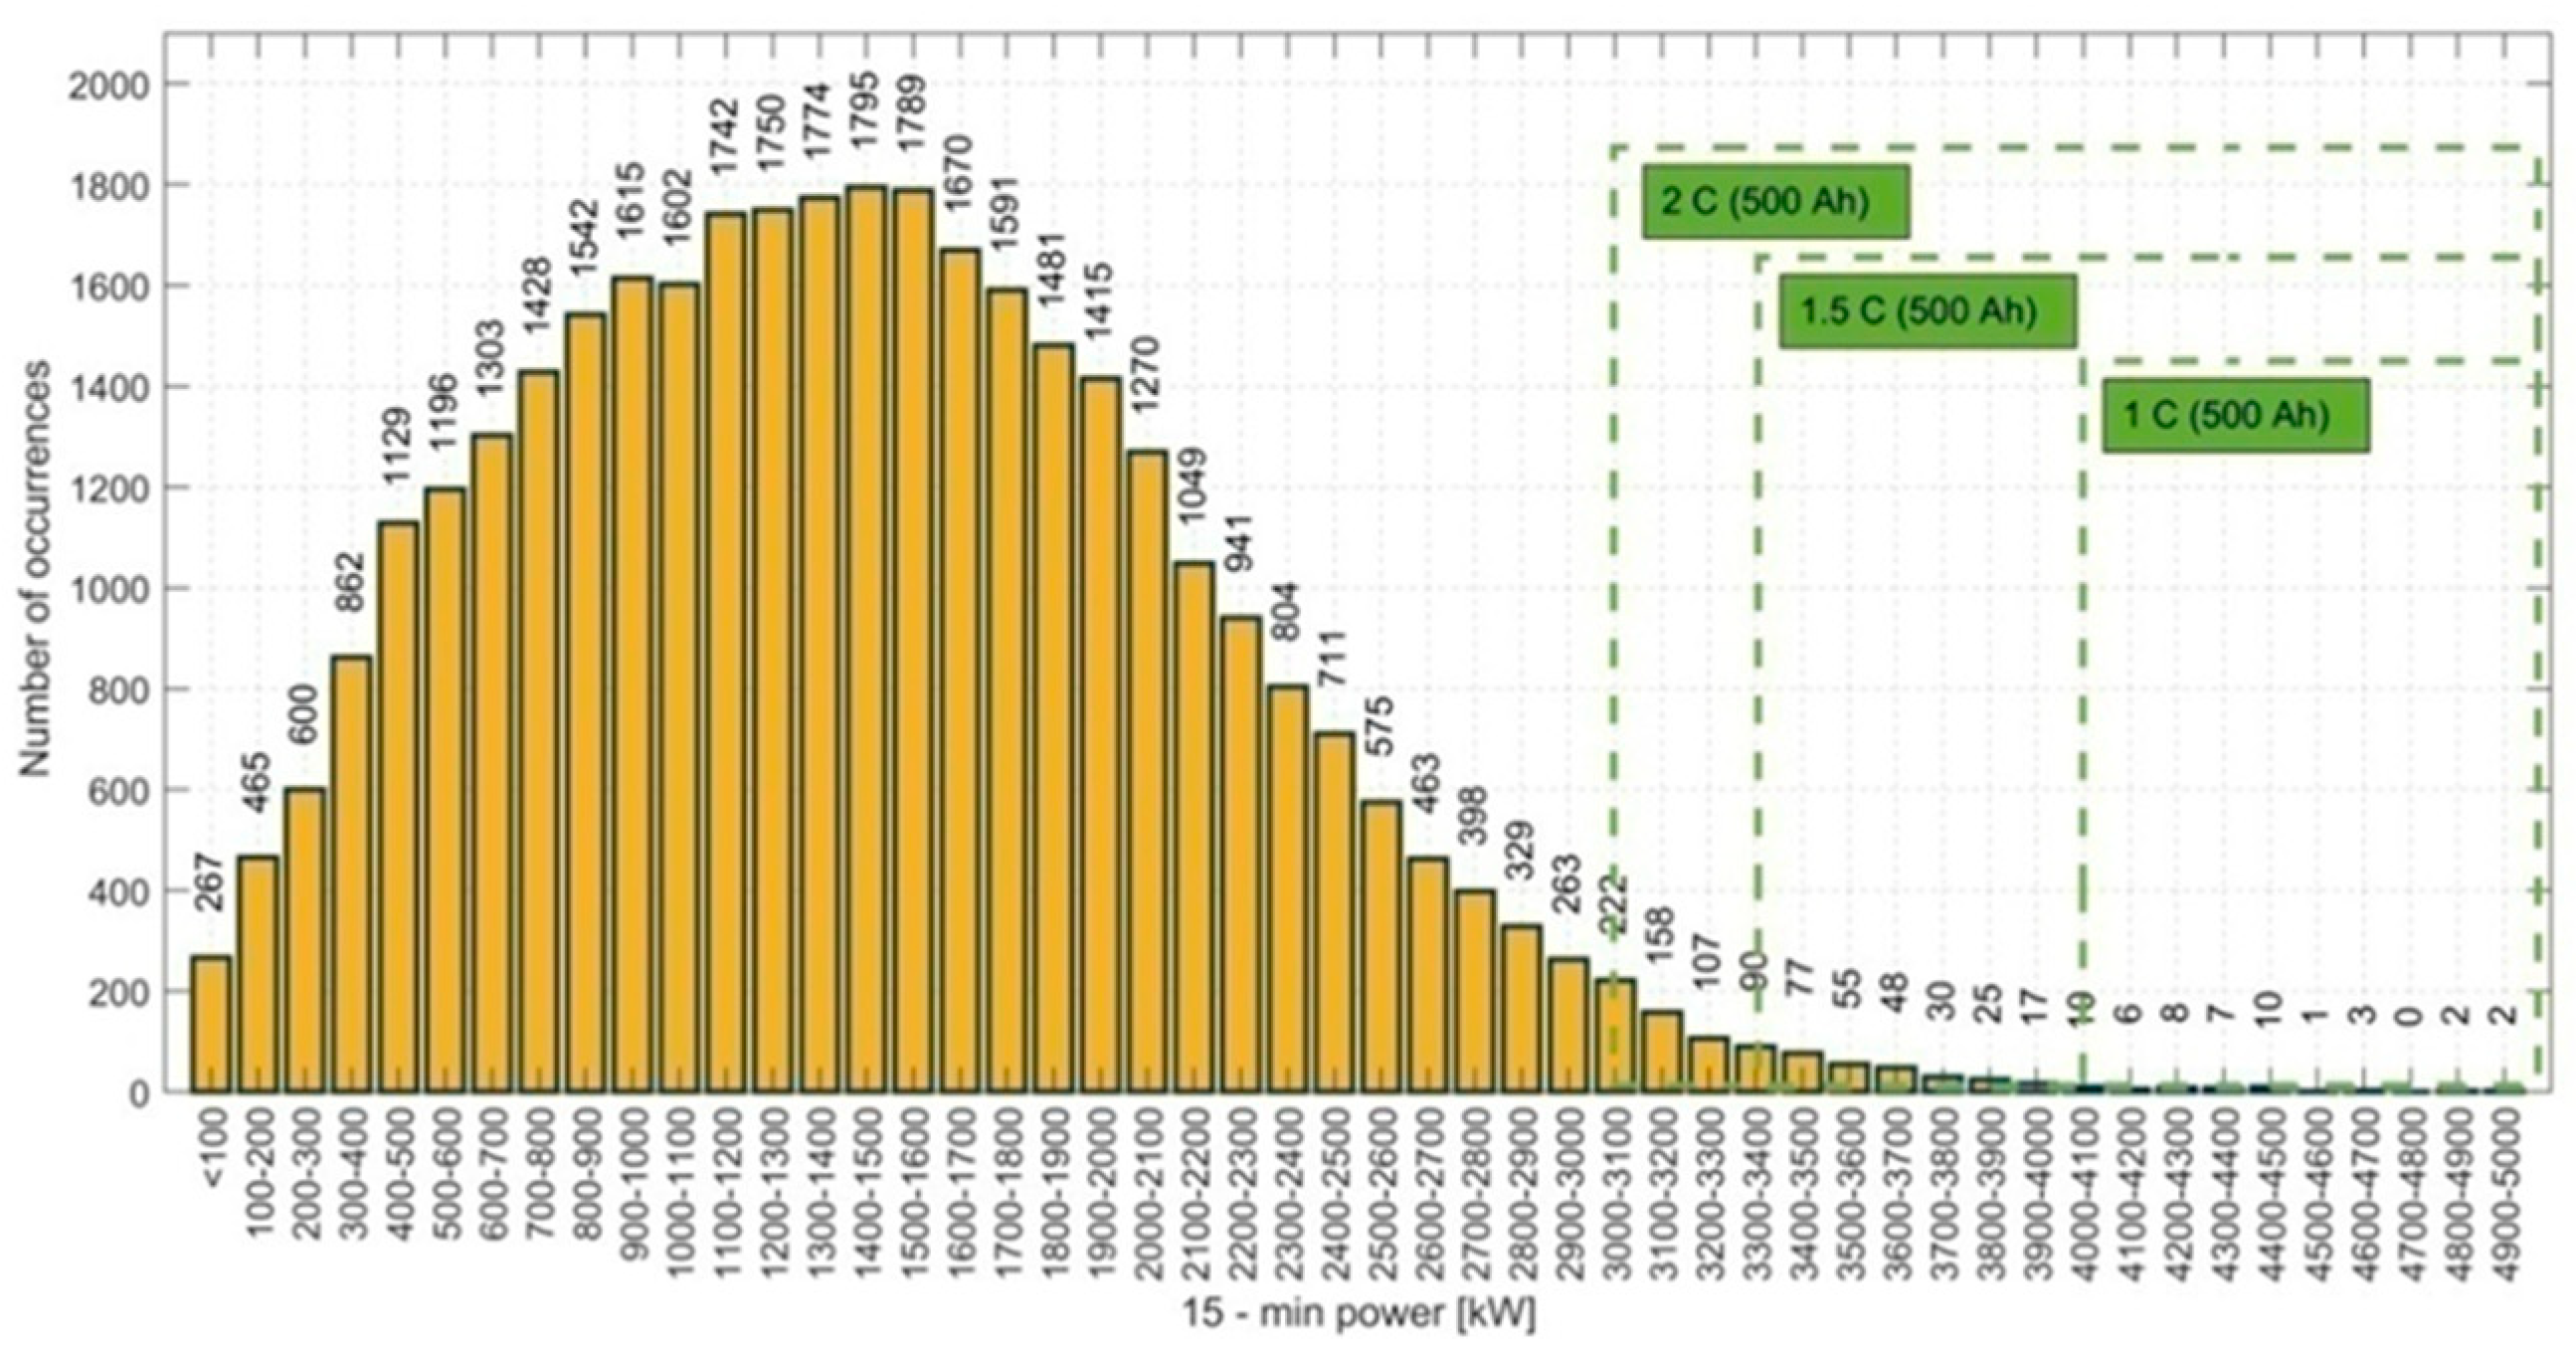
sizing the parameters of the battery module of the energy storage based on the histogram of the 15-min power measurements and the simulation of the energy storage model with the 24-h values with the traffic concentration.
In the proposed sizing procedure, particularly for sizing of Li–ion battery for peak power demand reduction, carrying out the simulation of train traffic occurring during peak power occurrence during 1-year measurement process (step d) is a crucial step. The values of substation power do not include direct data regarding the traffic. Therefore, the implemented traffic timetable is obtained by modifying the timetable given by the railway infrastructure operator and implemented in step b. Timetable modifications should be made iteratively by comparing the peak power values obtained in the results of simulation with the same parameters measured in the physical substation.

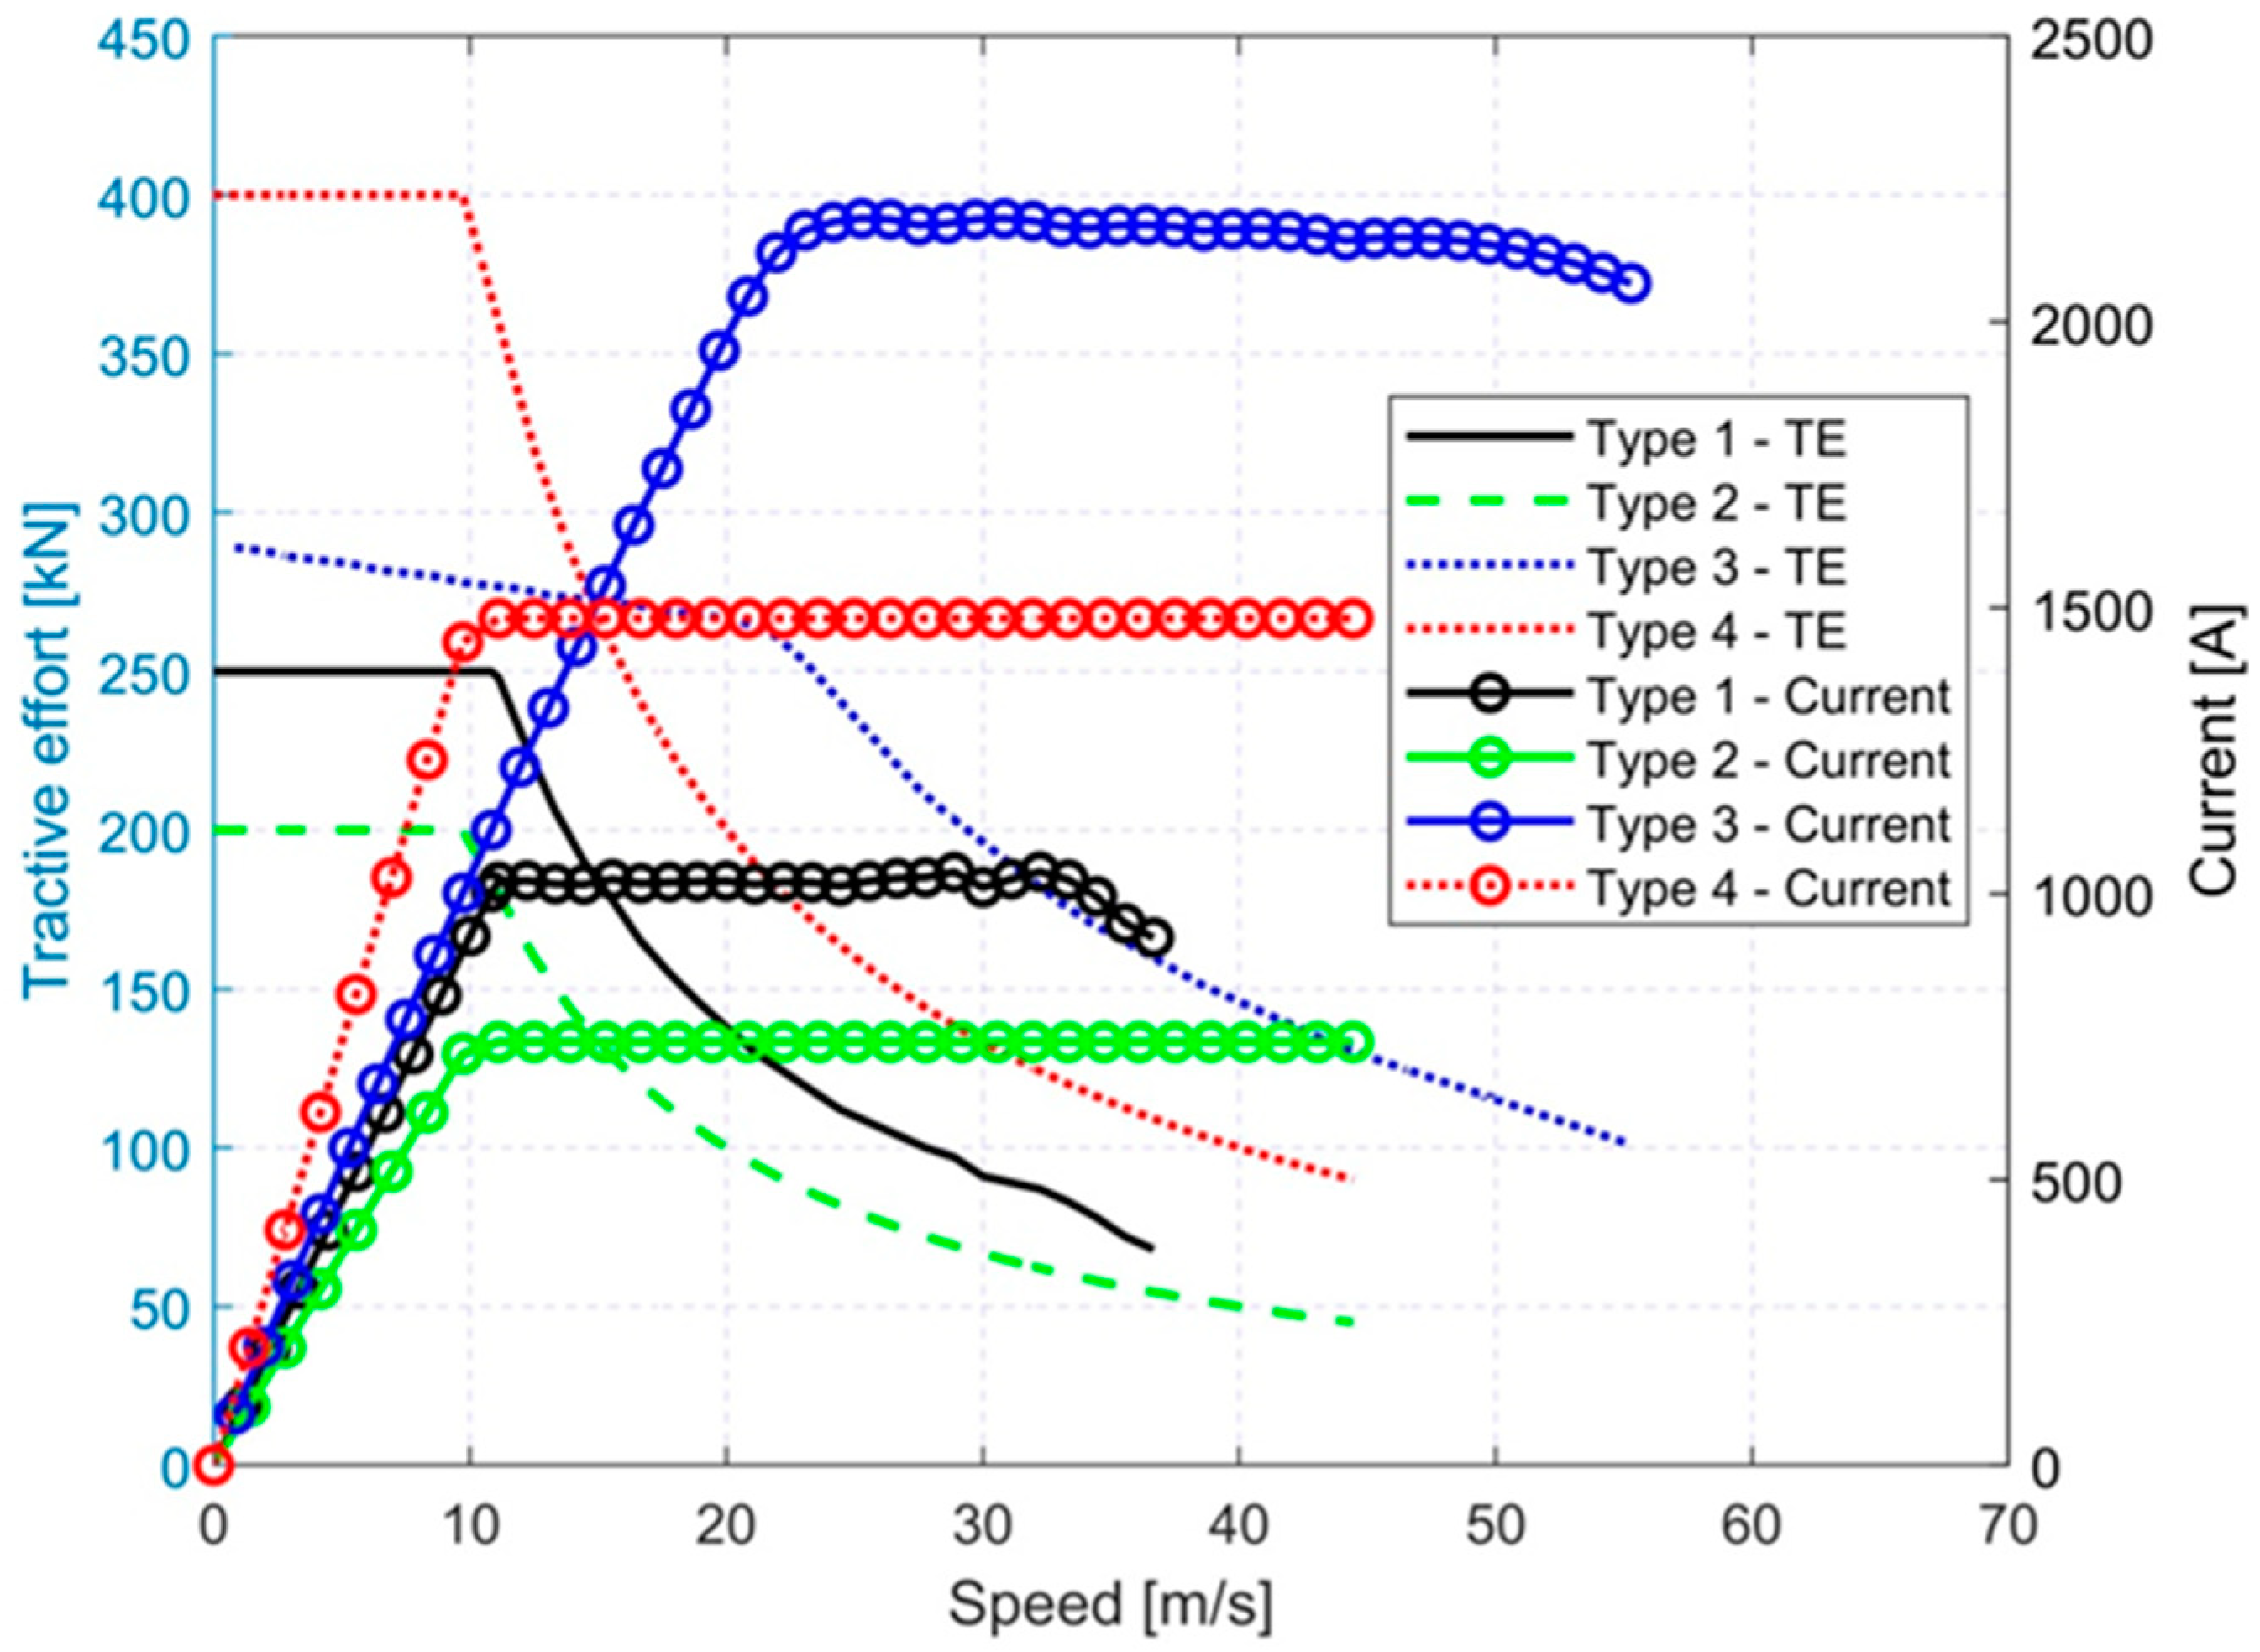
3. The Validation of Simulation Model of DC Electrification System with Limited Receptivity

The time profile of substation power is obtained by the means of simulation model of an electrified railway line with regenerative braking and limited catenary receptivity as described in [26]. The limited catenary receptivity takes place when during train braking not the whole regenerative power could be sent to catenary (and then to other trains or energy storage/regenerative inverters) and part of this power should be converted into heat on braking resistors. Trains reach the limit of the power sent to the catenary during braking when pantograph voltage reaches the limit of 3900 V in 3 kV system. The simulation was carried out for the real railway line. All the necessary parameters of the railway line were authentic ones including the timetable of train operation, parameters of the rolling stock, vertical and horizontal profile, overhead catenary, returning rails, substation locations and internal resistances and the others. Figure 3 presents the electrical scheme of the analyzed traction power supply system. The substation TSS4 (43.15 km) is the traction substation where the energy storage is considered to be installed.
Four types of rolling stock have been modeled: an electric multiple unit (Type 1), two types of passenger carriage trains (Type 2 and 3) and freight train (Type 4). Figure 4 presents the traction characteristics of the rolling stock. Table 1 shows the main parameters of the rolling stock operating in the analyzed railway line. These parameters as well as the traction characteristics have been taken from the manufacturers’ data.
According to the procedure, two simulations should be carried out:
-
including normal train operation according to the standard timetable
-
including train operation according to the timetable with the train traffic concentration near the traction substation with energy storage.
The traffic concentration has been obtained by shifting train patterns in time and extending their dwell time. The simulation has been iteratively repeated in order to obtain the maximum value of 15-min substation power of the analyzed substation relatively close to the maximum value provided by 1-year measurements. The graphic timetable of trains operation is shown in Figure 5 while the train traffic concentration occurring near to the analyzed traction substation is shown in Figure 5c. The real names of the stations have been removed requested by the traction energy supplier.
The longer the period of measurement data acquisition, the more accurate the forecast of peak power occurrences. The assumption has been made that in future period of ESS operation the histogram of 15-min power is close to the histogram of the registered power values in the past. The assumption is true if the passenger and goods flow do not fluctuate significantly.
The values of 15-min power were registered during 1-year period at the points of connections of traction substation to the medium voltage (15 kV) supplying the grid. The values of the 15-min power are obtained as follows (Equation (1)).
P 15 t i n = 4 t 0 15 min t 0 p t d t
The values of traction substation power were obtained by subtracting non-traction from total substation power. The validation of the simulation model was performed by comparing the 15-min power profile in 24-h cycle obtained by simulation according to the timetable (without traffic concentration) with the averaged 24-h, 15-min measured power profile obtained according to the Equation (2).
P 15 M S t i = 1 365 n = 1 365 P 15 t i n
Furthermore, the 24-h energy consumption obtained by the simulation was compared with the average 24-h energy consumption obtained by the measurements. The average 24-h energy measured? was calculated according to Equation (3).
E M S = 1 365 i = 1 96 n = 1 365 P 15 t i n
Figure 6a presents the comparison of 15-min averaged power obtained by the simulation and average 15-min power obtained by the measurements. For the two above variables the Pearson correlation coefficient was calculated and it value was 0.61. Figure 6b shows the correlation diagram between the measured and simulated values of 15-min power. There is a number of random factors influencing the time profile of 15-min average power of traction substation. These random factors influencing the case study verification most are appearance of random train traffic situations, changes of train timetable, replacing rolling stock types between train missions, random payload of freight and passenger trains, and random drive styles. Taking into account the above factors, the exact forecasting by simulation the values of 15-min power in exact hour is rather difficult. The measured average 24-h energy consumption (Equation (3)) is 34.46 MWh, while 24-h energy consumption obtained by simulation is 31.00 MWh, giving the relative difference of 10%.
The results of the validation confirm that the simulation model is consistent with the real railway system. The distinguishing features of the validated model are the following:
-
the model contains 160 trains of different types operating during 24-h cycle,
-
the trains of type 1 and 3 are equipped with regenerative braking.
The simulation model also includes limited receptivity of overhead catenary.
In the available literature there are not many papers presenting The validation of the simulation models of electrified railway transportation by comparing with the real-world measurements. The features listed above confirm the consistency of the simulation model with the real traction power supply system with regenerative braking and limited overhead catenary receptivity. Therefore, it is justified to conduct the sizing process based on the results of the simulation.

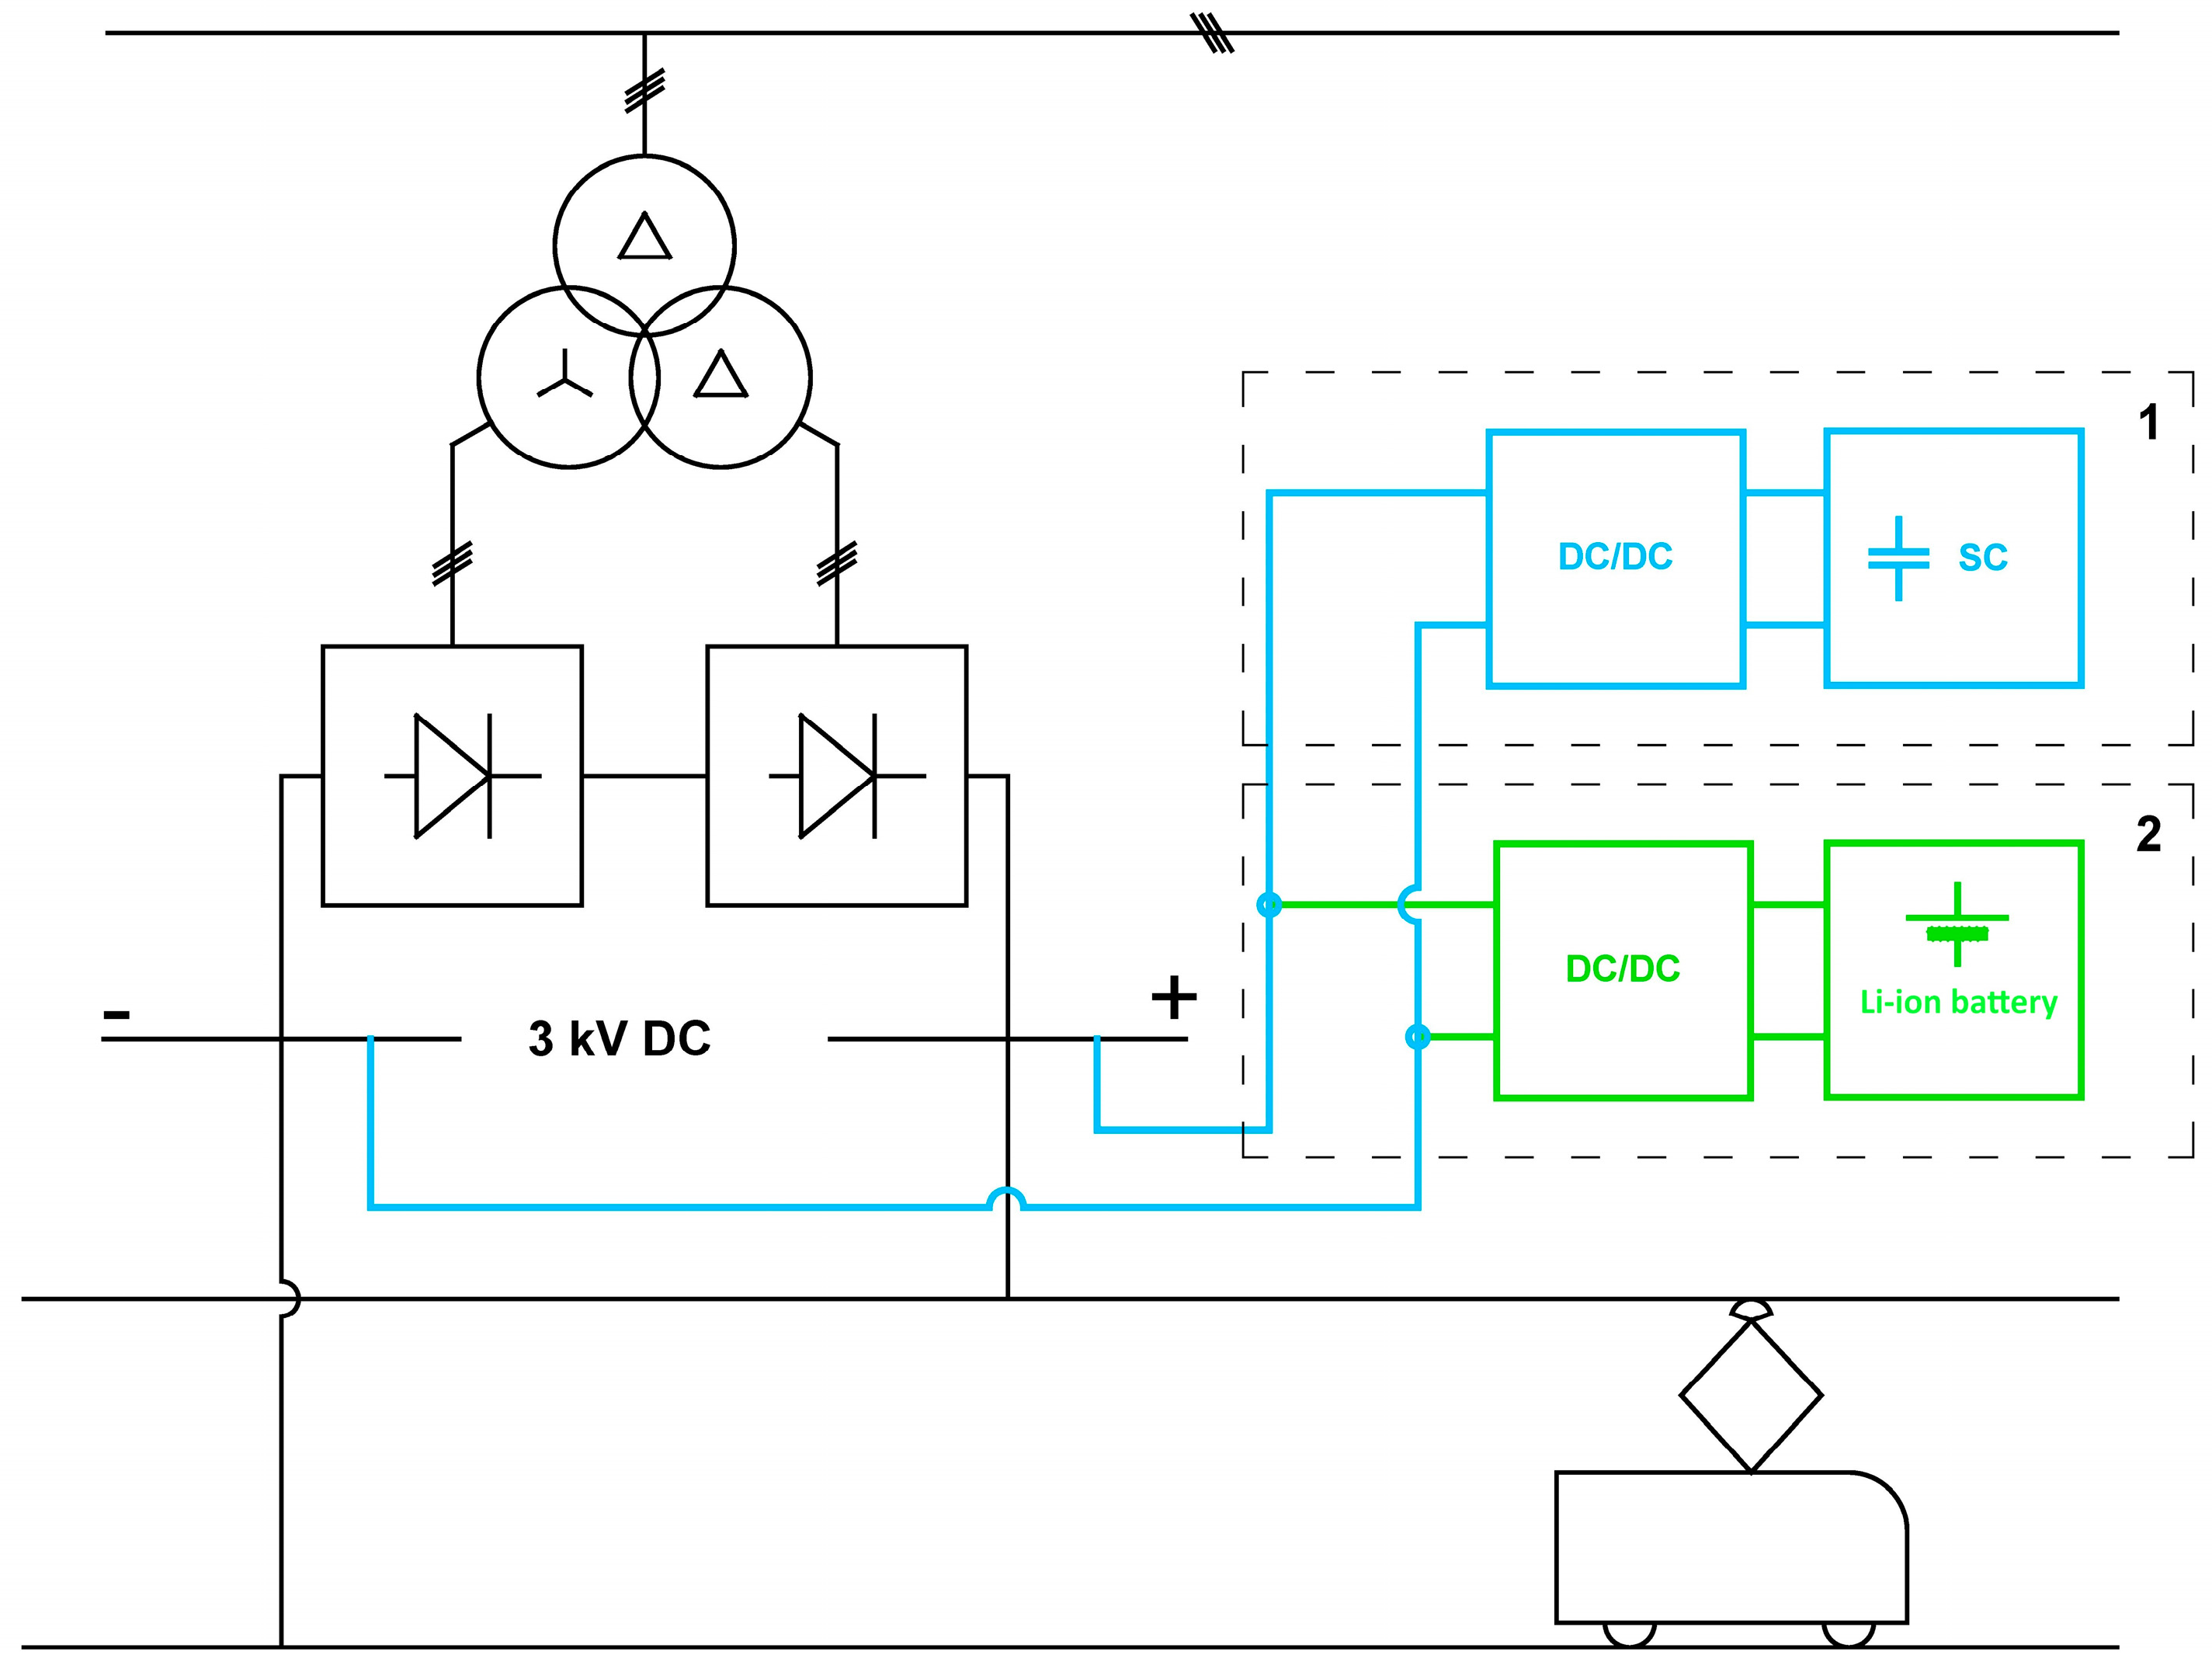
4. The Algorithm of ESS Operation

The algorithm of the ESS operation should meet the following conditions:
-
maximum/maximizing the use of available excessive regenerative energy of the braking trains,
-
maximum decrease of peak power and ensuring that the peak power is below the new limit,
-
maximizing the live cycle of the lithium-ion battery.
The proposed energy management algorithm belongs to the group of deterministic based rule strategies. Figure 2 shows the algorithm of the EMS. This algorithm is based on a real time value of an average 15-min power calculated according to Equation (4):
P A V R t = t 0 15 min t 0 p t d t
If the average 15-min power exceeds the given trigger power PTR, the battery is discharged and the demand power of traction substation is partly covered by the batteries (2) and (4) shown in Figure 7a. The power of discharge depends on the value of power demanded by the traction substation. If the instantaneous substation power demand exceeds the given limit, and the supercapacitor state of charge is above the given value USCtr, a supercapacitor is discharged. If the value of the average power PAVR calculated according to Equation (4) does not exceed the given threshold value PTR, the battery does not operate., So It remains charged while the supercapacitor operates according to the algorithm of SC shown in Figure 7b.
If the value of 15-min power does not exceed the given trigger power PTR and if Li-ion battery is not fully charged, the algorithm controls the DC/DC converter of Li-ion module in such a way as to charge the battery taking power from supplying grid via rectifiers (1). C-rate of charging current should be adjusted to reduce both the aging effect and the risk of peak power repeat when the battery is not fully charged. The optimization of that C-rate parameter is not an issue of this article but could be an issue of future research/papers.
Figure 8a shows 15-min average power during 24-h operation with and without a hybrid energy storage system. Figure 8b depicts the instantaneous value of the hybrid energy storage elements during battery discharge. In the same figure the difference of the maximum 15-min power (ΔPAVR) is presented. It also can be noticed that during most of 24-h period the 15-min power is lower with ESS than without it. It is caused by the decrease of the energy consumption due to the excessive regenerative power stored in the supercapacitor. Only between 0:00 and 3:00 a.m. the power is of the same value because only freight trains not equipped with regenerative braking are operating at that time.
The parameters deciding about the effectiveness of the ESS operation and resulted cost savings are:
-
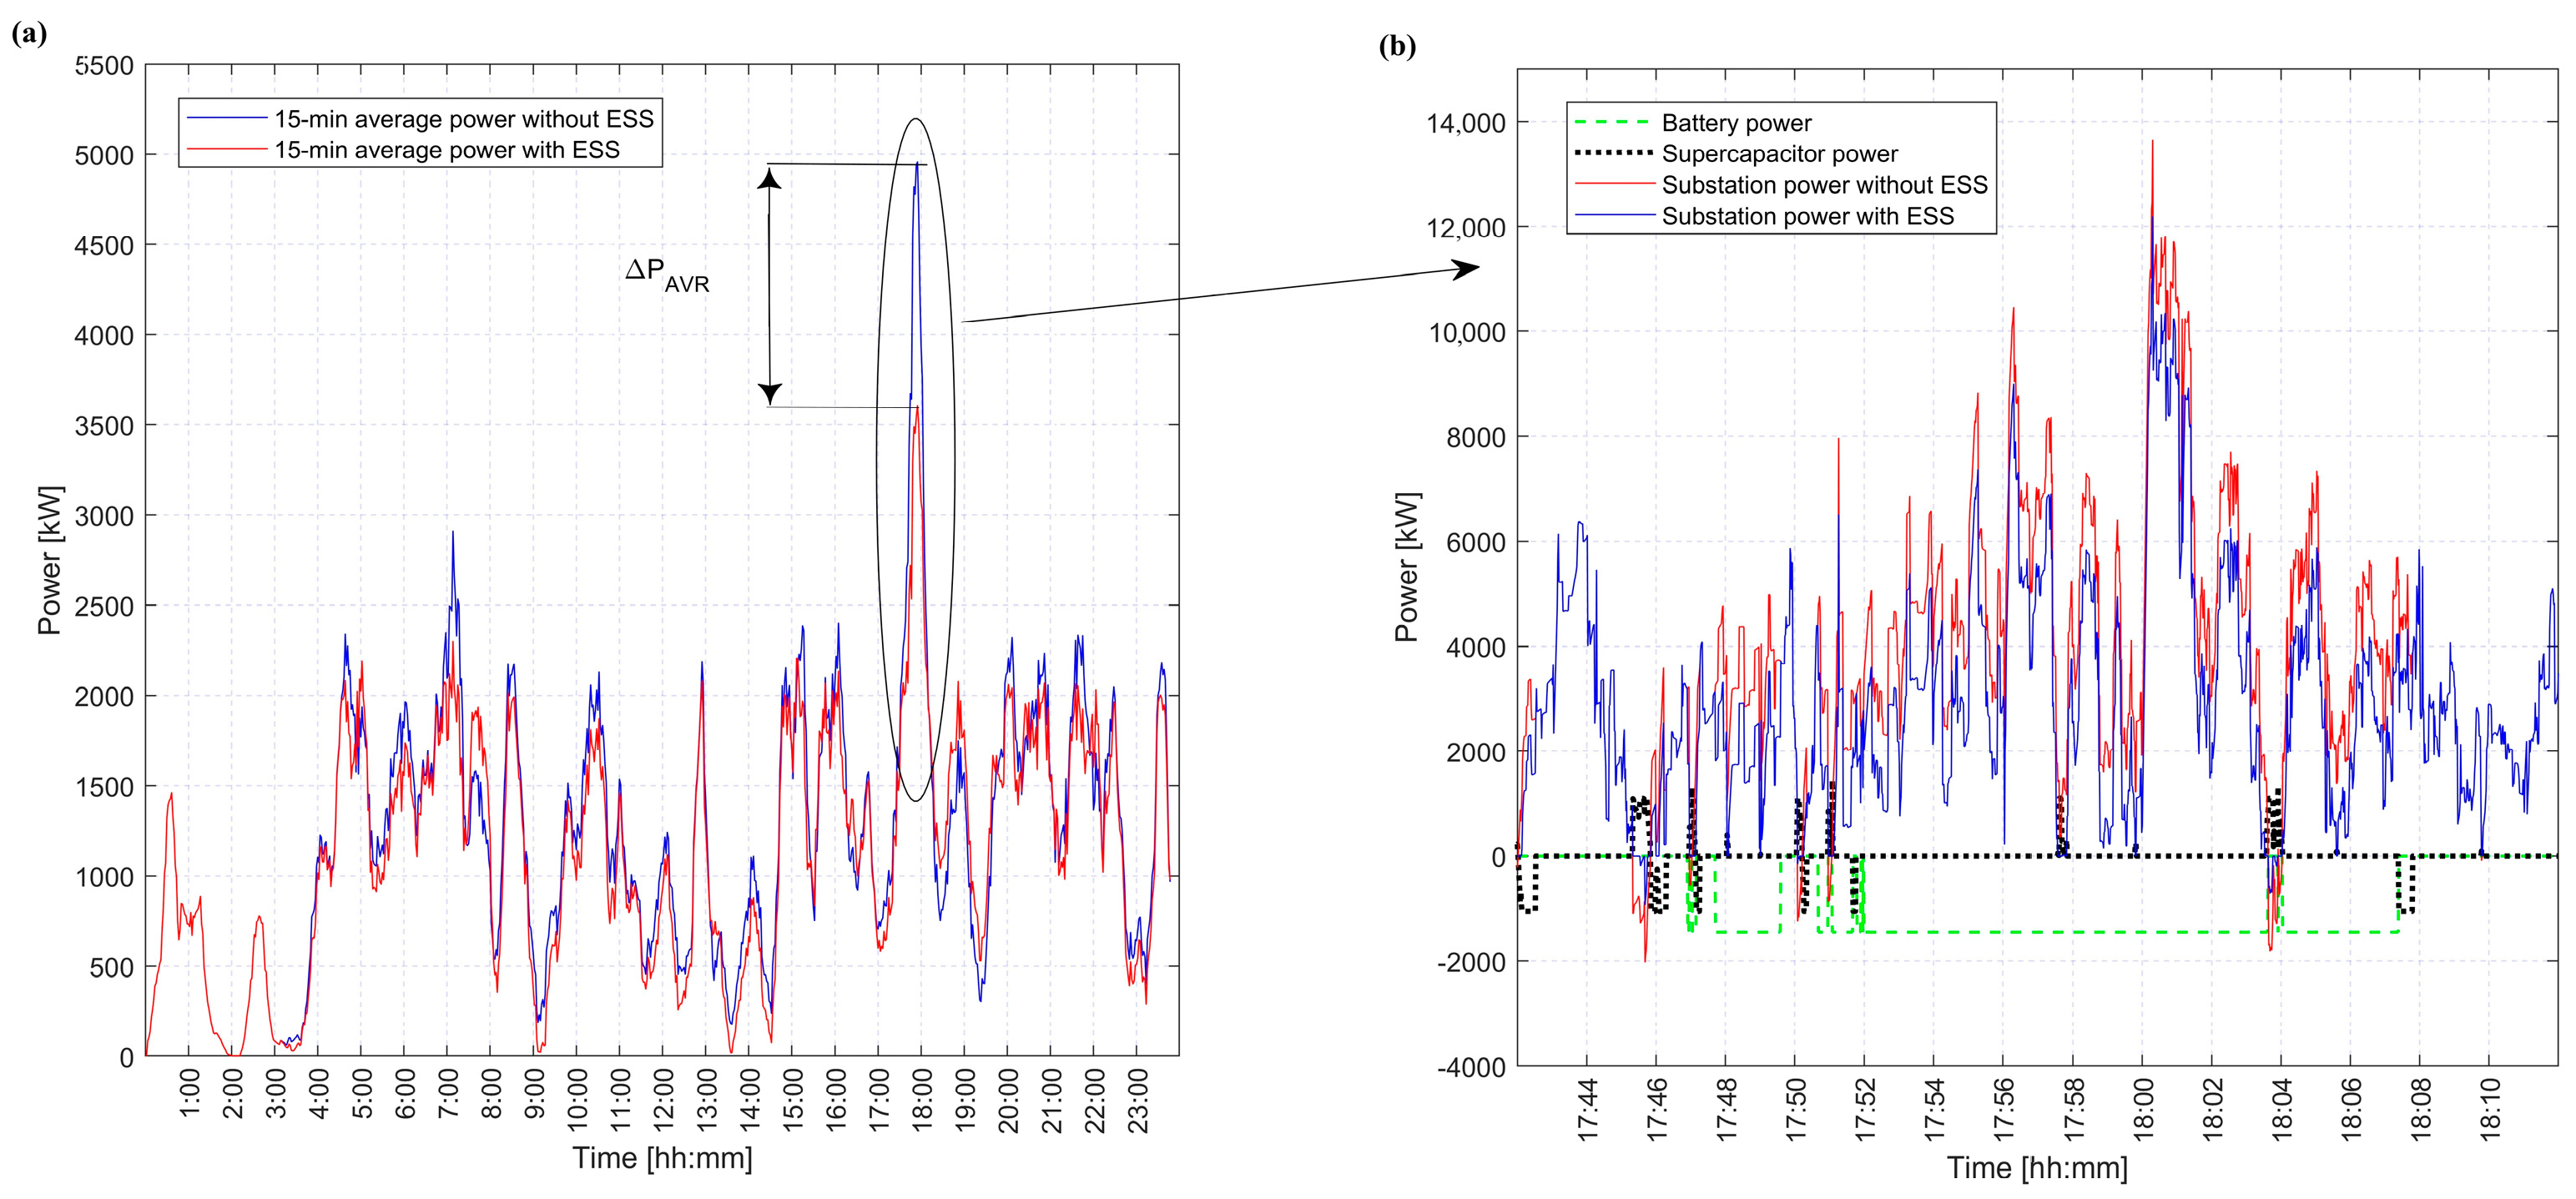
active energy saved by use of regenerative power (E24reg),
-
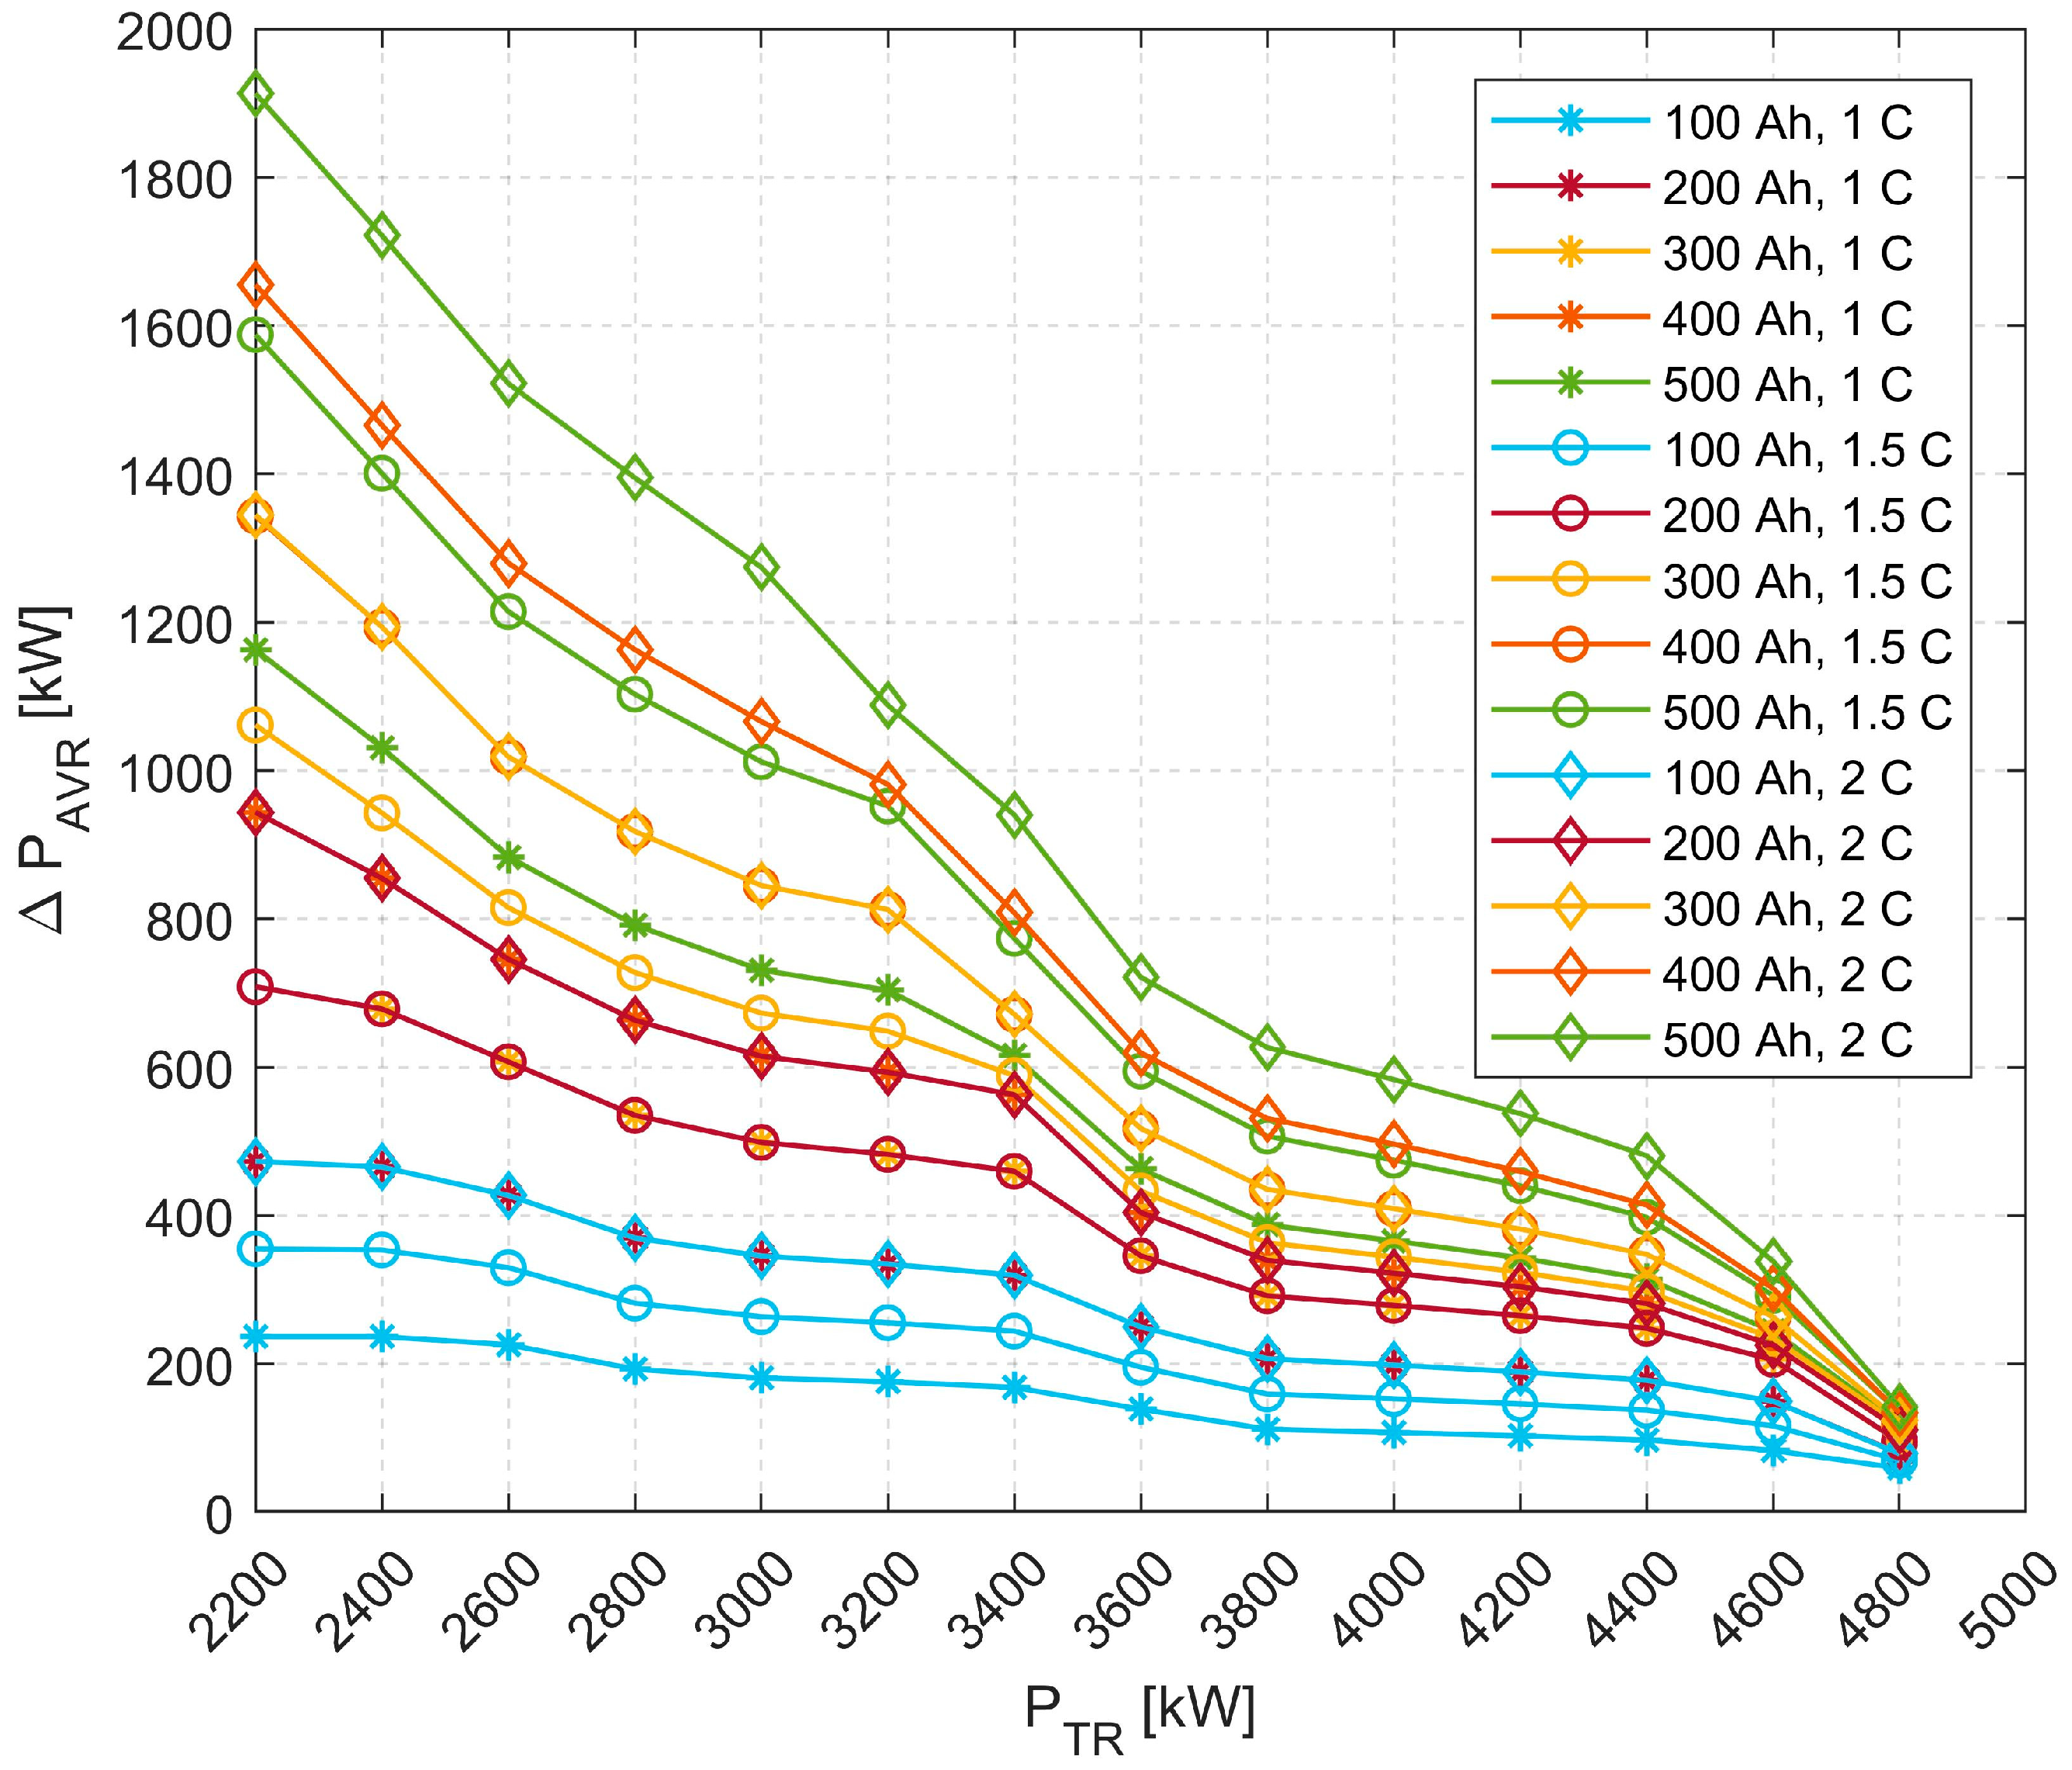
reduction of maximum 15-min power resulting from ESS operation (ΔPAVR).

5. Results and Discussion

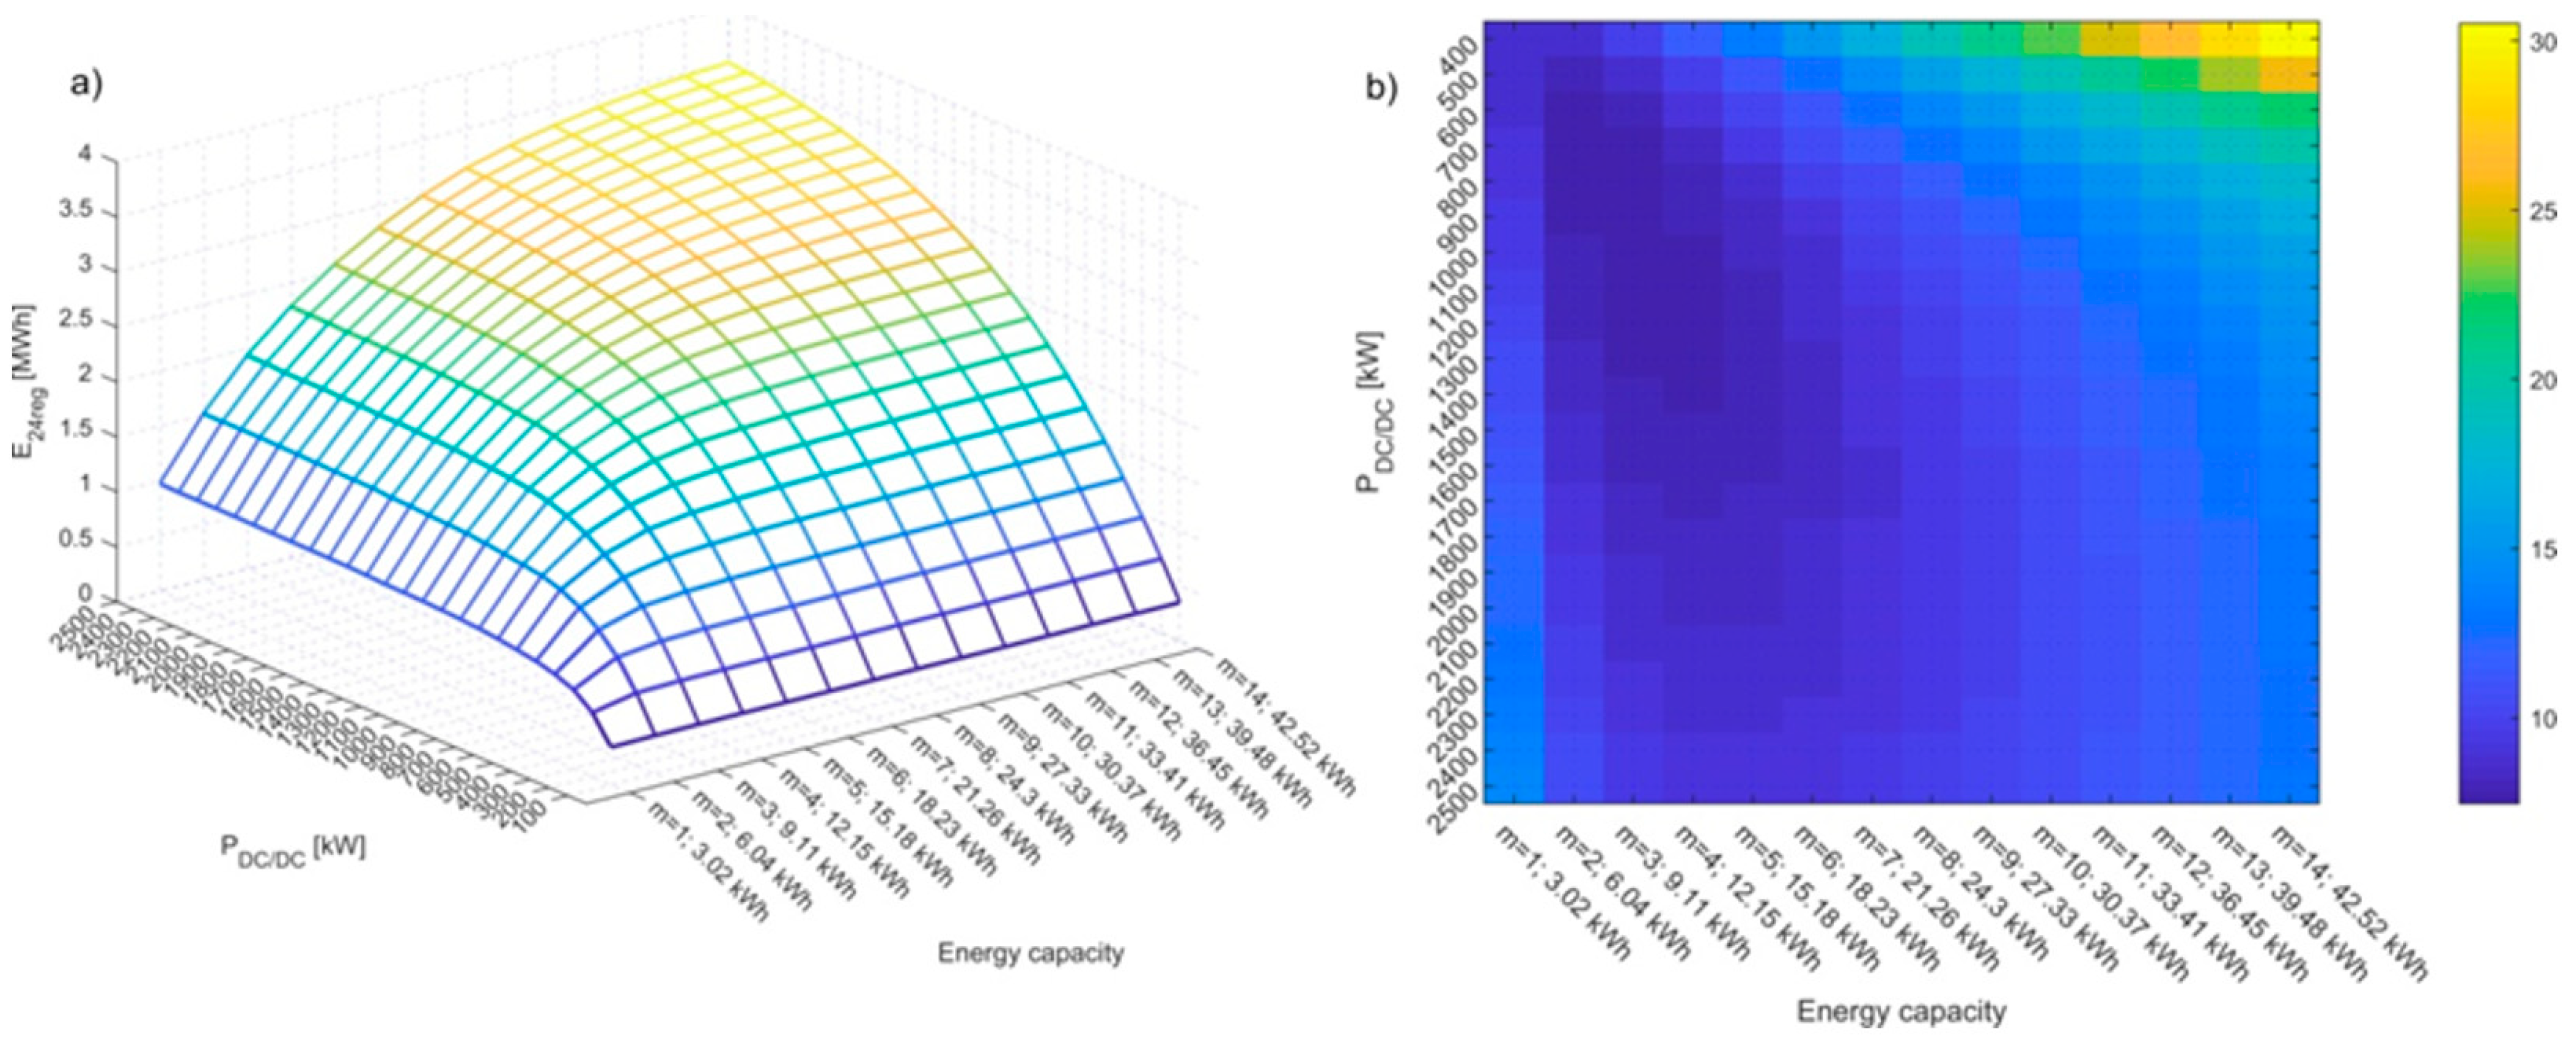
5.1. Supercapacitor Module

The main role of supercapacitor module is utilization of extensive regenerative energy of braking trains. The criteria of battery life cycle are not considered in the supercapacitor sizing process as there is no significant influence of the supercapacitor module parameter on the battery aging process. Investment payback period is the only criterion of the supercapacitor parameters sizing. The methodology of sizing was presented in [12]. The payback period is calculated according to Equation (5).
P P SC = C SC C F A
where CSC is the cost of supercapacitor module installation, calculated according to the cost model [26], acc. to Equation (6)
C SC = C DC / DC + c DC / DC P DC / DC + 1.4 m S C n S C c sc
whereas the annual savings resulting from the regenerative energy, calculated acc. to Equation (7),
C F A = 356 C e l E 24 r e g
The optimization variables of supercapacitor sizing process are power of DC/DC converter PDC/DC, numbers of cells connected in series (nsc) and number of cells connected in parallel (msc) in a supercapacitor pack. The number of cells connected in series is assumed to be 1000, giving the nominal voltage of the supercapacitor pack of 2700 V. The minimum state of charge is assumed to be 50% of the nominal voltage (1350 V). The issue of optimal level of minimum state of charge of supercapacitor pack is highlighted in [27]. The price parameters used in the Equations (5)–(7) are shown in Table 2. The supercapacitors of 3000 F capacitance and 2.7 Vare considered, the internal resistance (0.29 mΩ) is taken from the manufacturer’s data.
Figure 9a shows the energy recovered by ESS and Figure 9b presents the payback period. These two parameters are shown as the functions of DC/DC converter power and numbers of cell branches connected in parallel (energy capacitance). In this case study the payback period is minimum for mSC = 3 and PDC/DC = 900 kW and it is 7.46 years. However, as the diagram shows, the range of parameters where the values of payback period are close to the minimum is relatively extended within the range of parameters.

5.2. Li-Ion Battery Module

The initial calculations indicate that the optimal energy capacity of the supercapacitor module in terms of regenerative energy use is much too low to reduce the 15-min peak power demand. The usable energy capacity of the supercapacitor pack of the parameters of nSC = 1000, mSC = 3 and depth of discharge 50% is 6.83 kWh, while the energy capacity needed for 15-min peak power demand decrease by 1 MW is 250 kWh. Therefore, the Li-ion battery is needed for 15-min peak power demand due to its much lower ratio of energy capacity to price compared to supercapacitors.
As a Li-ion battery (part 2. in Figure 1) it is considered to use LFP Li-ion battery due to its appropriate parameters and relatively low cost [6]. However, the proposed procedure of parameters optimization of the energy storage system is appropriate for other Li-ion battery types potentially used in the considered application. The appropriate aging model should be used.
According to the proposed EMS, the trigger value PTR is the parameter determining the reduction of 15-min max. power (ΔPAVR). The degree of the peak power reduction determines the number of cycles and battery depth of discharge in each particular cycle of a battery operation. The number of discharges results from the annual number of each 15-min power presented in Figure 10. The maximum achievable value of peak power reduction ΔPAVR depends on the battery energy capacity and discharge rate. In Figure 10 there are also marked the values of 15-min peak power which could be avoided with the battery of 500 Ah capacity and different values of C-rates during discharge.
The relationship between trigger power PPT and degree of power reduction ΔPAVR is not linear, as it is shown in Figure 11.
As it has been mentioned above, the number of cycles and the DoD during each cycle depend on the value of 15-min peak power reduction (ΔPAVR). The higher s the value ΔPAVR, the bigger the number of battery cycles and depth of discharge of each cycle. According to the aging model of LFP battery [28], the life cycle depends on the total electric charge flowing through the battery cells (Ah), C-rate (C), and the temperature (T). The model formulated and validated based on the laboratory measurements [28] is commonly used by the number of researches. The loss of battery capacity is expressed by Arrhenius Equation [28], as shown by (Equation (8)),
Q l o s s = B exp 31700 + 370.3 × C R T A h 0.55
The total charge flowing through the battery Ah is the crucial variable of the aging model. For this reason, it is necessary to determine the single cell charge Qcell flowing during one discharge as the function peak power reduction ΔPAVR. The results of the single cell charge Qcell as the function of ΔPAVR for assumed battery capacity and C-rate are depicted in Figure 12.
Based on the single cell charge values shown in Figure 12 as the function of peak power reduction and the annual number of each peak power value occurrence, the total annual cell charge could be determined according to Equation (9).
A h = i = 1 k n p e a k k Q c e l l ( k )
The results of a total annual cell charge are shown in Figure 13. The results show that the increase of C-rate during discharge allows to obtain a higher reduction of peak power ΔPAVR, but it also leads to an increase of the cell annual charge Ah.
Based on the annual cell current Ah and the aging model (Equation (8)) the value of charge terminating the life cycle of the battery is determined. It is assumed that the battery life cycle is over after a 20% loss of the capacity or after 12 years of operation. Based on this information the annual operation cost has been proposed, defined as follows (Equation (10)).
C O P = C DC / DC + c DC / DC P DC / DC 15 + C L F P 12 , t L F P > 12 C L F P t L F P , t L F P < = 12
where tLFP is an expected time of battery life cycle resulting from the aging model (Equation (8)). For the low values of an expected annual charge Ah, tLFP reaches the values significantly exceeding the time duration given by the manufacturers. The first part of sum expression (Equation (10)) presents the value of the DC/DC converter annual operation cost. It is assumed that the life cycle of the converter is 15 years. The power of DC/DC converter assumed in (Equation (10)) is adjusted to the maximum C-rate during the battery discharge. The cost of LFP battery pack is determined according to (Equation (11)), the model is taken from [29]:
C L F P = 1.24 m L F P n L F P c LFP
The annual cost savings resulting from the reduction of peak power demand are expressed according to (Equation (12))
C Δ P = Δ P A V R c p o w e r
where cpower is the price of the demanded power expressed in ($/MW·year). For each variant of the battery parameters the ratio between annual cost savings and annual operation cost is proposed to be determined by profitability index—α (Equation (13))
α = C Δ P C L F P
The solution is assumed to be profitable if the index value α > 1. The price parameters of the battery module are shown in Table 3. The LFP cells of 100 Ah have been assumed, the price has been taken from the manufacturer’s data.
The values of profitability index α for the various parameters of energy capacity and C-rate are presented in Figure 14 where the parameters of the most profitable solution could be found.
The results of the α-index in Figure 14 are presented as the function of the ΔPAVR. It provides the information on the profitability of the demand power reduction. For the adaptation of the EMS for the selected battery parameters, the exact value of the trigger power PTR should be found and implemented. Having the values of the ΔPAVR and battery parameters corresponding to the most favorable solutions in Figure 14, the corresponding values of the trigger power PTR could be found in Figure 11.
The separate modules of ESS system such as a supercapacitor and a battery could operate separately. The optimization method of the supercapacitor module dedicated to regenerative energy use is described in Section 5.1, and the EMS is shown in Figure 9. The battery module could operate separately for the purpose of 15-min peak power demand. Assuming only peak power reduction purpose of the battery operation, the influence of a supercapacitor on the total LFP battery peak current reduction is minimal, therefore the battery life cycle is approximately the same in case with and without supercapacitor module.
Moreover, the investigation of battery module implementation for only regenerative energy use instead of the supercapacitor module has been investigated. The results have shown that the 24-h single LFP cell charge Qcell in that case is 970 Ah. In these conditions the number of cycles is around 350 per 24 h. The battery operates in a narrow range of SoC (around 12%) but the average daily operation time is 8 h and 20 min. According to the aging model the duration of the life cycle for that condition of battery operation and assuming discharge of rate 2 C is between 3 and 5 years.
The cost of each module of hybrid ESS as well as the annual savings and payback period of each element and the total payback period of hybrid ESS are depicted in Table 4.

6. Conclusions

This paper presents the concept of a trackside hybrid energy storage system dedicated to regenerative energy usage and peak power demand reduction. The dedicated EMS is developed for hybrid ESS. The novel method of the battery module sizing of hybrid energy storage system is proposed. This method is based on the historical data of the 15-min average power (or half-hour power) of traction substation during last year. The energy capacity, C-rate during discharge and the threshold power PTR of energy management strategy are calculated in order to obtain the maximum index value α based on the expected frequency of 15-min peak power values.
Meanwhile, the sizing method of the supercapacitor module is based on the known methods assuming simulation results of 24-h power profile of traction substation including the regenerative power available resulting from catenary receptivity limitation. The simulation model has been validated based on the comparison with the 15-min power measurements.
For the average peak power, the 15-min degree of averaging has been used as it is a standard in Polish power energy law. In most countries in energy tariffs half-hourly power value is used to measure the peak demand. The presented EMS and the method of battery sizing are appropriate for all degrees of averaging. The longer the period of power averaging, the bigger the energy capacity of battery ESS.
The case study based on the presented assumptions shows that the supercapacitor module of ESS dedicated to regenerative power utilization is more profitable than the battery module for the peak power demand. The battery unit with the optimum parameters is around 16% cheaper than the supercapacitor module. However, the savings resulting from the battery unit operation are around 40% lower than from using the supercapacitor module. The total payback period for the whole ESS is 8.4 years.
If the permanent increase of energy cost for transport in Poland with the shocking increase in 2022 is considered, the effectiveness of ESS application in traction system will be much higher. The annual amount of energy consumption by railways for traction purposes is about 2,400,000 MWh. So, only 10% reduction of traction energy consumption makes 240,000 MWh. It gives CO2 reduction of roughly 154,565 t (due to fact that most electrical energy generated in Poland is in coal power plants and the emission in 2024 is estimated to be 178.9 gCO2eq/MJ, i.e., 644.04 kg CO2/MWh [30]. The extra added income of 9.8 mln euro because of the European Emission subsidies (16 December 2024 it was 63.32 euro/t of CO2 [31]) would again boost effectiveness of ESS installation.
Each module of the proposed hybrid ESS could operate in an autonomous way. The influence of supercapacitors on the battery life cycle is minimal. Therefore, the schedule of any kind of installation is flexible. So, at the beginning only a supercapacitor or a battery module could be installed and operate separately while the second module could be installed in a further future.

Author Contributions

Conceptualization: A.S. and W.J.; methodology: A.S., W.J. and T.M.; validation: A.N. and M.W.; formal analysis: M.L. and M.W.; investigation: W.J. and T.M.; resources: W.J.; writing—original draft preparation: W.J.; writing—review and editing: A.S. and A.N.; visualization: W.J. and A.N. All authors have read and agreed to the published version of the manuscript.

Funding

This research received no external funding.

Data Availability Statement

The raw data supporting the conclusions of this article will be made available by the authors on request.

Conflicts of Interest

All authors declare that they have no conflicts of interest.

Abbreviations

The following abbreviations are used in this manuscript:
Ahtotal charge flowing through the battery (Ah)
Bpre-exponential factor
Crate of battery discharge
CDC/DCconstant cost of DC/DC converter manufacturing and installation ($)
cDC/DCunit cost of DC/DC converter manufacturing and installation ($/kW)
Celunit price of active electric energy ($/MWh)
CFAannual savings resulting from regenerative energy use by supercapacitor module of ESS ($)
CLFPcost of LFP battery pack ($)
cLFPprice of single LFP battery cell
COPannual operation cost of LFP module ($)
cpowerunit price of demand power ($/MW·year)
CSCcost of supercapacitor module installation ($)
cSCprice of single supercapacitor cell
CΔPannual savings resulting from peak power reduction ($)
DoDdepth of discharge
E24regenergy returned by SC module during 24-h operation (MWh)
EMSaverage 24-h energy consumption during the preceding year (MWh)
inumber of 15-min period during 24-h cycle ({1:96})
mLFPnumber of LFP battery cells connected in parallel
mSCnumber of supercapacitors cells connected in parallel
nnumber of 24-h periods during the preceding year ({1:365})
nLFPnumber of LFP battery cells connected in series
npeaknumber of 15-min power measured values during 1-year registration
nSCnumber of supercapacitors cells connected in series
pinstantaneous power (W)
P1515-min measured power (W)
P15MS15-min measured power for the15-min period in 24-h cycle as an average of the measured values in ti 15-min periods during the preceding year (W)
P15Sim15-min power obtained by the simulation (W)
PAVRaverage 15-min power calculated as an rolling average (W)
PLFPinstantaneous power of LFP battery part of the ESS in connection to 3 kV DC (W)
PLFPmaxmaximum power of PLFP assumed in EMS of ESS(W)
PPSCpayback period of supercapacitor module installation (years)
PSCinstantaneous power of supercapacitor part of the ESS in connection to 3 kV DC (W)
PSCmaxmaximum power of PSC assumed in EMS of ESS (W)
PTRthreshold value of the average rolling power (W)
PTSpower on a busbar of a traction substation (W)
QcellLFP battery single cell charge during single discharge (Ah)
Qlossloss of battery capacity (%)
Rgas constant
SoCstate of charge
Ttemperature
tLFPduration in time of LFP battery life cycle
TSStraction substation
USCstate of charge of supercapacitor pack (V)
USCtrthreshold state of charge of supercapacitor pack assumed in EMS of ESS (V)
αprofitability index of the battery module installation
ΔPAVRdifference of peak 15-min power of traction substation between the cases with and without ESS
DNODistribution Grid Operator
DoDDepth of Discharge
EMSEnergy Management Strategy
ESSEnergy Storage System
LFPLiFePO4 battery
SCSupercapacitor
SoCState of Charge
TETractive Effort

References

  1. Van Daalen, K.R.; Tonne, C.; Semenza, J.C.; Rocklöv, J.; Markandya, A.; Dasandi, N.; Jankin, S.; Achebak, H.; Ballester, J.; Bechara, H.; et al. The 2024 Europe report of the Lancet Countdown on health and climate change: Unprecedented warming demands unprecedented action. Lancet Public Health 2024, 9, e495–e522. [Google Scholar] [CrossRef]
  2. Douglas, H.; Roberts, C.; Hillmansen, S.; Schmid, F. An assessment of available measures to reduce traction energy use in railway networks. Energy Convers. Manag. 2015, 106, 1149–1165. [Google Scholar] [CrossRef]
  3. Yuan, J.; Peng, L.; Zhou, H.; Gan, D.; Qu, K. Recent research progress and application of energy storage system in electrified railway. Electr. Power Syst. Res. 2024, 226, 109893. [Google Scholar] [CrossRef]
  4. Domínguez, M.; Fernández-Cardador, A.; Fernández-Rodríguez, A.; Cucala, A.; Pecharromán, R.; Sánchez, P.U.; Cortázar, I.V. Review on the use of energy storage systems in railway applications. Renew. Sustain. Energy Rev. 2024, 207, 114904. [Google Scholar] [CrossRef]
  5. Suzuki, T. DC power-supply system with inverting substations for traction systems using regenerative brakes. IEE Proc. B Electr. Power Appl. 1982, 129, 18–26. [Google Scholar] [CrossRef]
  6. Aneke, M.; Wang, M. Energy storage technologies and real life applications—A state of the art review. Appl. Energy 2016, 179, 350–377. [Google Scholar] [CrossRef]
  7. Uddin, M.; Romlie, M.F.; Abdullah, M.F.; Halim, S.A.; Kwang, T.C. A review on peak load shaving strategies. Renew. Sustain. Energy Rev. 2018, 82, 3323–3332. [Google Scholar] [CrossRef]
  8. Jefimowski, W.; Nikitenko, A. Case study of stationary energy storage device in a 3 kV DC traction system. In Proceedings of the 13th International Conference Modern Electrified Transport—MET, Warsaw, Poland, 5–7 October 2017; pp. 1–6. [Google Scholar] [CrossRef]
  9. Iannuzzi, D.; Ciccarelli, F.; Lauria, D. Stationary ultracapacitors storage device for improving energy saving and voltage profile of light transportation networks. Transp. Res. Part C Emerg. Technol. 2012, 21, 321–337. [Google Scholar] [CrossRef]
  10. Barrero, R.; Tackoen, X.; Van Mierlo, J. Analysis and configuration of supercapacitor based energy storage system on-board light rail vehicles. In Proceedings of the 13th International Power Electronics and Motion Control Conference, Poznan, Poland, 1–3 September 2008; pp. 1512–1517. [Google Scholar]
  11. Kashani, S.J.; Farjah, E. Applying Neural Network and Genetic Algorithm for Optimal Placement of Ultra-Capacitors in Metro Systems. In Proceedings of the 2011 IEEE Electrical Power and Energy Conference, Winnipeg, MB, Canada, 3–5 October 2011; pp. 35–40. [Google Scholar]
  12. Sirmelis, U.; Zakis, J.; Grigans, L. Optimal supercapacitor energy storage system sizing for traction substations. In Proceedings of the 2015 IEEE 5th International Conference on Power Engineering, Energy and Electrical Drives (POWERENG), Riga, Latvia 11–13 May 2015; pp. 592–595. [Google Scholar]
  13. Chua, K.H.; Lim, Y.S.; Morris, S. A novel fuzzy control algorithm for reducing the peak demands using energy storage system. Energy 2017, 122, 265–273. [Google Scholar] [CrossRef]
  14. Fossati, J.P.; Galarza, A.; Martín-Villate, A.; Fontán, L. A method for optimal sizing energy storage systems for microgrids. Renew. Energy 2015, 77, 539–549. [Google Scholar] [CrossRef]
  15. Jarnut, M.; Kaniewski, J.; Protasiuk, V. Energy Storage System for Peak Power Reduction of Traction Substation. In Proceedings of the 2018 Innovative Materials and Technologies in Electrical Engineering (i-MITEL), Sulecin, Poland, 18–20 April 2018; pp. 1–5. [Google Scholar]
  16. Ovalle, A.; Pouget, J.; Bacha, S.; Gerbaud, L.; Vinot, E.; Sonier, B. Energy storage sizing methodology for mass-transit direct-current wayside support: Application to French railway company case study. Appl. Energy 2018, 230, 1673–1684. [Google Scholar] [CrossRef]
  17. Graber, G.; Calderaro, V.; Galdi, V.; Piccolo, A.; Lamedica, R.; Ruvio, A. Techno-economic sizing of auxiliary-battery-based substations in DC railway systems. IEEE Trans. Transp. Electrif. 2018, 4, 616–625. [Google Scholar] [CrossRef]
  18. Pankovits, P.; Pouget, J.; Robyns, B.; Delhaye, F.; Brisset, S. Towards railway-smartgrid: Energy management optimization for hybrid railway power substations. In Proceedings of the 2014 IEEE PES Innovative Smart Grid Technologies Conference Europe (ISGT-Europe), Istanbul, Turkey, 12–15 October 2014; pp. 1–6. [Google Scholar]
  19. Ciccarelli, F.; Iannuzzi, D.; Lauria, D.; Natale, P. Optimal Control of Stationary Lithium-Ion Capacitor-Based Storage Device for Light Electrical Transportation Network. IEEE Trans. Transp. Electrif. 2017, 3, 618–631. [Google Scholar] [CrossRef]
  20. Zheng, C.; Wei, S.; Wang, Z.; Liu, S.; Yuan, Y. Research and implementation on hybrid energy storage system experimental platform of rail transit. Energy Procedia 2017, 105, 3603–3608. [Google Scholar] [CrossRef]
  21. Li, G.; Or, S.W. Multi-agent deep reinforcement learning-based multi-time scale energy management of urban rail traction networks with distributed photovoltaic–regenerative braking hybrid energy storage systems. J. Clean. Prod. 2024, 466, 142842. [Google Scholar] [CrossRef]
  22. Wieczorek, M.; Lewandowski, M. A mathematical representation of an energy management strategy for hybrid energy storage system in electric vehicle and real time optimization using a genetic algorithm. Appl. Energy 2017, 192, 222–233. [Google Scholar] [CrossRef]
  23. Zheng, S.; Teh, J.; Alharbi, B.; Lai, C.-M. A review of equivalent-circuit model, degradation characteristics and economics of Li-ion battery energy storage system for grid applications. J. Energy Storage 2024, 101, 113908. [Google Scholar] [CrossRef]
  24. Grimaldi, A.; Minuto, F.D.; Perol, A.; Casagrande, S.; Lanzini, A. Ageing and energy performance analysis of a utility-scale lithium-ion battery for power grid applications through a data-driven empirical modelling approach. J. Energy Storage 2023, 65, 107232. [Google Scholar] [CrossRef]
  25. Koltermann, L.; Cortés, M.C.; Figgener, J.; Zurmühlen, S.; Sauer, D.U. Improved rule-based power distribution algorithm for hybrid battery storage systems and real-world validation. J. Energy Storage 2024, 86, 111360. [Google Scholar] [CrossRef]
  26. Jefimowski, W.; Szeląg, A. The multi-criteria optimization method for implementation of a regenerative inverter in a 3 kV DC traction system. Electr. Power Syst. Res. 2018, 161, 61–73. [Google Scholar] [CrossRef]
  27. Jefimowski, W.; Nikitenko, A.; Drążek, Z.; Wieczorek, M. Stationary supercapacitor energy storage operation algorithm based on neural network learning system. Bull. Pol. Acad. Sci. Technol. Sci. 2020, 68, 733–738. [Google Scholar] [CrossRef]
  28. Wang, J.; Liu, P.; Hicks-Garner, J.; Sherman, E.; Soukiazian, S.; Verbrugge, M.; Tataria, H.; Musser, J.; Finamore, P. Cycle-life model for graphite-LiFePO4 cells. J. Power Sources 2011, 196, 3942–3948. [Google Scholar] [CrossRef]
  29. The Boston Consulting Group Inc. Focus Batteries for Electric Cars: Challenges, Opportunities, and the Outlook to 2020. 2010. Available online: https://gerpisa.org/en/system/files/file36615.pdf (accessed on 27 December 2024).
  30. Regulation of The Minister of Climate and Environment of 26 October 2023 on the greenhouse gas emission factor for electricity in 2024. J. Laws Repub. Pol. 2370 2023. Available online: https://eli.gov.pl/eli/DU/2023/2370/ogl (accessed on 27 December 2024).
  31. Available online: https://www.statista.com/statistics/1322214/carbon-prices-european-union-emission-trading-scheme/ (accessed on 17 December 2024).
Figure 1. General scheme of the hybrid energy storage system connection to DC busbar of traction substation, 1—a supercapacitor module; 2—a Li-ion battery module.
Electronics 14 01752 g001
Figure 2. The flowchart of the proposed energy storage sizing method.
Electronics 14 01752 g002
Figure 3. The electrical scheme of analyzed traction power supply system.
Electronics 14 01752 g003
Figure 4. Traction characteristics and the traction current assuming the nominal pantograph voltage 3 kV of the rolling stock under consideration.
Electronics 14 01752 g004
Figure 5. Train timetable in 24-h cycle modelled in the simulation model with traffic damming around 6 p.m. near to Station 8 marked with red circle, (a)—00:00–08:00, (b)—08:00–16:00, (c)—16:00–24:00.
Electronics 14 01752 g005
Figure 6. (a) The comparison of 15-min average power obtained by measurements and simulation; (b) correlation diagram of 15-min average power obtained by measurements and simulation.
Electronics 14 01752 g006
Figure 7. The flowchart of energy management strategy; (a) general algorithm of hybrid ESS operation; (b) algorithm of supercapacitor module operation.
Electronics 14 01752 g007
Figure 8. (a) transients of 15-min RMS substation power during 24-h cycle operation with and without hybrid ESS (ΔPAVR—value of the difference of the maximum 15-min average power); (b) values of hybrid ESS elements instantaneous power trigger power exceeding.
Electronics 14 01752 g008
Figure 9. (a) 24-h energy recovered by ESS; (b) diagram of payback period values, both as a function of installed power of DC/DC converter and supercapacitor pack energy capacity.
Electronics 14 01752 g009
Figure 10. Histogram of 15-min power during one year of measurement peak.
Electronics 14 01752 g010
Figure 11. The relationship between value of trigger power PTR and the reduction of the peak power demand ΔPAVR.
Electronics 14 01752 g011
Figure 12. Single battery cell charge flowing during discharge as the function of 15-min peak power reduction (ΔPAVR) for different battery capacity and discharge C-rate.
Electronics 14 01752 g012
Figure 13. Total annual cell charge flowing through the single battery cell as a function of 15-min peak power reduction (ΔPAVR) for different battery capacity and discharge C-rate.
Electronics 14 01752 g013
Figure 14. The values of α coefficient as a function of difference of 15-min peak power (ΔPAVR) for different battery capacity and discharge C-rate (a)—battery discharge rate—1 C, (b)—battery discharge rate—1.5 C, (c)—battery discharge rate—2 C.
Electronics 14 01752 g014
Table 1. Rolling stock parameters used in the case study.
Type 1 (Electric Multiple Unit)Type 2 (Passenger Carriage Train 1)Type 3 (Passenger Carriage Train 2)Type 3 (Freight Train)
Mass (t)2803304301300
Auxiliary power (kW)2 × 7615016030
a0, a1, a2—coefficients in Davis equation of rolling resistance
a03.924.563.5617.21
a100.2510.251.1
a20.010.004460.00160.026
Efficiency90%90%90%90%
Table 2. The price parameters used in supercapacitor module sizing optimization procedure.
ParameterValue
CDC/DC102,000 ($)
cDC/DC102 ($/kW)
cSC55 ($)
Cel87.4 ($/MWh)
Table 3. The price parameters of LFP battery module used in optimization procedure.
ParameterValue
cpower38,273 ($/year)
cLFP110 ($)
Cel87.4 ($/MWh)
Table 4. Costs, savings and payback period values for each ESS module operating separately and together as hybrid ESS.
Cost of SC ($)Cost of LFP ($)Saving Resulting from SC Operation ($/Year)Saving Resulting from LFP Operation ($/Year)
425,364357,81859,97036,124
Payback period of SC (years)Payback period of LFP (years)
7.469.9
Total payback period (years)
8.41
Disclaimer/Publisher’s Note: The statements, opinions and data contained in all publications are solely those of the individual author(s) and contributor(s) and not of MDPI and/or the editor(s). MDPI and/or the editor(s) disclaim responsibility for any injury to people or property resulting from any ideas, methods, instructions or products referred to in the content.

