1. Introduction
Magnetic gears (MGs) have established as transformative transmission components in renewable energy applications, playing pivotal roles in wind power generation [
1], electric vehicle powertrains [
2], and wave energy conversion systems [
3]. The non-contact operational principle fundamentally eliminates mechanical wear, significantly reduces maintenance demands, and provides intrinsic overload protection while maintaining favorable acoustic noise properties [
4]. The groundbreaking work by Atallah and Howe [
5] laid the theoretical foundation for coaxial magnetic gears (CMGs), establishing the principles of torque transmission through space harmonic modulation. Subsequent research endeavors have concentrated on addressing the fundamental compromise between torque density and operational stability [
6].
Prior research in magnetic gear optimization can be systematically categorized into distinct methodological classes, each with specific advantages and limitations. Topological innovations form one key area: Jian and Chau [
7] integrated Halbach arrays to enhance torque density by 28%, while Zhang et al. [
8] pioneered dual-flux-modulator designs achieving 22% higher torque transmission. Specialized configurations like planetary magnetic gears [
9] and sandwiched armatures [
10] have further addressed specific application needs.
In terms of optimization methodologies, sensitivity-driven approaches represent one class: Jing et al. [
11] achieved 31% torque ripple reduction, demonstrating effectiveness in local design refinement, yet such methods often rely on local derivatives and may miss global parameter interactions.
Surrogate-assisted optimization frameworks constitute a second major class, aimed at balancing accuracy and computational cost. Zhang et al. [
12] integrated Kriging models with NSGA-II, significantly reducing computational cost by approximately 60% compared to conventional single stage optimizatsion methods. Shoaei et al. [
13], Wang et al. [
14], and Jing et al. [
15] have further advanced surrogate-based methods for various magnetic gear topologies. Zhu et al. [
16] achieved 70% computational expense reduction via adaptive response surface methodology. While these frameworks significantly improve efficiency, the accuracy remains dependent on surrogate model quality and may oversimplify complex parameter interactions.
Evolutionary multi-objective algorithms form a third class, specializing in Pareto frontier exploration for complex design spaces. NSGA-III [
17] and reference-point-based sorting techniques [
18] have become standards for multi-objective problems. Recent developments also include asymmetric PM configurations [
19] and differential evolution strategies [
20]. A key limitation of these algorithms, however, is the typical treatment of all parameters uniformly within high-dimensional spaces, disregarding physical significance and sensitivity variations.
This comparative analysis reveals that while significant progress has been made across topological and methodological domains, optimization approaches remain constrained by fundamental limitations in systematically handling parameter interactions, computational complexity, and sensitivity-driven decomposition—limitations that the proposed framework aims to address. Nevertheless, these approaches exhibit three fundamental limitations that constitute the specific research gap addressed in this work: (1) conventional sensitivity analysis predominantly relies on local derivatives or one-at-a-time methodologies that fail to adequately capture global parameter interactions across the design space; (2) parameter classification for decomposition strategies remains predominantly heuristic, lacking a rigorous quantitative foundation; and (3) optimization processes typically treat all parameters uniformly within a high-dimensional space, disregarding the distinct physical significance and coupling features, which compromises computational efficiency.
Addressing these critical challenges, this investigation introduces a novel SGTSO framework with two principal methodological innovations that fundamentally advance the state of the art. First, it adopts a global Sobol sensitivity analysis, which transcends conventional local techniques by delivering a thorough, variance-based evaluation that systematically decomposes output variance into individual and interactive parameter contributions. This provides a rigorous, quantitative foundation for parameter screening. Second, it establishes a mathematically grounded two-stage optimization architecture, which is rigorously proven to converge to near-optimal solutions under weak coupling assumptions, with derived error bounds formalized as . This replaces heuristic decomposition with a strategy offering mathematical convergence assurance.
The proposed framework synthesizes these innovations into a coherent methodology comprising systematic parameter classification utilizing Sobol indices, sequential optimization prioritizing high-sensitivity parameters (, , ) followed by low-sensitivity parameters (, ), and an integrated LHS–FEA–Kriging–NSGA–II computational workflow. This work demonstrates a comprehensive optimization framework that integrates globally validated sensitivity analysis with mathematically assured decomposition to significantly improve both electromagnetic performance and computational efficiency in magnetic gear design. The proposed approach achieves substantial performance gains, including 65.4% suppression of inner rotor torque ripple, 27.2% reduction in outer rotor torque ripple, and 19.2% decrease in permanent magnet usage, while maintaining average torque output with only a minimal 4.03% reduction.
2. Structural Configuration and Parametric Modeling of MG
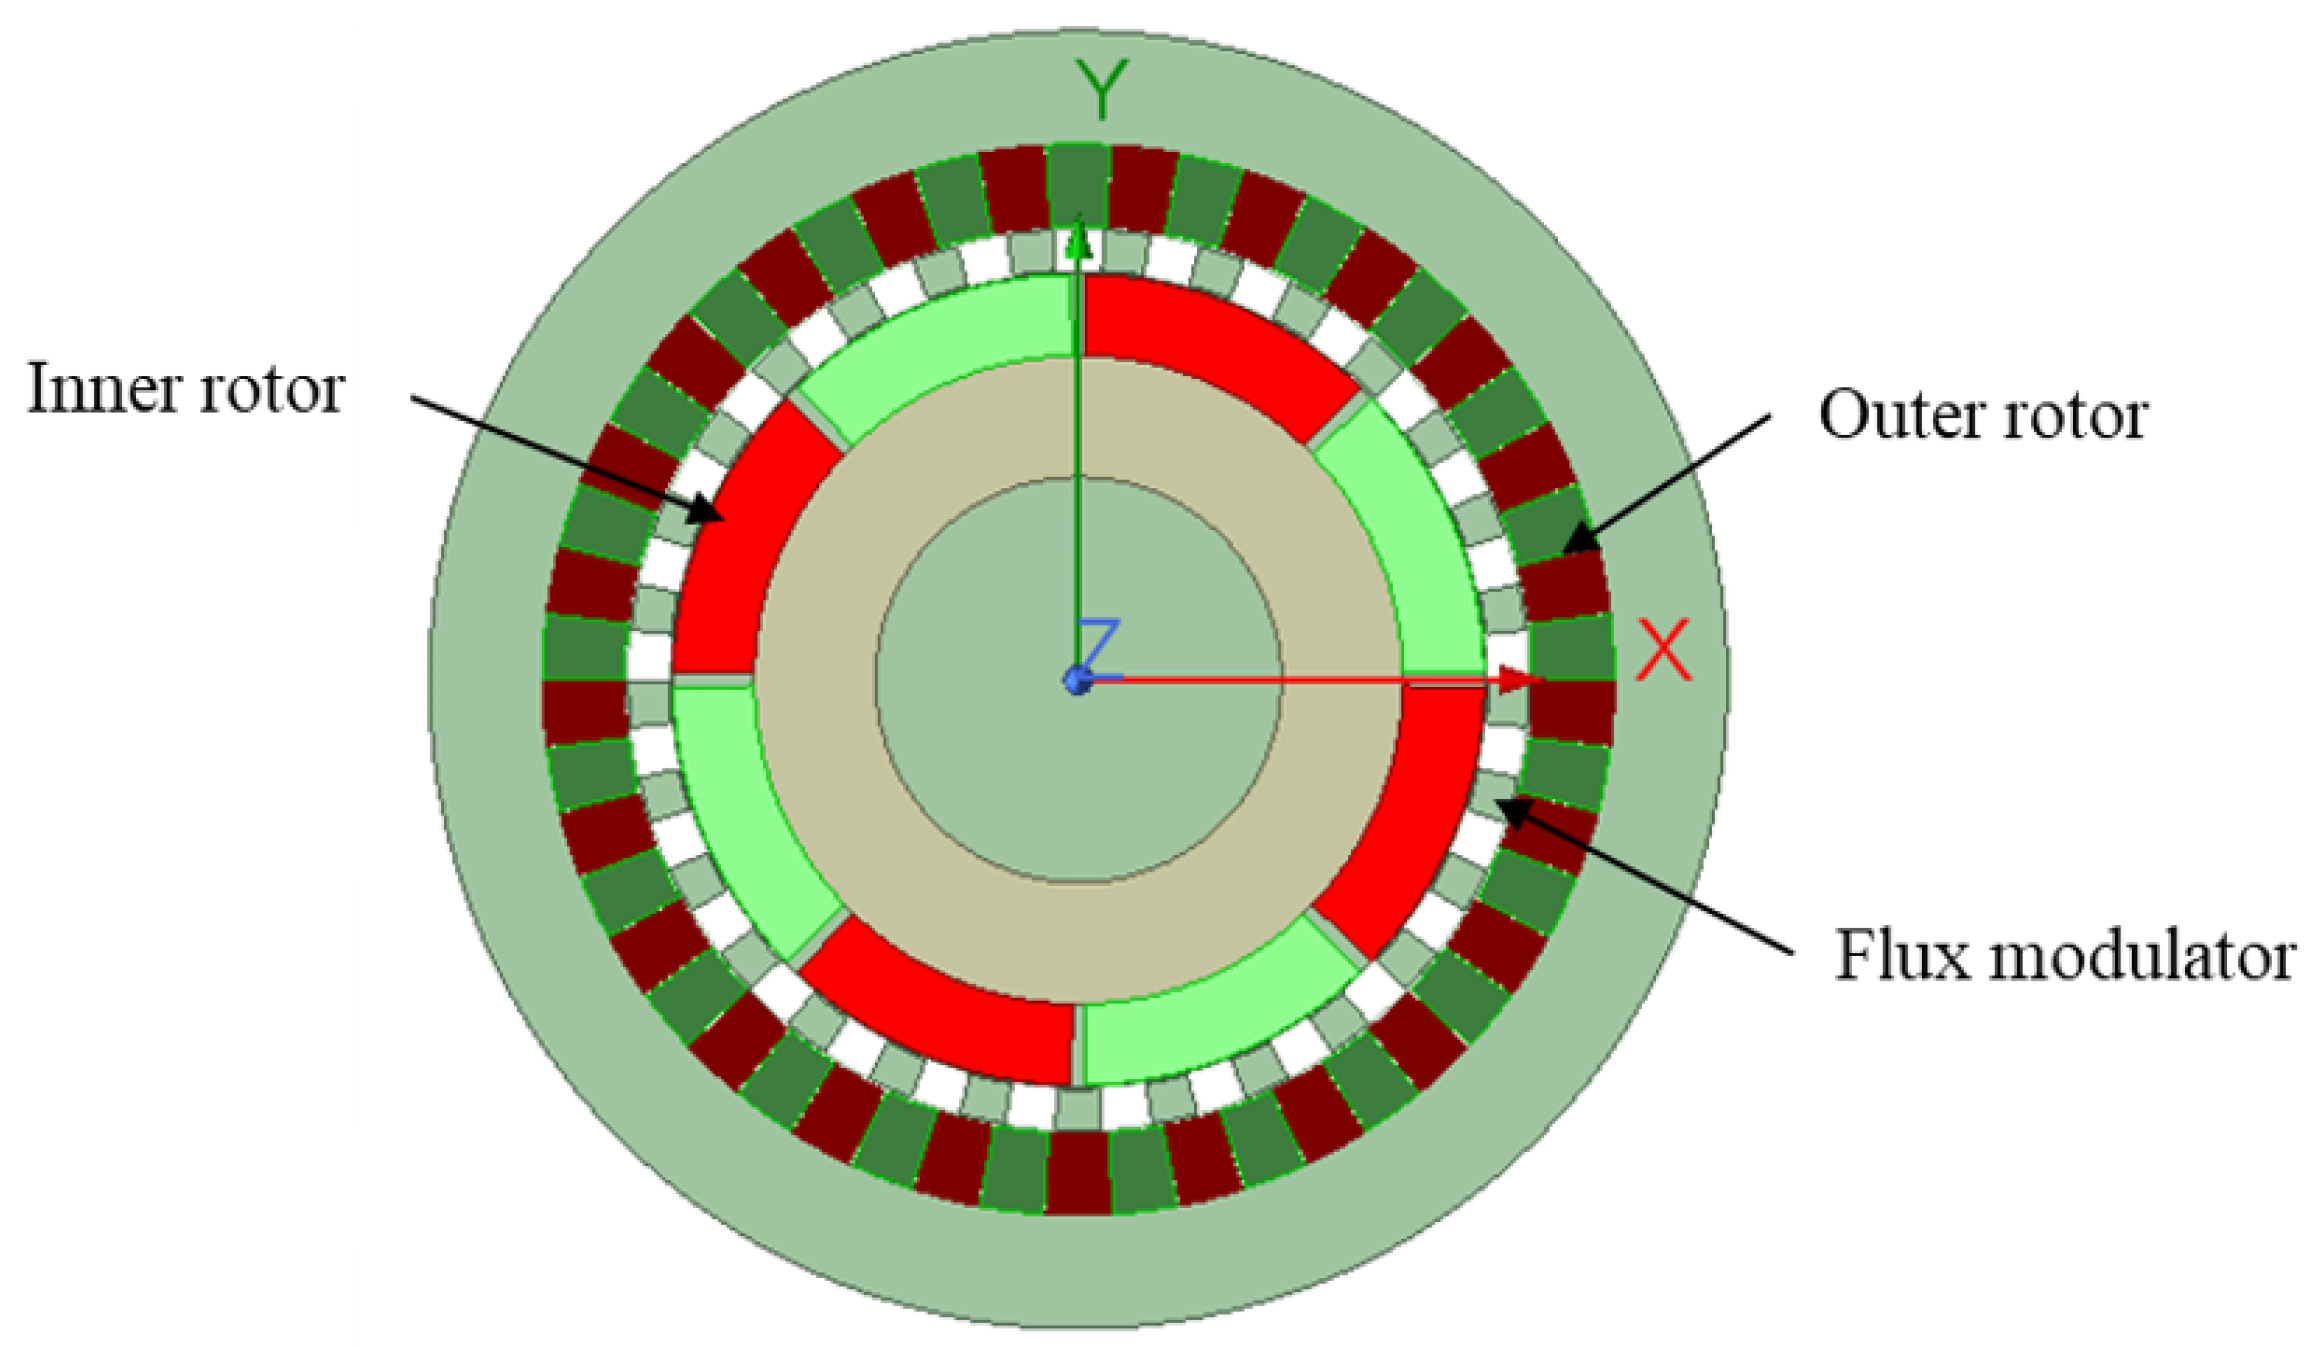
This investigation centers on a conventional CMG system, schematically represented in
Figure 1. The system architecture incorporates three fundamental components: (1) an inner rotor assembly featuring surface-mounted permanent magnets with
pole pairs, (2) an outer rotor configuration employing tangentially magnetized surface-mounted permanent magnets with
pole pairs, and (3) a modulator ring structure comprising alternating ferromagnetic and non-magnetic segments. The number of modulation segments
adheres to the fundamental magnetic field modulation principle expressed by
.
The operational principle relies on magnetic field modulation phenomena. The permanent magnet fields generated by both rotors interact with the modulator ring within the air gap region, producing rich spatial harmonic content. When the specified modulation condition is satisfied, specific harmonic components, known as working harmonics, enable magnetic coupling, facilitating non-contact torque transmission between the inner and outer rotors at a fixed gear ratio . According to the general principle of magnetic gears, the primary working harmonic pairs are the -th harmonic in the inner air gap and the -th harmonic in the outer air gap. However, the modulation process inevitably introduces a spectrum of other harmonics, termed parasitic harmonics or non-working harmonics. The amplitude and phase of these parasitic harmonics are critically influenced by the geometric parameters of the MG, which do not contribute to the useful average torque but are the primary source of torque ripple and core losses, thereby establishing a direct link between the harmonic spectrum and the key performance metrics targeted in this optimization.
The principal design parameters governing the MG performance are systematically cataloged in
Table 1.
The electromagnetic performance features of the MG exhibit significant dependence on structural parameters. This study maintains invariant inner and outer radii for the outer rotor, modulator ring, and inner rotor components while concentrating investigation on the influence of critical dimensional parameters: the embrace angles of both inner and outer rotors (
,
) and the modulator (
), in conjunction with the thickness dimensions of the inner and outer rotor PM (
,
). The design variables and the variation ranges are summarized in
Table 2. Although modulator thickness (
) is recognized to influence electromagnetic performance—where reduced thickness increases air gap length and consequently diminishes magnetic field intensity—its effects are well documented in the existing literature and consequently excluded from this parametric investigation.
Design variable selection and their variation ranges derive from thorough consideration of electromagnetic performance requirements, mechanical integrity constraints, thermal management limitations, and manufacturability considerations. The embrace parameters (, , ) are constrained within the interval [0.05, 0.95] to ensure sufficient mechanical robustness of PM segments while preserving effective magnetic flux pathways. The specified lower boundary of 0.05 mitigates excessive magnetic flux leakage, while the upper limit of 0.95 prevents structural compromise in rotor core components. The PM thickness parameters (, ) are confined within [5 mm, 15 mm] based on thermal and mechanical design criteria. The established lower threshold of 5 mm guarantees adequate magnetic flux generation capacity and provides protection against demagnetization under rated operational loads, while the upper constraint of 15 mm serves to regulate manufacturing expenditures and prevent magnetic saturation phenomena in adjacent ferromagnetic elements. This designated range additionally accommodates standard PM manufacturing tolerances and ensures appropriate thermal dissipation properties during continuous operation.
3. Objectives and Constraints
This investigation formulates optimization objectives and constraints based on the fundamental operational principles governing MG systems. The primary optimization targets encompass two critical performance metrics for both rotor assemblies: torque ripple features and average torque output. Torque ripple, serving as a key indicator of operational smoothness, is quantitatively defined as the normalized differential between maximum and minimum instantaneous torque values during operational cycles, mathematically represented as the ratio of peak-to-peak torque fluctuation to average torque output.
where
and
denote the peak and minimum torque magnitudes, respectively, while
represents the mean torque output computed over
N complete operational cycles, with
n indicating the current computational instance.
To ensure accurate torque ripple computation, the FEA transient analysis was configured with a time step of s, corresponding to 200 samples per electrical cycle at the rated rotational speed of 145 rpm. The total simulation time was set to s, covering two full mechanical rotations. This sampling density ensures adequate resolution for harmonic analysis. Torque ripple values reported in this study were computed using data from the second complete rotation, thereby excluding any transient startup effects and guaranteeing that the analysis reflects periodic steady-state operation.
Considering the high transmission efficiency inherent to MG systems, the optimization framework strategically focuses on the inner rotor’s average torque as the principal torque-related objective. To resolve dimensional inconsistencies between torque ripple and average torque metrics, normalized relative values are implemented within the multi-objective function formulation, expressed as:
where
signifies the normalized relative value of outer rotor torque ripple, while
and
represent the normalized relative values of inner rotor torque ripple and average torque, respectively.
The optimization framework incorporates thorough constraints addressing both performance specifications and structural limitations, mathematically formulated as:
where
and
designate the minimum and maximum permissible values of the
ith design parameter
, respectively,
corresponds to the inner rotor’s average torque, and
indicates the outer rotor’s torque ripple.
4. Parameter Sensitivity Analysis
This section presents a systematic investigation of design parameter influences on magnetic gear performance through a detailed comparative analysis framework. The analytical procedure integrates two complementary approaches: local sensitivity analysis and global Sobol sensitivity analysis, providing a multi-faceted understanding of parameter effects across different analytical domains.
4.1. Local Sensitivity Analysis
To establish a comparative baseline with conventional approaches, local sensitivity analysis was conducted using the one-factor-at-a-time (OFAT) methodology. The procedure comprised four sequential stages: (1) individual parameter selection with uniform sampling of 11 points across defined operational ranges, (2) maintenance of remaining parameters at baseline configurations, (3) execution of finite element analysis (FEA) simulations for each parameter combination, and (4) generation of sensitivity curves visualizing objective function variations.
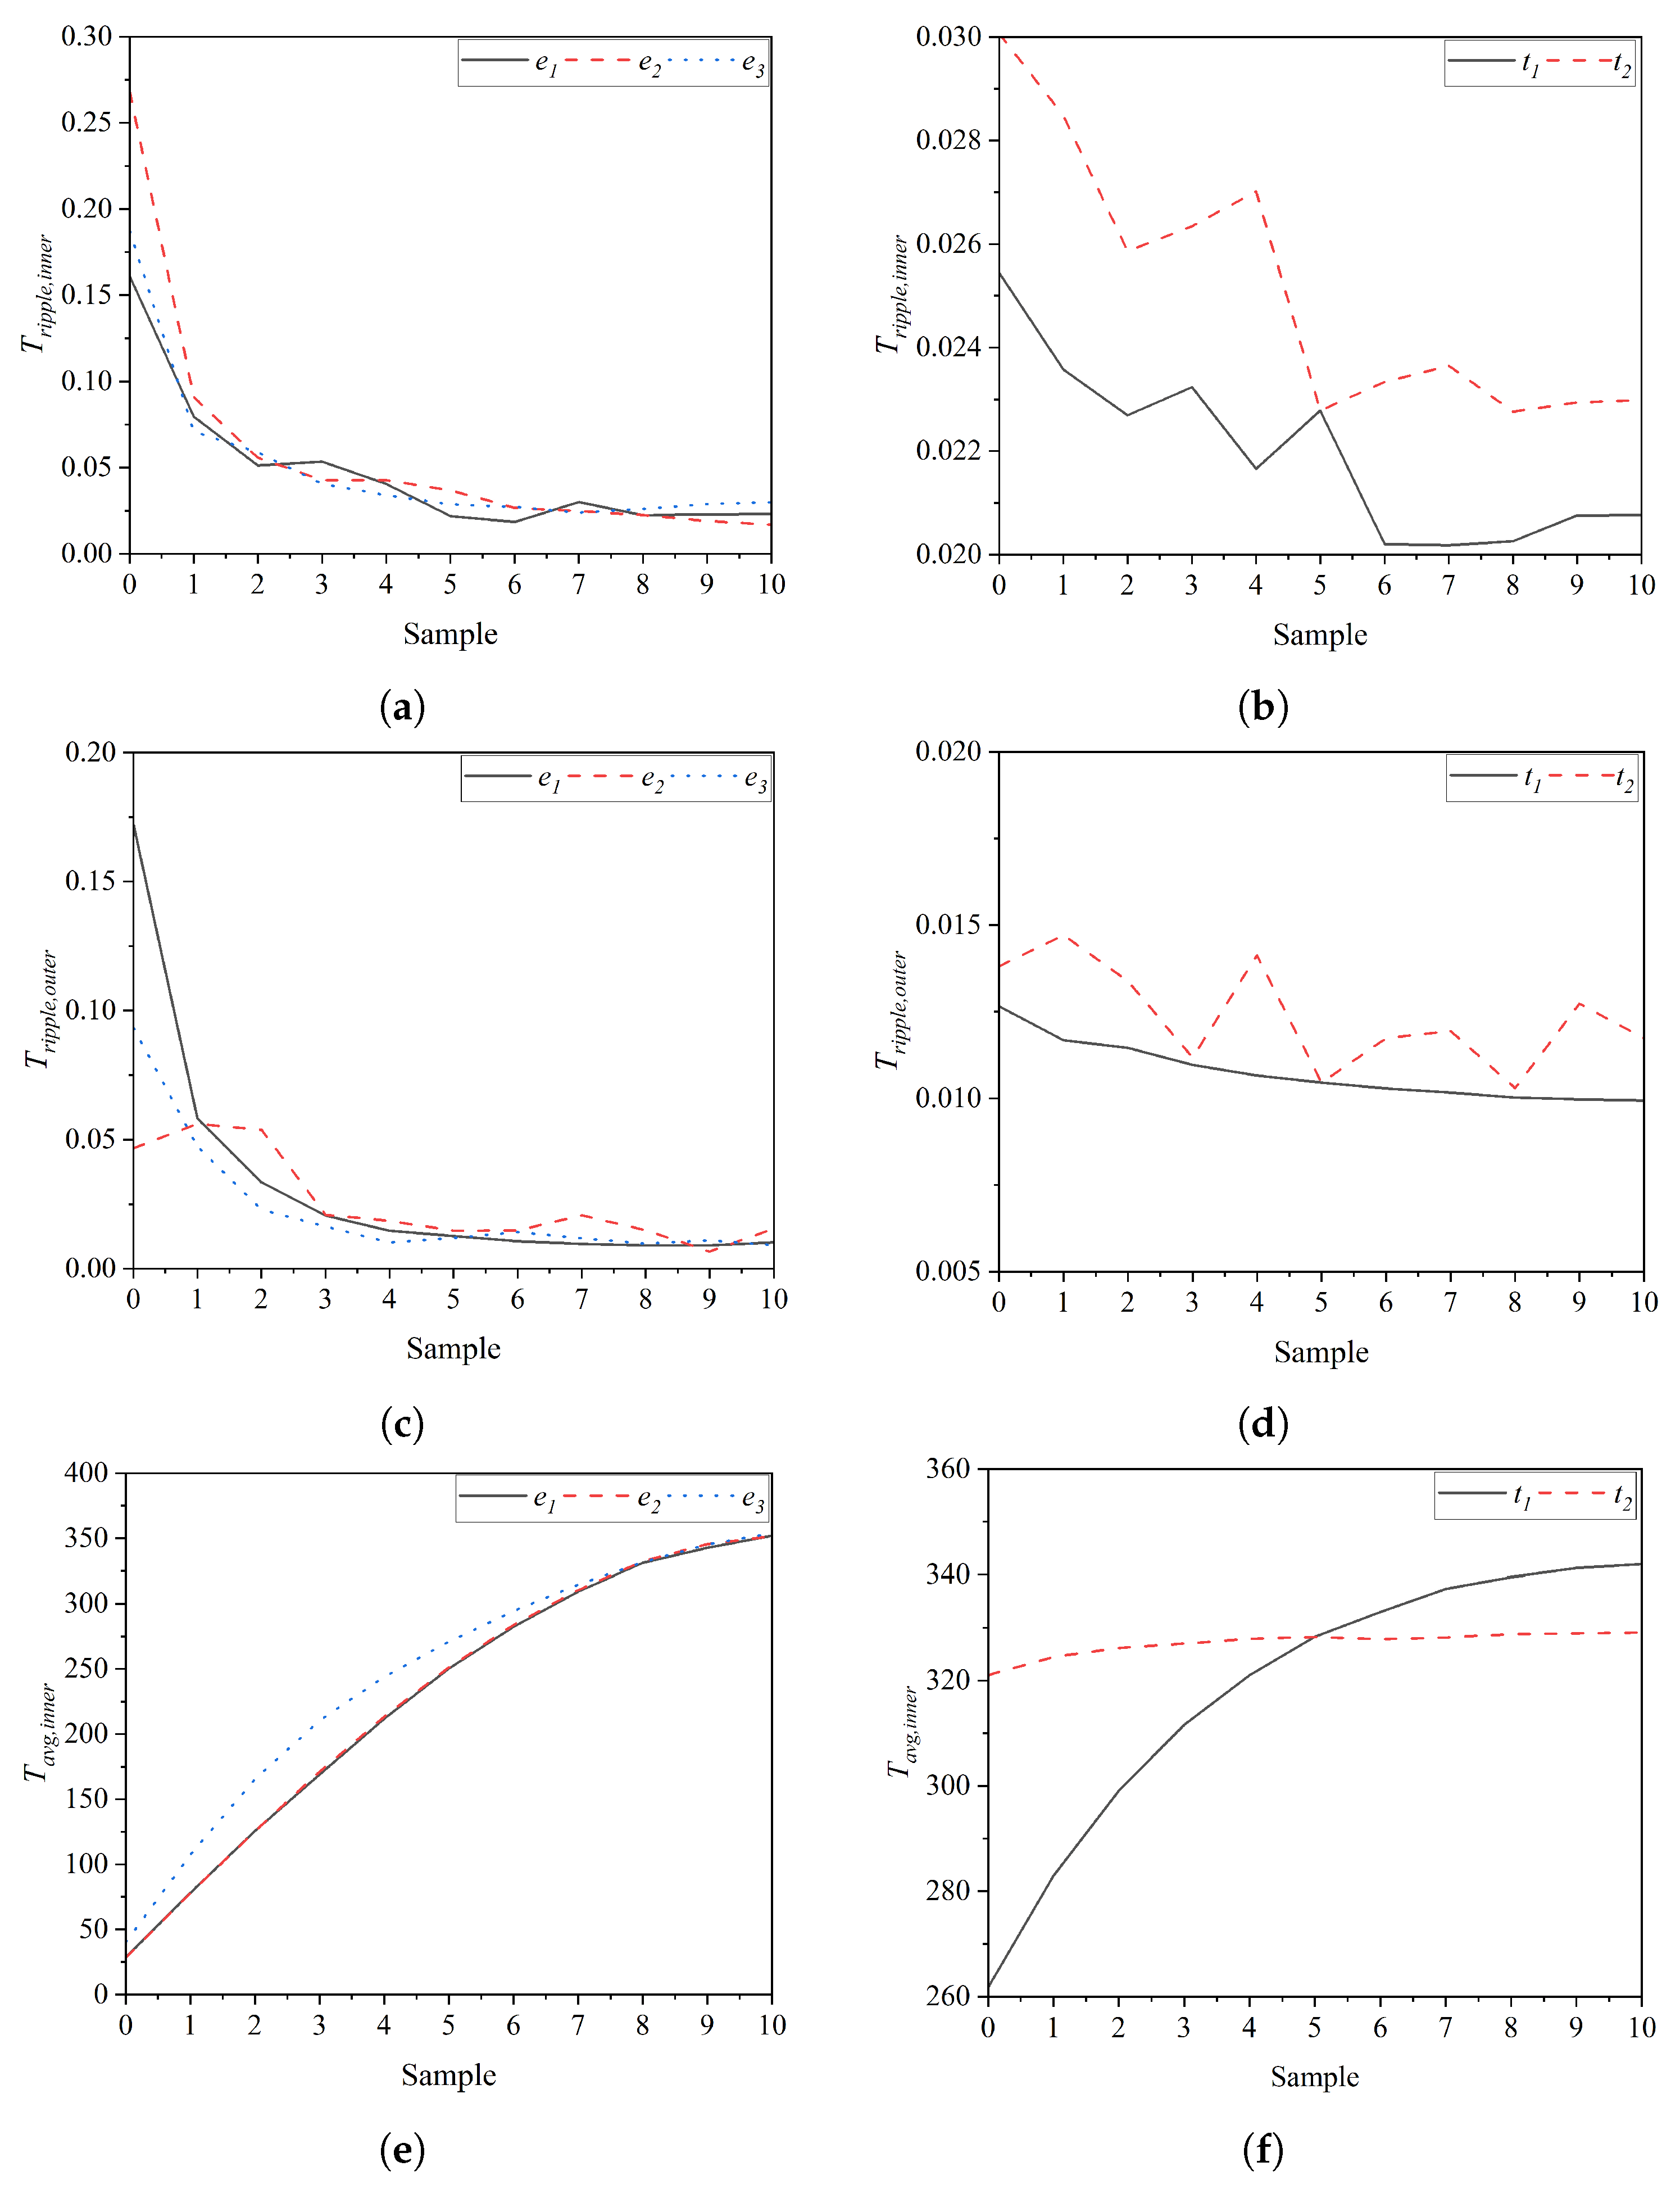
Analysis of
Figure 2 reveals distinct behavioral patterns among the design parameters. Parameters
,
, and
exhibit substantial influence across all three objective functions, with clear monotonic relationships to performance metrics. In contrast, parameters
and
demonstrate minimal impact, showing only minor non-monotonic variations in torque ripple and negligible improvement in average torque.
Local sensitivity indices quantify the independent influence of each parameter on the objective function at specific operating points. To eliminate dimensional discrepancies across different objective functions, normalized sensitivity coefficients were calculated using the central difference method:
where
represents the normalized sensitivity coefficient of the
i-th parameter
,
is the parameter perturbation, and
is the objective function value at the baseline.
The local sensitivity results, summarized in
Table 3, were calculated using the central difference method with parameter perturbations of
for embrace parameters and
mm for thickness parameters. These results quantitatively confirm the qualitative observations from
Figure 2, revealing distinct sensitivity patterns across different parameter groups and objective functions.
For embrace parameters, all show negative sensitivity coefficients for torque ripple objectives alongside positive sensitivity to average torque. Specifically, shows moderate to strong negative sensitivity to torque ripple ( for and for ) with positive sensitivity to average torque (). Parameter displays the strongest negative sensitivity to inner torque ripple () among all parameters, along with substantial negative sensitivity to outer torque ripple () and moderate positive impact on average torque (). Similarly, demonstrates negative sensitivity to torque ripple ( for and for ) coupled with positive sensitivity to average torque ().
In contrast, thickness parameters (, ) exhibit significantly lower sensitivity coefficients across all objectives. Parameter shows moderate negative sensitivity to torque ripple ( for and for ) with low positive impact on average torque (). Parameter demonstrates negligible influence on all objectives, particularly on ().
This clear distinction in sensitivity magnitudes between embrace and thickness parameters provides strong justification for the subsequent parameter grouping strategy, where embrace parameters are prioritized for primary optimization.
4.2. Global Sobol Sensitivity Analysis
While local sensitivity analysis provides valuable insights at specific operating points, it cannot capture the complete parameter interactions across the entire design space. To address this limitation, global sensitivity analysis using the Sobol method was implemented to evaluate parameter influences considering the full parameter variation range and interaction effects.
The analytical framework employs the Sobol–Hoeffding decomposition theorem [
21,
22] for comprehensive global sensitivity assessment. This approach overcomes limitations of traditional sensitivity methods [
23,
24] by quantitatively evaluating both individual parameter effects and their interactions across the complete design space. For a square-integrable function
defined on the unit hypercube, where
represent independent random variables, the function admits decomposition into summands of increasing dimensionality:
where
denotes a constant term,
represent first-order effects, and
correspond to second-order interaction effects.
The total-effect Sobol index
quantifies the overall contribution of parameter
to the output variance, including all interaction effects with other parameters:
where
represents the variance of the conditional expectation when all parameters except
are fixed.
The global sensitivity analysis results, presented in
Table 4, provide systematic quantification of parameter influences across the entire design space. The total-effect Sobol indices reveal that embrace parameters (
,
,
) consistently demonstrate the highest sensitivity across all objective functions, with
having particularly strong influence on torque ripple of outer rotor and average torque of inner rotor.
Comparative analysis between local and global sensitivity results reveals consistent parameter grouping patterns. Both methodologies identify embrace parameters (, , ) as the dominant factors influencing magnetic gear performance, while thickness parameters (, ) show substantially lower sensitivity indices. This convergence of findings from fundamentally different analytical approaches strengthens the validity of the parameter classification.
However, the global Sobol analysis provides additional insights not captured by local sensitivity methods. The total-effect indices account for parameter interactions across the complete variation range, revealing that emerges as the most influential parameter for in the global context, whereas local analysis suggested comparable influences from multiple parameters. Similarly, the global analysis confirms the relatively minor role of thickness parameters across all performance metrics, with consistently displaying the lowest sensitivity indices.
The complementary nature of local and global sensitivity analyses provides a robust foundation for parameter selection in subsequent optimization procedures. The consistent identification of embrace parameters as the primary drivers of performance variation justifies their selection as optimization variables, while thickness parameters can be maintained at baseline values to reduce computational complexity without significant performance compromise.
4.3. Comparative Analysis and Parameter Grouping
The comparative analysis reveals that while local sensitivity analysis correctly identifies the same set of influential parameters (, , ), it suffers from fundamental limitations: local analysis is point-specific and misses global parameter interactions. In contrast, the Sobol method delivers comprehensive variance-based evaluation that systematically quantifies both individual parameter contributions and their interactions across the complete design space.
Based on this consistent evidence from both analytical approaches, the design parameters are systematically classified into two distinct categories, as summarized in
Table 5. Group 1 (High-Sensitivity Parameters) encompasses
,
, and
, while Group 2 (Low-Sensitivity Parameters) comprises
and
. This parameter classification strategy facilitates an effective reduction in the optimization problem dimensionality from the original five-dimensional space to sequential three-dimensional (Group 1) and two-dimensional (Group 2) subproblems.
5. Multi-Objective Optimization
5.1. Sequential Optimization Framework
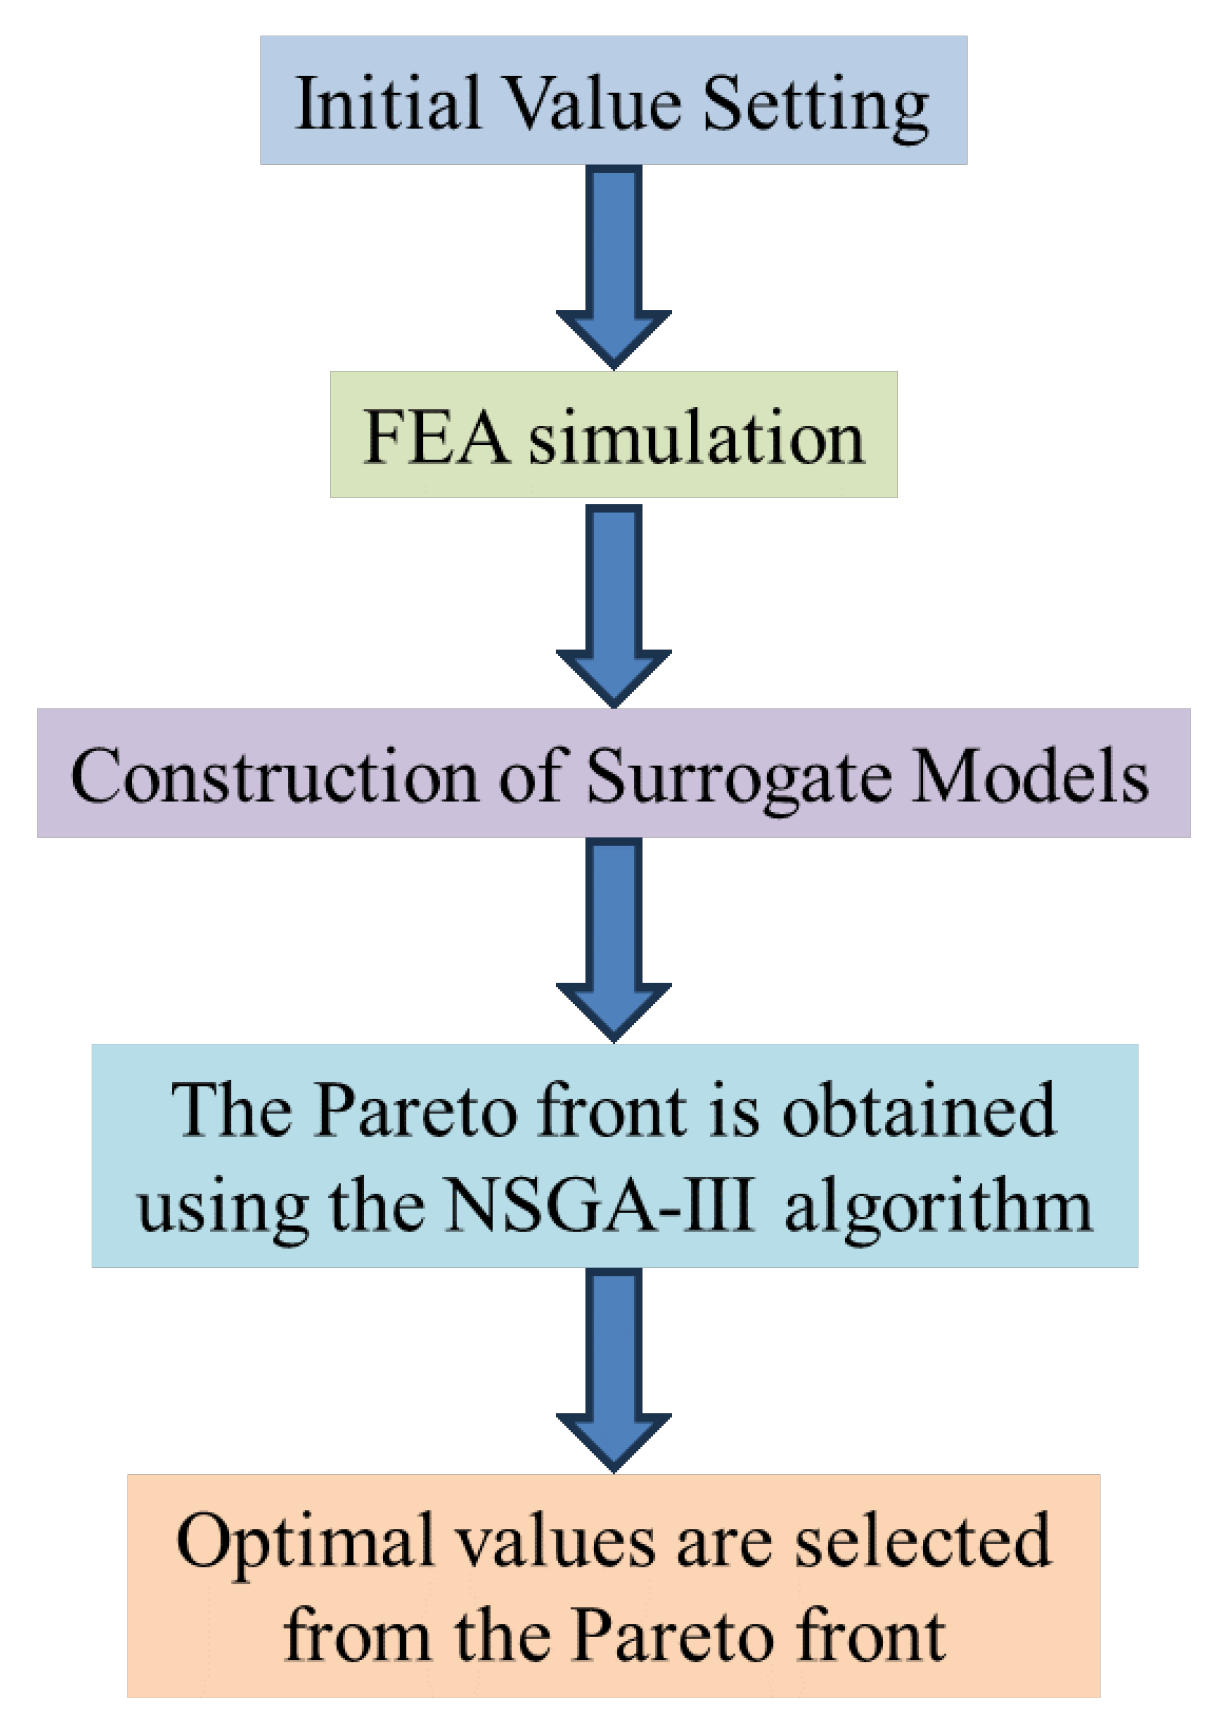
Following systematic parameter classification, a sequential optimization methodology is implemented for each parameter group, with the thorough optimization procedure delineated in
Figure 3.
The optimization process executes systematically through two consecutive phases, each targeting distinct parameter categories with specialized computational strategies. The initial phase concentrates on embrace angle parameters (
,
,
), implementing an integrated optimization workflow: (1) Latin Hypercube Sampling generates 100 spatially uniform and dimensionally uncorrelated sample points within the 3D parameter space while maintaining thickness parameters (
,
) at baseline 10 mm configurations; (2) each parameter configuration undergoes rigorous FEA to assess torque ripple features and average torque performance; (3) the accumulated dataset enables construction of a Kriging surrogate model using the DACE toolbox, recognized for its superior non-linear approximation capabilities and uncertainty quantification [
25,
26]. This approach follows established practices in electromagnetic device optimization [
27], where Kriging models have demonstrated effectiveness in handling complex multi-objective design problems while maintaining computational efficiency; (4) the NSGA-II algorithm is implemented to identify the Pareto frontier. NSGA-II is particularly well suited for multi-objective optimization in electromagnetic device design due to its fast convergence speed, low computational cost, and robust performance in handling problems with two or three objectives [
28]. Its efficient non-dominated sorting mechanism and effective crowding distance operator enable a balanced exploration–exploitation trade-off, ensuring a uniformly distributed set of Pareto-optimal solutions. These advantages have established NSGA-II as a widely adopted and reliable approach in numerous studies on electromagnetic device optimization; (5) the optimal configuration [
,
,
] is selected from the derived Pareto front based on minimum objective function criteria.
The subsequent optimization phase focuses on thickness parameter optimization (, ) while preserving the previously established optimal embrace angles. The methodological approach mirrors the initial phase with appropriate modifications: LHS generates 100 sample points within the reduced 2D parameter domain, followed by FEA simulations evaluating identical performance metrics. A specialized Kriging model characterizes the relationship between thickness variations and system responses, facilitating NSGA-II identification of Pareto-optimal thickness combinations [, ].
The thorough optimal design configuration emerges from this structured two-stage methodology, systematically addressing both torque quality and output magnitude requirements through physically informed parameter decoupling and sequential optimization.
The optimization implementation utilized MATLAB 2018b’s gamultiobj function for NSGA-II execution with default parameter settings, including a population size of 100 and 200 generations. Kriging surrogate modeling was performed using the DACE toolbox with Gaussian correlation functions and constant regression models. Sample sizes of 100 points per optimization stage were selected based on the dimensionality-reduction principle, where the three-dimensional Group 1 optimization required approximately 100 samples to adequately populate the design space, while the subsequent two-dimensional Group 2 optimization maintained the same sample count to ensure consistent model accuracy across both stages.
To summarize and clarify the aforementioned procedure, the complete workflow of the proposed SGTSO framework is formalized in Algorithm 1.
| Algorithm 1 Sensitivity-Guided Two-Stage Optimization |
Require: Design variable ranges, FEA model, Objectives f, Constraints
Ensure: Optimal design configuration - 1:
Stage 0: Global Sensitivity Analysis - 2:
Generate samples (e.g., via LHS) of all parameters. - 3:
Evaluate all samples using FEA to compute objective functions f. - 4:
Perform Sobol analysis to compute Sobol indices . - 5:
Classify parameters into Group 1 (high-sensitivity, ) and Group 2 (low-sensitivity, ). - 6:
Stage 1: Optimization of High-Sensitivity Group () - 7:
Initialize parameters to their baseline values . - 8:
Generate LHS samples for parameters. - 9:
Evaluate samples via FEA and construct Kriging surrogate model. - 10:
Optimize using NSGA-II on Kriging surrogate model to find Pareto Front. - 11:
Select the optimal solution from Pareto Front. - 12:
Stage 2: Optimization of Low-Sensitivity Group () - 13:
Fix parameters to the optimized values . - 14:
Generate LHS samples for parameters. - 15:
Evaluate samples via FEA and construct Kriging surrogate model. - 16:
Optimize using NSGA-II on Kriging surrogate model to find Pareto Front. - 17:
Select the final optimal solution from Pareto Front. - 18:
Final Solution - 19:
- 20:
return
|
5.2. Computational Complexity Analysis
The grouped optimization strategy shows substantial computational complexity reduction, as analytically established below. Following parameter classification, the original optimization problem decomposes into a two-stage optimization sequence. The Stage 1 objective function formalizes as:
where
represent Group 1 and Group 2 parameters, respectively, while
denotes initial values assigned to Group 2 parameters.
The Stage 2 optimization objective formulates as:
where
signifies optimized values obtained for Group 1 parameters during Stage 1,
represent Group 2 parameters.
Computational complexity for single stage optimization follows established formulations [
29,
30]:
where
N represents sampling size (design point quantity),
d indicates parameter dimensionality,
m denotes objective function count, and
G signifies iteration number.
The grouped optimization computational complexity expresses as:
where subscripts 1 and 2 designate first and second optimization stages, respectively.
The complexity reduction ratio derives from:
Assuming identical total sample numbers for both methodologies (i.e.,
) and constant generation counts (
), the following relationship is obtained:
To ensure equitable comparison, subsequent simulations establish total sample numbers for both single stage and grouped optimization at 200, with grouped optimization allocating 100 samples per stage. Applying the complexity reduction ratio formulation yields . This result conclusively shows the proposed method’s capacity for substantial computational complexity reduction and optimization efficiency enhancement.
5.3. Convergence Analysis of Two-Stage Optimization
The convergence features of the proposed two-stage optimization framework receive mathematical verification under weak parameter coupling conditions. Consider the objective function , possessing second-order continuous differentiability within the neighborhood of global optimal solution , where: , (high-sensitivity parameters), (low-sensitivity parameters).
The Hessian matrix at optimal point
partitions as:
where:
Based on Sobol sensitivity analysis outcomes presented in
Table 3, parameters
and
exhibit weak coupling features, satisfying:
where
represents a small positive number quantifying coupling intensity.
Theorem 1. Under weak coupling conditions, the two-stage optimized solution satisfies:where C represents a constant dependent on problem conditioning.
Proof. The demonstration proceeds through two stages corresponding to the optimization architecture:
Stage 1: Fix
, then optimize to obtain
satisfying:
Taylor expansion at
yields:
where
and
denotes the optimal value of the first and second parameter group.
Stage 2: Fix
, then optimize to obtain
satisfying:
where
signifies optimized values obtained for Group 2 parameters during Stage 2.
Taylor expansion at
provides:
Substituting the expression for
:
From these equations, error bounds can be derived:
The thorough optimization error bounds as:
where
C represents a constant dependent on problem conditioning. □
This mathematical verification ensures that under weak coupling conditions identified through Sobol sensitivity analysis (
Table 3), the two-stage optimization converges to solutions demonstrably proximate to the global optimum, with error proportionality to inter-group coupling intensity
.
The convergence proof establishes a mathematical guarantee under the weak coupling condition identified by the Sobol sensitivity analysis. It is important to note that in any practical engineering optimization relying on FEA and surrogate models, the true theoretical global optimum remains unknown due to sampling noise and approximation errors. Therefore, while a direct numerical quantification of the deviation is not feasible, the proof provides the theoretical foundation that ensures the viability of the decomposition strategy when the parameter interactions are weak, as is the case for the presented MG design.
6. Numerical Simulations
6.1. Optimization Results and Performance Validation
All electromagnetic simulations were conducted using ANSYS Electronics 2024R1. Key parameters included the following: magnetostatic solver; Master–Slave boundary conditions; mesh density of 48,253 elements with refined air-gap treatment (0.2 mm maximum element size); time step of 1 mechanical degree (360 steps/revolution); non-linear residual of ; materials N38SH for PMs and M19_24G for cores. The mesh convergence study confirmed less than 1.5% variation beyond 45,000 elements.
To ensure a fair and unbiased comparison, a single stage optimization benchmark was established. This benchmark method employs an identical computational workflow and resources: it uses the same total number of 200 FEA samples, the same LHS strategy for generating these samples in the full five-dimensional space, the same Kriging surrogate modeling technique, and the identical NSGA-II algorithm with the same population size (100), number of generations (200), and other hyperparameters. The only difference is that it optimizes all five parameters (, , , , ) simultaneously, without any sensitivity-guided decomposition. This setup guarantees that any performance differences can be directly attributed to the optimization strategy itself, rather than disparities in computational budget or algorithmic settings.
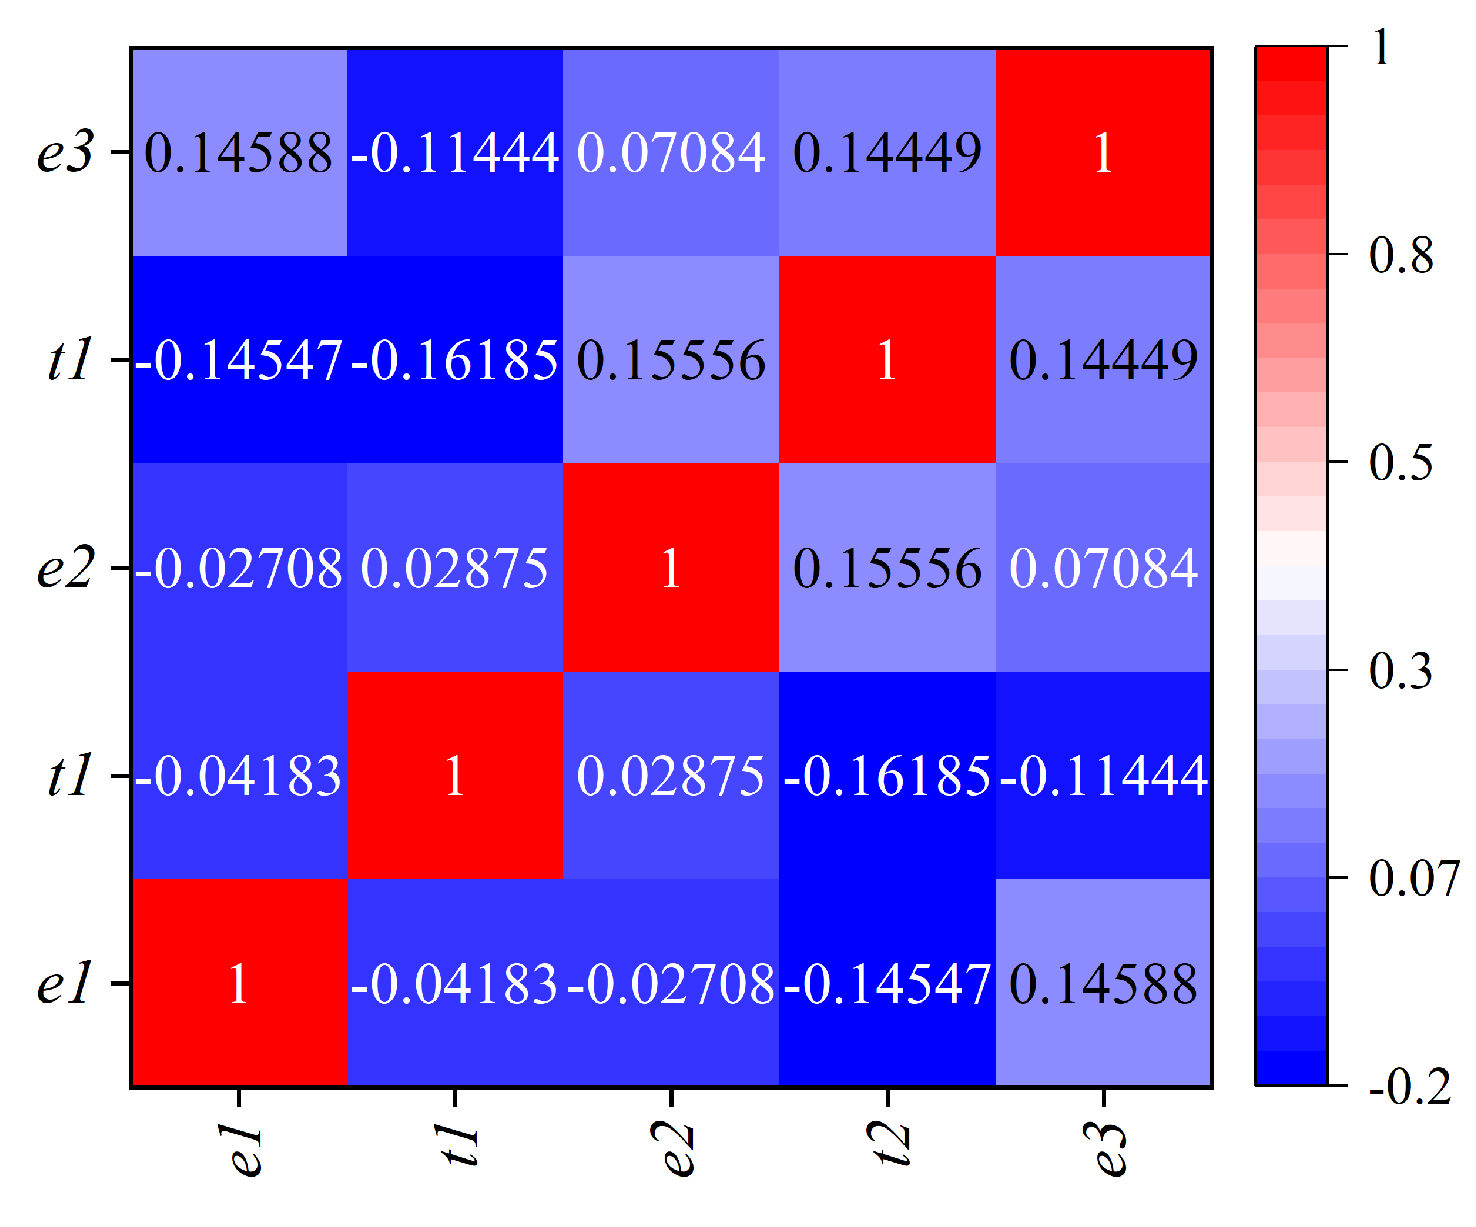
The verification protocol commenced with parameter sampling specifically designed to minimize inter-parameter correlations, as evidenced by Pearson correlation coefficients depicted in
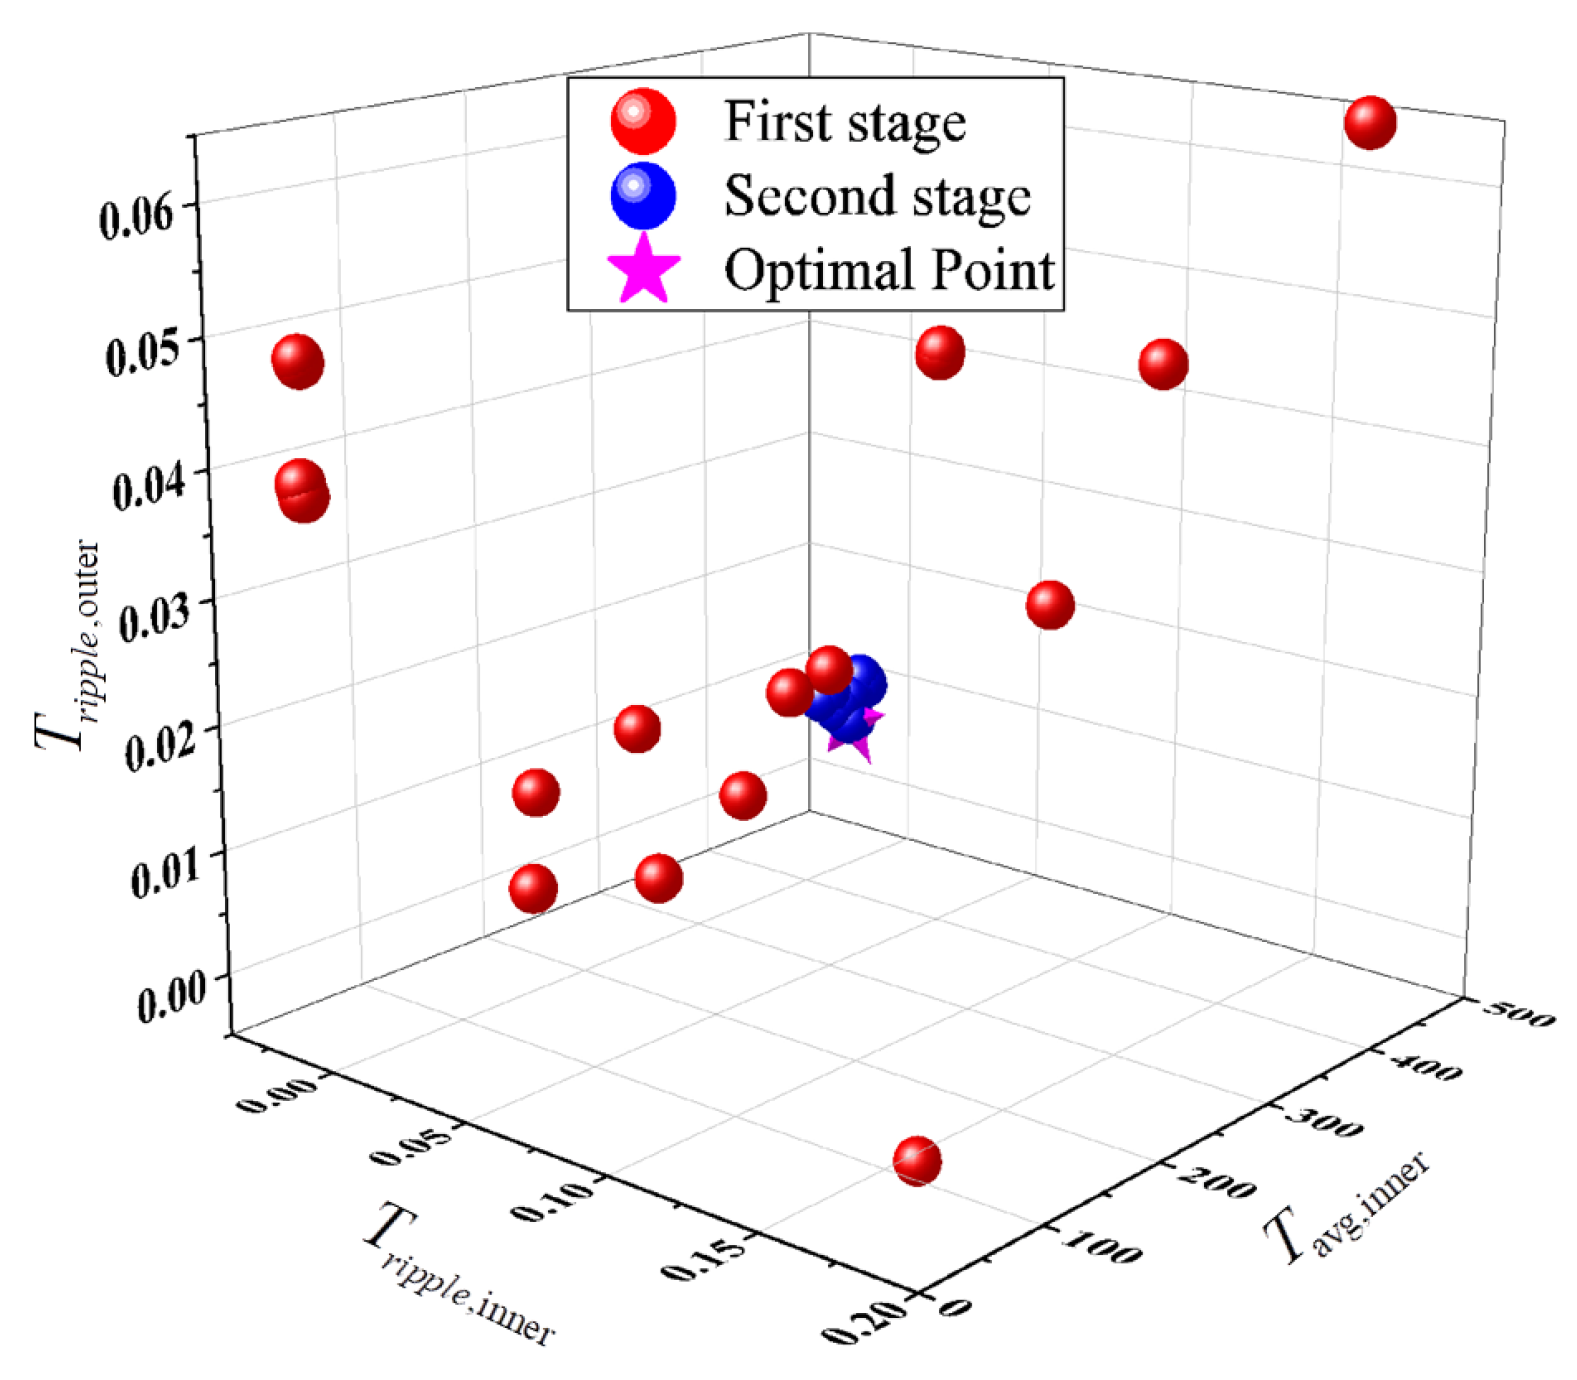
Figure 4. All correlation values maintained sufficiently low magnitudes, confirming representative sample distribution features. The sampled parameter configurations subsequently underwent thorough finite element simulations, with the resulting dataset employed to construct a Kriging surrogate model utilizing the DACE toolbox. This surrogate modeling approach facilitated efficient Pareto frontier exploration through NSGA-II algorithm implementation, generating the optimization outcomes presented in
Figure 5.
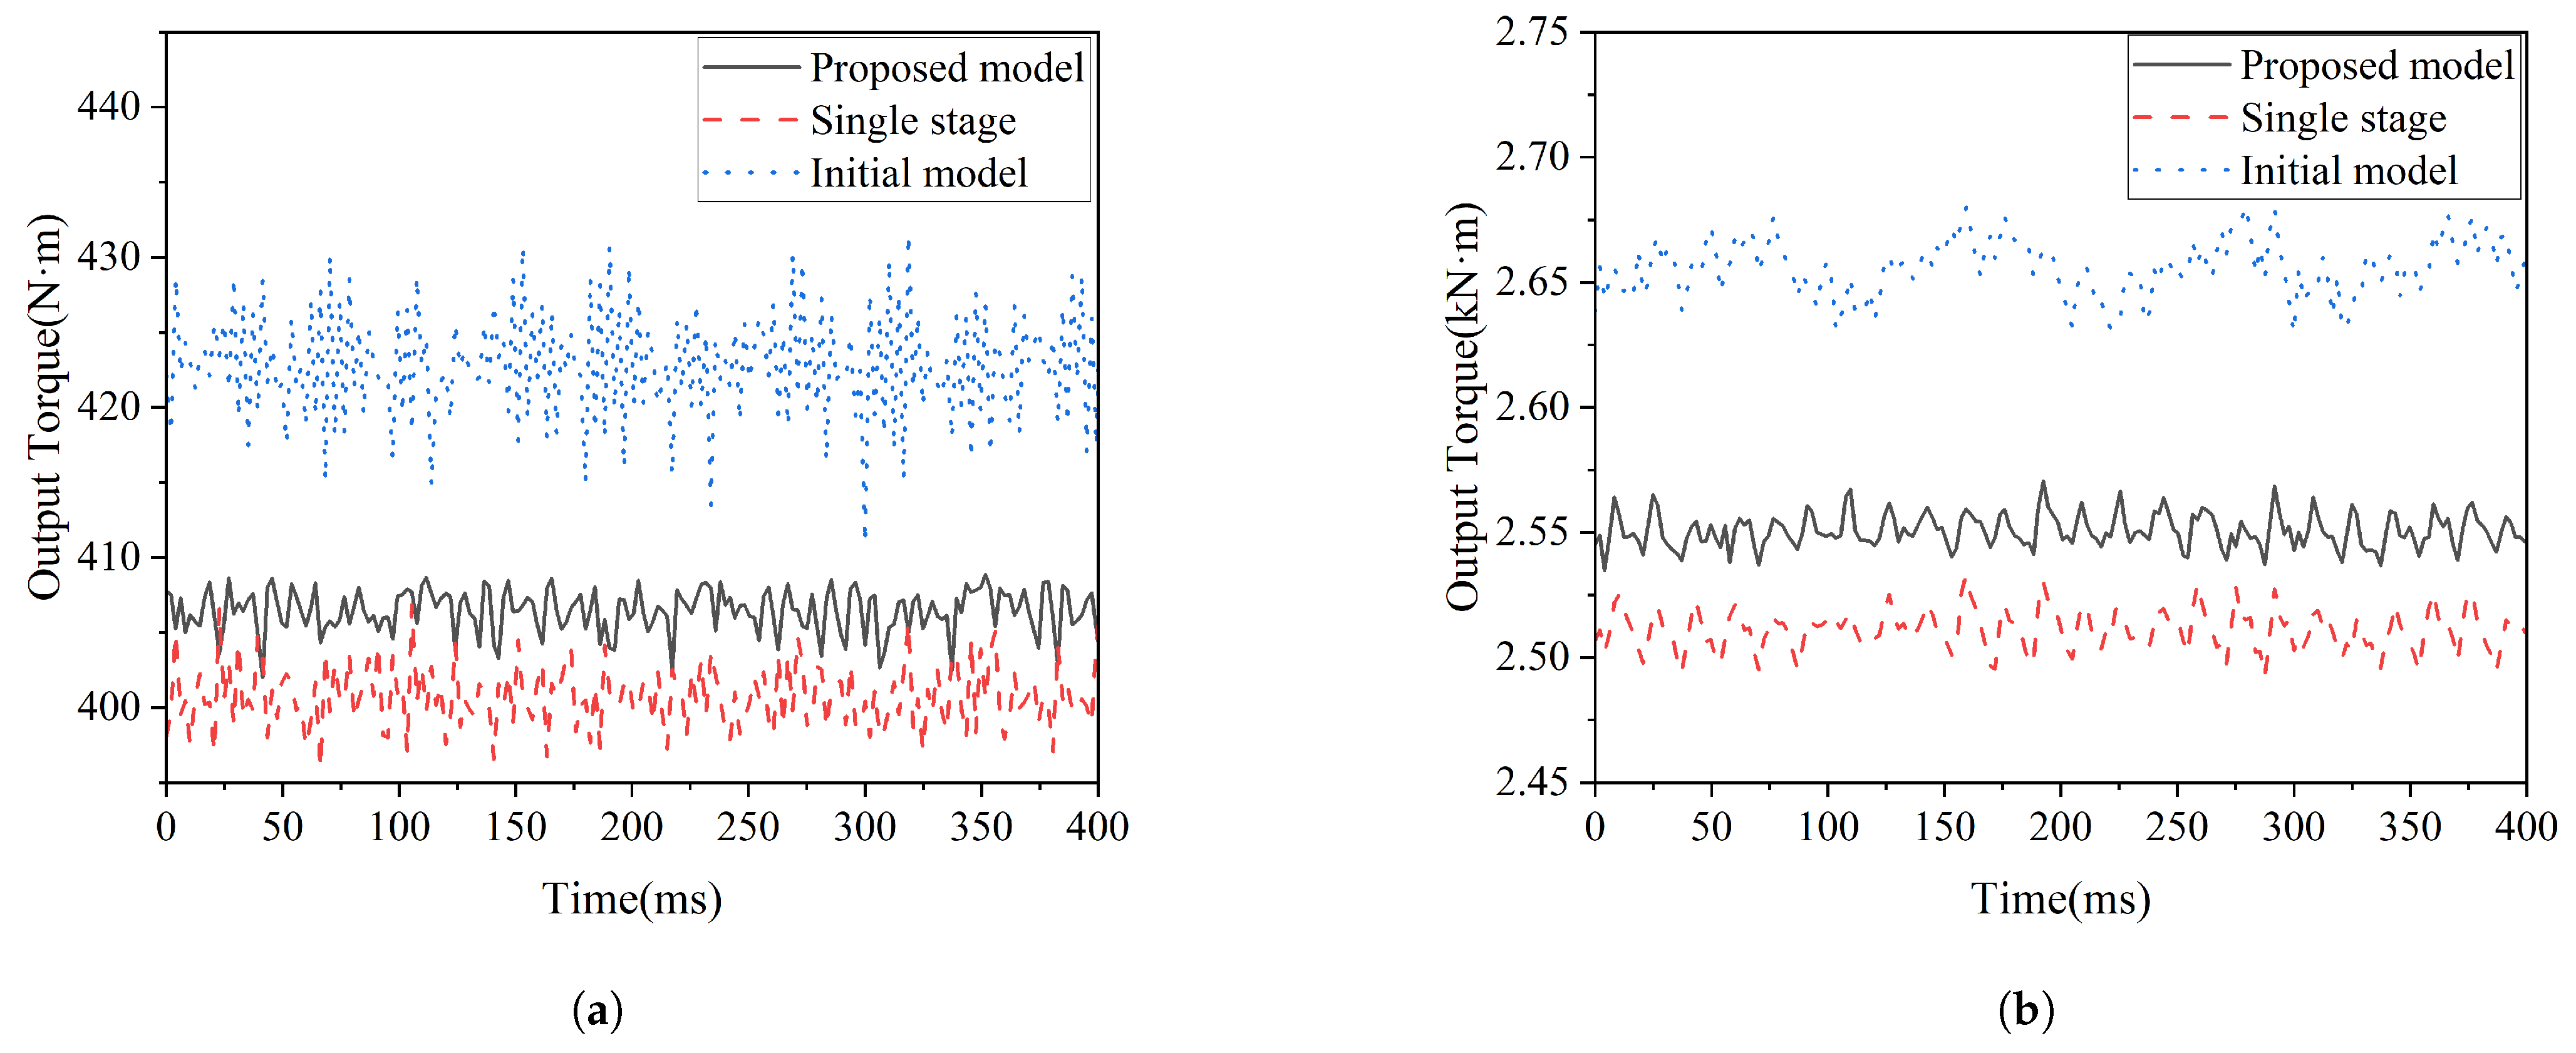
Optimized parameters selected from the Pareto frontier were implemented in finite element simulations, with comparative performance results illustrated in
Figure 6. Analysis reveals that the initial model achieves maximum average torque output while exhibiting the most significant torque ripple features. Conversely, the single stage optimization approach shows reduced torque ripple at the expense of substantially diminished average torque performance. The proposed methodology successfully attains competitive average torque levels while maintaining minimal torque ripple, thereby validating the optimization framework’s capacity to significantly enhance operational smoothness while preserving torque transmission capability. This performance balance accomplishes the primary design objective of ripple minimization without compromising overall power transfer efficiency.
Quantitative performance assessment, as summarized in
Table 6 and
Table 7, reveals several key optimization outcomes through comparative analysis among the initial model, single stage optimization, and the proposed method.
The reduction in permanent magnet (PM) utilization was evaluated by calculating the total PM surface area, defined as the sum of the embrace-thickness products across all rotor segments. Under a constant axial length, this metric is directly proportional to PM volume. Compared to the initial model, the proposed method achieves a significant reduction in PM surface area (19.2% decrease), whereas the single stage optimization leads to a substantial increase (8.6%). This improvement in material efficiency stems from the combined effect of optimized embrace parameters and the strategic reduction of outer rotor PM thickness to 8.8 mm.
Regarding torque performance, compared to the initial model, the proposed method achieves: inner rotor torque ripple reduction from 0.0488 to 0.0169 (65.4% decrease), outer rotor torque ripple reduction from 0.0191 to 0.0139 (27.2% decrease), with a modest inner rotor average torque reduction from 422.81 N·m to 406.45 N·m (4.03% decrease). Comparative analysis with the single stage optimization further demonstrates the superiority of the proposed method, which achieves a notably lower torque ripple on both the inner and outer rotors, alongside a marginal improvement in the average torque of the inner rotor.
The comparative analysis reveals distinct performance features across different modeling approaches. For torque ripple prediction, the proposed method exhibits relatively larger errors (15.4% for inner rotor, 27.3% for outer rotor) compared to average torque prediction (0.18% error), primarily attributed to the highly non-linear nature of torque pulsations in magnetic gears, which are inherently more challenging to model accurately due to complex magnetic coupling and saturation effects. In contrast, the single stage approach shows significantly poorer performance across all metrics, with substantial prediction errors (75.7% for inner rotor torque ripple) arising from its higher-dimensional parameter space and inability to capture the intricate electromagnetic interactions in multi-stage magnetic gear systems. This performance degradation underscores the critical importance of appropriate model selection and dimensionality reduction in magnetic gear optimization.
6.2. Electromagnetic Performance Analysis
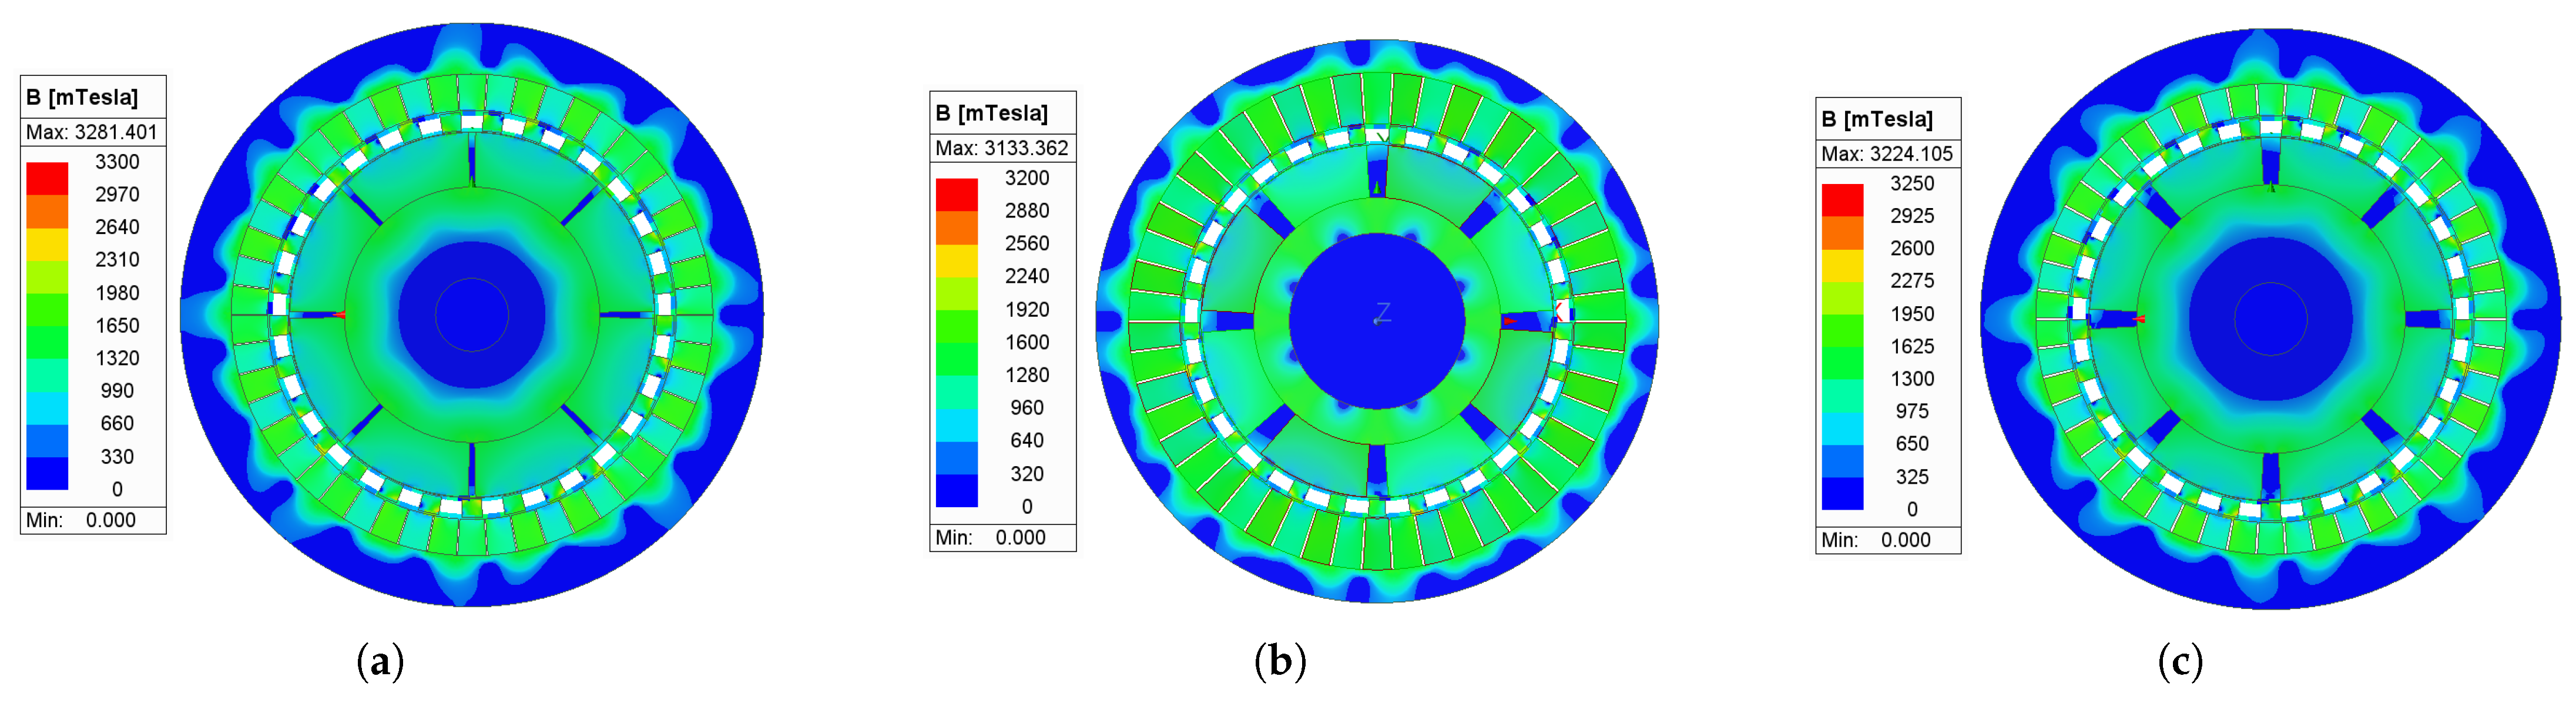
Electromagnetic simulation results for the optimized design configuration are presented in
Figure 7. Comparative evaluation indicates that the proposed methodology achieves maximum magnetic flux density values intermediate between the initial model and single stage design. Consequently, the average torque performance of the proposed approach positions between the initial model’s maximum output and the single stage design’s reduced capability.
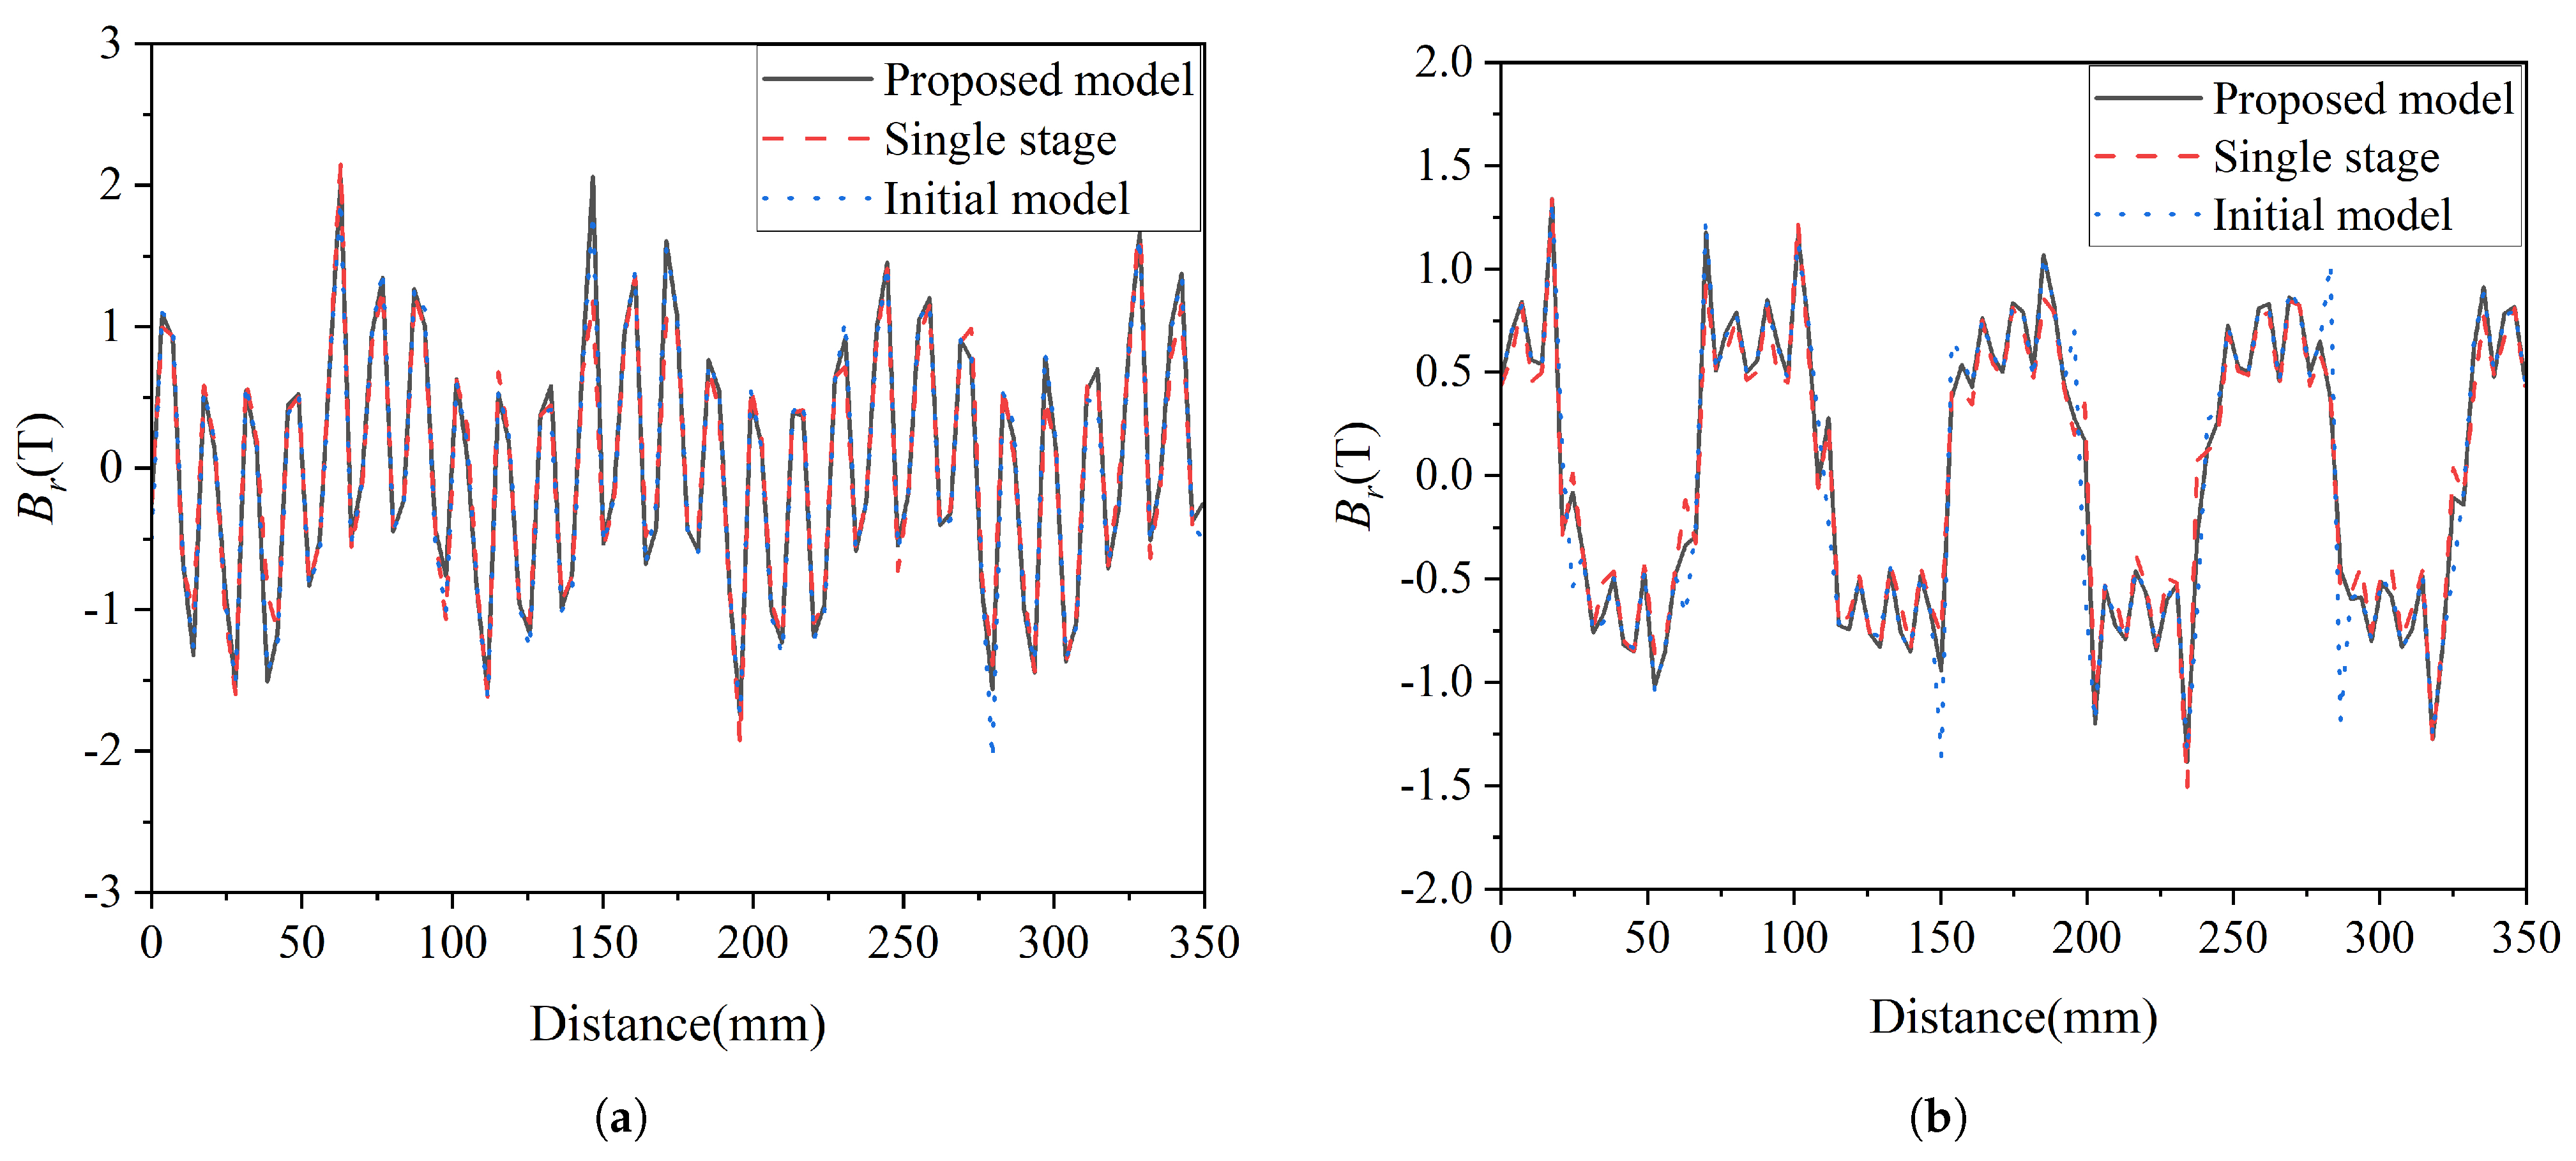
Air-gap magnetic field distributions, illustrated in
Figure 8, reveal nearly identical magnetic field features across all three models in both outer and inner air-gap regions. However, the initial model exhibits marginally higher peak flux density values at specific positions compared to the proposed design, while the single stage approach shows lower values than the proposed methodology.
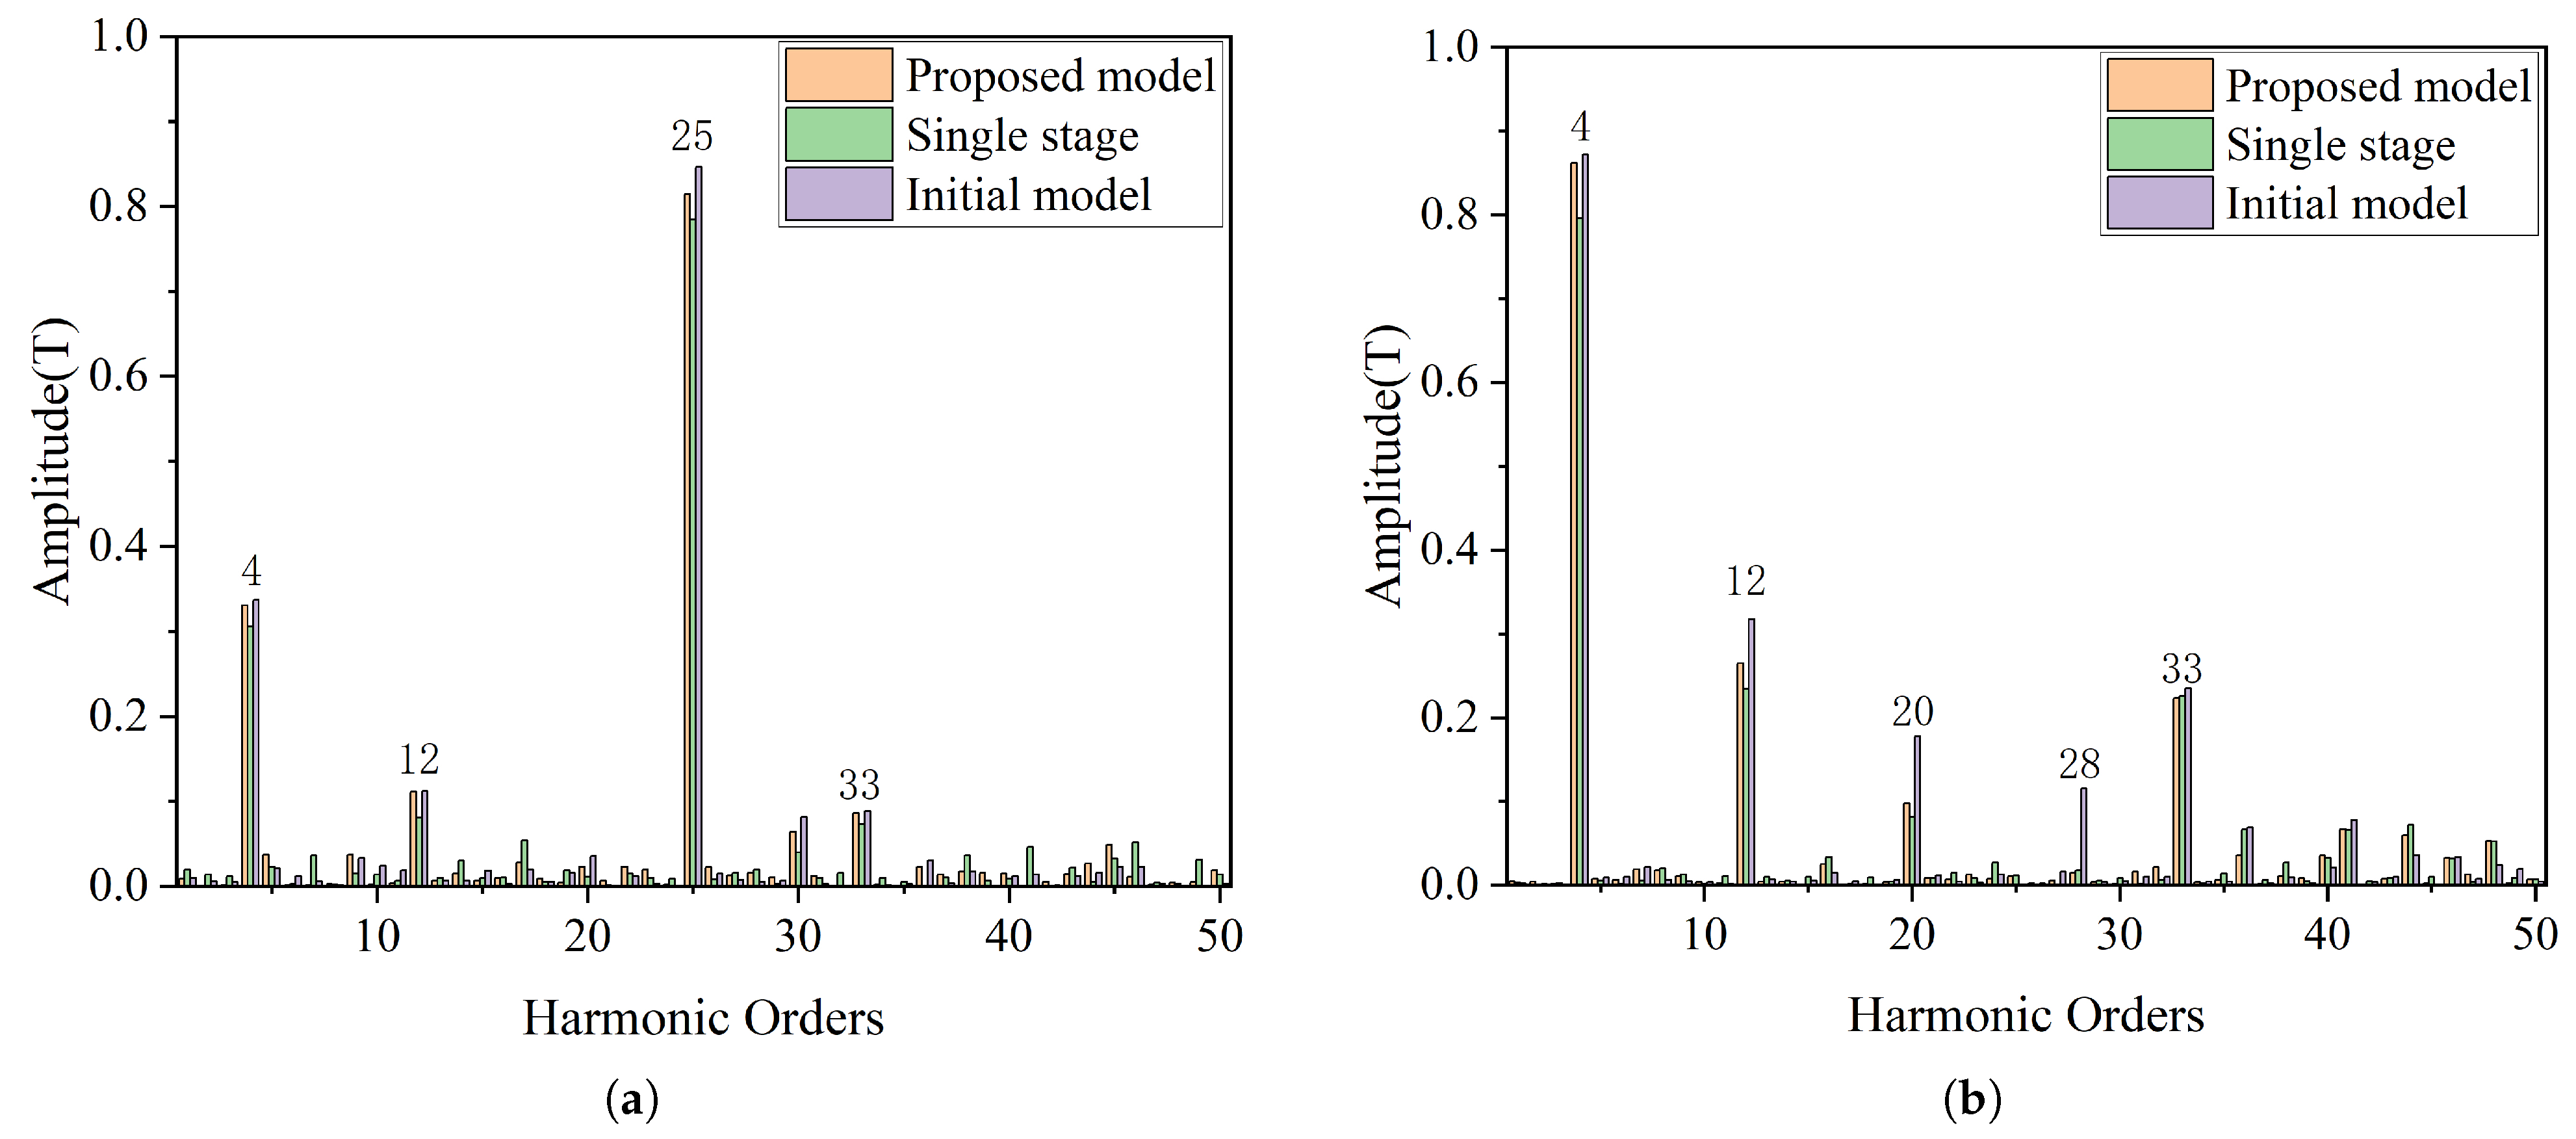
Harmonic spectra derived from Fourier decomposition of air-gap flux density appear in
Figure 9.
Analytical results identify dominant harmonic components in the outer air gap as the 4th, 12th, 25th, and 33rd orders, while the inner air gap exhibits enhanced 4th, 12th, 20th, 28th, and 33rd harmonic components, consistent with magnetic field modulation theory. The initial model shows elevated amplitudes in certain effective harmonics compared to the proposed design, contributing to its superior average torque performance. The optimized configuration achieves torque ripple reduction through strategic suppression of non-working harmonics via refined structural parameter adjustments.
7. Conclusions
This paper has presented a novel SGTSO framework for magnetic gear design. While demonstrated on a specific coaxial topology, the proposed framework is fundamentally generalizable. Its core components—the global Sobol sensitivity analysis and the subsequent sequential optimization—are topology-agnostic. The sensitivity analysis quantitatively identifies dominant parameters based on the underlying physics of any given MG structure, whether coaxial, axial-field, or planetary. Similarly, the gear ratio, which dictates the working harmonics, serves as an input to the finite element model; the framework adapts automatically as the sensitivity landscape changes with different pole–pair combinations. Therefore, the SGTSO methodology establishes a universal template for efficiently optimizing diverse MG topologies and gear ratios, with its efficacy contingent only on the weak coupling condition between parameter groups, as mathematically proven.
Theoretically, this research establishes the superiority of global Sobol sensitivity analysis over traditional local techniques. By employing a variance-based methodology, the framework captures complex parameter interactions, which represents a fundamental methodological advancement that effectively overcomes the inherent limitations of one-at-a-time and derivative-based approaches.
Furthermore, rigorous mathematical foundations are provided for the optimization process. The two-stage framework is formally proven to converge to near-optimal solutions under realistic weak coupling conditions, with the convergence analysis establishing that . This theoretical guarantee of solution quality represents a crucial advantage over heuristic decomposition methods that lack such formal assurances. The integration of Sobol analysis with optimization decomposition enables a mathematically grounded parameter grouping strategy, replacing engineering intuition with quantitative sensitivity measures to ensure both physical consistency and optimization effectiveness.
Practically, the framework delivers substantial performance enhancements for the case study under investigation, achieving a 65.4% reduction in inner rotor torque ripple alongside a 27.2% improvement for the outer rotor. The methodology enables a 19.2% reduction in PM consumption while maintaining 96.12% of the original torque output. Computational efficiency is improved by a factor of 5.25 through structured dimensionality reduction, and harmonic analysis confirms successful suppression of targeted non-working harmonics.
This research shows that the synergistic combination of global sensitivity analysis and mathematically proven optimization decomposition creates a powerful and systematic framework for electromagnetic device design. The methodological advancements provide both theoretical rigor and practical effectiveness, establishing an approach that can be readily extended to other complex multi-physics optimization problems. Future work will focus on extending the mathematical framework to dynamic operating conditions and incorporating additional physical constraints while preserving the established convergence guarantees.
While this study has established the effectiveness of the SGTSO framework under static operating conditions, several limitations and future research directions warrant acknowledgment. The current analysis assumes constant temperature operation and does not account for thermal effects on permanent magnet properties, which could be significant in high-power applications. Additionally, the framework is demonstrated under steady-state conditions, whereas extending it to dynamic scenarios involving transient operations and speed variations would enhance its practical applicability. Future research could also explore incorporating multi-physics considerations, including thermal management and structural integrity, to develop a more comprehensive design methodology for magnetic gears in real-world applications.