1. Introduction
In fifth-generation mobile communications systems (5G), radio base stations (RBSs) that utilize beamforming technologies (BF-RBSs) enable high-speed and high-capacity communications [
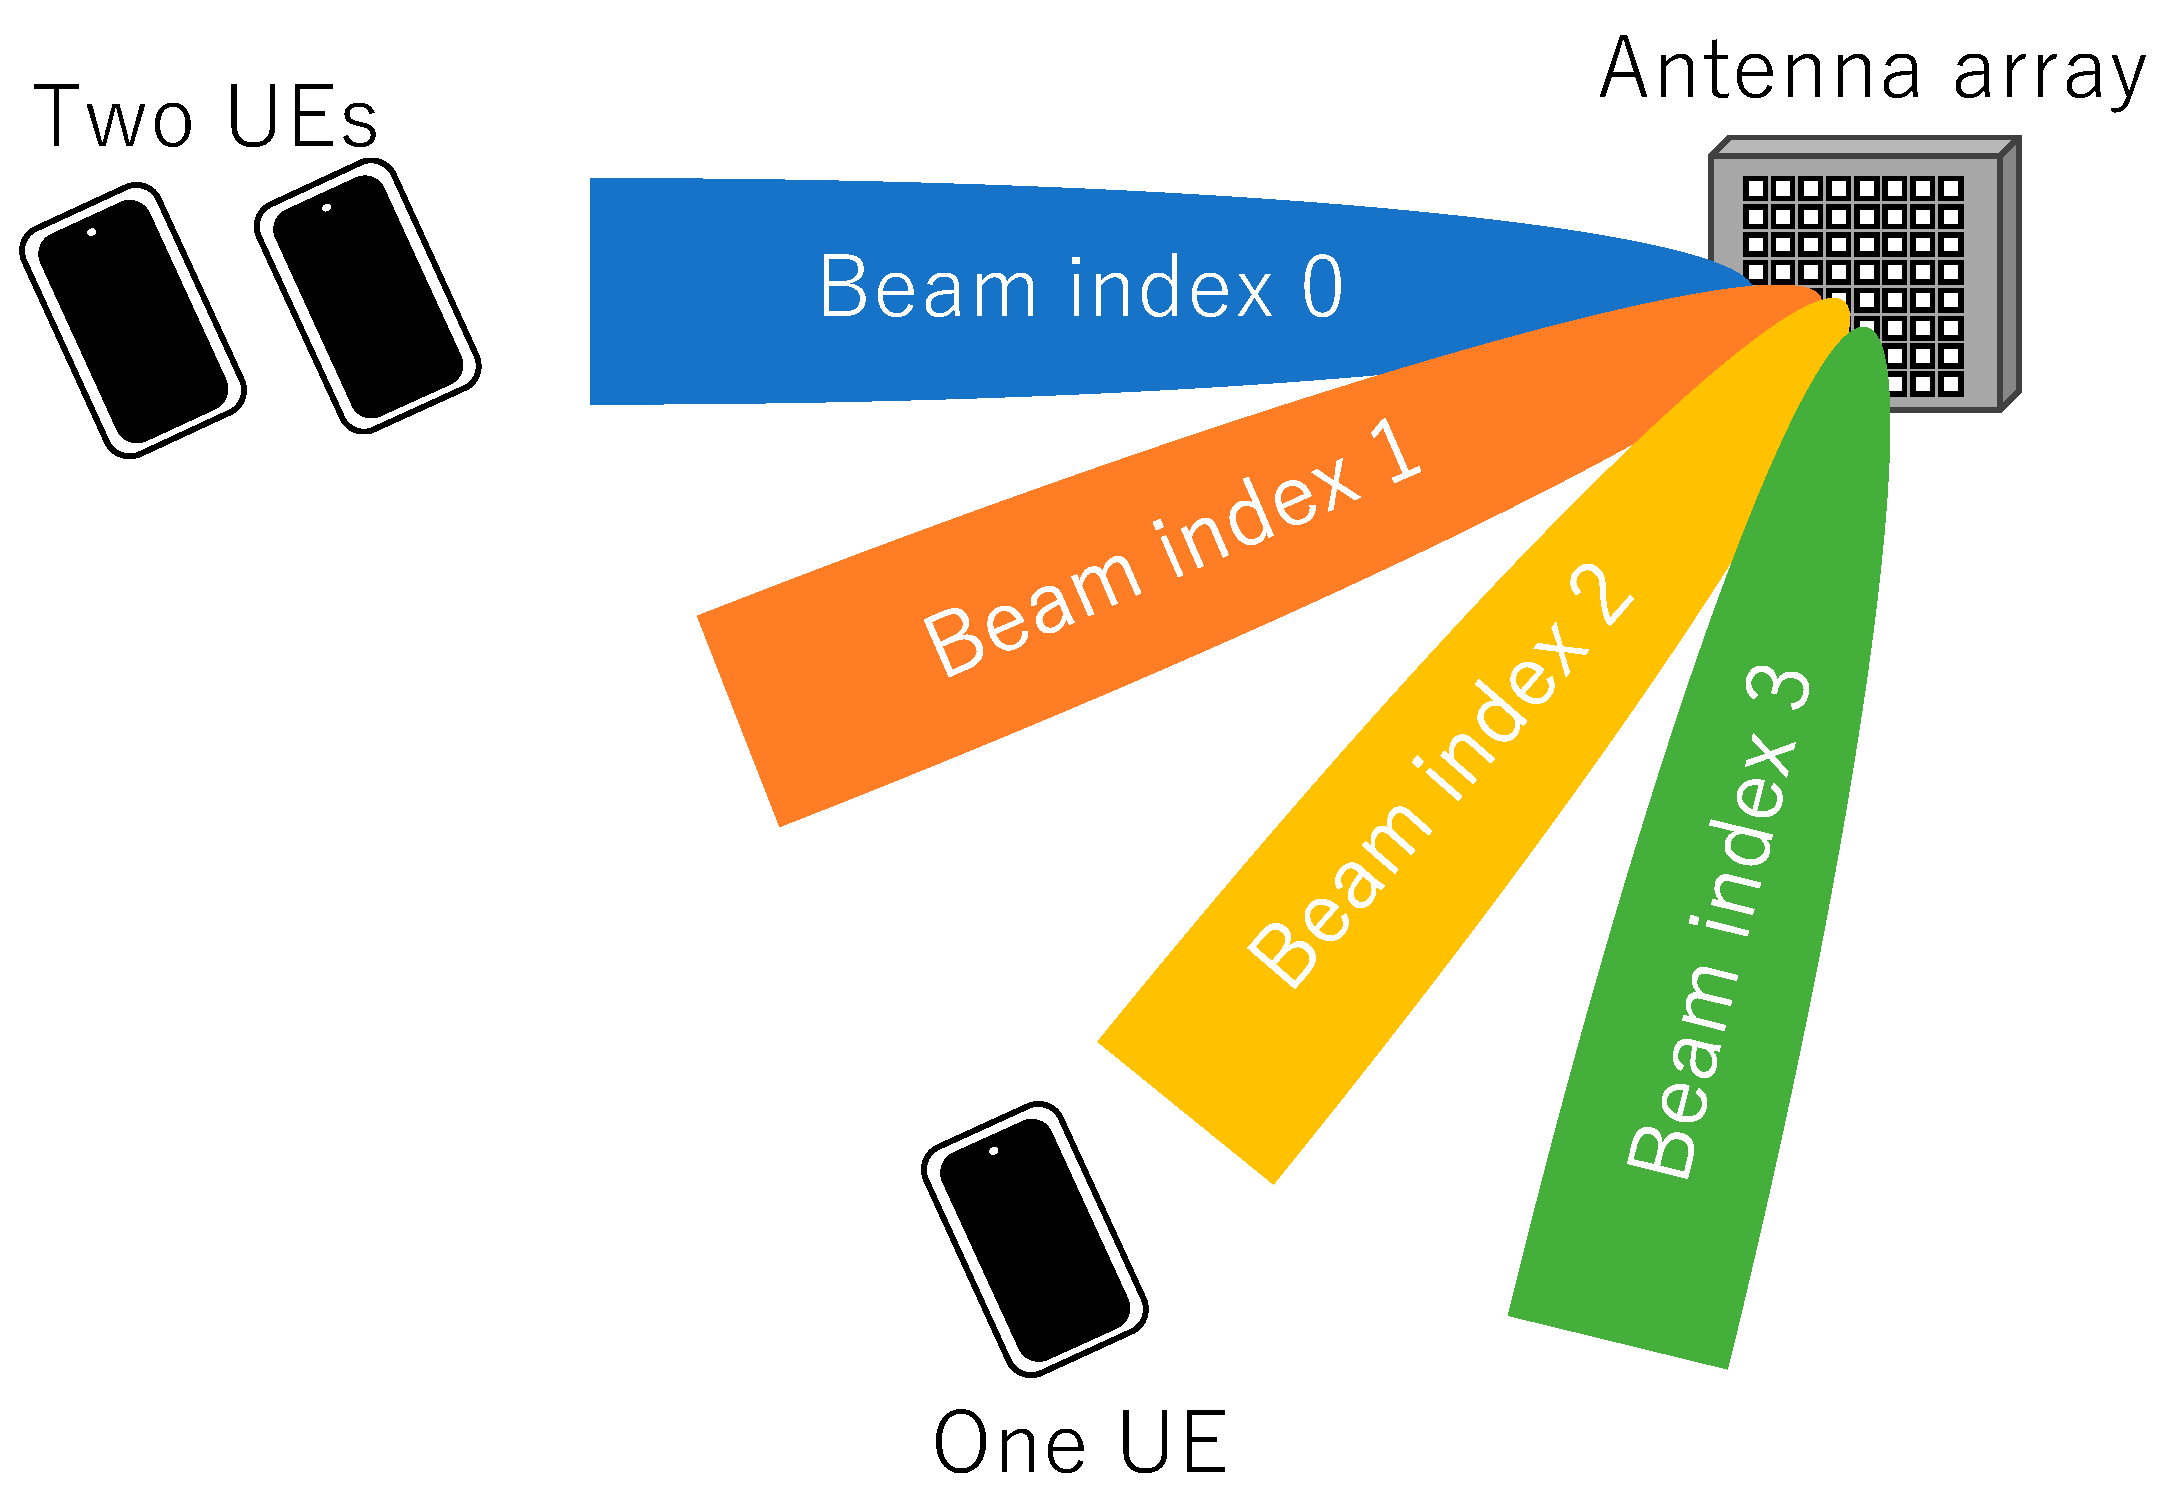
1]. Conventional RBSs transmit radio frequency signals into a spatial domain regardless of the position of each set of user equipment (UE). In contrast, BF-RBSs dynamically steer a narrow beam in the intended direction based on the UE positions [
2].
National regulations for human electromagnetic field (EMF) exposure prescribe EMF exposure restriction levels to prevent adverse health effects in humans and measurement methods for compliance assessment of EMF exposure levels. Before the installation of RBSs, mobile operators or manufacturers must conduct an RBS compliance assessment to ensure that EMF exposure levels from RBSs to humans remain below the national EMF exposure restriction levels. International guidelines for EMF exposure restriction levels are established by the International Commission on Non-Ionizing Radiation Protection (ICNIRP) [
3], and measurement methods for compliance assessment of EMF exposure levels from RBSs are prescribed by the International Electrotechnical Commission (IEC) [
4]. Several countries, mainly in Europe, have established national regulations for human EMF exposure in reference to IEC standards and ICNIRP guidelines [
5,
6]. The IEC 62232 standard [
4] prescribes compliance assessment methods for conventional RBSs, in which the compliance distance is calculated using the configured maximum transmitted power of each RBS. The mobile operators set the separation distance between the RBS antenna and humans using the calculated compliance distance.
The conventional compliance assessment method assumes that an RBS continuously transmits a beam at maximum power in a fixed beam direction [
4,
7]. On the other hand, BF-RBSs dynamically steer the beam direction, contrary to this assumption, so the conventional compliance assessment method overestimates the EMF exposure levels from a BF-RBS. Although conventional compliance assessment is conservative in terms of human EMF exposure, overestimation causes a decrease in the quality of services within the network. Due to the high antenna gain associated with millimeter waves used in 5G, this overestimation of EMF exposure levels makes the installation of RBSs more challenging. To address this overestimation, IEC 62232:2025 [
4] prescribes a new compliance assessment for EMF exposure levels from BF-RBSs, referred to as the actual maximum approach, which calculates the compliance distance based on the transmitted power averaged over a specific period (e.g., 6 or 30 min). For example, in the case of the time-division duplex (TDD) duty cycle adopted in 5G, the actual transmitted power is systemically calculated by multiplying the configured maximum transmitted power and the TDD duty cycle. In this case, mobile operators can calculate the compliance distance from the deterministic factors. Moreover, the actual maximum approach for BF-RBSs can calculate the compliance distance depending on network traffic and beam direction. The actual transmitted power is calculated using statistical methods. For example, the actual maximum approach for BF-RBS calculates the actual transmitted power using the configured maximum transmit power and time ratio of the beam emission in a specific direction. Thus, the maximum value of the actual transmitted power is analyzed based on the cumulative distribution function (CDF) of the actual transmitted power. In this approach, mobile operators use the percentile (e.g., 95th percentile) of the CDF, as specified in the national regulations.
Several statistical modeling and measurement studies have been conducted to evaluate the effectiveness of this approach [
8,
9,
10,
11,
12,
13,
14,
15]. These studies analyzed the actual transmitted power or equivalent isotropic radiation power (EIRP) from BF-RBSs. In [
8,
9,
10,
11], statistical modeling studies analyzed the actual transmitted power of a BF-RBS when changing the distribution of UE locations using statistical approaches. They demonstrated the effectiveness of the actual maximum approach using statistical models. To clarify the effectiveness of the actual maximum approach in commercial networks serving real traffic, measurement studies in [
12,
13,
14,
15] conducted measurement campaigns for BF-RBSs. In these measurement studies, the network management system provided network data used to estimate the actual transmitted power of each BF-RBS in a commercial network. Furthermore, these studies have demonstrated the effectiveness of the actual maximum approach in specific environments (e.g., a limited number of RBSs, measurement days, and measurement locations). However, few investigations have been conducted regarding the effectiveness of the actual maximum approach considering more than 100 BF-RBSs over a period of weeks. Furthermore, there is limited study about the actual maximum approach for BF-RBSs in a commercial network using millimeter waves within frequency range of 2 (FR2).
This study clarifies the effectiveness and issues of the actual maximum approach for BF-RBSs using FR2 in 5G. This study measured and analyzed the actual transmitted power from more than 400 BF-RBSs operating in a commercial network in urban areas in Japan over a month. The network data of the BF-RBSs were collected using a network management system. The actual transmitted power of each BF-RBS obtained using the network data was evaluated to clarify the effectiveness of the actual maximum approach in a commercial network and analyzed to identify potential issues with this approach using statistical modeling.
This study evaluates the effectiveness of the actual maximum approach for BF-RBSs using an unprecedentedly large sample size and extended measurement duration.
Section 2 describes the details of the maximum approach for BF-RBSs operating in a commercial network.
Section 3 and
Section 4 present the measurement method and the measurement results of the actual transmitted power, respectively. The issues facing the actual maximum approach for BF-RBSs in a commercial network are discussed in
Section 5. Finally,
Section 6 concludes the study.
2. Actual Maximum Approach
The international guidelines for human exposure specify the basic restrictions and reference levels as time-averaged over 6 or 30 min [
3]. The human exposure level from an RBS is generally proportional to the transmitted power of that. For example, the power density to which a human body is exposed is defined as follows using the simple spherical formulas [
4]:
where
[W/m
2] is power density,
is an antenna gain,
[W] is a peak transmitted power and
[m] is a distance between a human body and an RBS. The separation distance,
[m] is defined using Equation (1):
where
[W/m
2] is exposure restriction level for power density. If mobile operators can assume a lower transmitted power of an RBS, the required separation distance from that can be reduced. In the actual maximum approach, the compliance assessment for the EMF exposure level from an RBS is based on the time-averaged transmitted power over a specific period. The maximum value of the actual transmitted power,
[W], is defined as the average over a specific period:
where
[W] is the configured maximum transmitted power of the RBS during the transmission time,
is the technology duty-cycle factor, and
is the power reduction factor [
4]. From the viewpoint of the TDD adopted in 5G, the RBS transmission time is expressed as the ratio of downlink transmission time to total time. Thus,
for the 5G TDD is given by
where
is the downlink transmission time and
is the uplink transmission time. Moreover,
typically ranges from 0.75 to 0.8 depending on the special subframe format implemented by network operators [
4,
8]. In the case of the frequency-division duplex,
is 1. Therefore,
and
are deterministic values. In contrast, since
depends on network environments, such as the data traffic and beam direction for BF-RBSs, network operators need to select this value to adopt the actual maximum approach.
In this study, the
is estimated using the actual transmitted power of each BF-RBS,
, obtained from the network data via the network management system. The study in [
12] shows that the
can be estimated using the downlink utilization and number of UEs per beam as
where
is the downlink utilization,
is the number of beams, and
is the number of UEs in the
-th beam. Assuming that the volume of data traffic for each UE is the same,
is determined from the distribution of UEs per beam and downlink utilization. To evaluate the fairness of the exposure direction per beam, the ratio of the transmission time in the maximum beam direction to the average time is given by:
Here,
can be expressed as the product of
and
. Finally, the normalized actual transmitted power
, is derived using
where
is the actual transmitted power of a BF-RBS.
4. Results
The measurement results of the normalized actual transmitted power obtained using the network management system are presented in this section.
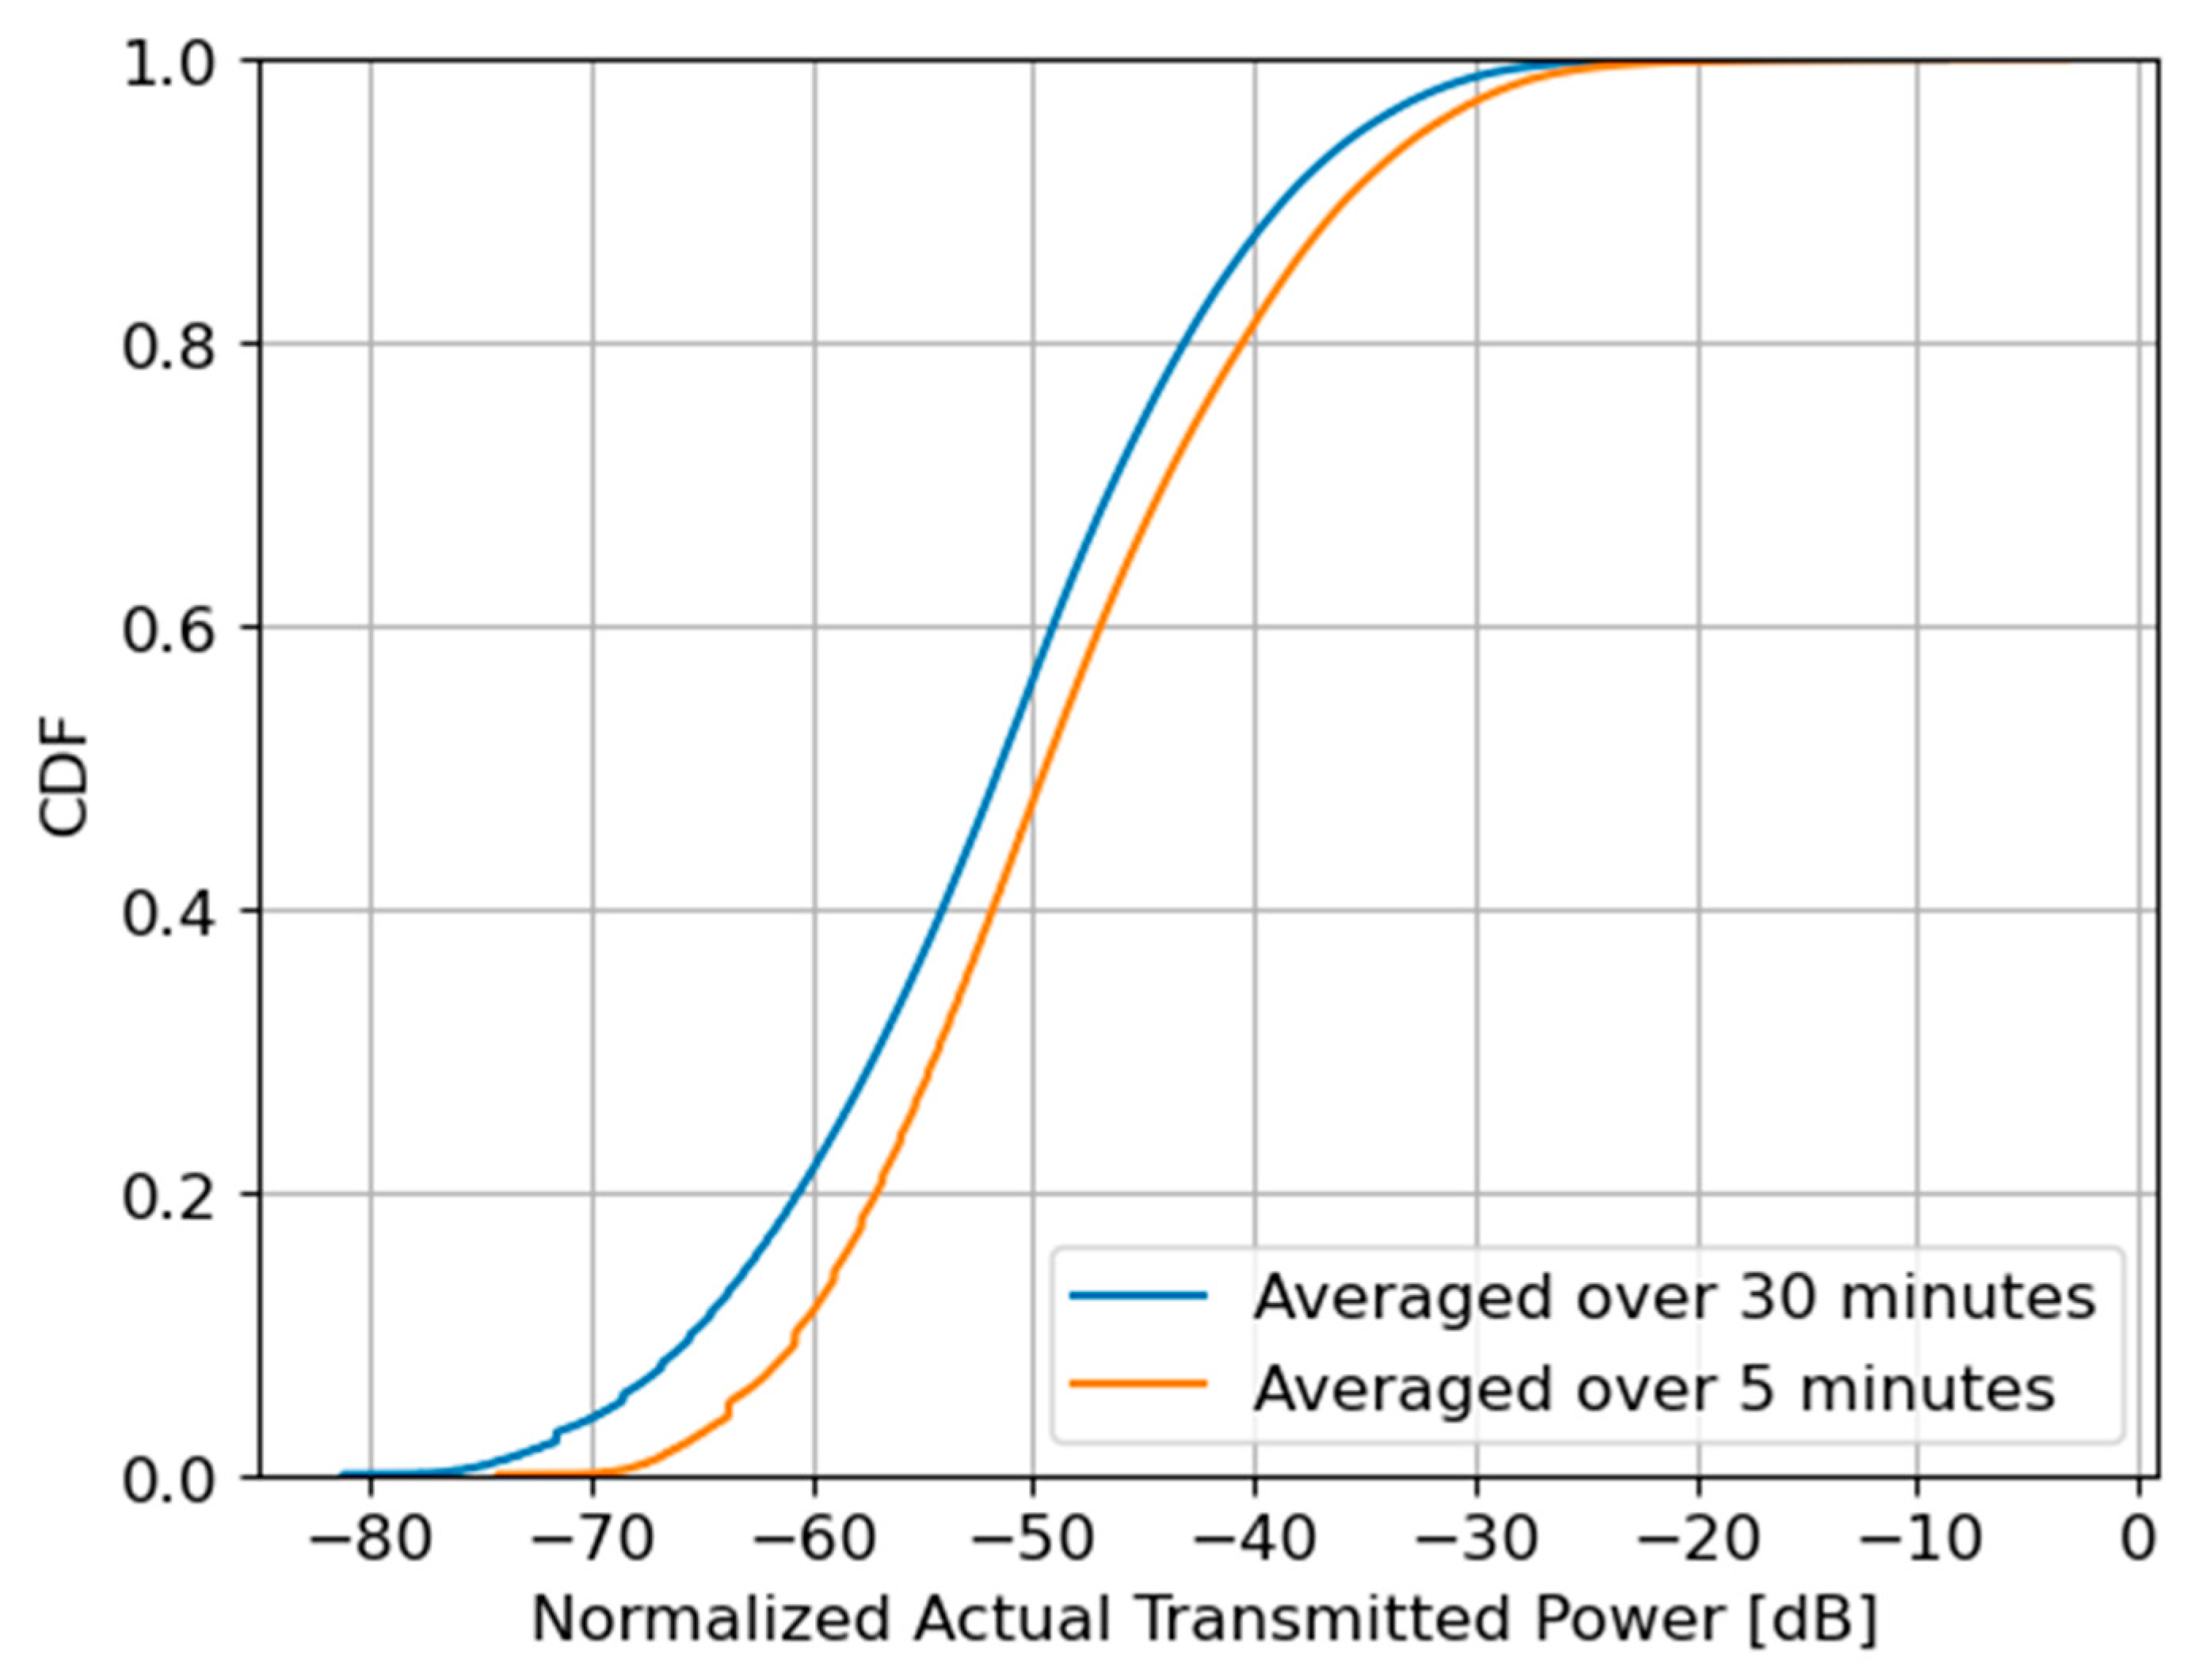
Figure 2 shows the CDF of the normalized actual transmitted power. This normalized actual transmitted power was averaged over 5 and 30 min. The maximum levels of the normalized actual transmitted power averaged for 5 and 30 min are −3.13 dB and −8.57 dB, respectively. Moreover, the power reduction factor averaged for 5 and 30 min was 0.65 and 0.19, respectively. Therefore, none of the results were at the same level as the configured maximum transmitted power of the BF-RBSs.
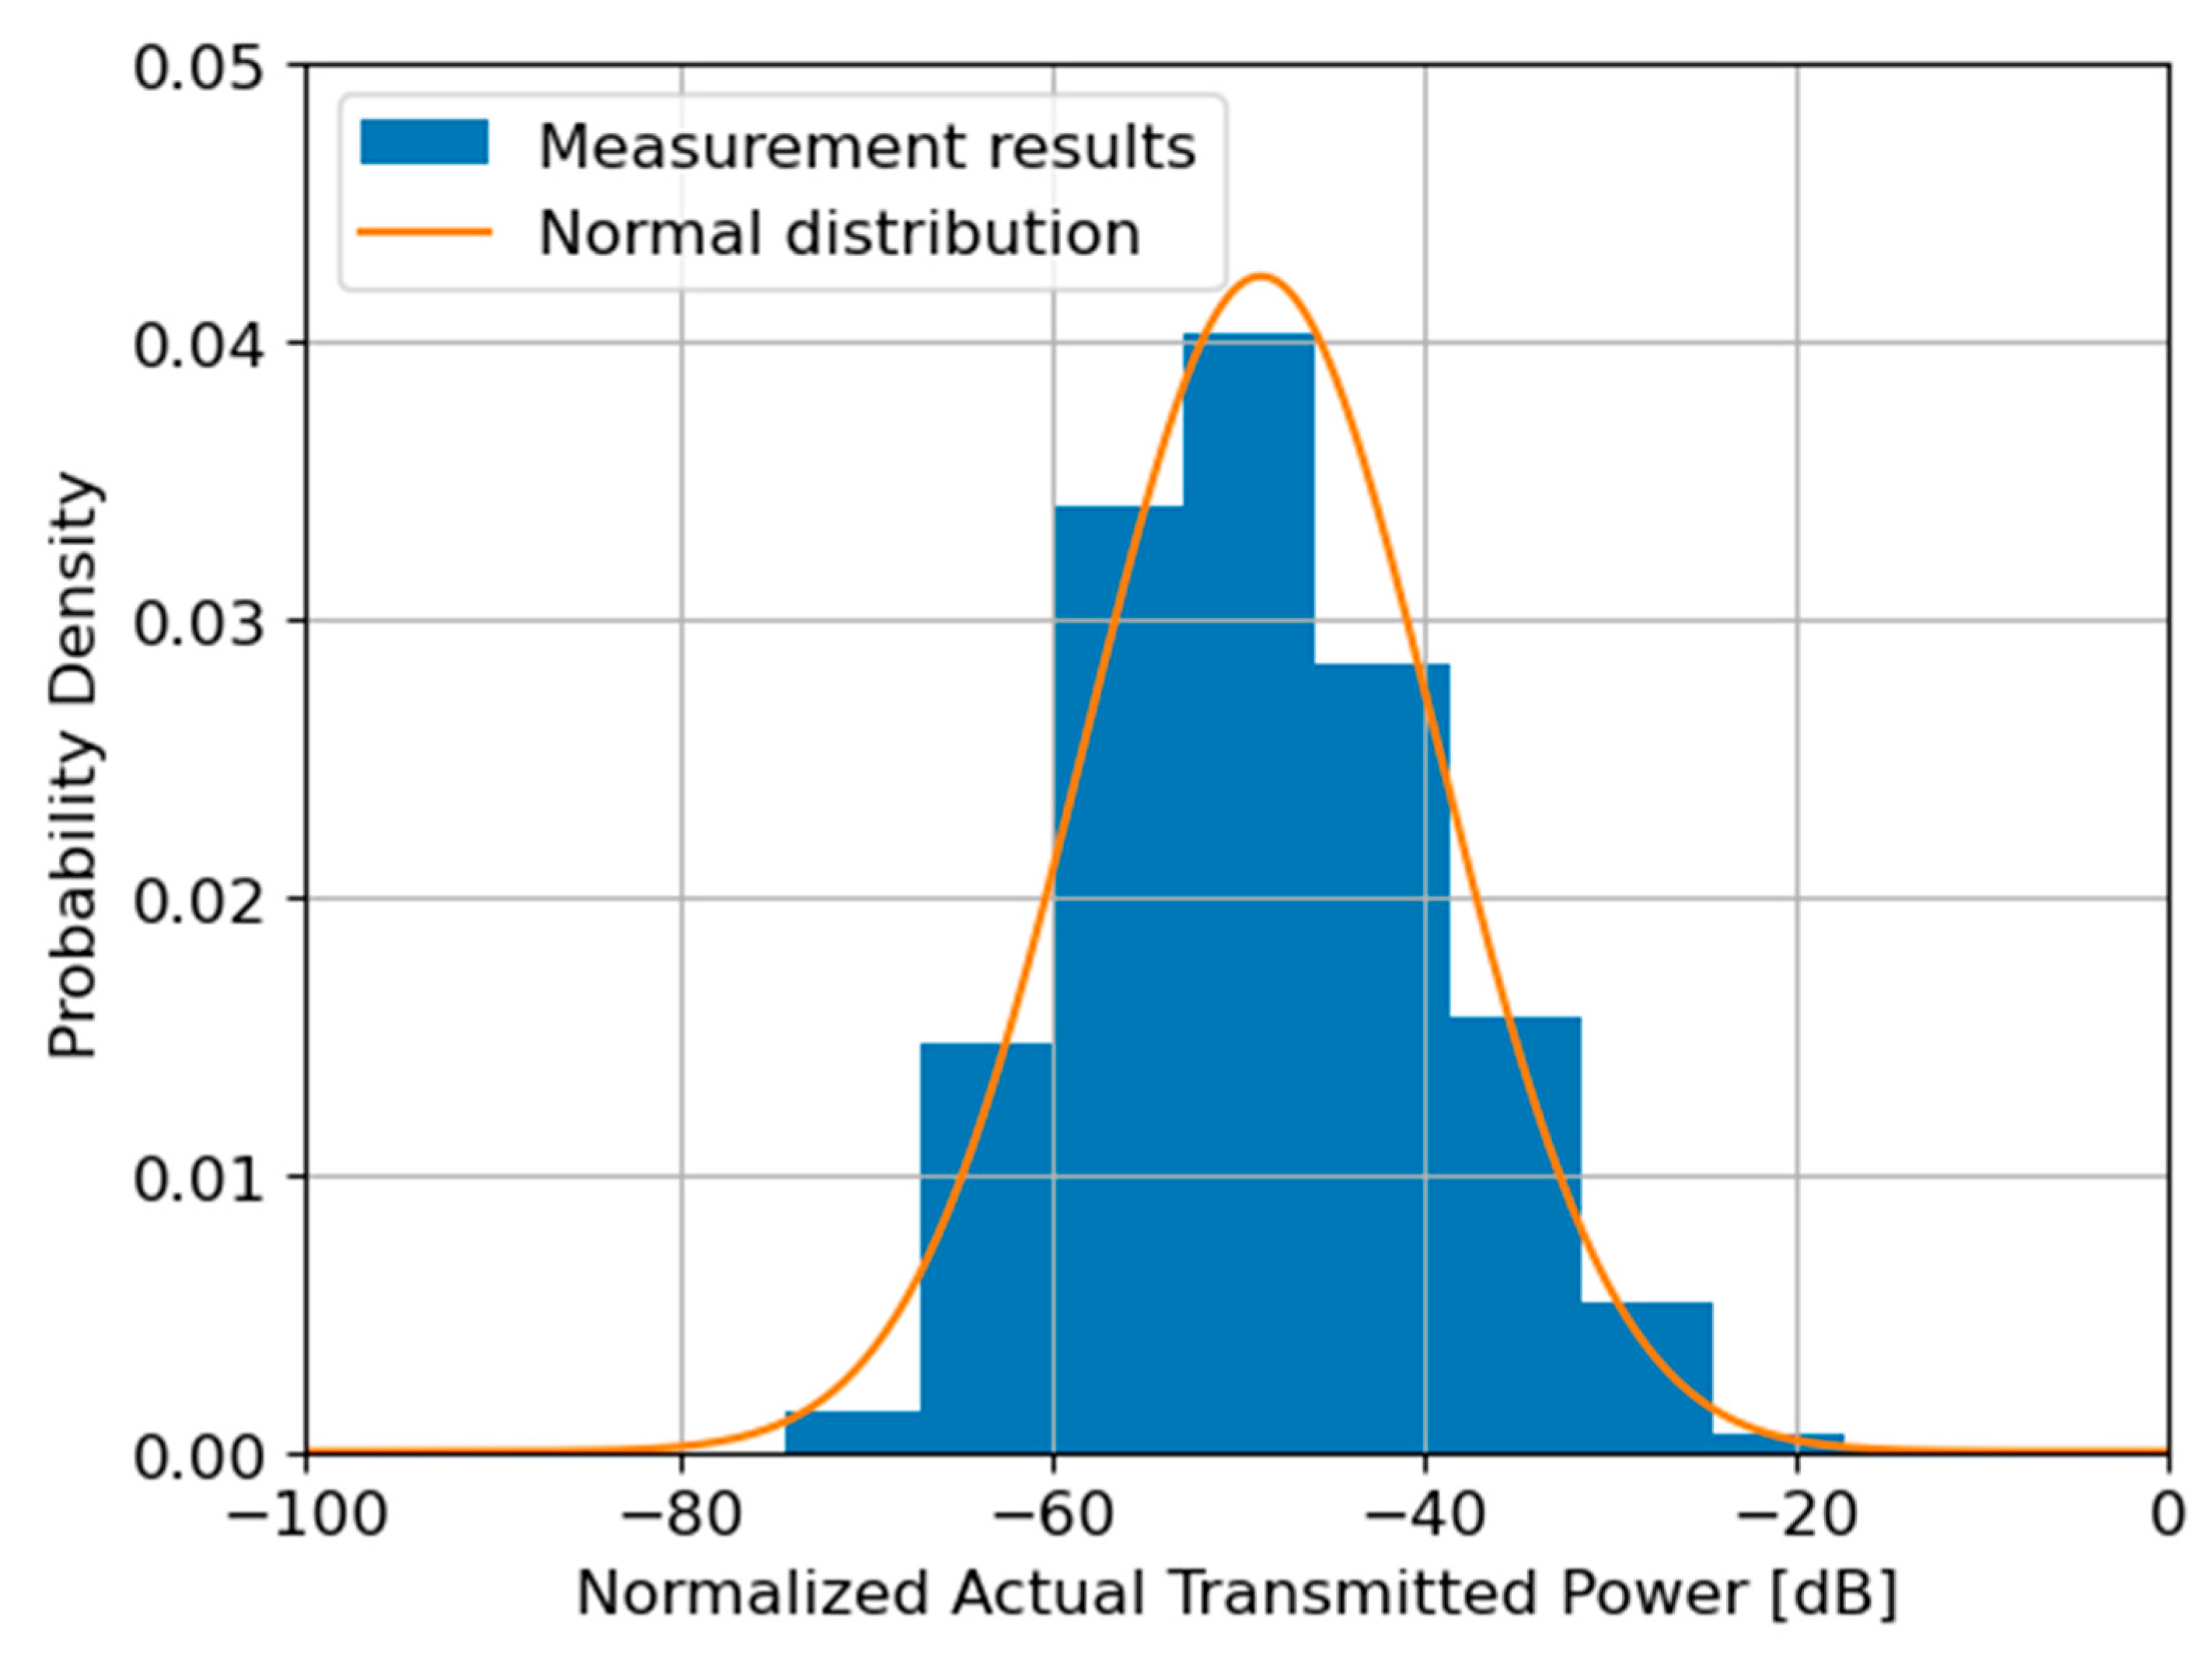
Figure 3 shows the probability density of the normalized actual transmitted power averaged over 5 min. According to the central limit theorem, the distribution of the normalized actual transmit power is approximately a normal distribution. From the measurement results, the mean
is −48.7 dB, and the standard deviation
is 9.4 dB. In the IEC 62232:2025 standard, the mobile operator selects the transmitted power threshold for each BF-RBS as the CDF percentile to refer to the network data obtained using the network management system. Since actual transmitted power distribution of BF-RBSs follows the normal distribution, mobile operators need to select the appropriate percentile of the CDF for the actual maximum approach to avoid overestimating or underestimating the EMF exposure levels from a BF-RBS.
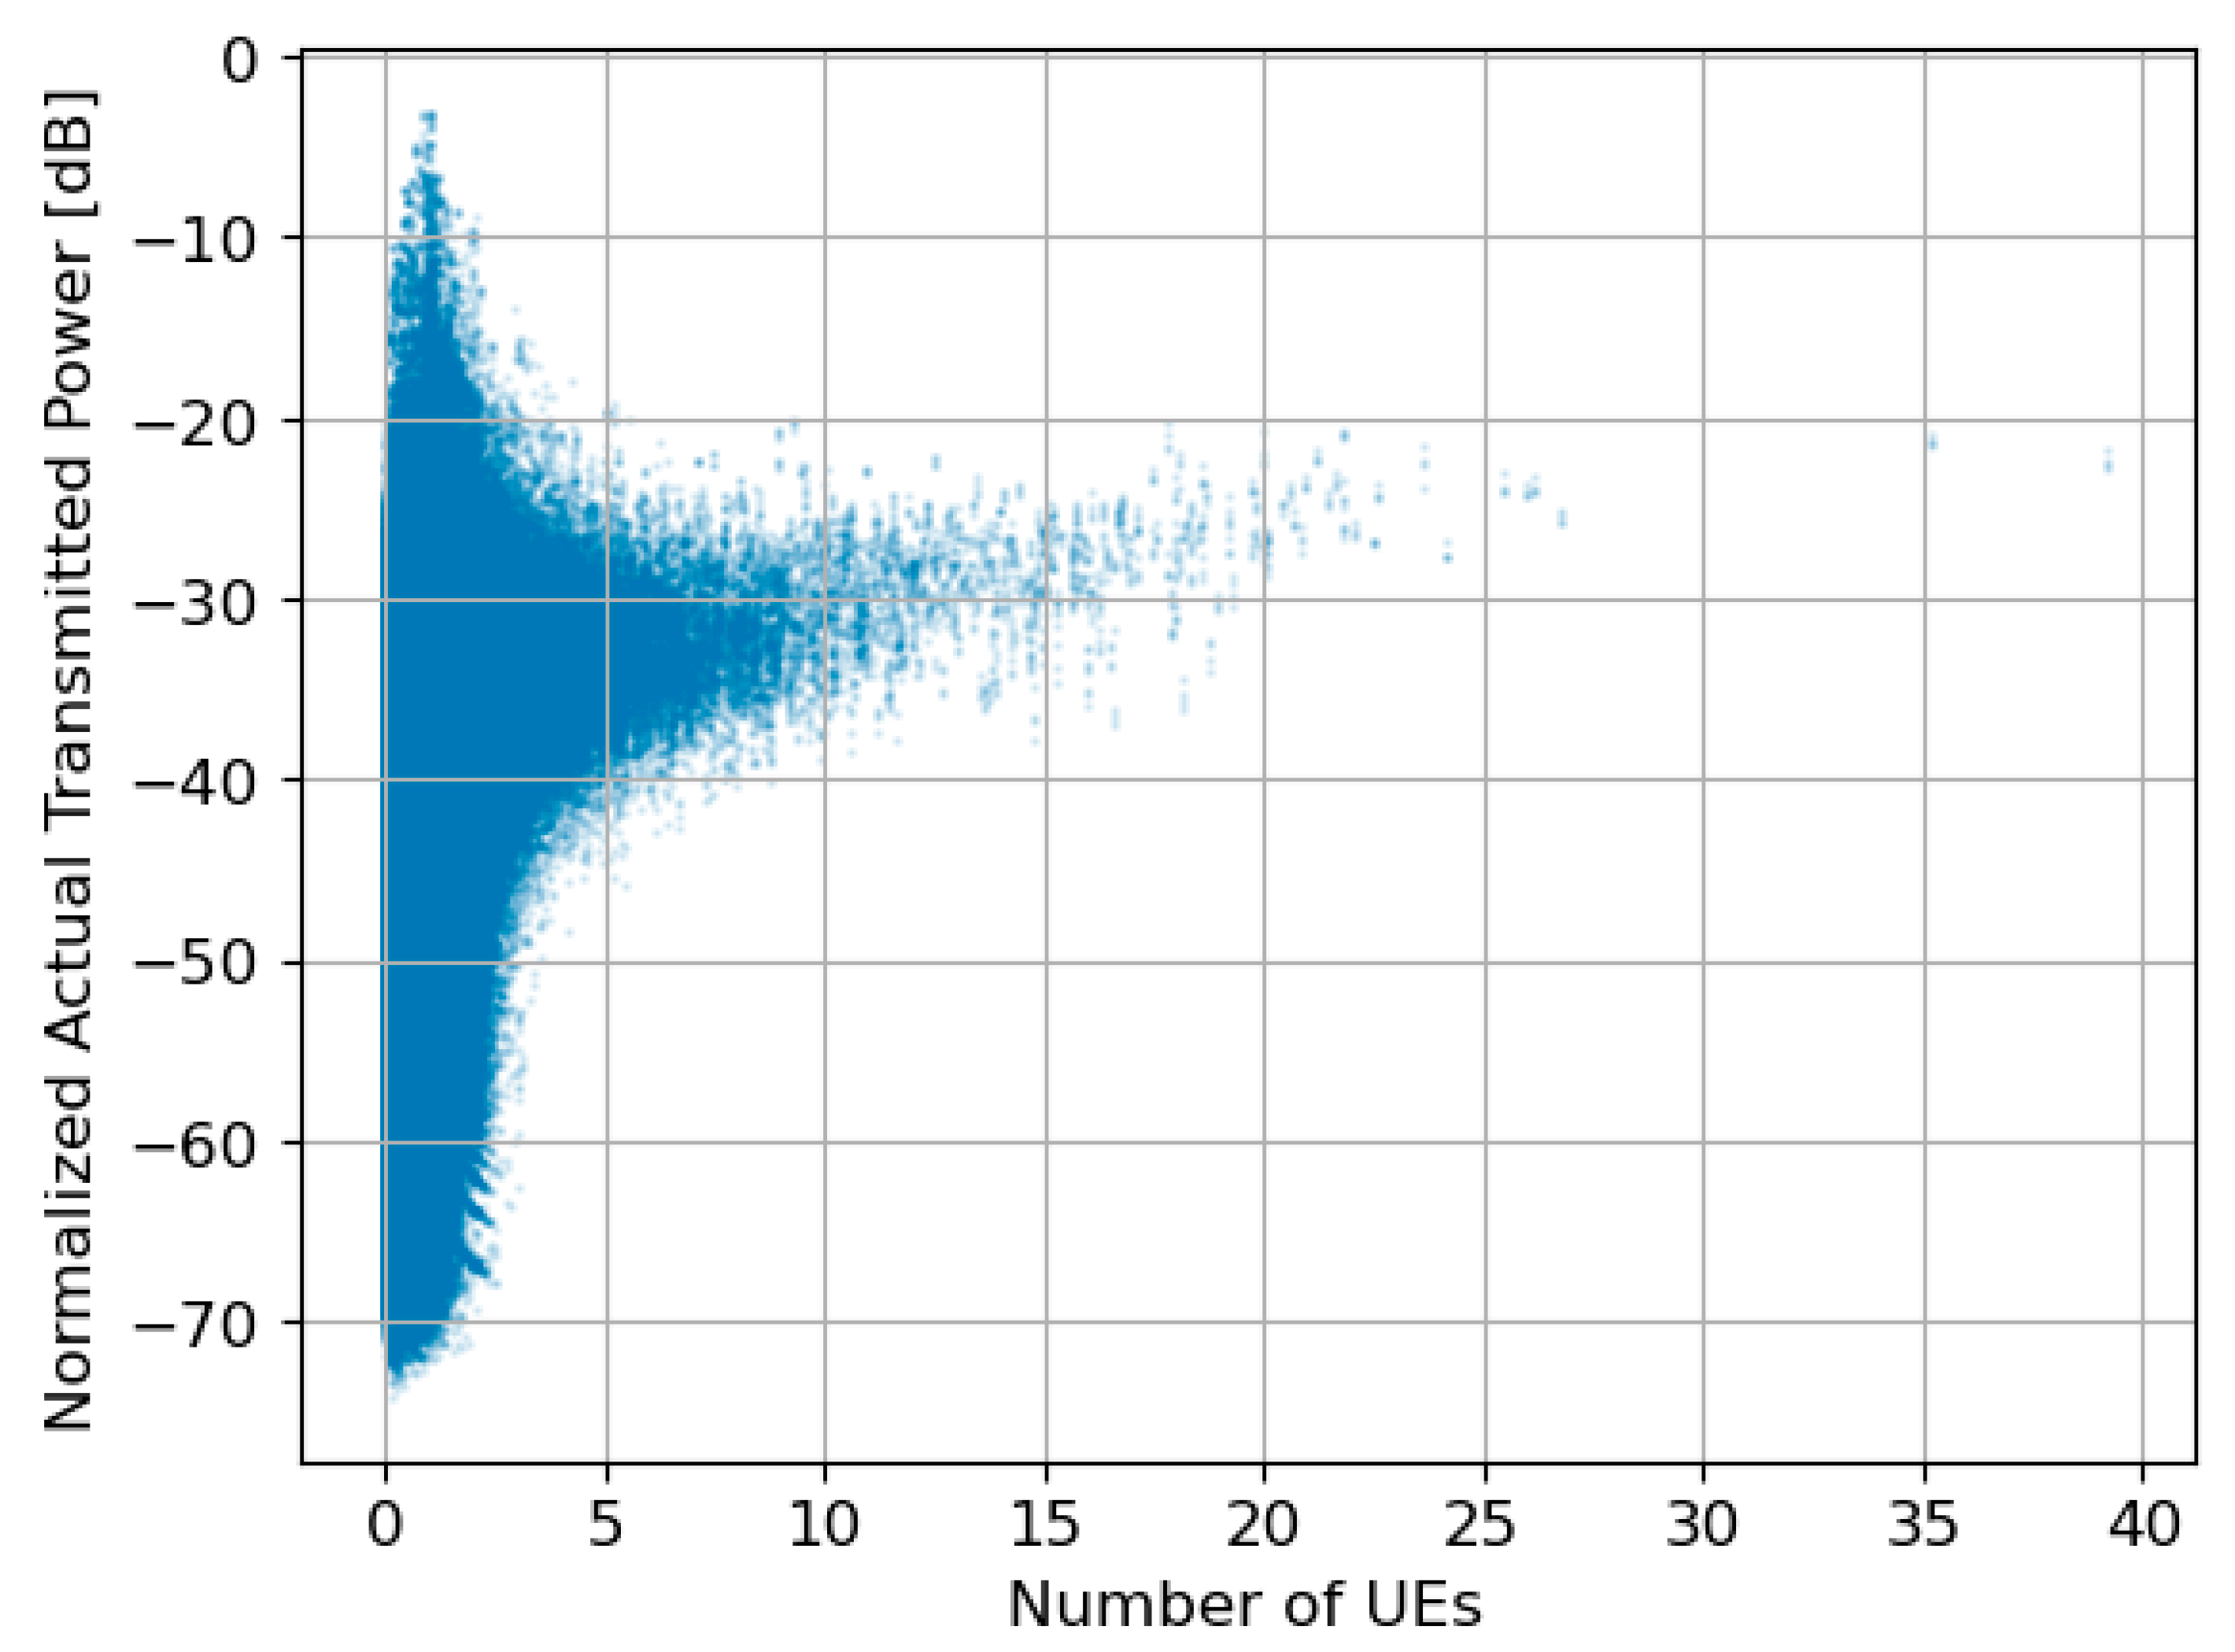
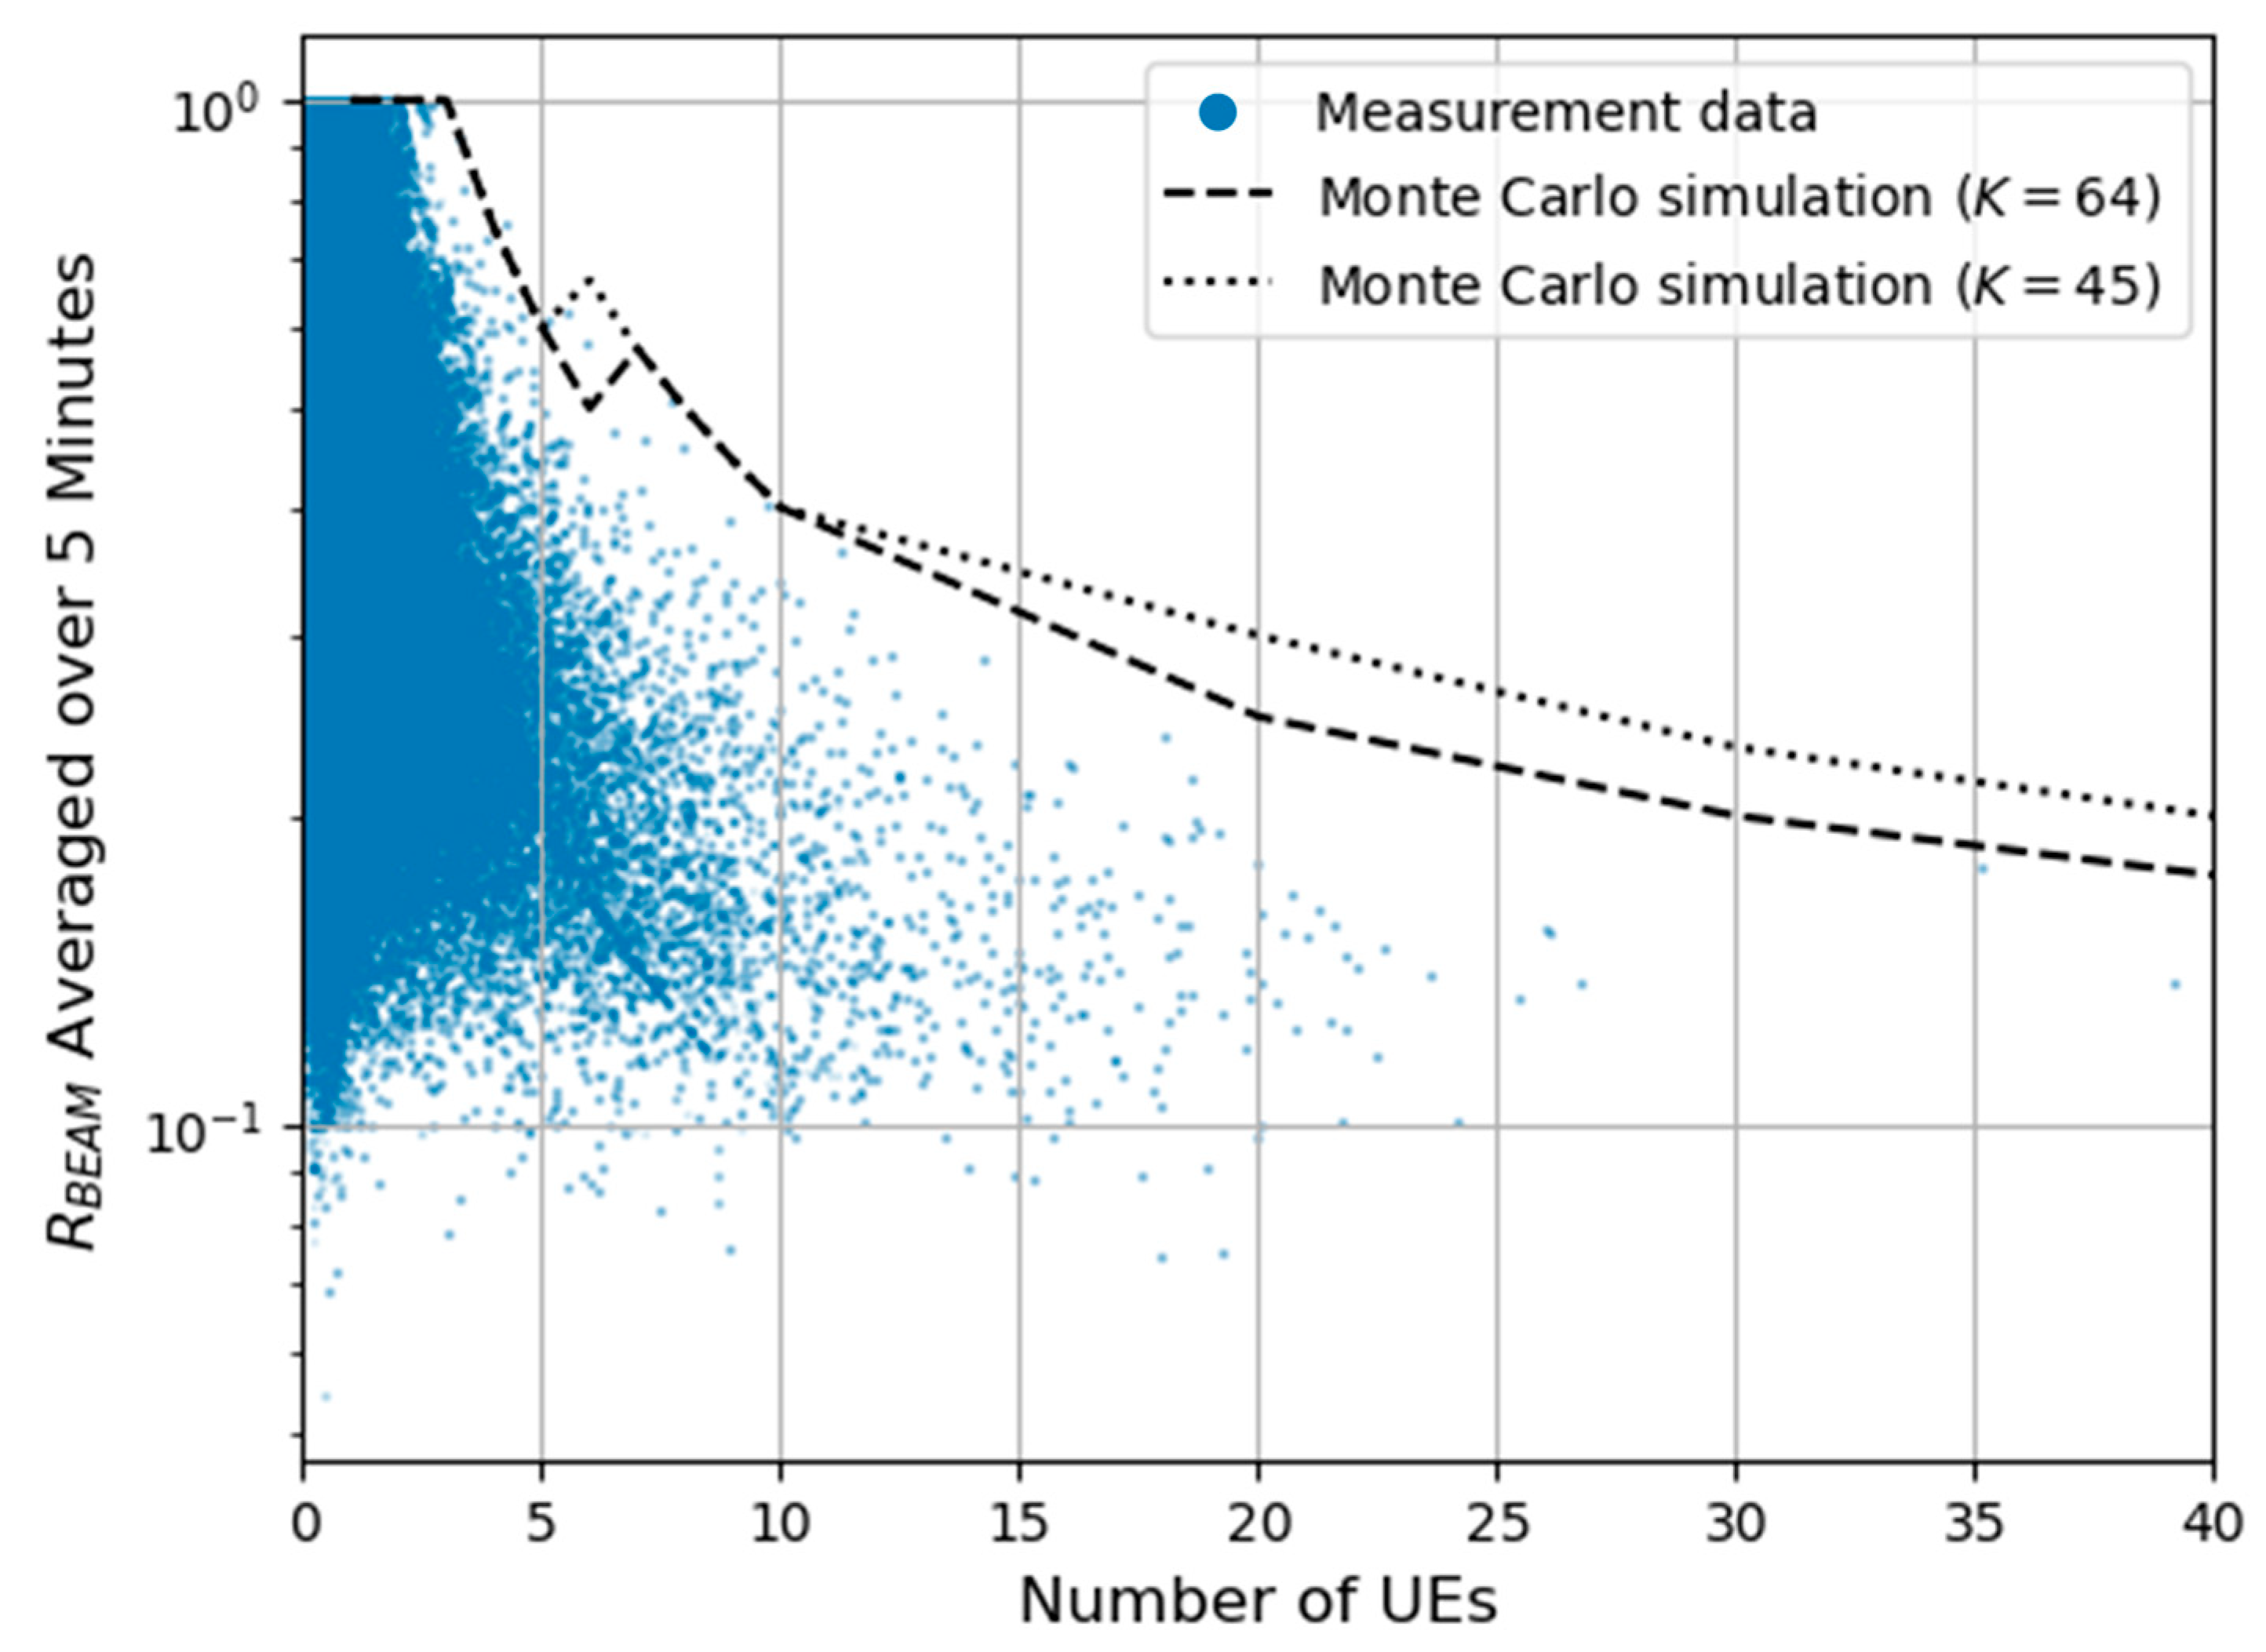
Figure 4 shows the relationship between the number of UEs and
. Overall,
increases with the number of UEs. This is because of an increase in the amount of data traffic. Moreover, the figure shows that
is highest when the number of UEs is less than three. This is because the number of UEs is biased in a specific beam direction. This principle will be discussed in the next section.
Table 1 summarizes the measurement results of previous statistical studies [
8,
9]. With respect to the 30 min average, the maximum value of
was less than the theoretical value obtained using statistical modeling. However, the maximum value of
averaged over 5 min was higher than the theoretical value obtained using statistical modeling. One interpretation is that the number of UEs in a specific beam direction is biased in a commercial network. Previous studies have considered the probability of the UE distribution per beam direction to assume a realistic situation. Therefore, a few studies have discussed situations in which the number of UEs is biased in a specific beam direction. The following section discusses this situation.
5. Discussion
As mentioned in Section IV, the actual transmitted power is at the maximum level when the number of UEs is less than three. This section analyzes the measurement data using statistical modeling with a multinomial distribution to clarify the relationship between the number of UEs and the actual transmitted power of each BF-RBS, regardless of the distance and traffic between each UE and the BF-RBS.
This section statistically considers a scenario in which the UEs connects to a single BF-RBS. The probabilities of having
users in the 1st to
th beams, respectively, can be expressed by the following multinomial distribution:
where
is the number of beams,
is the number of UEs,
is the number of UEs in the
-th beam, and
is the probability that the UE is in the
-th beam. Assuming that
follow a uniform distribution, Equation (9) can be expressed as
As shown in Equation (6), the maximum beam direction is required to calculate the actual transmitted power of BF-RBSs. Therefore, the following equations denote the probability that the number of UEs in the maximum beam direction is
.
The number of UEs in the maximum beam direction was determined from the inverse of the CDF.
where
denotes the CDF percentile. In this study, since the network data from hundreds of BF-RBSs were obtained using the network management system, the measurement datapoint size per BF-RBS was
= 8640 datapoints. Therefore, the percentile of the CDF,
, uses the 99.99th percentile of
to compute
conservatively for statistical modeling of the measurement data, considering that the size of all measurement data for hundreds of BF-RBSs is greater than
.
was computed using the Monte Carlo method while varying
. Since each UE is randomly allocated to one of the
beams,
decreases as
increases. Therefore, we consider two scenarios: one in which
is the number of antenna elements,
, and the other in which
is 70% of the number of antenna elements,
. The ratio of the maximum number of UEs in a beam to
was repeatedly computed. From the computed results, the 99.99th percentile in the CDF of
is shown in
Figure 5. In both scenarios for
and
, the computation results show that the number of UEs is biased in a specific direction when the number of UEs is three or less. In contrast, when the number of UEs is greater than 10,
converges to
. The variation in
between
is attributed to the increase in
and the denominator of
, whereas
remains constant.
.
Consequently, when the number of UEs is always large (e.g.,
), the actual maximum approach is effective in avoiding overestimation of the transmitted power for BF-RBSs. As shown in previous studies [
8,
9],
is reasonable. However, when the number of UEs is possibly small (
), mobile operators should apply the conventional method when installing BF-RBS or control the actual transmitted power of BF-RBSs by monitoring the network management system to avoid underestimating the actual transmitted power in a specific beam direction.
From the viewpoint of propagation, the number of UEs using FR1 is greater than that using FR2 in many commercial networks [
17,
18]. In this study, the period during which the number of UEs was three or more accounted for only approximately 1% of the month. In contrast, it is estimated that cases where the number of UEs is less than three are rare in the BF-RBSs for FR1. However, the previous measurement study [
13] also showed that the actual transmitted power from BF-RBSs for FR1 was the maximum when the number of UEs was less than ten. Based on the measurement and Monte Carlo simulation results, when the number of UEs was 10 or more, there were no cases in which more than 50% of all UEs were concentrated on a specific beam. On the other hand, this study does not exclude certain situations in which UEs were concentrated on a specific beam due to geographical factors. From a conservative perspective, this study concludes that mobile operators should control and monitor the actual transmitted power of BF-RBSs, regardless of whether they are for FR1 or FR2.
Secondly, this study discusses the difference between the 5 and 30 min averaged
in
Table 1. As mentioned in
Section 4, the distribution of the actual transmitted power was approximately a normal distribution. Let
and
denote the probabilities that the 30 and 5 min averaged actual transmitted power below the threshold,
, respectively. Assuming that the 5 min averaged actual transmitted power follows a normal distribution, the relationship between
and
is as follows.
When assuming that the
and
of the 5 min averaged actual transmitted power distribution is −48.7 dB and 9.4 dB described in
Section 4, the 99.999th percentile of
is approximately −9 dB. The corresponding value for
is calculated as follows:
However, the maximum value of
for 30 min average was −8.56 dB in this study. This reason was due to the fact that each 5 min averaged actual transmitted power exhibits temporal bias, especially in situations where the actual maximum transmitted power is high.
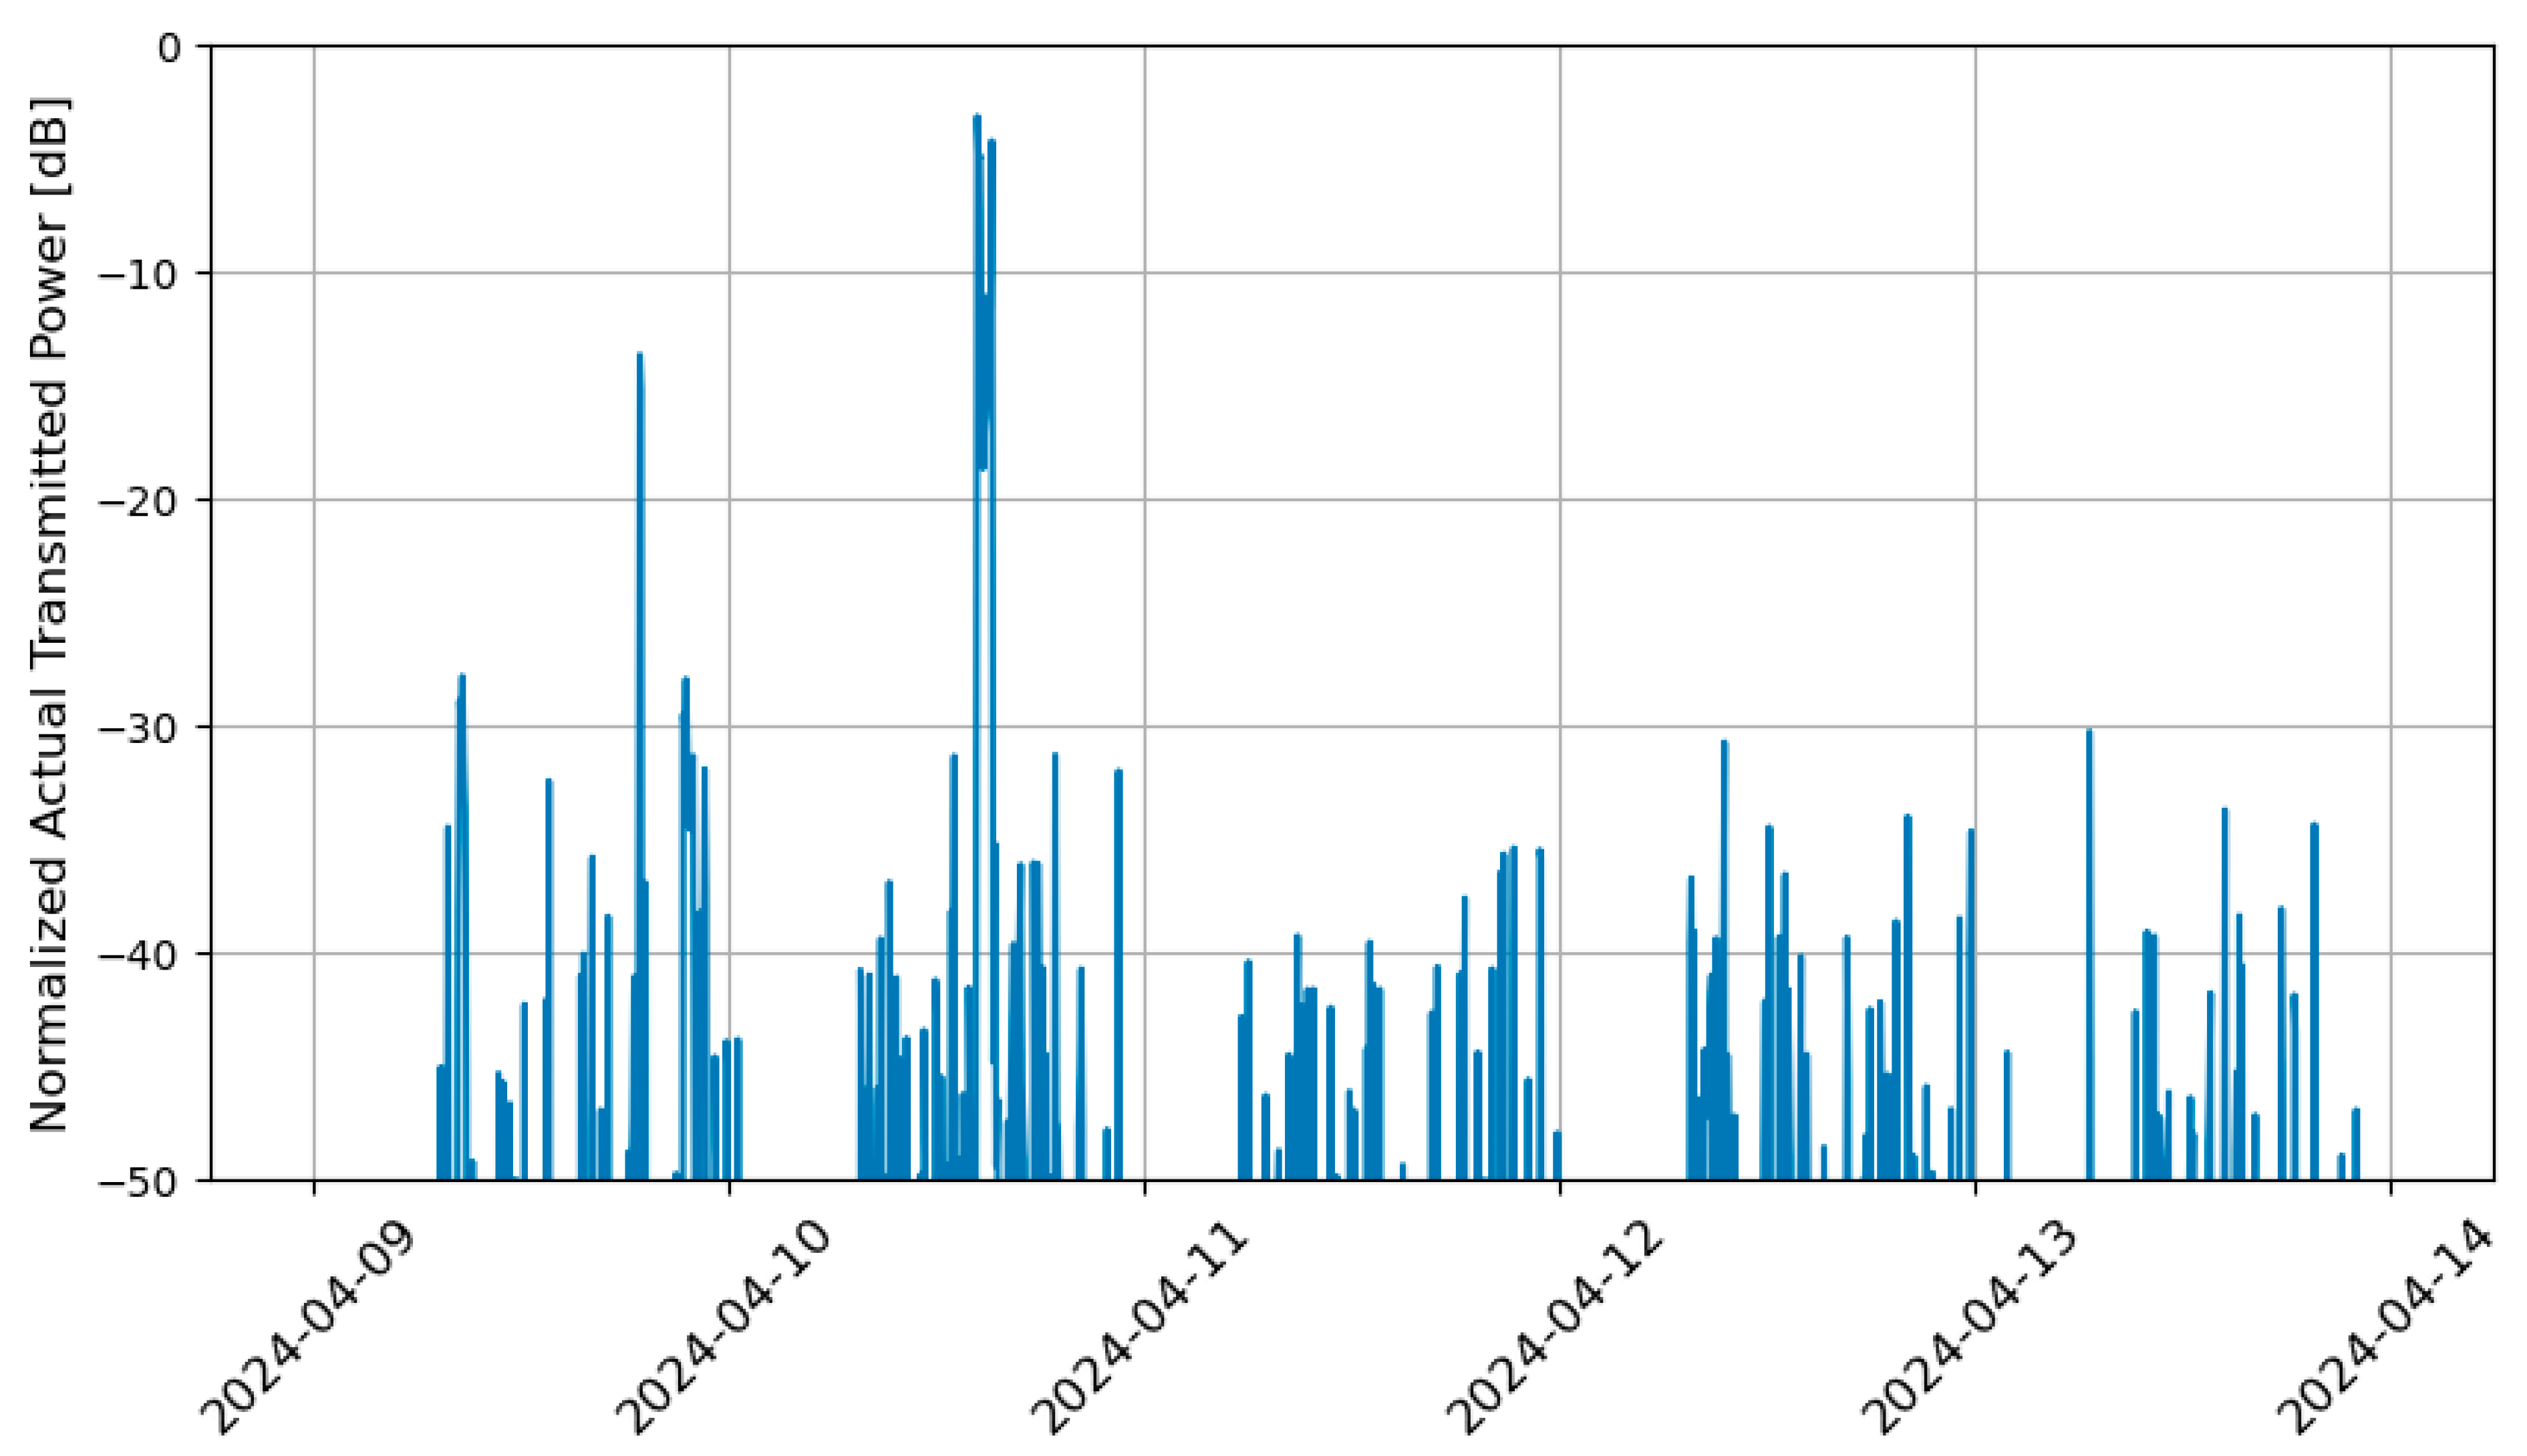
Figure 6 shows an example for the time variation in normalized actual transmitted power averaging 5 min at the BF-RBS with the maximum
. As shown from
Figure 6, it is evident that the actual transmitted power exhibits periods of elevated levels. In particular, the actual transmitted power was higher during the daytime than at night. On the other hand, since there were no continuous 30 min periods during which the
reached −3 dB, this is considered to have caused the difference between the 5 and 30 min averaged
.
Finally, this study discusses the reasons why the 30 min averaged
in this study was lower than that reported in previous statistical studies [
8,
9]. As mentioned in
Section 3, the antenna array size of the BF-RBSs in this commercial network was
. Moreover, the beam range was more than
in azimuth and more than
in elevation. To maintain stable wireless communications, each beam is generally designed to overlap. Consequently, the human EMF exposure levels are influenced not only by the main beam, but also by the side lobes of adjacent beams. In the context of this study, in addition to the number of UEs in the main beam,
must also account for the number of UEs in the adjacent beams to enable an accurate comparison of actual human EMF exposure levels with those values. Previous statistical studies [
8,
9] have evaluated the actual maximum approach in consideration of the influence from the side lobes of other beams. Furthermore, these studies adopted conservative assumptions compared to real commercial network, such as network traffic and UE spatial distribution. These factors are considered to be the reason why the
measured in this study was lower compared to that in previous statistical studies.
In contrast, previous study [
12] compared the actual transmitted power calculated using Equation (5) with on-site measurement exposure levels using measurement equipment. According to that study, the actual transmitted power derived using Equation (5) was found to be more conservative compared to the actual exposure levels; however, a noticeable discrepancy remained between the transmitted power and exposure levels. Therefore the
measured in this study is useful for clarifying the effectiveness and issues of the actual maximum approach; nevertheless, the future study should address the calculation of FPR considering the impact of sidelobes from adjacent beams for the compliance assessment of an RBS installation.
