1. Introduction
The use of electric vehicles (EVs) and plug-in hybrid electric vehicles (PHEVs) has been rapidly increasing in recent years, leading to growing public concern about exposure to electromagnetic fields (EMFs) emitted by these electrified vehicles. It was shown through a survey that concerns about EMF exposure can influence consumer purchasing behavior [
1]. Specifically, providing information about EMF exposure was found to reduce the rate at which people chose hybrid vehicles (HEVs), compared to when no such information was provided. Addressing the anxiety and distrust that people may feel regarding EMF exposure from electrified vehicles requires clear and accurate communication about the levels of EMF emitted by these vehicles. This is an essential aspect of effective risk communication.
In 2013, we reported measurements of MFs in EVs, HEVs, and internal combustion engine vehicles (ICEVs) [
2]. However, in Japan, information on MF measurements in commercially available EVs and HEVs remains very limited. Moreover, the 2013 measurements were conducted on a dynamometer, without any measurements performed during actual road driving. As a result, in Japan, measurement data on EMFs under real-world driving conditions have scarcely been published.
Furthermore, while EVs and PHEVs have seen rapid global adoption in recent years, the international standard IEC 62764-1:2022 [
3], which specifies methods for measuring the magnetic flux density (MFD) in vehicles, has been published. IEC 62764-1:2022 defines a methodology for assessing exposure to multiple MF sources in passenger cars and light commercial vehicles. It specifies the operating conditions, measurement volume, and measurement surfaces. This standard is applicable to the assessment of human exposure to low-frequency magnetic fields (MFs). While a few studies (e.g., [
4]) have conducted MF measurements based on IEC 62764-1:2022, the overall number of such investigations remains limited, and no measurement data have been published in Japan to date.
Therefore, we decided to conduct new measurements targeting vehicle models currently sold in Japan. This study aims to perform IEC-compliant EMF measurements during actual driving on a test course—an approach not implemented in the 2013 study—and to compare the results with reference levels, with the goal of publishing findings that can be used for risk communication with the public regarding EMFs, particularly for those who are concerned about MF exposure inside vehicles such as electrified vehicles.
2. Measurement Standards and Guidelines Related to Exposure Assessment in the Field of EVs
This section summarizes relevant content from existing documents on the measurement and limitation of EMFs generated by electrically driven vehicles (EVs, HEVs, and PHEVs).
2.1. IEC 62764-1:2022
IEC 62764-1:2022, measurement procedures of MF levels generated by electronic and electrical equipment in automotive environments—Part 1: Low-frequency MFs with respect to human exposure (IEC 62764-1, 2022) [
3], specifies measurement methods for low-frequency (1
Hz to 100
kHz) MFs inside vehicles classified as category M1 (vehicles for the carriage of passengers with up to nine seats, including the driver’s seat) and N1 (vehicles used for the carriage of goods with a maximum mass not exceeding 3.5 tons).
This applies broadly to all vehicles, without limitation to EVs, HEVs, or PHEVs, regardless of their drive or propulsion system.
Measurement methods for MFs are specified for stationary conditions, driving conditions, and cable-connected charging.
Measurements can be conducted during actual driving either on a test track or using a chassis dynamometer. The dynamometer must be capable of appropriately reproducing real driving load conditions, including cruising, acceleration, and braking. The gradient of the test track is set within a range of ±2%.
The spatial region targeted for measurement is defined as the area accessible to the bodies of the driver and passengers. These include the passenger compartment, cargo area, engine, and surrounding external areas of the vehicle.
Measurements are performed using equipment equipped with a probe of up to 100 cm2, capable of covering the frequency range from 1 Hz to 100 kHz. The entire volume is scanned to locate and measure the position of maximum MF exposure.
2.2. The International Commission on Non-Ionizing Radiation Protection (ICNIRP) Guideline
The ICNIRP 2010 guidelines [
5] establish scientifically based exposure limits designed to protect human health against adverse effects of low-frequency electric and MFs in the frequency range of 1
Hz to 100
kHz. These guidelines distinguish between basic restrictions and reference levels. Basic restrictions are defined in terms of induced electric fields in the body, which are directly related to established health effects such as nerve stimulation. These limits are not directly measurable in situ, so the guidelines also specify operational reference levels for external electric and MFs, which are derived to ensure compliance with the basic restrictions under worst-case exposure scenarios. The ICNIRP framework is internationally recognized and is widely adopted in standards and regulatory approaches for assessing public and occupational exposure to low-frequency EMFs.
The ICNIRP 2010 guidelines specify reference levels as operational tools to facilitate compliance assessment with the basic restrictions on induced electric fields within the human body. For MFs, these reference levels are defined over the frequency range of 1 Hz to 100 kHz and are expressed in terms of MFD (µT).
These MFs reference levels are derived from the basic restrictions using conservative coupling models that account for worst-case exposure conditions. Their purpose is to ensure that if the external MFD remains below the reference level, the induced electric fields within the body will not exceed the basic restrictions under any realistic exposure scenario. By comparing with the ICNIRP reference levels, it is ensured that exposure remains at a level that prevents known harmful acute effects (such as nerve stimulation).
Table 1 shows the reference levels (RMS) for public exposure to MFs.
ICNIRP 2010 guidelines specify that in cases of simultaneous exposure to MFs at multiple frequencies, a conservative additive approach should be used to evaluate compliance. This involves summing the ratios of the exposure levels at each frequency to their respective reference levels. Compliance is confirmed if the total sum is less than or equal to one. The assessment was performed based on Equation (1).
Hj: the magnetic field strength at frequency j.
Hr,j: the magnetic field strength reference level at frequency j.
3. Literature Review
This section reviews previous studies on MF measurements conducted for various types of vehicles, including electric vehicles, and related equipment, providing an overview of measurement methodologies, key findings, and their implications for safety assessment.
3.1. Studies on EVs
Various studies have been conducted on human exposure to EMF generated by EVs. The MFD was measured in the rear seats of ten different EVs during various driving sessions. Measurements were conducted during low-speed driving at 40 km/h, as well as during acceleration and deceleration at 2.2 m/s
2 [
6]. The results showed that the MFD measured in the rear seats was well below the reference levels set by ICNIRP [
6]. Measurements were performed to evaluate the intensity and distribution of direct current (DC) and alternating current (AC) EMFs in EVs [
7]. The study revealed that both DC and AC EMFs are generated by EVs, and their characteristics vary depending on operating conditions such as standstill, idling, and driving at 40 km/h and 80 km/h. The study also found a correlation between the AC and DC components of the electromotive force. Importantly, the measured values were far below the exposure limits established by regulatory bodies, including ICNIRP and the Institute of Electrical and Electronics Engineers (IEEE).
A simulation analysis of human EMF exposure inside EVs was conducted to estimate MFD; induced electric field strength; and induced current density during standstill, low-speed driving, acceleration, and deceleration [
8]. The results showed that the estimated exposure levels were well below the limits specified in GB 8702-2014 [
9] and by ICNIRP.
Measurements of combined EMFs inside EVs were carried out, covering static magnetic fields (SMFs), extremely low frequency (ELF) MF, and radiofrequency (RF) EMFs [
10]. The measured EMF components were found to comply individually with the exposure limits specified in international labor regulations and guidelines for short-term human exposure [
6,
11,
12,
13,
14,
15]. Additionally, RF exposure inside EVs was found to originate not only from external wireless communication systems but also from in-vehicle sources such as occupants’ mobile communication devices and Wi-Fi router antennas.
Long-term monitoring was conducted to investigate changes in MFs generated by vehicles due to repairs and inspections [
16]. MFD was measured over two years using three car-sharing vehicles. Measurements were carried out in both the front and rear seats during acceleration and steady-speed driving. The results showed that MFD and its spectral components changed when parts or hubs were replaced, whereas routine inspections and maintenance did not affect the vehicle’s MFD. It was suggested that repairs involving part replacement could lead to variations in the leakage of MFs.
The inverter of an EV generates strong EMFs during operation, potentially exposing the driver and passengers to these fields for extended periods. This study treats the EV inverter as the electromagnetic source and performs numerical simulations to evaluate the MF exposure levels for occupants in the driver’s seat and rear seat. Although the results are below the ICNIRP guidelines, it was confirmed that the exposure level is higher in the driver’s seat, which is closer to the inverter, compared to the rear seat [
17].
Furthermore, research has been conducted on the effects of high-frequency EMFs generated by EV drive motors during vehicle operation on cardiac pacemakers. In this study, the EV drive motor is considered as the EMF source, and numerical analyses were performed to evaluate the induced electric fields, specific absorption rate (SAR), and temperature rise in passengers with pacemakers, confirming that all values remained below the ICNIRP guidelines, thereby providing scientific evidence to ensure safe use of EVs for such passengers [
18].
3.2. Studies on HEVs/PHEVs
Regarding research on HEVs and PHEVs, MF measurements were conducted on three full-hybrid vehicles and three part-hybrid vehicles [
19]. Measurements were performed under idling conditions, during driving at 20–40 km/h, and at 80–120 km/h. In all vehicles, the measured MFD was below the ICNIRP reference levels. The highest measured values were generally located near the rear seat footwells, and significant increases in MFD were observed during braking and acceleration.
Measurements were carried out on a PHEV under four different driving conditions: standstill (idling), urban driving at 50 km/h, highway cruising over 100 km/h, and braking [
20]. MF exposure during driving was found to be below the ICNIRP reference levels in all operating conditions. The highest exposure levels were observed during high-speed driving and during acceleration and deceleration. These results indicate that HEVs and PHEVs tend to exhibit higher MFDs, particularly during high-speed driving and acceleration/deceleration phases, with notably large values observed when current flows between the battery and the motor.
Furthermore, studies have also investigated MFs generated by EV batteries [
21]. Evaluations were performed from a human health perspective using finite element simulation, measurements, and simple analytical approximations to estimate the upper bounds of MFs generated by battery packs. The results showed that the MF produced by the battery packs was below the ICNIRP reference levels for the general public.
3.3. Comparative Analysis of Vehicles
Comparative measurements between EVs, HEVs, PHEVs, and ICEVs have also been conducted.
In our 2013 study [
2], MFs generated during driving were measured for EVs, HVs, and ICEVs. Measurements were performed on a chassis dynamometer during steady-speed driving at 10 km/h, 40 km/h, and 80 km/h. The results showed that the maximum MFD was observed near the driver’s side footwell in EVs and ICEVs and near the passenger-side footwell in HVs. The measured values for EVs and HVs were similar, while ICEVs showed the highest values among them, though all remained below the ICNIRP guidelines.
Measurements were conducted on three diesel vehicles, four gasoline vehicles, and three HEVs [
22]. MFs were measured during steady-speed driving at 40 km/h and 80 km/h. Diesel vehicles exhibited the lowest measured values, gasoline vehicles showed higher values, and HVs exhibited the highest values. However, all measurements were comparable to typical everyday exposures from other sources. For HEVs, higher values were recorded near the rear seats, while diesel and gasoline vehicles showed higher values near the front seats.
Internal MFs were measured for five EVs, one HV, one PHEV, one fuel-cell vehicle, and three ICEVs [
23]. Measurements were conducted under conditions of maximum acceleration, maximum deceleration, and 0–60 km/h driving. For the PHEV, MFD reached up to 20% of the ICNIRP guidelines level near the battery during start-up, while in EVs, it remained below 15% near the battery. For the fuel-cell vehicle, values were below 3% at the front passenger seat, and in ICEVs, maximum values on the order of 10% were observed at the left rear passenger seat.
Measurements were performed on a total of seven vehicles: four EVs, two ICEVs, and one HEV [
24]. After starting the engines and measuring MFD in the engine compartment, measurements were taken during driving in the speed range of 40 km/h to 70 km/h. The results showed that ICEVs and the HEV exhibited similar MFDs, while EVs tended to show slightly lower values. The maximum measured values were below 2.6 µT, remaining within guideline limits. Because the measurement methods differed across studies, direct comparison is difficult. However, the results suggest that the vehicle type showing the highest measured values varies between studies, likely due to differences in vehicle design (such as equipment layout and magnetic shielding measures) and measurement conditions.
3.4. Studies Based on IEC 62764-1:2022
Study complying with IEC 62764-1:2022 has already been conducted. In 2025, Seibersdorf Laboratories in Austria reported the results of MF measurements performed under various conditions for EVs, PHEVs, and ICE vehicles [
4]. In this study, measurements were conducted on eleven EVs and two PHEVs. Measurements were performed at locations inside the vehicle specified by IEC 62764-1:2022, targeting the areas accessible to occupants where the maximum MFD could occur.
The study employed a roller dynamometer to perform measurements under stationary conditions, steady-speed driving (40 km/h ± 8 km/h), and during acceleration and deceleration (0–90 km/h), all in accordance with IEC 62764-1:2022. Additionally, the study included a 90-minute on-road driving session, which is not covered by the IEC 62764-1:2022 standard. Across all test conditions, the measured MDFs were below the reference levels of the ICNIRP guidelines for the general public.
Furthermore, the study also addressed measurement aspects not defined in IEC 62764-1:2022 by capturing short-duration transient phenomena lasting less than 200 ms. Results showed that transient MFD values increased sharply within 200 ms during events such as switching on the vehicle while stationary, as well as during rapid acceleration and deceleration. These findings highlight the need to select appropriate time-averaging intervals when evaluating exposure.
3.5. Studies on MFs from Tires
As a source of MFs, emission from magnetized tires is known. It was shown that magnetized steel belts within radial tires emit MFs, generating extremely low frequency alternating MFs below 20 Hz [
25]. The fundamental frequency is determined by the rotational speed of the tire, and the AC MF produced by the tire can exceed 2.0 µT at the passenger seat level inside the vehicle.
MFs were detected in the 5–100 Hz range, including the wheel rotation frequency and its harmonics [
26]. Measurements showed that the MFD at the foot level was approximately twice that at the head level. The maximum measured values were below ICNIRP reference levels, reaching about 3% of the guideline limits. Measurements of MFD emitted from tires indicated that used tires produced higher levels than new ones and that steel wheels generated higher MFs compared to aluminum wheels.
These results suggest that MFs generated by tires are of non-negligible magnitude and that failure to measure in the extremely low frequency range could hinder accurate exposure assessments.
3.6. Studies on MFs from EVCharger
Electromagnetic exposure assessments have also been conducted for EV charging equipment. At our institute, measurements of the MF emitted from EV rapid chargers were carried out in 2014, confirming a maximum value of 7.2 µT at 50 Hz, which is below the ICNIRP guidelines [
27].
Additionally, in South Korea, an evaluation of MF exposure was conducted for six types of EV chargers, and on-site measurements of MFD confirmed that the exposure levels were within ICNIRP guidelines, ensuring safety [
28].
With the spread of EVs, the importance of stationary wireless power transmission (WPT) technology, which enables contactless charging while parked, is increasing. However, high-power WPT systems generate strong EMFs. Therefore, for the 85 kHz operating WPT system, EMF safety evaluation was conducted through numerical calculations, confirming that the exposure levels remain below the ICNIRP guidelines even under maximum current operating conditions [
29].
Another study conducted numerical simulations, including both the WPT system and the vehicle, considering that misalignment (offset) between the transmitting and receiving coils may increase EMF leakage, and confirmed that the ICNIRP guidelines were met even under worst-case offset conditions [
30].
There is a study in which a WPT system was actually installed on a vehicle and MF measurements were performed on the vehicle itself, confirming that an 85 kHz WPT system complies with the ICNIRP 2010 exposure limits [
31].
3.7. Studies on MFs from Other Types of Mobility Systems
Studies on EMF exposure have also been conducted for electrically powered mobility other than EVs. For example, in the case of trains, exposure assessments have been performed using a fully occupied carriage model, confirming that MF levels are particularly high at the junction between the train body and windows, resulting in greater exposure for window-side seats. Nevertheless, passenger exposure levels were shown to remain below the ICNIRP guidelines [
32].
Furthermore, for electromagnetic suspension (maglev) high-speed trains, detailed numerical simulations have been conducted to evaluate 50 Hz MF exposure. It was confirmed that although passengers in window-side seats experience higher exposure, the levels remain below the ICNIRP guidelines. The study visualized the detailed exposure distribution by passenger position, providing useful data for design considerations [
33].
4. Research Approach
As the adoption of EVs and PHEVs advances, public concern about MFs generated by these vehicles has been increasing. Risk communication is considered an effective approach to alleviating such concerns. When conducting risk communication between experts and the general public, it is important to narrow the perception gap. Experts analyze risks in a quantitative and scientific manner, while the general public often harbors intuitive and emotional anxieties. This difference in understanding between scientific assessments by experts and the concerns of the general public is referred to as the perception gap.
Reducing this gap requires understanding the public’s anxieties and questions and providing scientific explanations in a clear and accessible manner.
For example, there is research that analyzes the structure of the ongoing debate over the health effects of EMF, which has continued for more than 70 years, and examines the challenges of scientific evaluation while considering how to minimize controversy. It concludes that clearly distinguishing scientific facts from opinions and sharing well-founded information in an accessible manner can help reduce excessive reactions and anxiety about risks, thereby promoting more rational responses across society [
34].
To support risk communication with the general public, who may be concerned about MFs from automobiles, we conducted measurements of vehicle-emitted MFs.
As for the measurement targets, there is very limited publicly available MF measurement data for vehicles in actual driving conditions in Japan, and the data measured in accordance with the automotive MF measurement standard IEC 62764-1:2022 are also limited. Therefore, we decided to conduct MF measurements on current domestic vehicles in Japan using the measurement methods specified in the IEC standard.
The aim was to acquire fundamental data for sharing the scientific basis of safety with the general public—specifically, to obtain data demonstrating that the measured MFs comply with the ICNIRP guidelines and are at levels that do not cause known acute adverse effects, such as nerve stimulation. Accordingly, we measured the maximum MFD (RMS) under various driving conditions and compared the results with the ICNIRP guidelines.
In addition, comparisons with existing research findings were conducted to examine differences between measurements from older vehicles and current models, as well as to verify the validity of the measurement results.
5. Methods
This section describes the measurement methodology used for evaluating MFs generated by vehicles. It outlines the equipment specifications, procedures, and conditions used to ensure accurate and reproducible assessment of MF exposure for passengers and drivers.
5.1. Measurement Device
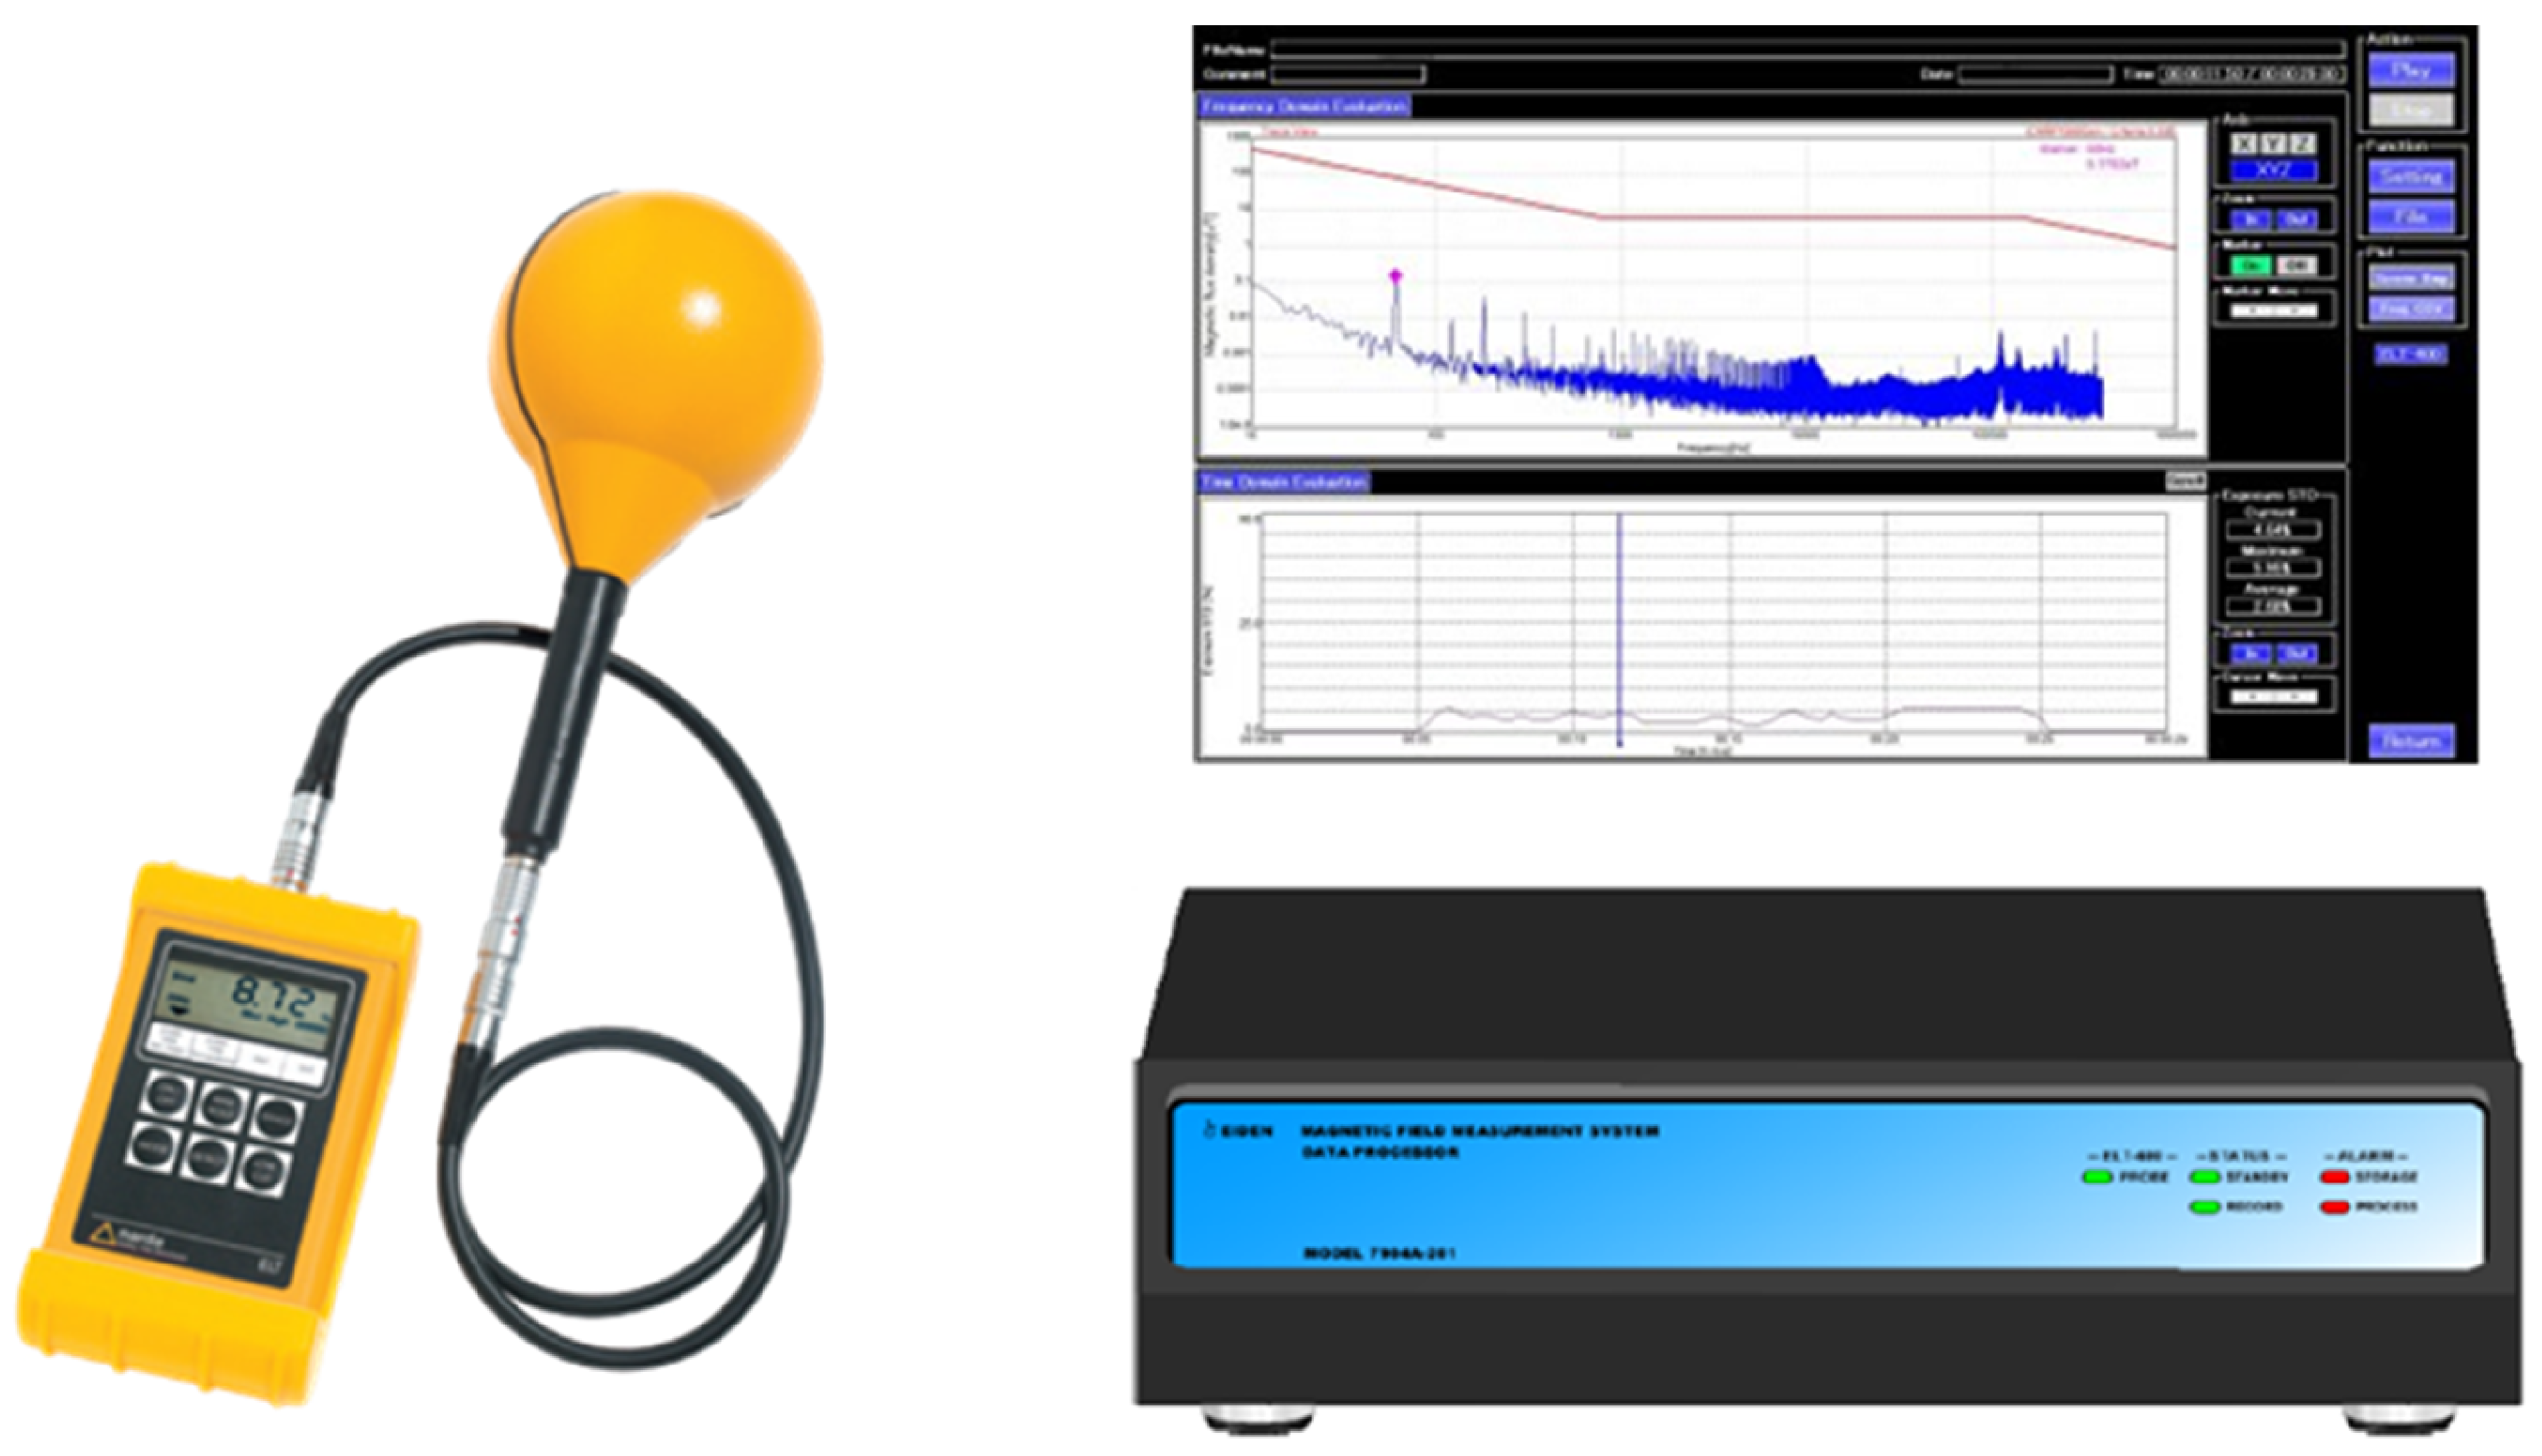
Measurements of MF were conducted using a MF measurement device (ELT-400, Narda S.T.S., Pfullingen, Germany) capable of measuring frequencies from 1 Hz to 400 kHz in accordance with IEC 61786-1:2013 [
35] and IEC 62764-1:2022. The device was equipped with a probe with a measurement area of 100 cm
2 and was periodically calibrated.
Frequency analysis was conducted using a frequency analyzer (MF measurement system data processor model 7904A-201, Eiden, Kawasaki, Japan) compatible with ELT-400 (
Figure 1).
The ELT-400 has a noise level of 60 nT and a display resolution of 1 nT. The RMS value of the MFD was calculated using a 1-second averaging period.
5.2. Measurement Method
The measurement method followed IEC 62764-1:2022. One EV, one PHEV, and one ICEV were selected as test vehicles (
Figure 2).
MFD was measured at the location showing the maximum value around the vehicle exterior while stationary and near the charging cable and socket during charging (
Figure 3).
In addition, MFD was measured at the points showing the maximum values at each measurement position—A to I (
Figure 4).
For the seat surfaces (B, C, E, and F), the measurement distance from the measurement point to the center of the probe was set at 6.5 cm. For all other positions, the measurement distance was set at 20 cm.
In addition, the ambient MFD at the location with no vehicles present (under stationary and plug-in charging mode) was defined as the background magnetic field (BGMF), which was then measured accordingly.
The measurements during driving were conducted on a circuit of the test course (within a range where the slope gradient is ±2%;
Figure 5).
In addition, electrical appliances (air conditioners, audio equipment, windshield wipers, lights, etc.) were operated at maximum output.
We measured for each car model under the following four conditions:
- (1)
Vehicle in stationary mode: idling (PHEV and ICEV) and ready to drive (EV).
- (2)
Vehicle in driving mode: drive the vehicle at a constant speed of (40 ± 8) km/h.
- (3)
Vehicle in dynamic mode: accelerate and decelerate from 0 km/h to 90 km/h, reaching at least 2.5 m/s2.
- (4)
Vehicle in plug-in charging mode: charging (quick charge, standard charge, EV, PHEV; EV charger is shown in
Figure 6).
Measurements were conducted more than three times in each mode, and the maximum value was used.
5.3. Measurement Method Used for Comparison with the 2013 Study
To enable comparison with the results of the 2013 study, measurements were also conducted using the same methodology as the previous research.
The measurement method in the 2013 study was as follows. One EV, one HEV, and one ICEV were selected as test vehicles. MFs were measured during constant-speed driving on an indoor chassis dynamometer. The driving speeds were set at 0 km/h, 10 km/h, 40 km/h, and 80 km/h. MF measurements were taken at six positions (1–6) in the driver’s seat, passenger seat, and rear seat, as shown in
Figure 7. The measurement frequency range was 0 Hz to 32 kHz.
In this study, to compare MF values between older and newer vehicles, we focused on comparing the maximum values (RMS). Measurements were conducted at the same positions where the maximum values were identified in the 2013 study for each vehicle type: position 5 in the driver’s seat for the EV, position 6 on the co-driver’s seat for the PHEV, and position 5 on the driver’s seat for the ICEV.
The driving speeds were set at 0 km/h, 10 km/h, 40 km/h, and 80 km/h. Measurements were performed using an ELT-400 device capable of measuring in the frequency range of 1 Hz to 400 kHz.
6. Results
This section presents the measurement results of MF and their frequency analyses for each vehicle type (EV, PHEV, and ICEV) under different measurement modes, along with comparisons to previous studies.
6.1. Measurement Results of MFD
The MFD values (RMS) measured under all conditions for each vehicle type are shown in
Table 2,
Table 3 and
Table 4.
For the EV and PHEV, the highest values were recorded on the rear seat (E, 6.5 cm measurement distance), while for the ICEV, the maximum value was recorded on the driver’s side dashboard (G, 20 cm measurement distance).
Among the vehicle types, the PHEV exhibited the highest MF level, followed by the ICEV, which showed higher values than the EV.
6.2. The Frequency Characteristics of the MF
Figure 8 shows the frequency characteristics of the MF measured at position A for the PHEV. The maximum values of the frequency components varied depending on the measurement conditions. Frequency components that changed with vehicle speed and those that remained constant regardless of speed were identified. The former are likely due to rotating sources such as tires and motors, while the latter are attributed to devices like air conditioning systems and cooling fans.
Measurement position A was located near the driver’s footwell, close to the tire, and peaks in the 6–29 Hz range that varied with speed were identified as MFs generated by the rotation of magnetized tires. Additionally, a fixed-frequency peak at 294 Hz was detected during air conditioner operation and was identified as MFs originating from the air conditioning system.
The characteristics of these frequency peaks were similarly measured at position A for EV and ICEV.
Figure 9 shows the frequency characteristics of the MF measured at position E for the PHEV. Frequency components that remained constant regardless of speed were identified while driving. The maximum value was measured at a frequency of 1 Hz.
A similar tendency was observed in both the EV and ICEV at position E, where peaks were measured at low frequencies around 1 Hz. However, in the case of PHEV, the frequency peak was significantly higher in the dynamic mode (deceleration).
These frequency peaks were observed near the wiring that connects the front and rear batteries, routed around the rear seat footwell in both the EV and PHEV, and are observed near the harness routed around the rear seat footwell in the ICEV.
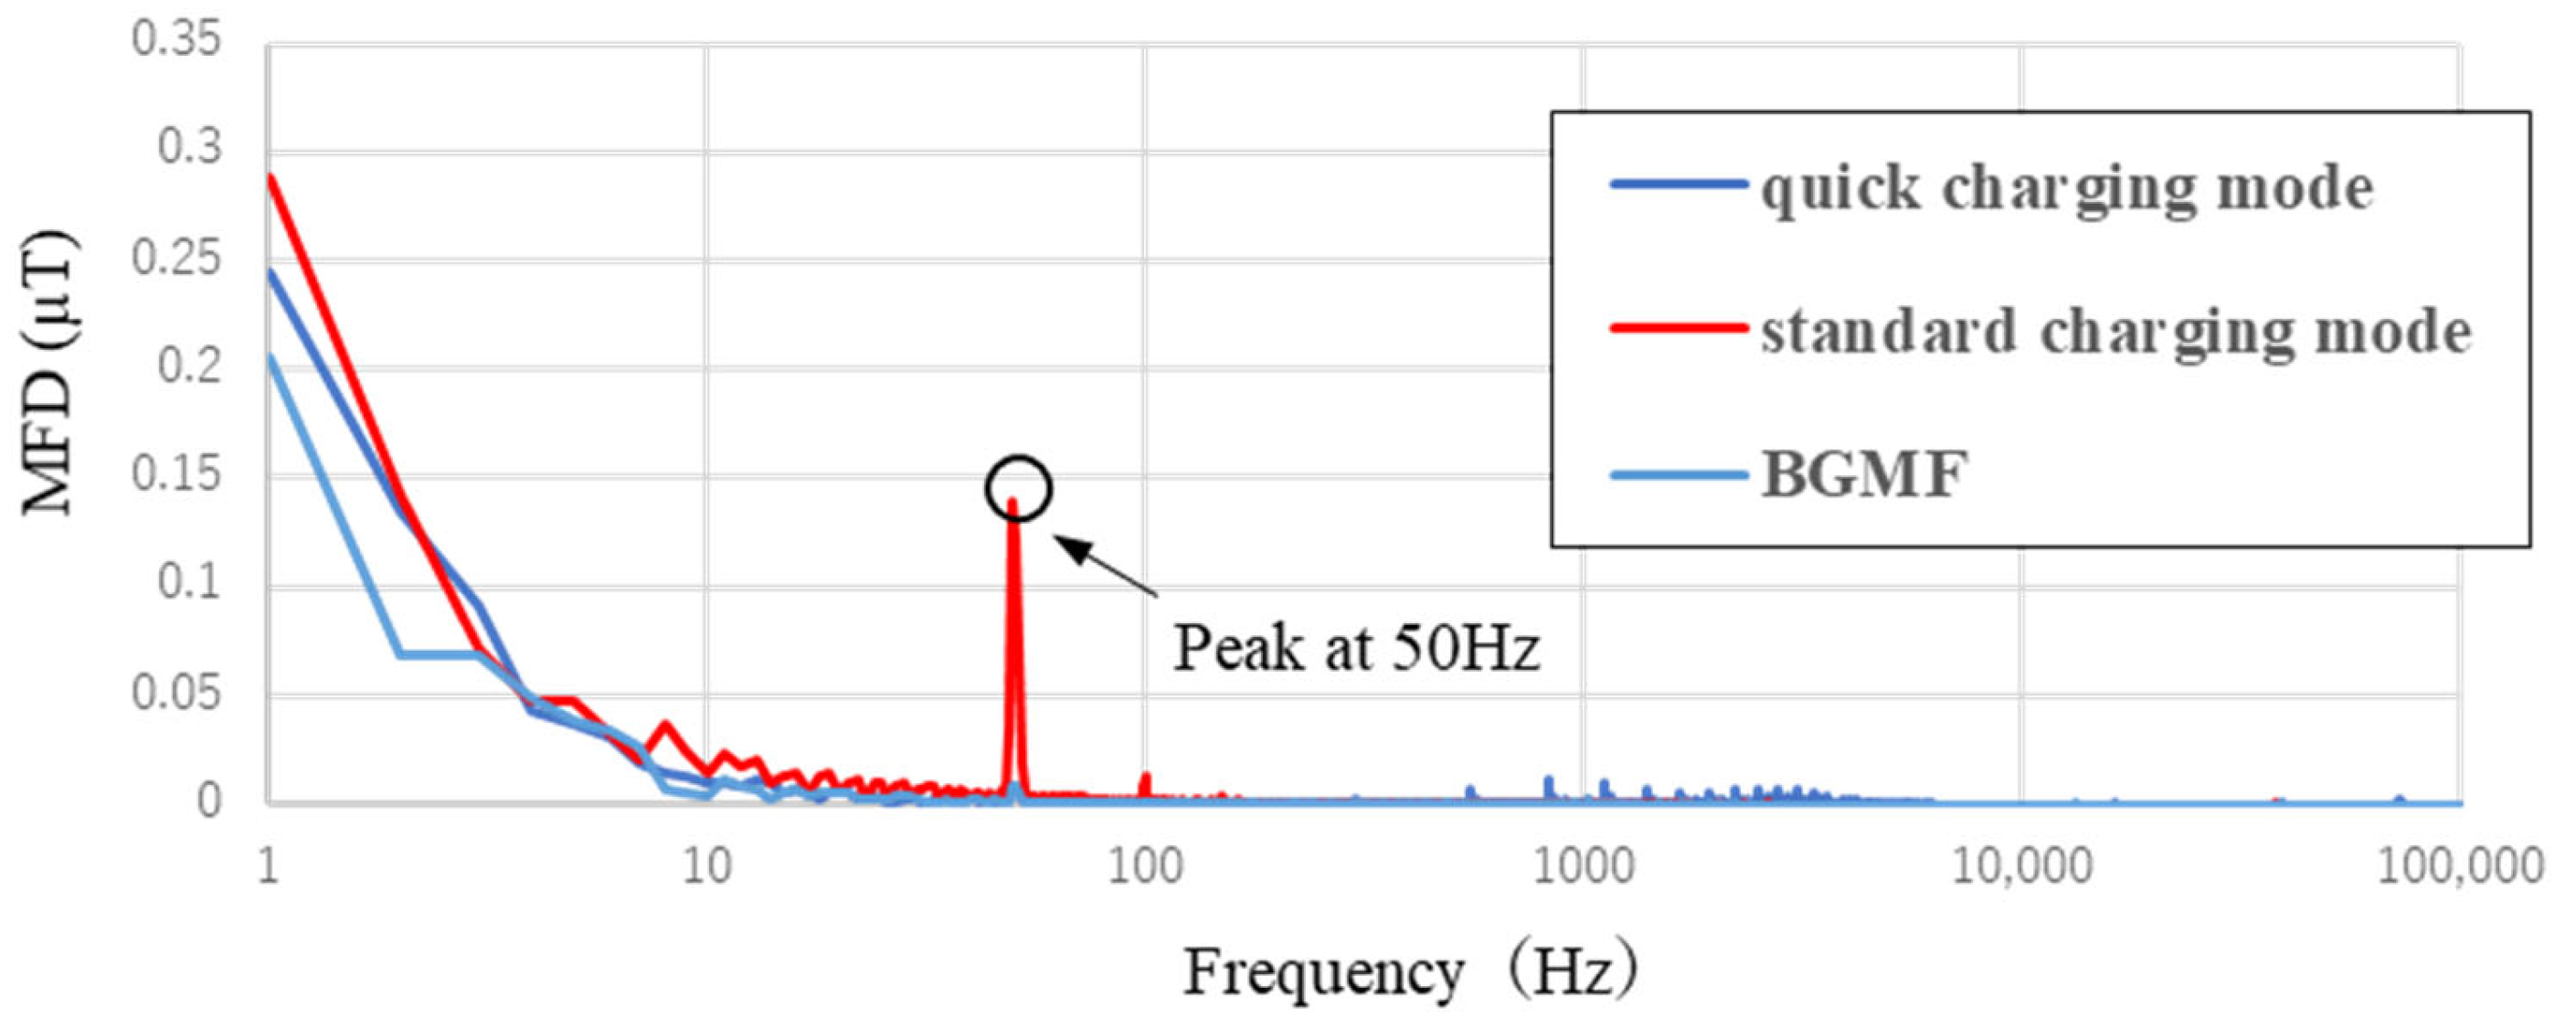
Figure 10 shows the frequency characteristics of the MF measured at the position charging socket for the EV. During quick charging, the input to the vehicle is direct current, and since SMFs are outside the measurement range, the frequency characteristics were comparable to the BGMF. In contrast, during standard charging, the input is alternating current, and a 50 Hz commercial frequency component was detected.
In the case of PHEV, a 50 Hz frequency peak was similarly measured during the standard charging mode.
Figure 11 shows the frequency characteristics of the MF measured at position G for the ICEV. A dominant frequency component in the range of 1 to 5 Hz was measured. The MF values increased significantly during wiper operation, suggesting that the rotating MF was generated by the wiper motor.
This characteristic was also consistently measured in both the EV and PHEV. However, in the case of ICEV, the MF measurements were significantly higher in the stationary mode. In the ICEV, it is presumed that the lower measured values were due to the wiper movement being hindered by wind pressure during driving.
Figure 12 shows the frequency characteristics of the MF measured at position D for the ICEV.
Frequency peaks were observed at relatively high frequencies, such as 847 Hz and 1268 Hz, with consistent spectral components identified irrespective of vehicle speed. While these components are presumed to originate from certain onboard equipment, the specific source of the MF could not be identified.
This characteristic was not measured in either the EV or the PHEV.
6.3. Comparison with Previously Reported Measurement Values
A comparison was made between the present measurement results and both the MF measurements conducted in 2013 and the report published by Seibersdorf Laboratories in Austria.
6.3.1. Comparison with Our Study Conducted in 2013
A comparison was conducted with the results of MF measurements of vehicles performed in fiscal year 2013.
Table 5 presents a comparison of the measurement results obtained from the current vehicles with previously reported locations where the maximum values for each vehicle type were identified.
The previous measurements were conducted on a chassis dynamometer, and the measured values represent the MFD with the MF generated by the dynamometer excluded.
For EVs and HEV(PHEV), the present measurements showed slightly higher values than those in the previous study. For the current vehicle models, the maximum values were measured at higher speed (80 km/h). In the case of ICEV, the present values were slightly lower. However, the measured values were generally comparable. For the current vehicle models, the maximum values were measured at lower speed (10 km/h).
Consistent with the previous results, ICEV exhibited the highest MF values among the vehicle types in the present measurements. The present measurements were conducted through actual driving on a test track, and although the conditions differed from those of the previous measurements on a chassis dynamometer, the measured values were of a similar magnitude.
In previous studies, frequency components of the MF that appeared to be proportional to vehicle speed and were likely generated by tire rotation were mainly observed. A similar tendency was also confirmed in the present study.
6.3.2. Comparison with Report by Seibersdorf Laboratories in Austria
A comparison was conducted between the maximum MF measurement values and those reported by Seibersdorf Laboratories in Austria.
Table 6 shows the comparison results of the maximum MF measurement values. Regarding the measurement results by Seibersdorf, vehicle models with similar maximum output were selected. Transient values observed during switching the main power of the vehicle on or off were excluded.
Our measurements showed that the MFDs for all vehicle types were lower than those reported by Seibersdorf. In this study, transient phenomena shorter than 200 milliseconds were not evaluated, in accordance with the IEC standard. In contrast, the Seibersdorf study measured peak values during short-term transients. Therefore, differences in measurement conditions are considered to have resulted in discrepancies in the measured values.
6.4. Assessment Based on the ICNIRP Guidelines
The peak MFD at the frequency (
Table 7) corresponding to the measurement position with the highest RMS value for each vehicle type was below the reference level for general public exposure to MFs, as recommended by ICNIRP.
Since multiple frequency components were measured, an assessment was conducted by summing the ratios of each component to the ICNIRP reference level for general public exposure to MFs. According to the ICNIRP criteria (satisfied if the total is ≤1), the results, shown in
Table 8, were all below 1. The assessment was performed based on Equation (1).
In the ICEV, the calculated values tended to be higher in the rear seat area (positions D, E, and F). As shown in
Figure 11, this is due to the occurrence of relatively high-frequency peaks, which led to the elevated calculated values.
7. Discussion
In the present study, MF measurements of current Japanese vehicles—EVs, PHEVs, and ICEVs, which have seen rapid adoption in recent years—were successfully conducted using the measurement method outlined in IEC 62764-1:2022.
In addition, the present study successfully identified the MFDs and their sources in various parts of EVs, PHEVs, and ICEVs.
For the EV and PHEV, the highest values were recorded on the rear seat (position E), while for the ICEV, the maximum value was recorded on the driver’s side dashboard (position G).
Previous studies [
2] reported the highest measured MF values in ICEVs. Although direct comparisons are limited due to differences in measurement methods, these results indicate differing trends. Researchers in [
22] found maximum values in HEVs, consistent with the present study, and similarly observed higher values at the rear seat location. The highest values were recorded near the battery in a PHEV [
23]. In the PHEV examined in this study, the battery is also installed beneath the rear seat, showing a similar tendency. Since batteries in HEVs and PHEVs are often located beneath the rear seats or in the trunk area, it is considered that high MFDs are measured in the rear seat region where the wiring is routed, particularly when current is supplied from the battery to the motor during driving or when regenerative braking directs current back into the battery.
With respect to the frequency characteristics, frequency components that changed with vehicle speed and those that remained constant regardless of speed were identified in the front seat area (position A).
The former was attributed to the rotation of magnetized tires in the 6–29 Hz frequency range, while the latter was attributed to the air conditioning system at a frequency of 294 Hz. Low-frequency peaks and their harmonic components were observed in the MFs generated by the tires, confirming that these fields are of a magnitude that cannot be neglected in exposure assessments. Low-frequency peaks and their harmonics were consistently observed [
25,
26]. It is reported that the MFD generated by tires can exceed 2 µT. In this study, at measurement position A for the PHEV, the peak MFD generated by the tires was approximately 2 µT, indicating that MFs of a similar magnitude were observed [
25].
In the rear seat area (position E), frequency components that remained constant regardless of speed were identified in driving.
The measured MFs are presumed to originate from the electric current flowing through the wiring during vehicle operation.
Significantly high values were observed during the acceleration and deceleration phases when current flows between the battery and the motor [
19,
20], showing results consistent with the present study.
In MF measurements in trains, it is known that fluctuations in DC generate not only DC MFs but also alternating MFs AC [
36]. The MFs observed around 1 Hz in this study are also considered to result from variations in DC current caused by rapid acceleration or deceleration, or vibrations of the wiring.
Measurements at the charging socket during the EV charging mode showed a peak at 50 Hz. While previous studies [
27,
28] focused on measuring the charger body itself, this study measured the vehicle-connected charging socket. Despite this difference in measurement targets, both observed peaks at 50 Hz (60 Hz), indicating a common tendency for peaks to occur at commercial power frequencies.
On the driver’s side dashboard (position G), the MF values increased significantly during wiper operation, suggesting that the rotating MF was generated by the wiper motor.
For the ICEV, frequency peaks were observed at 847 Hz, 1268 Hz, and 2567 Hz, with consistent spectral components identified irrespective of vehicle speed at position D. While these components are presumed to originate from certain onboard equipment, the specific source of the MF could not be identified. The identification of the sources requires further investigation, such as disassembling the vehicle for detailed examination.
A comparison was conducted with the results of MF measurements of vehicles performed in fiscal year 2013. It was identified that the MF measurements of the current vehicles were comparable to those of previously measured vehicles. In previous studies, frequency components of the MF that appeared to be proportional to vehicle speed and were likely generated by tire rotation were mainly observed. A similar tendency was also confirmed in the present study.
In comparison with the measurement results from the Seibersdorf Laboratory in Austria, our measured values were lower for all vehicle types. In this study, transients shorter than 200 ms were not considered, whereas the Seibersdorf study measured much shorter transients. Therefore, the differences in measured values are likely due to this discrepancy in measurement conditions.
The measured MFD values for all vehicle types were below the reference levels for general public exposure to MFs recommended by ICNIRP.
The limitations of this study include the inability to measure certain locations, such as areas near the pedals, due to safety considerations during actual driving. This highlights the need for complementary measurements using a chassis dynamometer. Additionally, this study was limited to one EV and one PHEV model, and variations in the placement of components such as batteries may affect both the locations where maximum values are observed and the measured values themselves. Therefore, it is necessary to conduct measurements on a wider range of vehicle models with different equipment configurations.
The results obtained in the present study may also serve as fundamental data for the evaluation of MFs in public transportation and EVs.
8. Conclusions
As the adoption of EVs and PHEVs increases, public concern about MFs from these vehicles has also grown. Narrowing the perception gap between scientific risk assessments and public anxiety is essential for effective risk communication. In this study, we conducted measurements of MFs emitted by domestic vehicles in Japan using IEC 62764-1:2022 methods and were able to provide reliable and easily accessible data to the public as a basis for risk communication.
The results confirmed that the measured MFs comply with ICNIRP guidelines and remain at levels that do not cause known acute adverse effects, such as nerve stimulation. The locations and characteristics of the maximum MF strengths for EVs, PHEVs, and ICEVs were identified.
For EVs and PHEVs, the highest MF values were observed on the rear seat at a 6.5 cm measurement distance, while for ICEVs, the maximum was recorded at the driver’s side dashboard at 20 cm. Among the vehicle types, PHEVs showed the highest MF levels, followed by ICEVs, which had higher values than EVs.
As a result of the frequency analysis, both speed-dependent and speed-independent MF components were detected across all vehicle types. Speed-dependent peaks included 6–29 Hz frequency components near the front seats, attributed to magnetized tires. Fixed-frequency peaks included a 294 Hz component observed during air conditioner operation. Low-frequency peaks around 1 Hz were observed near wiring routes around the rear seat area and were attributed to current flow during vehicle operation, with notably higher values in the PHEV during deceleration. In ICE vehicles, low-frequency components in the 1–5 Hz range were associated with wiper motor operation, while higher-frequency peaks at 847 Hz and 1268 Hz were detected but could not be clearly linked to specific sources.
A comparison with a previous study conducted in 2013 revealed that the MF levels are comparable to those of current vehicles as of 2025.
A comparison with the MF measurement results from Seibersdorf Laboratory in Austria revealed that their reported values were significantly higher. This difference is attributed to their capturing of rapid increases in MFD due to transient phenomena occurring on timescales below 200 ms, which were not considered in this study, and reflects differences in measurement conditions.
These findings are expected to provide valuable insights for risk communication with the general public regarding EMFs, particularly for those concerned about MF exposure inside electrified vehicles.
As a future perspective, as the performance of EVs continues to improve each year, with increases in motor output and battery capacity, exposure to MFs is expected to rise. Therefore, it is important to continue publishing measurement results regularly in the future.
This study focused on the vehicle itself and did not include measurements of the charging equipment. Wireless charging systems are being developed as an emerging technology [
27,
28,
29,
30,
31], and demonstration experiments are currently underway in Japan. As their adoption is expected to increase in the future, opportunities for risk communication with the general public are likely to grow. It is therefore important to conduct MF exposure measurements in line with public road deployment and to advance risk communication accordingly.
In addition to passenger cars, the electrification of other vehicles such as buses is advancing, and the introduction of new mobility technologies, including the construction of linear motor cars, is expected to progress in the future. As such technologies are introduced, public concern about EMF exposure is likely to increase. Therefore, it is important to consider conducting measurements in line with the pace of their deployment.


