Article

Lifetime Prediction of SiC MOSFET by LSTM Based on IGWO Algorithm

by
Peng Dai
,
Junyi Bao
*,
Zheng Gong
,
Mingchang Gao
and
Qing Xu
School of Electrical Engineering, China University of Mining and Technology, Xuzhou 221116, China
*
Author to whom correspondence should be addressed.
Electronics 2025, 14(22), 4486; https://doi.org/10.3390/electronics14224486
Submission received: 15 October 2025 / Revised: 13 November 2025 / Accepted: 13 November 2025 / Published: 17 November 2025

Abstract

SiC MOSFETs face prominent reliability issues due to higher voltage resistance requirements and continued device miniaturization. The lifetime prediction of SiC MOSFET plays a crucial role in improving the reliability of devices and systems. However, existing methods still face challenges in terms of adaptability, stability, and accuracy due to the complexity of the failure process in SiC MOSFET. This article proposes an improved grey wolf optimizer-based long short-term memory (IGWO-LSTM) model for SiC MOSFET lifetime prediction. The model introduces a Tent chaotic mapping to generate an initial population with optimal distribution, ensuring comprehensive search space coverage and enhancing dynamic search adaptability. Then, a nonlinear control parameter strategy and the principle of particle swarm optimization (PSO) are added. The feature extraction capability of the model is strengthened, and the exploration and exploitation phases are dynamically balanced. The optimizations enable faster discovery of the global optimum while maintaining solution quality, thereby improving prediction accuracy and stability. Finally, power cycling experiments were conducted on two types of SiC MOSFETs with different internal resistances to validate the effectiveness of the proposed model. The proposed IGWO-LSTM model achieves high prediction accuracy, with R2 values of 96.2%, 94.8%, 94.1%, and 93.9% for four SiC MOSFETs, and RMSE values as low as 0.0117, 0.0143, 0.0152, and 0.0158, respectively. This represents an average improvement in R2 by 16%, 8%, and 4%, and a reduction in RMSE by up to 67.03%, 50.39%, and 31.57% compared with other intelligent models. Similarly, IGWO-LSTM achieves reductions in MAE of approximately 68%, 50%, and 30%, with corresponding reductions in MAPE of about 70%, 48%, and 26%, respectively. The results demonstrate superior performance in prediction accuracy, stability, and adaptability of the proposed model.

1. Introduction

Power devices based on silicon have approached their physical limits as semiconductor technology continues to advance. SiC materials are characterized by a wide bandgap, high breakdown voltage, good electron mobility, and low power loss. As a result, SiC MOSFETs can be good substitutes for silicon-based devices, becoming core components in renewable energy systems, rail transportation, aerospace, and other fields [1]. However, SiC MOSFET faces reliability issues as a result of high-power density applications and device miniaturization, which result in significant power losses [2]. Package-related failure is one of the most common failures in SiC MOSFETs, which is caused by the coefficients of thermal expansion (CTEs) mismatch between different layers inside the component. This may lead to system downtime, economic losses, and significant safety hazards. Therefore, accurate and reliable lifetime prediction can help better evaluate the reliability of SiC MOSFET and optimize the structure and design parameters, so as to extend the service lifetime [3].
Currently, traditional analytical and physical prediction models are limited by precise device parameters and complex assumptions, making them difficult to adapt to practical operational condition variations [4]. The data-driven lifetime prediction method has received great concern, since improved sensor and data technologies facilitate ageing parameter extraction [5]. Although classical statistical and stochastic models have been applied, techniques such as the Kalman filter (KF) and particle filter (PF) for state estimation often rely on pre-defined distribution assumptions or linearity, which constrains their ability to capture the complex and nonlinear degradation trajectories [6,7]. Conventional machine learning models like support vector regression (SVR) and the back propagation neural network (BPNN) are limited in learning and handling the long-term temporal dependencies inherent in time-series ageing data [8,9]. Among various data-driven techniques, long short-term memory (LSTM) network has shown particular promise for lifetime prediction due to its inherent ability to model long-range dependencies in sequential data. However, its performance is highly dependent on hyperparameters and the requirement for manual tuning contributes to suboptimal efficiency [10]. Classical forecasting methods, including ARIMA and polynomial regression, are computationally efficient but have limited capability in modelling the complex nonlinear patterns inherent in degradation data [11]. Although optimization algorithms such as the marine predators algorithm (MPA), Bayesian optimization (BO), particle swarm optimization (PSO), and whale optimization algorithm (WOA) have exhibited effectiveness, they demonstrate significant limitations. BO struggles with exploration–exploitation balance and WOA suffers from premature convergence due to its oversimplified search strategy [12,13]. MPA introduces excessive parameter complexity, which increases tuning burden [14]. PSO lacks adaptive mechanisms, leading to excessive exploration and suboptimal results [15]. In contrast, the grey wolf optimizer (GWO) balances global exploration and local exploitation well for its hierarchical search. This approach enables adaptive parameter adjustment while maintaining population diversity to prevent premature convergence [16]. Consequently, GWO was selected as the optimization algorithm in this study.
However, the GWO-LSTM model still faces challenges including uneven initial population distribution, susceptibility to local optima, and slow convergence. Therefore, this paper proposes a lifetime prediction model for SiC MOSFET based on improved grey wolf-optimized long short-term memory (IGWO-LSTM) network. Three contributions are summarized to address these limitations, which collectively improve the prediction accuracy, convergence speed, and stability.
(1)
A Tent chaotic mapping was introduced to enhance the uniformity of initial population distribution.
(2)
A nonlinear control strategy was adopted to enable smooth and continuous transitions in the search mechanism.
(3)
The particle swarm optimization (PSO) principle was incorporated to strengthen global search capability.
The other sections of this paper are organized as follows: The Section 2 introduces the failure mechanisms of SiC MOSFET and presents the criteria for evaluating these failures. The Section 3 provides a detailed establishment of the SiC MOSFET lifetime prediction model based on IGWO-LSTM in this paper. The Section 4 describes the collection of a Vds dataset through DC power cycling tests with constant case temperature control. The Section 5 utilizes the IGWO-LSTM prediction model to train the dataset and predict the lifetimes. Finally, the conclusions are discussed in the Section 6.

2. The Failure Mechanism of SiC MOSFET

2.1. The SiC MOSFET Packaging Structure

The packaging not only provides protection and mechanical support but also offers electrical connection for the chip in the field of semiconductors.

2.1.1. Discrete Packaging

Discrete packaging is the most common packaging form for SiC MOSFET [17]. The models used for SiC MOSFET are TO-220 (suitable for low power) and TO-247 (suitable for medium-to-high power) regularly. The main structure consists of a metal lead frame that serves dual functions as current path and heat dissipation channels. The chip using solder material is attached to the centre of the lead frame. Surface electrodes of the chip are connected to the terminals of lead frame through multiple parallel bonding wires. The periphery is encapsulated with a high-temperature epoxy moulding compound, which must exhibit excellent insulation and thermal resistance [18]. The design of its packaging structure is shown in Figure 1.

2.1.2. Modular Packaging

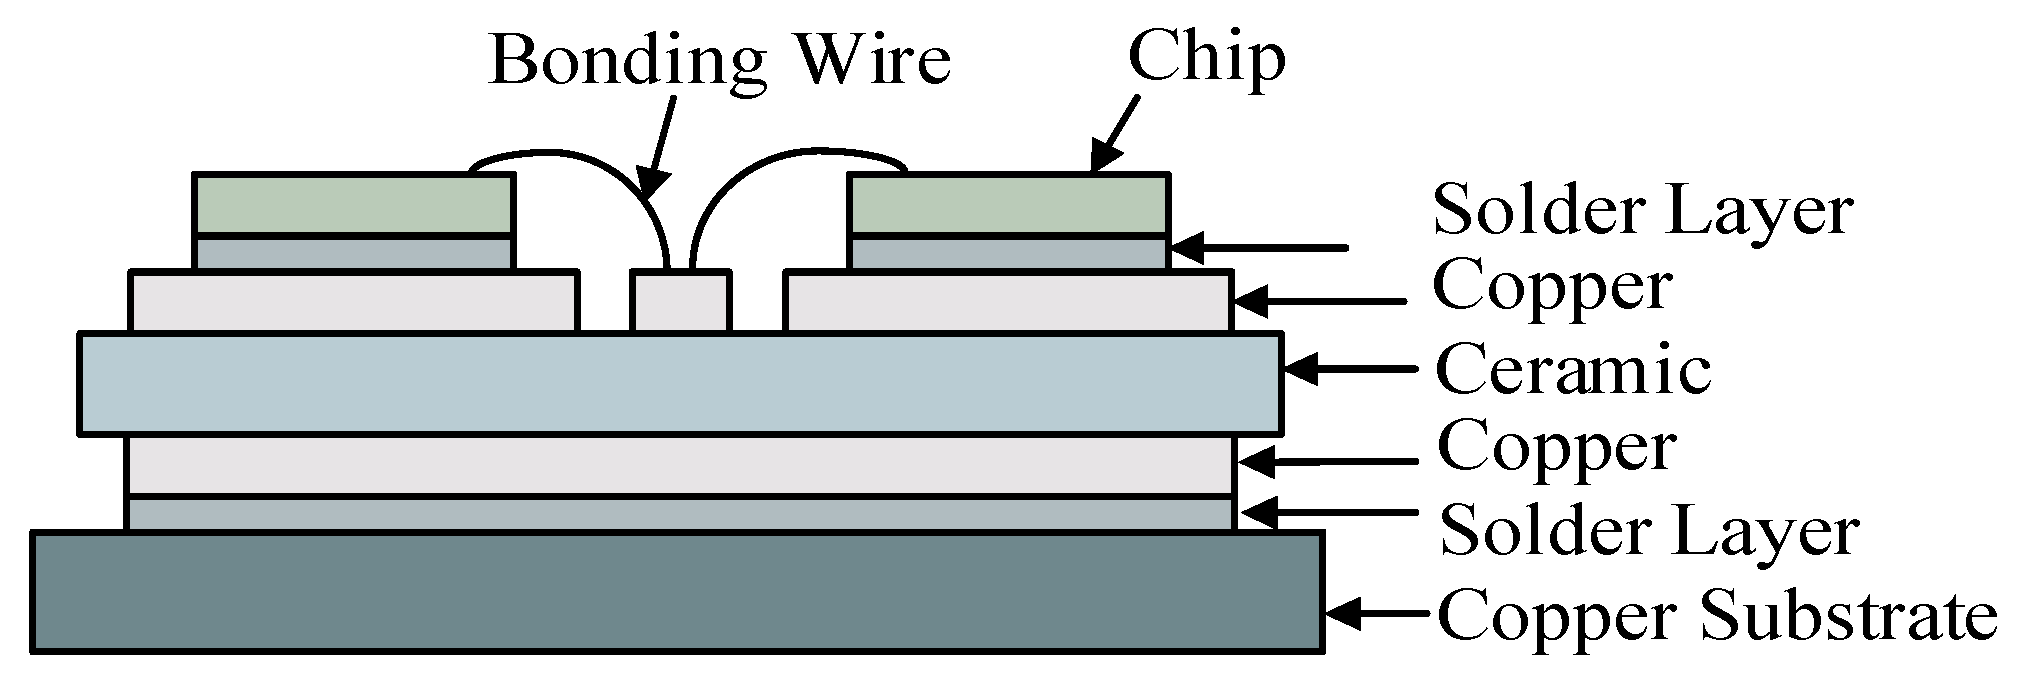
The core of modular packaging lies in the direct bonded copper (DBC) substrate, which consists of a ceramic insulating layer sandwiched between two copper foil layers. Multiple SiC chips are arranged in a matrix form on the DBC substrate, with electrical interconnections between the chips achieved through copper layers [19]. This packaging method can accommodate multiple chips in series and parallel connections and meet the requirements for operation in high-power environments, shown in Figure 2 [20].
SiC MOSFET discrete devices facilitate precise measurement and control of critical parameters during experiments for their simple structures. So discrete SiC MOSFET devices are selected for the experiment in this paper.

2.2. Analysis of SiC MOSFET Failure Mechanism

The high power loss density together with harsh operating environments may cause a wide temperature range and a high temperature rise during operation. High device junction temperature may result in many serious electrical and thermal–mechanical consequences if the generated heat is unable to be dissipated to the environment. The active area of SiC chips is smaller than that of Si chips at the same current level and more losses are generated by SiC chips for different conduction resistors compared with Si chips, which are more prone to reaching their thermal limits. In addition, the Young’s modulus of SiC is significantly higher than that of Si, which results in greater mechanical stress and accelerates the ageing failure [21].
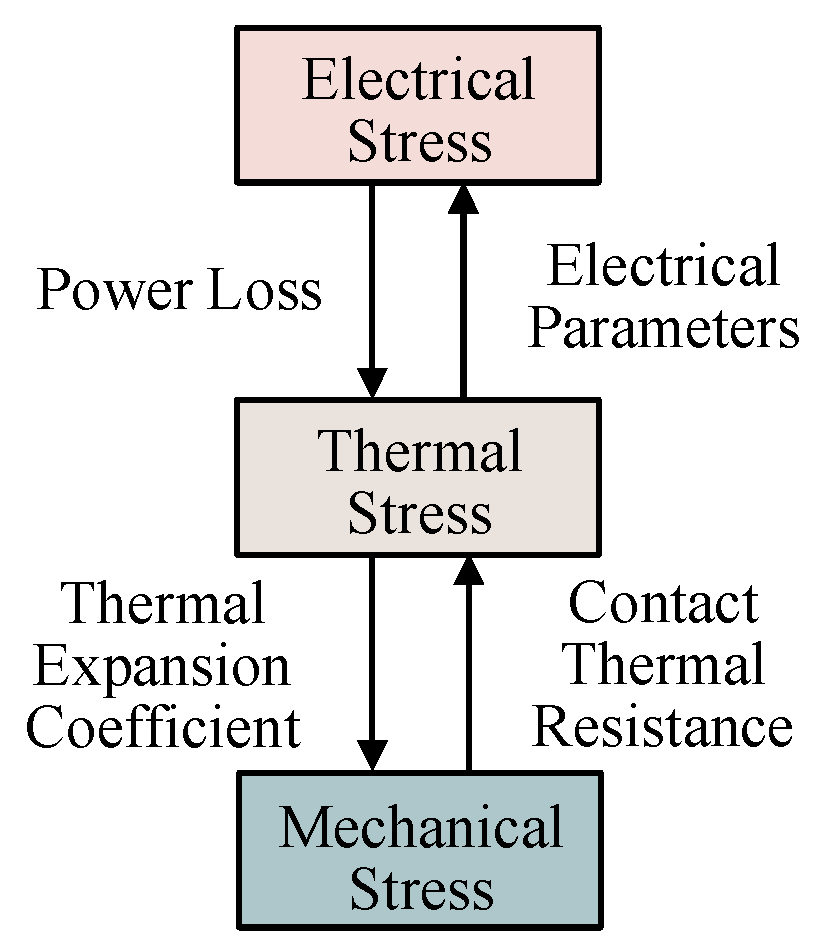
Bond wire fatigue is the most common package-related failure in discrete SiC MOSFETs. The power loss induced by electrical stress converts into thermal energy, which then propagates outward as heat flux to generate thermal stress. Due to the large difference in the coefficient of thermal expansion (CTE) in SiC and Al, the bond wire interface is subjected to periodic stress throughout device operation and generates crack formation [22]. The bond wires eventually detach completely from the chip as plastic strain accumulates [23]. This places additional thermal strain on the remaining wires and leads to a positive feedback loop, which can result in device failure if left unchecked. The coupling effects of electrical stress, thermal stress, and mechanical stress on SiC MOSFET during operation are illustrated in Figure 3.

2.3. Selection of SiC MOSFET Characteristic Parameters

Junction temperature Tj serves as a critical indicator for SiC MOSFET failure mechanisms. Direct measurement typically requires invasive procedures, which introduces substantial implementation costs and technical complexities. It is challenging to obtain the model parameters for the thermal network model and the simulation cycle is extremely long [24]. While a look-up table (LUT) is used to reduce simulation time for the thermal network model, it has difficulties with accuracy degradation in parameter acquisition due to ageing effects on thermal resistance [25]. The temperature-sensitive parameter method measures junction temperature through electrical ports and shows better monitoring capability than thermal methods [26].
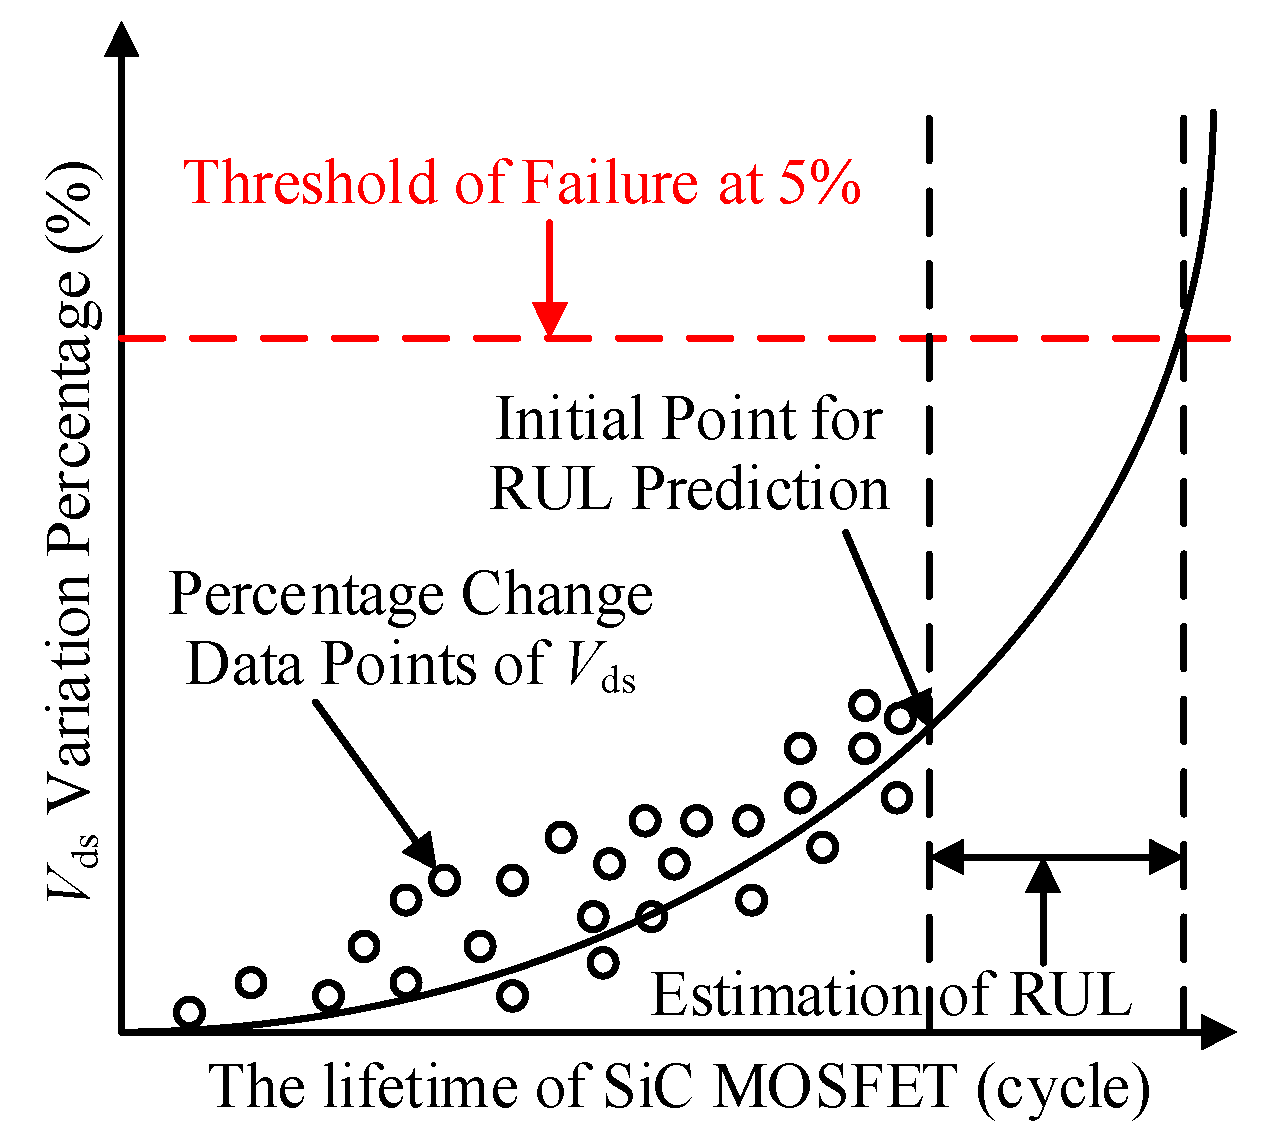
Currently, the mainstream failure characteristic monitoring parameters include drain-source voltage (Vds), threshold voltage (Vth), thermal resistance (Rth), and turn-off time (toff). However, study [27] indicates that minor variations in Vth lead to significant amplification of measurement errors, complicating online implementation. Study [28] employs Rth as a failure parameter, necessitating strict temperature control during testing since Rth has temperature dependency. Study [29] points out that toff is challenging to measure with precision and demonstrates limited sensitivity. In contrast, the drain-source voltage (Vds) shows superior sensitivity to bond wire detachment while maintaining excellent temperature stability under constant current conditions. Vds monitoring eliminates the need for additional excitation circuits, which reduces system complexity and implementation costs. Experimental results indicate that a 5% exceedance of the initial Vds threshold reliably indicates packaging failure [30]. The initial Vds is defined as the arithmetic mean of the Vds measurements recorded over the first ten power cycles following the commencement of the ageing test, aiming to effectively mitigate random noise inherent in any single measurement. The criterion of a 5% change in Vds for bond wire failure is not only exclusive to the AQG 324 standard but is widely adopted under foundational reliability testing standards such as IEC 60749-34 and JEDEC JESD22-A122A [31,32,33]. Therefore, Vds is selected as the failure monitoring parameter for SiC MOSFET. This paper monitors and acquires the Vds of SiC MOSFET during power cycling tests. The degradation of bond wires due to thermal cycling-induced detachment progressively leads to a corresponding rise in Vds. The critical failure of SiC MOSFET is defined by a 5% increase in Vds relative to its initial value, as shown in Figure 4.

3. Establishment and Analysis of Models

3.1. The Conventional LSTM Prediction Model

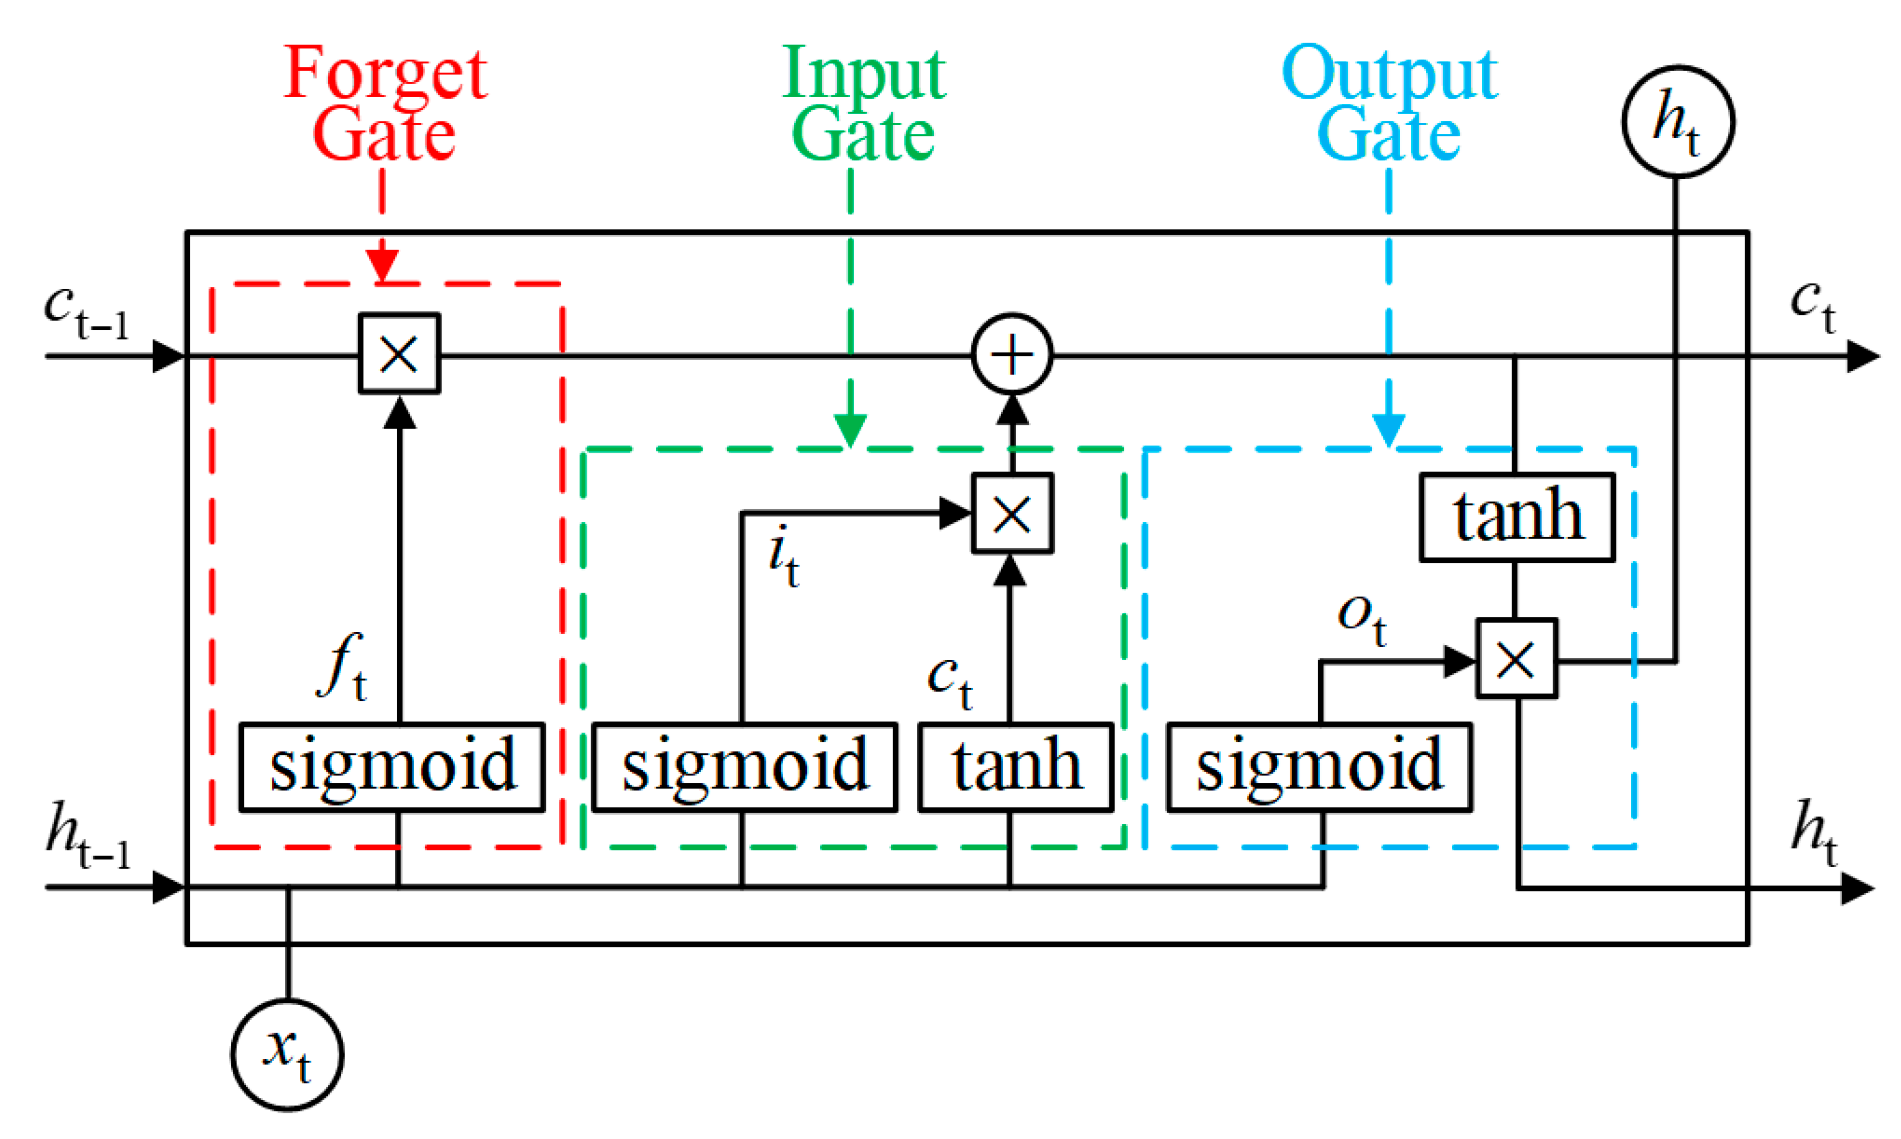
LSTM uses the gating structures to carry out corresponding forgetting and retention actions on the input information, effectively addressing the issue of gradient explosion [34]. The internal structure of LSTM is illustrated in Figure 5, where ft, it, and ot refer to the forget gate, input gate, and output gate, respectively. Specifically, the forget gate determines the information to be discarded from the cell state, the input gate selects the information to be updated into the cell state, and the output gate controls the information to be outputted. Among them, xt, ct, and ht represent the input unit, cell state, and output unit at time t, respectively, while ct−1 and ht−1 represent the cell state and output unit at time t − 1.
f t = σ W f h t 1 , x t + b f
i t = σ W i h t 1 , x t + b i
g = tanh W c h t 1 , x t + b c
c t = f t c t 1 + i t g
o t = σ W o h t 1 , x t + b o
h t = o t tanh c t
Wf, Wi, Wo, and Wc are the weight matrices for the forget gate, input gate, output gate, and input unit state in the equation. Similarly, bf, bi, bo, and bc are the bias terms for the forget gate, input gate, output gate, and input unit state, respectively.
The performance of the LSTM depends on parameter settings, which are often time-consuming and may not reach target accuracy.

3.2. The Grey Wolf Optimization Algorithm

The fitting ability and training effectiveness of LSTM neural networks are influenced by parameter settings, including the time-consuming model training and failure to achieve desired accuracy. GWO converges fast and is easy to implement, making it suitable for LSTM optimization. The grey wolf optimizer (GWO) algorithm simulates the hierarchical structure and hunting behaviour of wolf packs. The global and local search phases correspond to the searching and attacking behaviours of wolves, while the optimization process reflects wolves seeking and capturing prey [35].
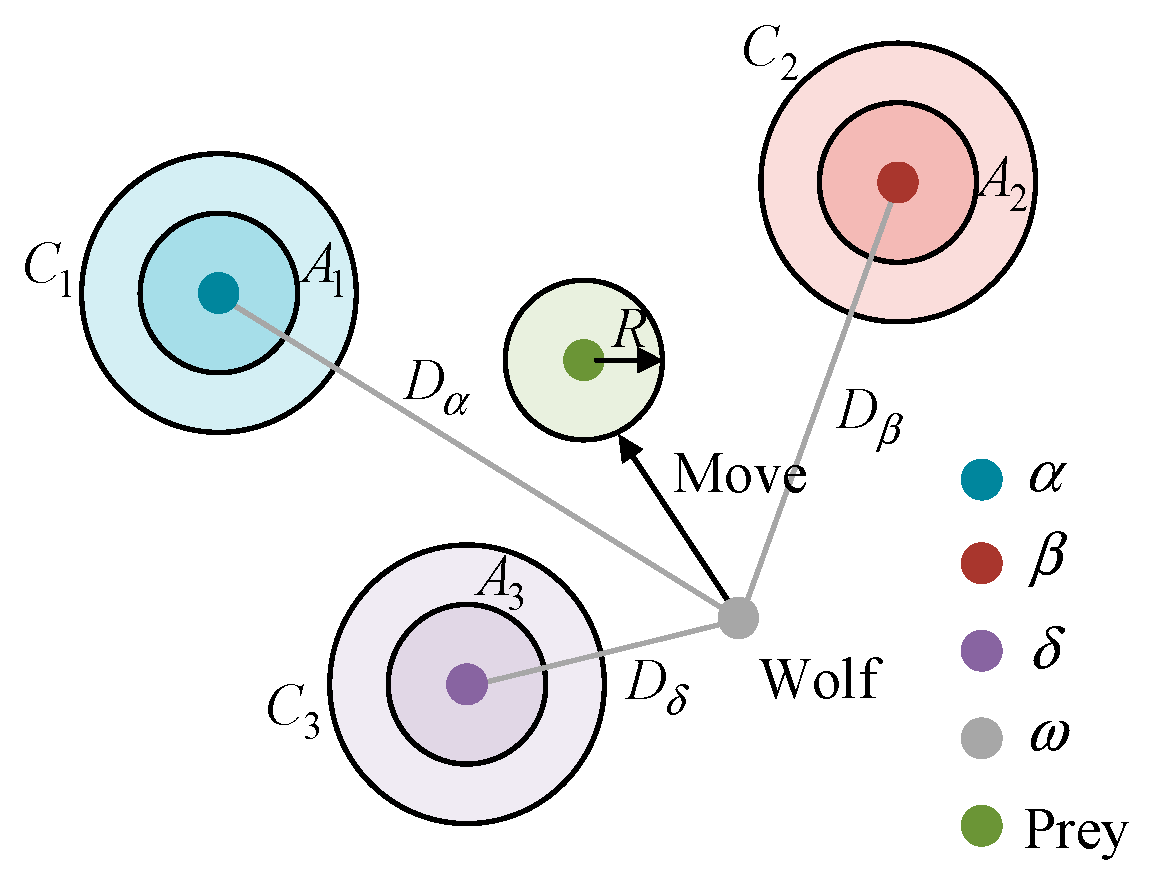
Since the standard GWO algorithm exhibits limitations in population diversity and tendency to local optima in complex optimization problems, an improved grey wolf optimizer (IGWO) is proposed. Three key enhancements are incorporated: a Tent chaotic mapping for population initialization, a nonlinear convergence factor for search balance, and PSO’s historical best-position mechanism for premature convergence prevention, as illustrated in Figure 6.
Each wolf has a distinct role, strictly adhering to a pyramid hierarchy. The best solution is α, the second-best is β, the third-best is δ, and the rest are ω in optimization. GWO assigns enclosing, hunting, and attacking tasks to different hierarchical wolves during predation. The optimization process of GWO is specifically implemented as follows [36].

3.2.1. Social Hierarchy Stratification

The social hierarchy of grey wolves is clearly defined, and the fitness of all individuals are calculated. After that, α, β, and δ wolves are selected, with the remaining individuals classified as ω.

3.2.2. Encircling the Prey

The grey wolves swiftly approach and encircle the prey when it is detected by the wolf pack. The mathematical description of this is:
D = C X p t X t
In the equation, D denotes the distance vector between the grey wolf and the prey; t represents the current iteration number; Xp(t) indicates the position vector of the prey at the tth generation; and X(t) denotes the position vector of a grey wolf at the tth generation. C serves as the oscillation factor, which is determined by the following formula.
C = 2 r 1
The formula includes a random number r1 within the range of [0, 1]. The update formula for the position of grey wolves is identified by the following formula.
X t + 1 = X p t A D
A is the convergence factor determined by the following equation.
A = 2 a r 2 a
a = 2 2 t / t max
In the equation, r2 is a random number between [0, 1], and a linearly decreases from 2 to 0 as the number of iterations increases. tmax is the maximum number of iterations.

3.2.3. Pursuing the Prey

The α, β, and δ wolves closest to the prey are the individuals in the group nearest to the prey during the prey pursuit phase and they lead the other grey wolves to move towards regions closer to the prey in the search space. The method for updating the positions of individual grey wolves is shown in Figure 7, and the calculation formulas are as follow.
D α = C 1 X α t X t D β = C 2 X β t X t D δ = C 3 X δ t X t
X 1 t = X α t A 1 D α X 2 t = X β t A 2 D β X 3 t = X δ t A 3 D δ
X p t + 1 = X 1 + X 2 + X 3 / 3
The distance between individuals within the group and the predicted positions of α, β, and δ prey wolves are calculated based on Equations (12) and (13). The direction of movement towards the prey is determined comprehensively using Equation (14).

3.2.4. Attacking the Prey

Finally, the grey wolf pack achieves the goal of capturing the prey by launching its attack. The attack behaviour is primarily determined by the value of a in Equation (11). When A 1 , the grey wolf pack focuses its attack on the prey, corresponding to the local search. When A > 1 , the grey wolves disperse to conduct a global search.

3.3. Improved Grey Wolf Optimization Algorithm

3.3.1. Initialization with a Tent Chaotic Mapping

The conventional GWO employs random initialization, which often results in clustered population distributions and reduces search efficiency. Common chaotic maps include Tent, Logistic, and Sine maps. The Logistic map is characterized by a non-uniform probability density, which causes values to cluster at the boundaries and can potentially hinder global exploration. In contrast, a more uniform initial population distribution across the search space is generated by the Tent map. Furthermore, a faster traversal speed compared to the nonlinear Logistic and Sine maps is enabled by the piecewise linear structure of the Tent map. This allows for a more efficient exploration of the search space during the initial iterations, effectively reducing the risk of premature convergence and accelerating the overall optimization process. Therefore, the Tent chaotic map is adopted in this paper for population initialization optimization [37]. The mathematical formulation is exhibited as follows.
x t + 1 = x t u , 0 x t < u 1 x t 1 u , u x t 1
In the equation, xt represents the chaotic variable value at the current iteration, while xt+1 denotes the value at the subsequent iteration. The parameter u, which governs the Tent chaotic mapping, is defined within the interval (0, 1). When u = 0.5, the Tent map is fully symmetric, exhibiting the strongest chaotic behaviour in the system.

3.3.2. The Nonlinear Control Parameters Strategy

The linear decrease in the convergence factor a in the grey wolf optimization algorithm (GWO) fails to adequately balance its global and local search capabilities. This inadequacy impedes dynamic space exploration and causes premature convergence. This paper proposes a nonlinear convergence factor to solve this problem, which is based on a sine function and defined by the following equation [38]. The convergence factor is adjusted to maintain heightened exploration capabilities during the initial and mid iterations, while intensified exploitation is promoted during the final iteration phase, thereby optimizing the search process dynamically.
a = sin π t t max + π 2 + 1
In the equation, t represents the current iteration count, tmax denotes the maximum number of iterations, and a corresponds to the convergence factor at the t iteration.
To systematically compare the performance differences between linear and nonlinear convergence factors, this test was conducted with the objective function starting from 100 and converging toward the theoretical optimum of 0 over a maximum of 500 iterations, as depicted in Figure 8. The analysis indicates that the linear factor falls rigidly from 2 to 0, yielding insufficient exploration. Although it converges rapidly in the early stages, it prematurely falls into a local optimum, achieving a final value of only 5.4. In contrast, the nonlinear factor gradually enhances exploration in the first 125 iterations, transitions smoothly during the mid-phase, and refines convergence in the later stage. The corresponding parabolic change rate ensures a seamless transition from exploration to exploitation, avoiding abrupt behavioural shifts. The nonlinear factor achieves more thorough global search with higher exploration probability and extended exploration duration, converging to 1.67 while retaining further optimization potential. Moreover, IGWO reaches the predefined MSE threshold of 1 × 10⁻⁴ in an average of 62 iterations, whereas GWO require average 103 iterations. It demonstrates advantages in both search performance and convergence performance of IGWO.

3.3.3. The Concept of PSO

GWO fails to fully exploit the historical best positions explored by individual wolves themselves, which may cause premature or slow convergence speed in complex problems due to the potential oversight of superior solutions. Therefore, this study combines the idea of the particle swarm optimization (PSO) algorithm [39], introducing both the personal best position Xibest and social learning mechanisms into position-updating rules. This hybridization enhances global search capability by effectively balancing individual experience with collective intelligence.
X i t + 1 = c 1 r 3 ω 1 X α t + ω 2 X β t + ω 3 X δ t + c 2 r 4 X ibest X i t
In the equation, c1 and c2 represent learning factors that govern the weights of group collaboration and individual memory, respectively. r1 and r2 are random numbers within the interval [0, 1]. Xibest denotes the historical best position encountered by an individual wolf. ω1, ω2, and ω3 are weight coefficients. The current position of the target wolf is symbolized by Xi(t). Xα(t), Xβ(t), and Xδ(t) correspond to the positions of α, β, and δ wolves.

3.4. The Testing Performance of IGWO

CEC2005 is a recognized benchmark suite and can evaluate the performance of optimization algorithms comprehensively. The general efficacy as a powerful optimizer of the improved grey wolf optimization (IGWO) algorithm was evaluated using six benchmark functions from the CEC2005 test suite before applying to the practical task of LSTM parameter optimization, as detailed in Table 1 [40].
The unimodal Sphere (F1) and Schwefel (F2) test basic convergence speed and the algorithm’s stability under complex conditions with its non-smooth design, which are utilized to verify sensitivity to initial population quality. In addition, the multimodal Ackley (F3) and Rastrigin (F4) are adopted to examine the global exploration capability and the ability to escape local optima, while testing the dynamic adaptability of nonlinear control strategies simultaneously. Furthermore, Kowalik (F5) and Shekel (F6) are applied to validate the enhancement effect on search process based on the PSO mechanism in fixed-dimensional problems and low-dimensional complex spaces. These functions establish a comprehensive assessment of algorithm performance. Among them, the six standard test functions are
F 1 = i = 1 n x i 2
F 2 = i = 1 n x i + i = 1 n x i
F 3 = 20 exp 0.2 1 30 i = 1 30 x i 2 exp 1 30 i = 1 30 cos 2 π x i + 20 + e
F 4 = i = 1 n x i 2 10 cos ( 2 π x i ) + 10
F 5 = i = 1 11 a i x 1 b i 2 + b i x 2 b i 2 + b i x 3 + x 4 2
F 6 = i = 1 5 x a i x a i T + c i 1
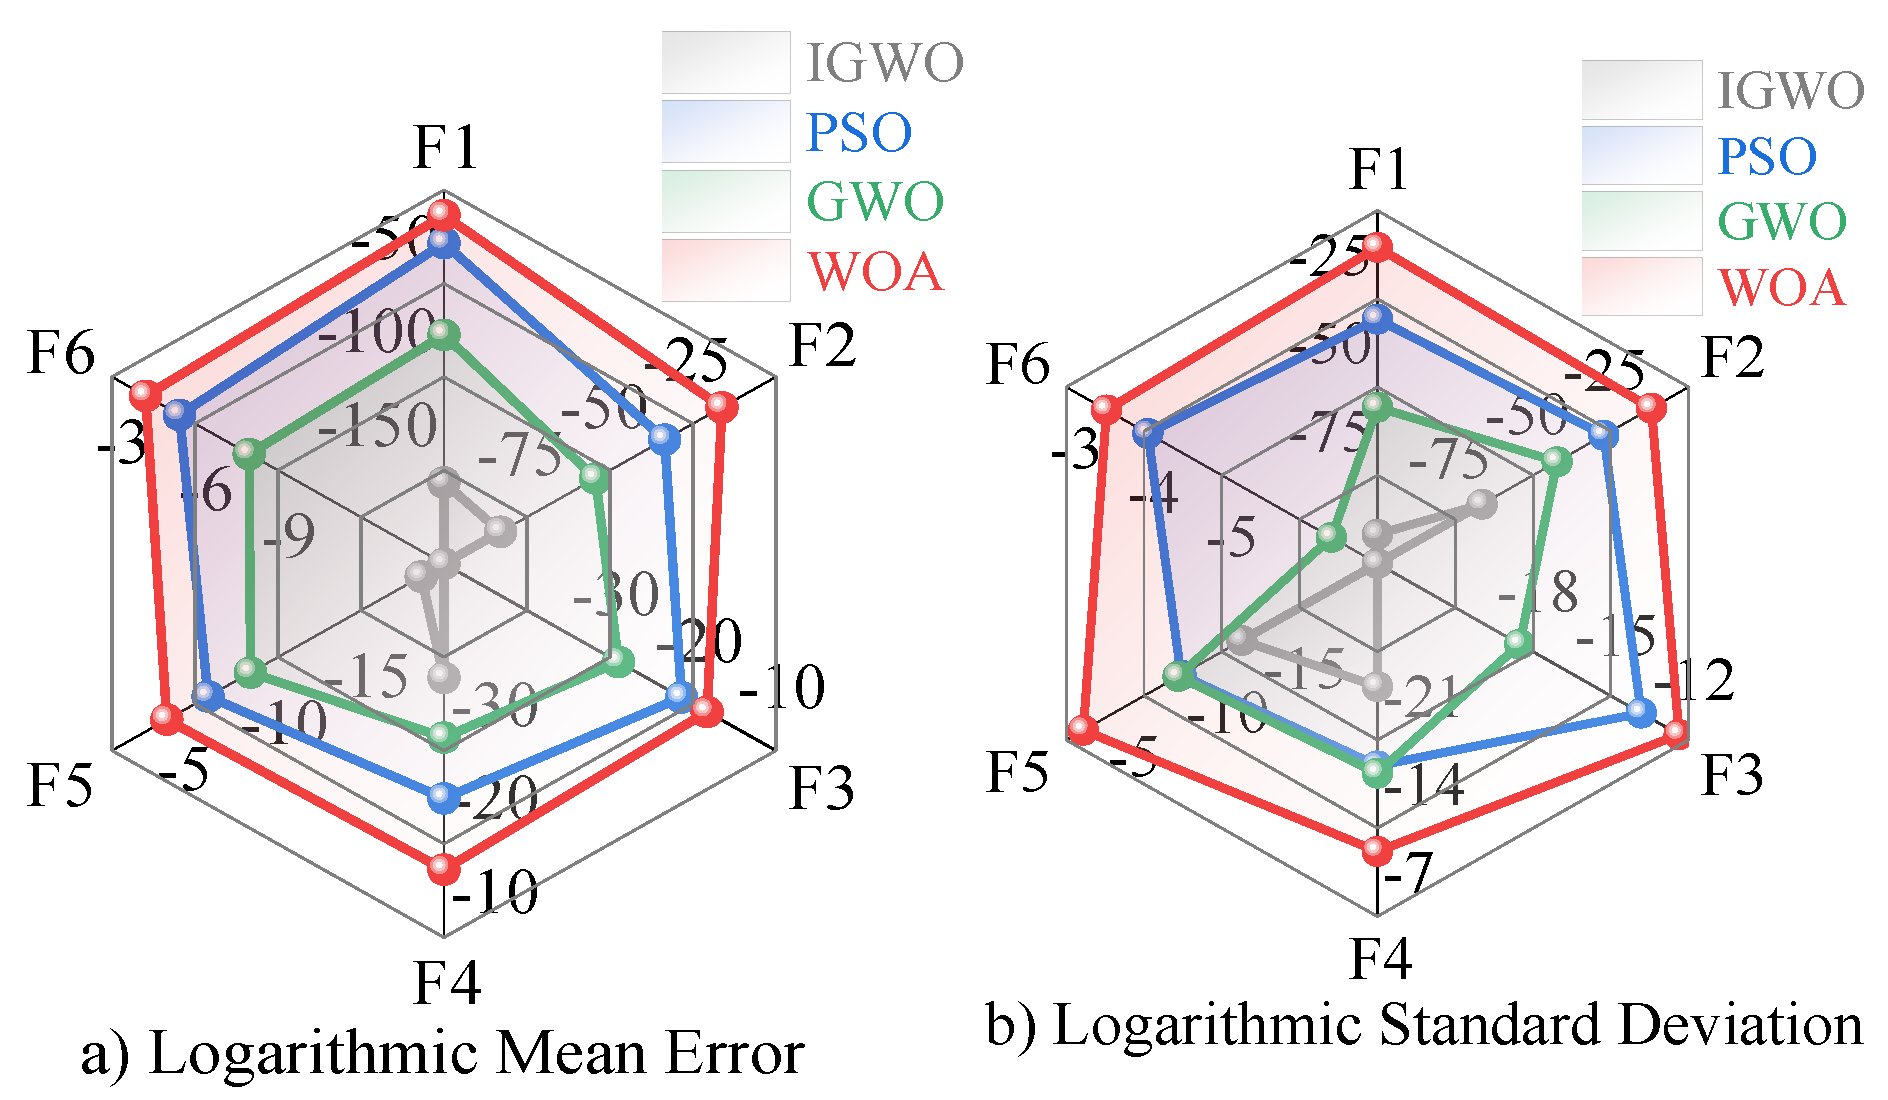
IGWO is compared with GWO, WOA, and PSO to evaluate the optimization effectiveness. The population size for all algorithms is set to 30 and the number of iterations is set to 500. The parameter setting achieves a balance between computational efficiency and convergence performance, which is a common configuration for testing [41]. Meanwhile, this paper selects the mean value and the standard deviation to assess the optimization performance of each algorithm since mean value can reflect the convergence characteristic of the algorithm and standard deviation can indicate the stability of the algorithm. The experimental results are presented in Table 2.
The experimental results demonstrate that IGWO exhibits superior optimization capability across all benchmark functions. IGWO achieves remarkable precision with F1 (3.06 × 10−157) and F2 (1.18 × 10−83) for unimodal functions, outperforming GWO by 79 and 28 orders of magnitude in accuracy, and maintaining exceptional stability (standard deviations of 1.94 × 10−92 and 4.11 × 10−67). Moreover, IGWO shows perfect convergence (0, 0) for both F3 and F6 in multimodal optimization, demonstrating its ability to navigate complex landscapes and locate the global optimum. In contrast, other algorithms exhibit residual errors. Notably, IGWO delivers improvements in F4 (1.62 × 10⁻²⁸, 6.11 × 10⁻¹⁹) and F5 (2.34 × 10⁻¹⁹, 5.14 × 10⁻¹²), surpassing GWO by 6 and 10 orders of magnitude in accuracy. The consistently minimal standard deviations confirm robust stability of IGWO across diverse problem landscapes. A logarithmic radar chart is employed to visually highlight algorithm differences for comparative analysis, as depicted in Figure 9. IGWO achieves near-zero logarithmic mean error and its logarithmic standard deviation is substantially lower than other algorithms across all benchmark functions.
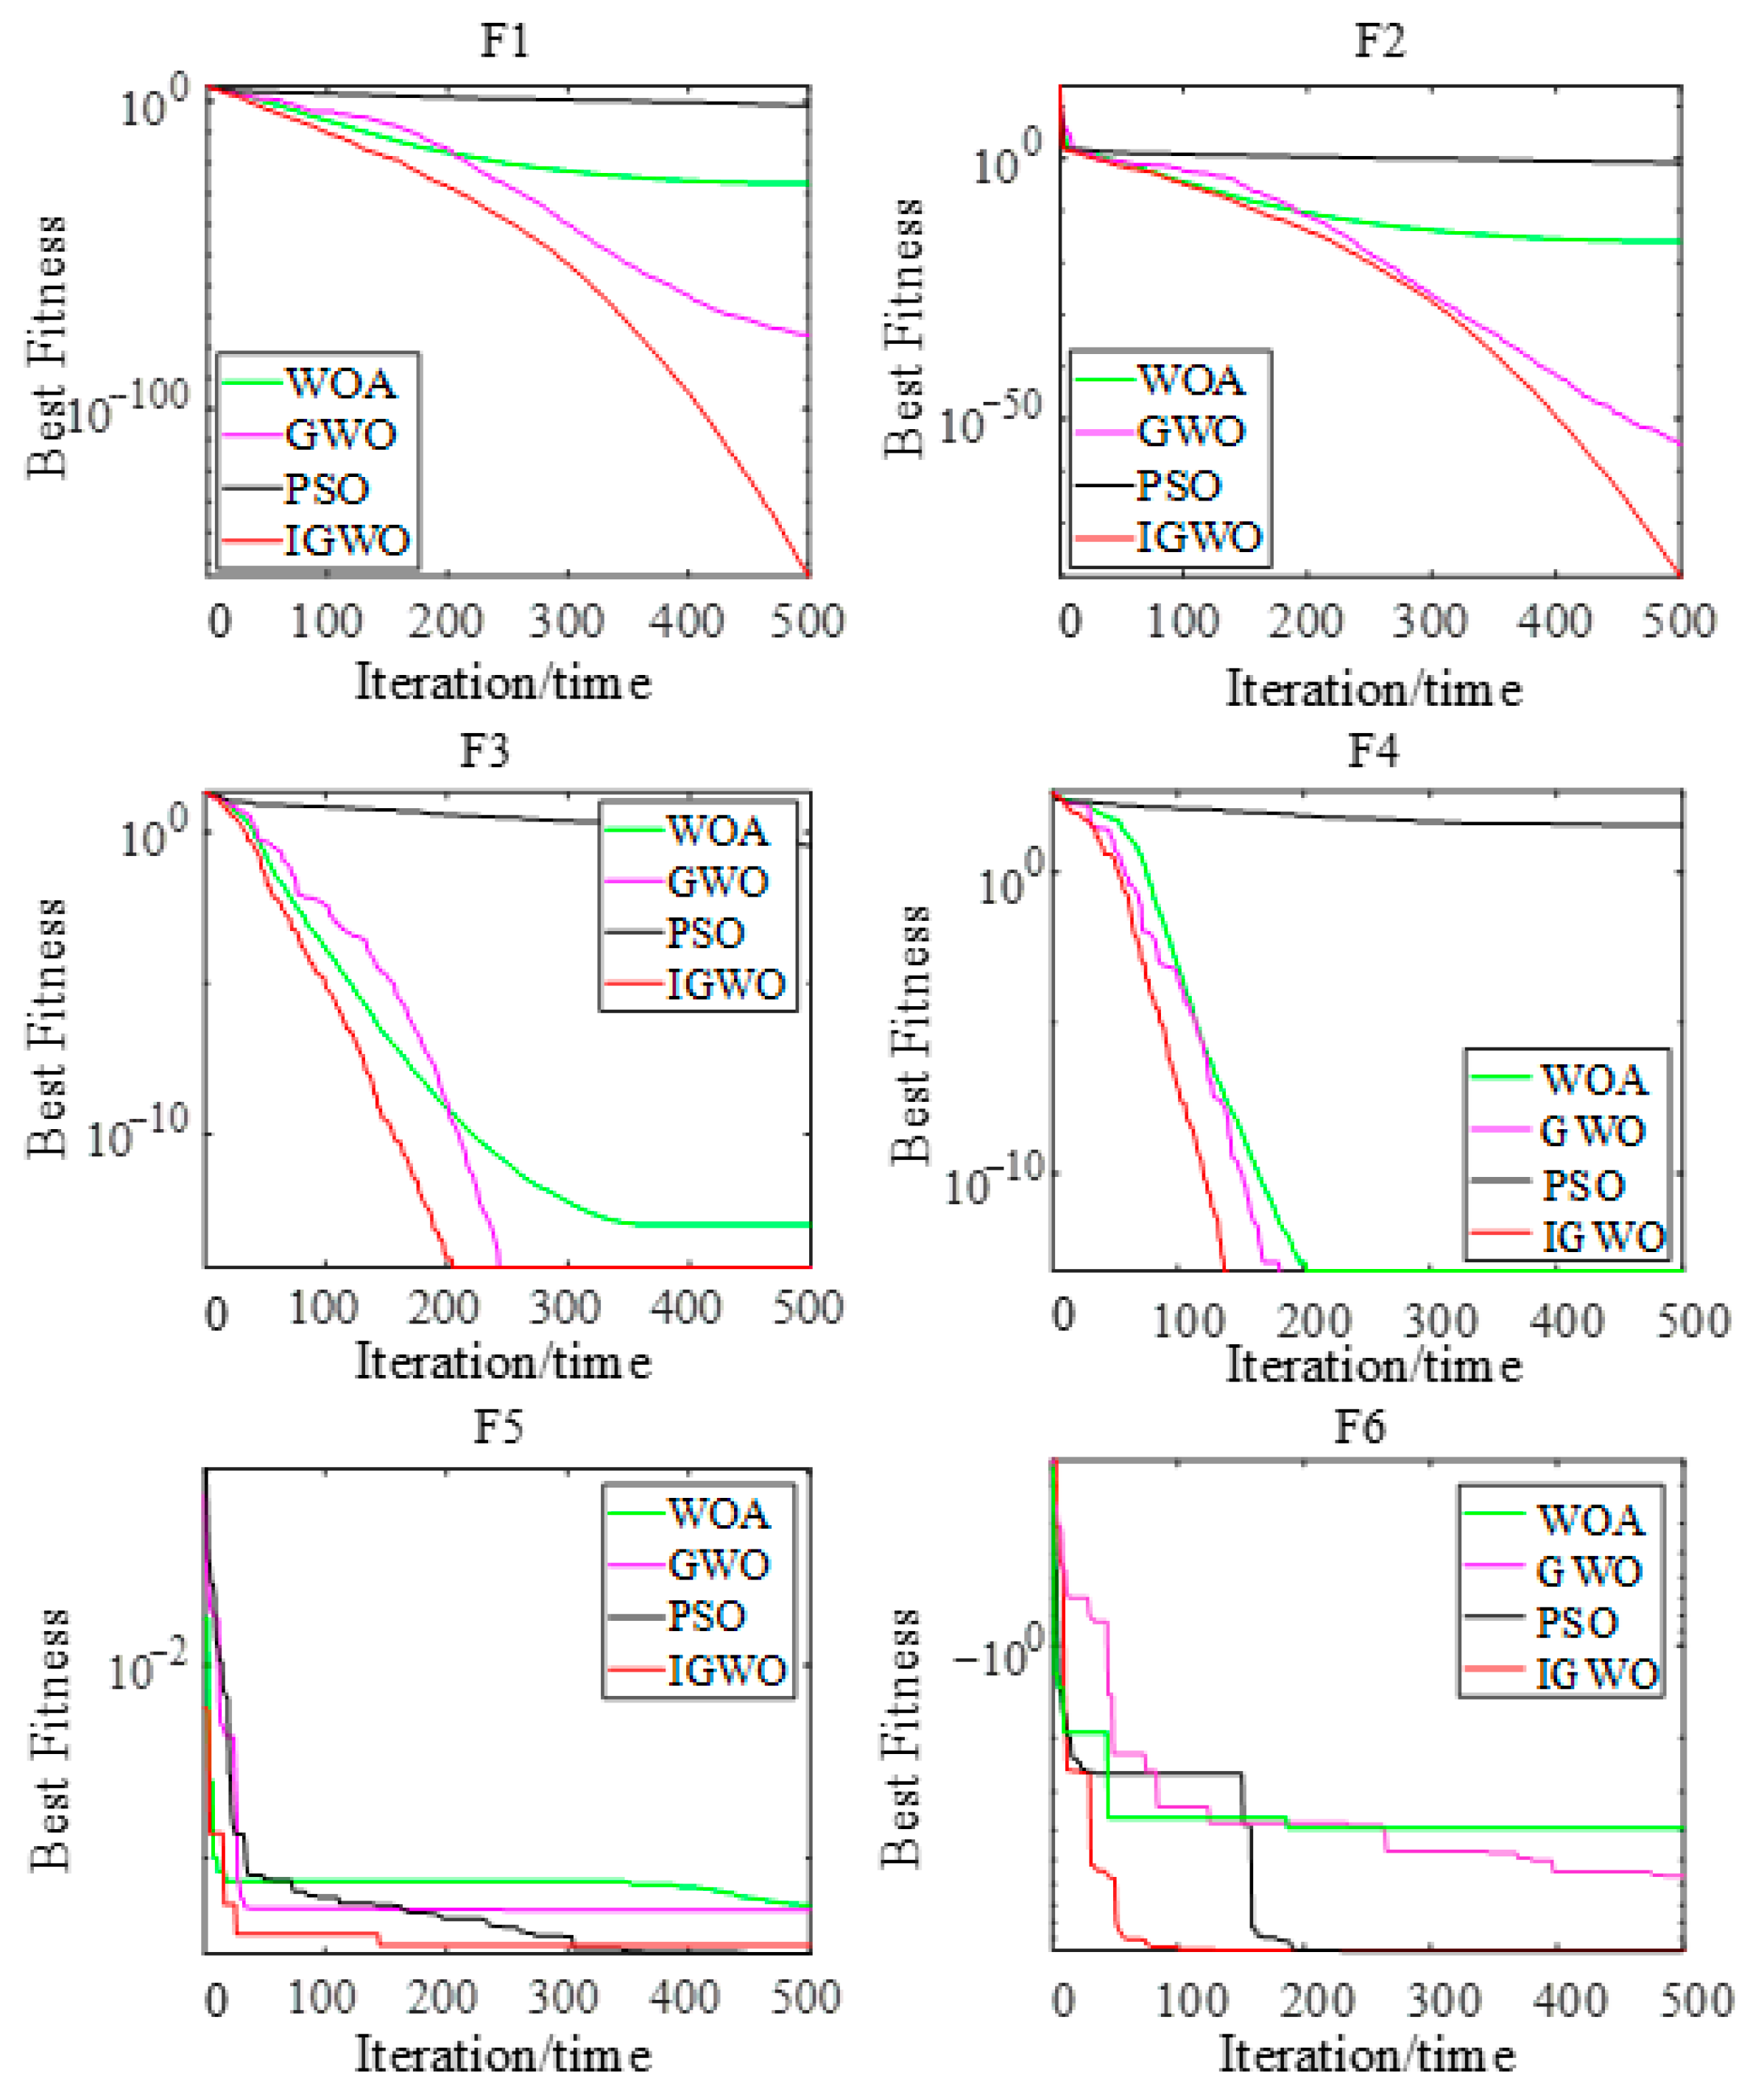
After that, this paper analyzed their convergence curves to understand the difference between algorithms, as shown in Figure 10. The convergence curves corresponding to F1–F4 indicate that IGWO achieves better convergence speed and accuracy compared to the other three algorithms. Meanwhile, IGWO maintains a fast convergence speed and low fitness values in the convergence curve of F5. Although particle swarm optimizer (PSO) shows a favourable convergence trend, it exhibits significant fluctuations during the convergence process, whereas the IGWO algorithm remains relatively stable. Moreover, the performance differences between the algorithms are more obvious in the F6 convergence curve. PSO shows a clear advantage in achieving the fastest convergence speed and fitness values, which is closest to the optimal value of −1, and the convergence performance of IGWO is second only to PSO. IGWO improved with PSO strategies, showing an enhanced ability to escape local optima when handling complex problems.
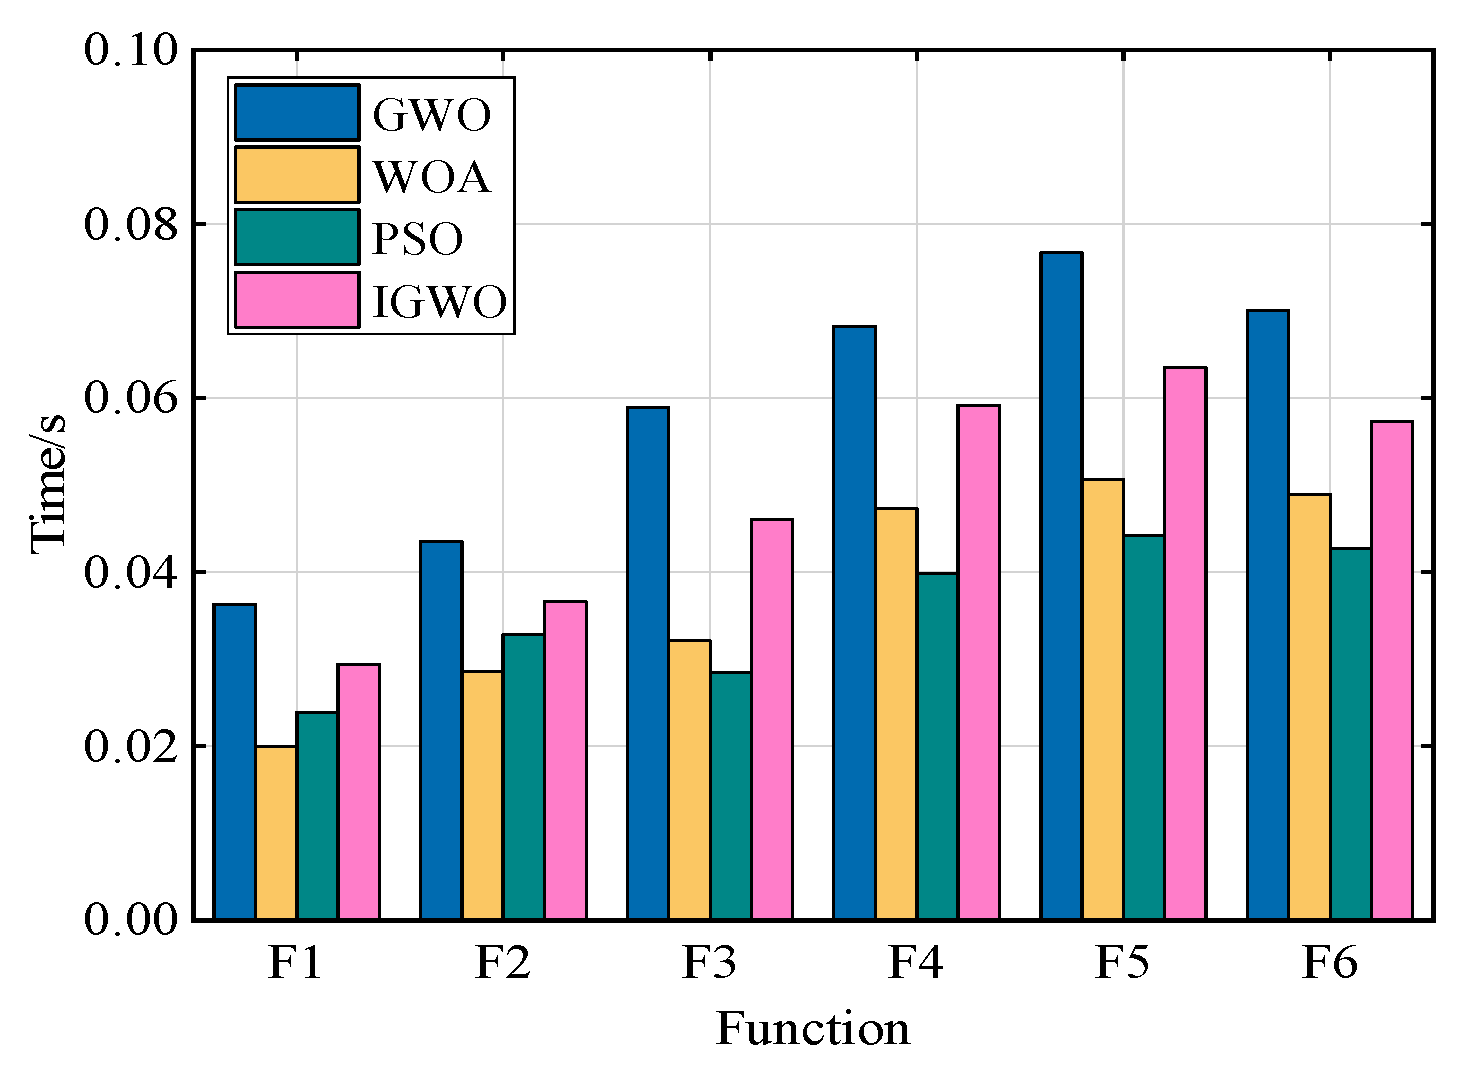
Furthermore, a comparative analysis of computation time was conducted among WOA, PSO, GWO, and IGWO. The execution time for 500 independent runs of each algorithm is illustrated in Figure 11. The results exhibit that IGWO consumed more computation time to achieve higher solution accuracy, but showed shorter execution time compared to GWO for complex problems. Overall, IGWO demonstrates superior optimization performance considering accuracy, stability, convergence, and computation time compared to other algorithms, verifying its effectiveness.

3.5. A SiC MOSFET Lifetime Prediction Model Based on IGWO-LSTM

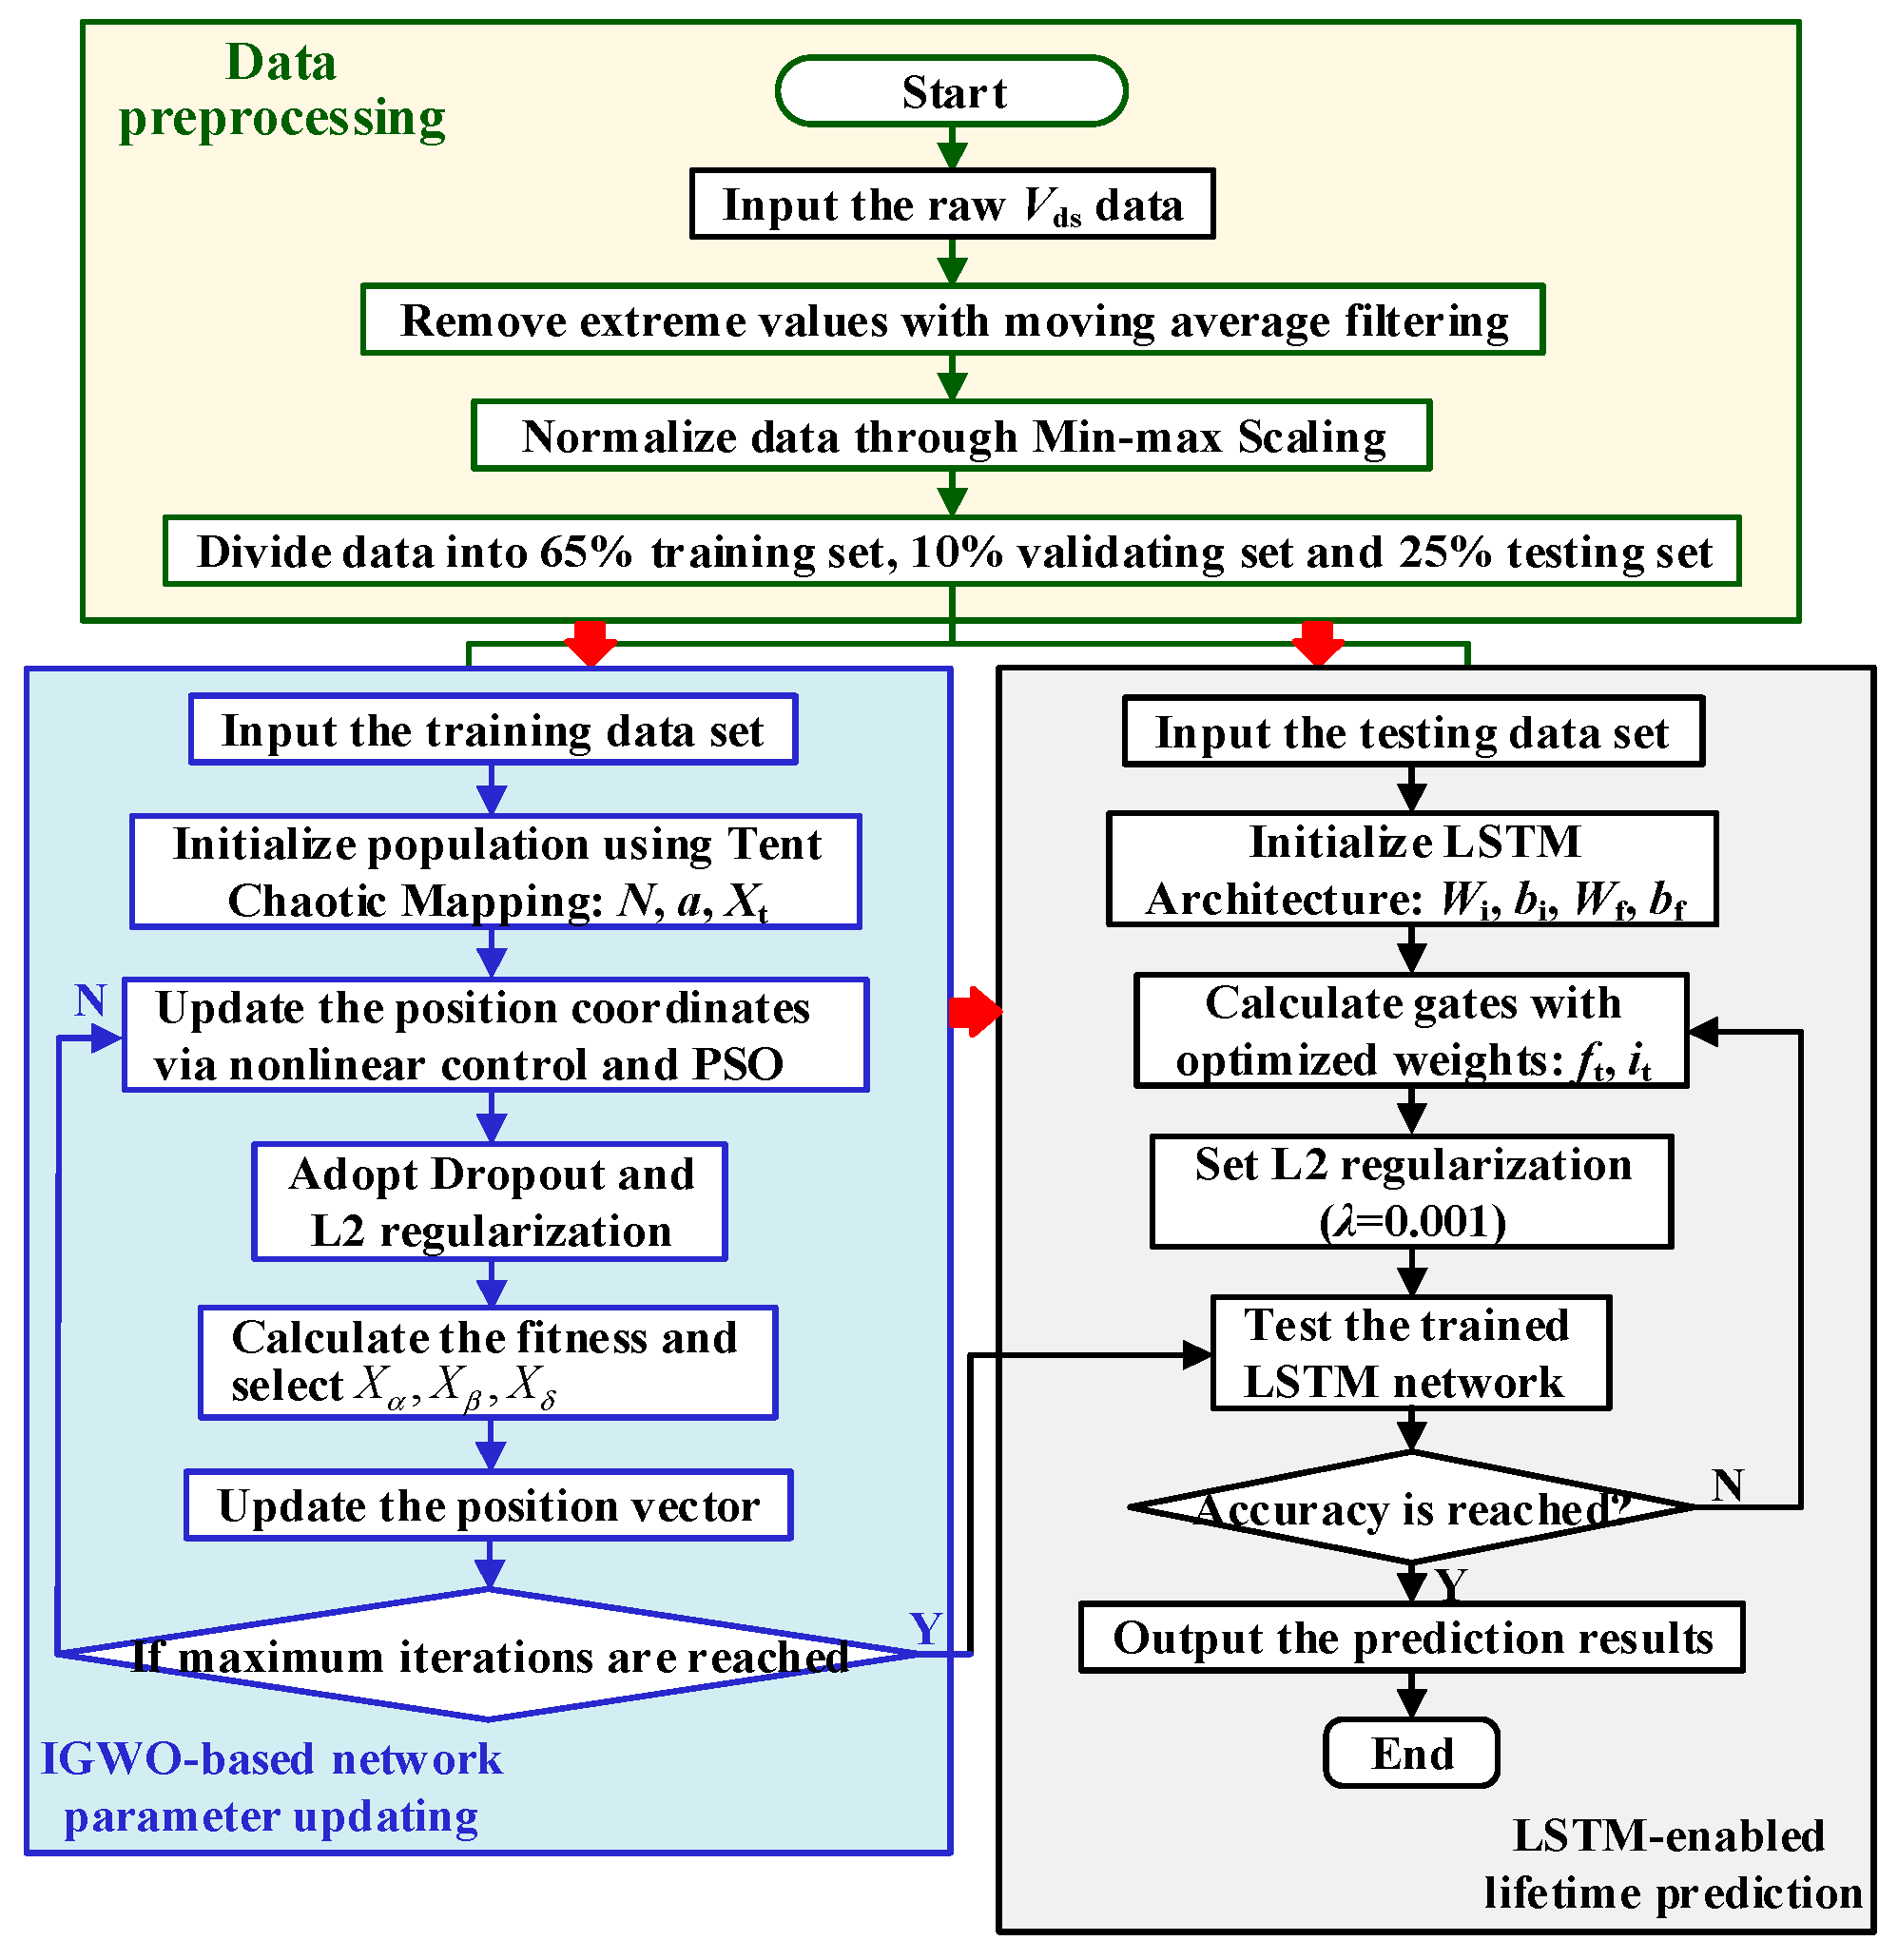
This paper employs an improved grey wolf optimizer (IGWO) to train the LSTM network, where the core trainable parameters including the weight matrices and bias vectors are optimized. The former Wi and Wf governs the strength of connections and the flow of information between neurons, while the latter bi and bf provides thresholds that regulate the activation of each gate. Both of them are crucial for the model to capture and memorize dependencies, directly determining the accuracy and stability of the final prediction. IGWO only optimizes the four parameters (Wi, Wf, bi, bf) and the best wolf’s solution is used to initialize the optimized parameters, followed by Adam gradient descent to refine these tensors once IGWO converges. The flowchart is shown in Figure 12.
Step 1: Collect the Vds dataset from SiC MOSFET under power cycling tests, which serves as the input dataset for the model.
Step 2: Eliminate abnormal data points. Divide the dataset sequentially from start to end into training, validation, and testing sets with a ratio of 65:10:25. Perform Min–Max normalization using parameters calculated from the training set. (While prediction performance improves with an increase in the size of the training set, the inclusion of later-stage data with a sharp rise in failure rates should be avoided in the training set.)
Step 3: Predict the future Vds sequence, analyze its degradation trend, and determine the remaining useful life (RUL) by the failure threshold. Set the initial model parameters as follows: window length L = 500, prediction horizon T = 50, population size N = 30, dimension of variables dim = 4, maximum iteration count tmax = 100. Set the constraint conditions for the weight matrices and the bias vectors to [−1, 1], which ensures stable training initiation for the LSTM’s sigmoidal activations and aligns with the L2 regularization in controlling model complexity. Set the learning rate to 0.001. To prevent overfitting, set the L2 regularization coefficient to 0.001. Define the mean square error (MSE) on the validation set as the objective function to evaluate the fitness of individuals with the following formula, where yi and Yi represent the actual and predicted value.
f MSE = 1 n i = 1 n Y i y i 2
Step 4: Treat the weight matrices Wi, Wf and the bias vectors bi, bf as the optimization variables in LSTM, which are integrated into the position vector of the grey wolf for optimization. The remaining output-gate and cell-state weights are randomly initialized and updated by subsequent Adam epochs together with the IGWO-refined parameters. Initialize the population of the IGWO with the Tent chaotic mapping.
Step 5: Commence the iterative optimization process. If t < tmax, update the coefficients A and C using a nonlinear control parameter strategy. Then update the position of each wolf by integrating the social cognitive concept from the PSO concept mechanism.
Step 6: Compare the fitness value with that of each generation. If the current fitness is superior to the historical best record, update the global best solution.
Step 7: Terminate the search process and output the optimal parameter combination when the fitness meets the requirement or the maximum number of iterations is reached.
Step 8: Configure the LSTM model with this optimal parameter set. Apply the L2 regularization during the training process, execute the training, and evaluate the final prediction performance.

4. The Accelerated Ageing Test of SiC MOSFET

This paper conducts an accelerated ageing test that utilizes a DC power cycling test (PCT) with constant case temperature control for obtaining data to validate the proposed prognostic method. This method can reduce testing time, better simulate actual operating conditions, and enhance the accuracy and reliability. We conducted multiple groups of power cycling ageing tests on two types of SiC MOSFET including IMW65R060M2H rated at 650 V/23.3 A in a TO-247 package and IMW65R107M1HXKSA1 rated at 650 V/20 A in a TO-247 package, which have different conduction resistances of 73 mΩ and 142 mΩ, respectively and are manufactured by Infineon Technologies AG, headquartered in Neubiberg, Germany. This was performed to avoid the randomness of failure phenomenon. Two sets of data were selected from each type for analysis with the consideration of similarity in the ageing trends of the same type.
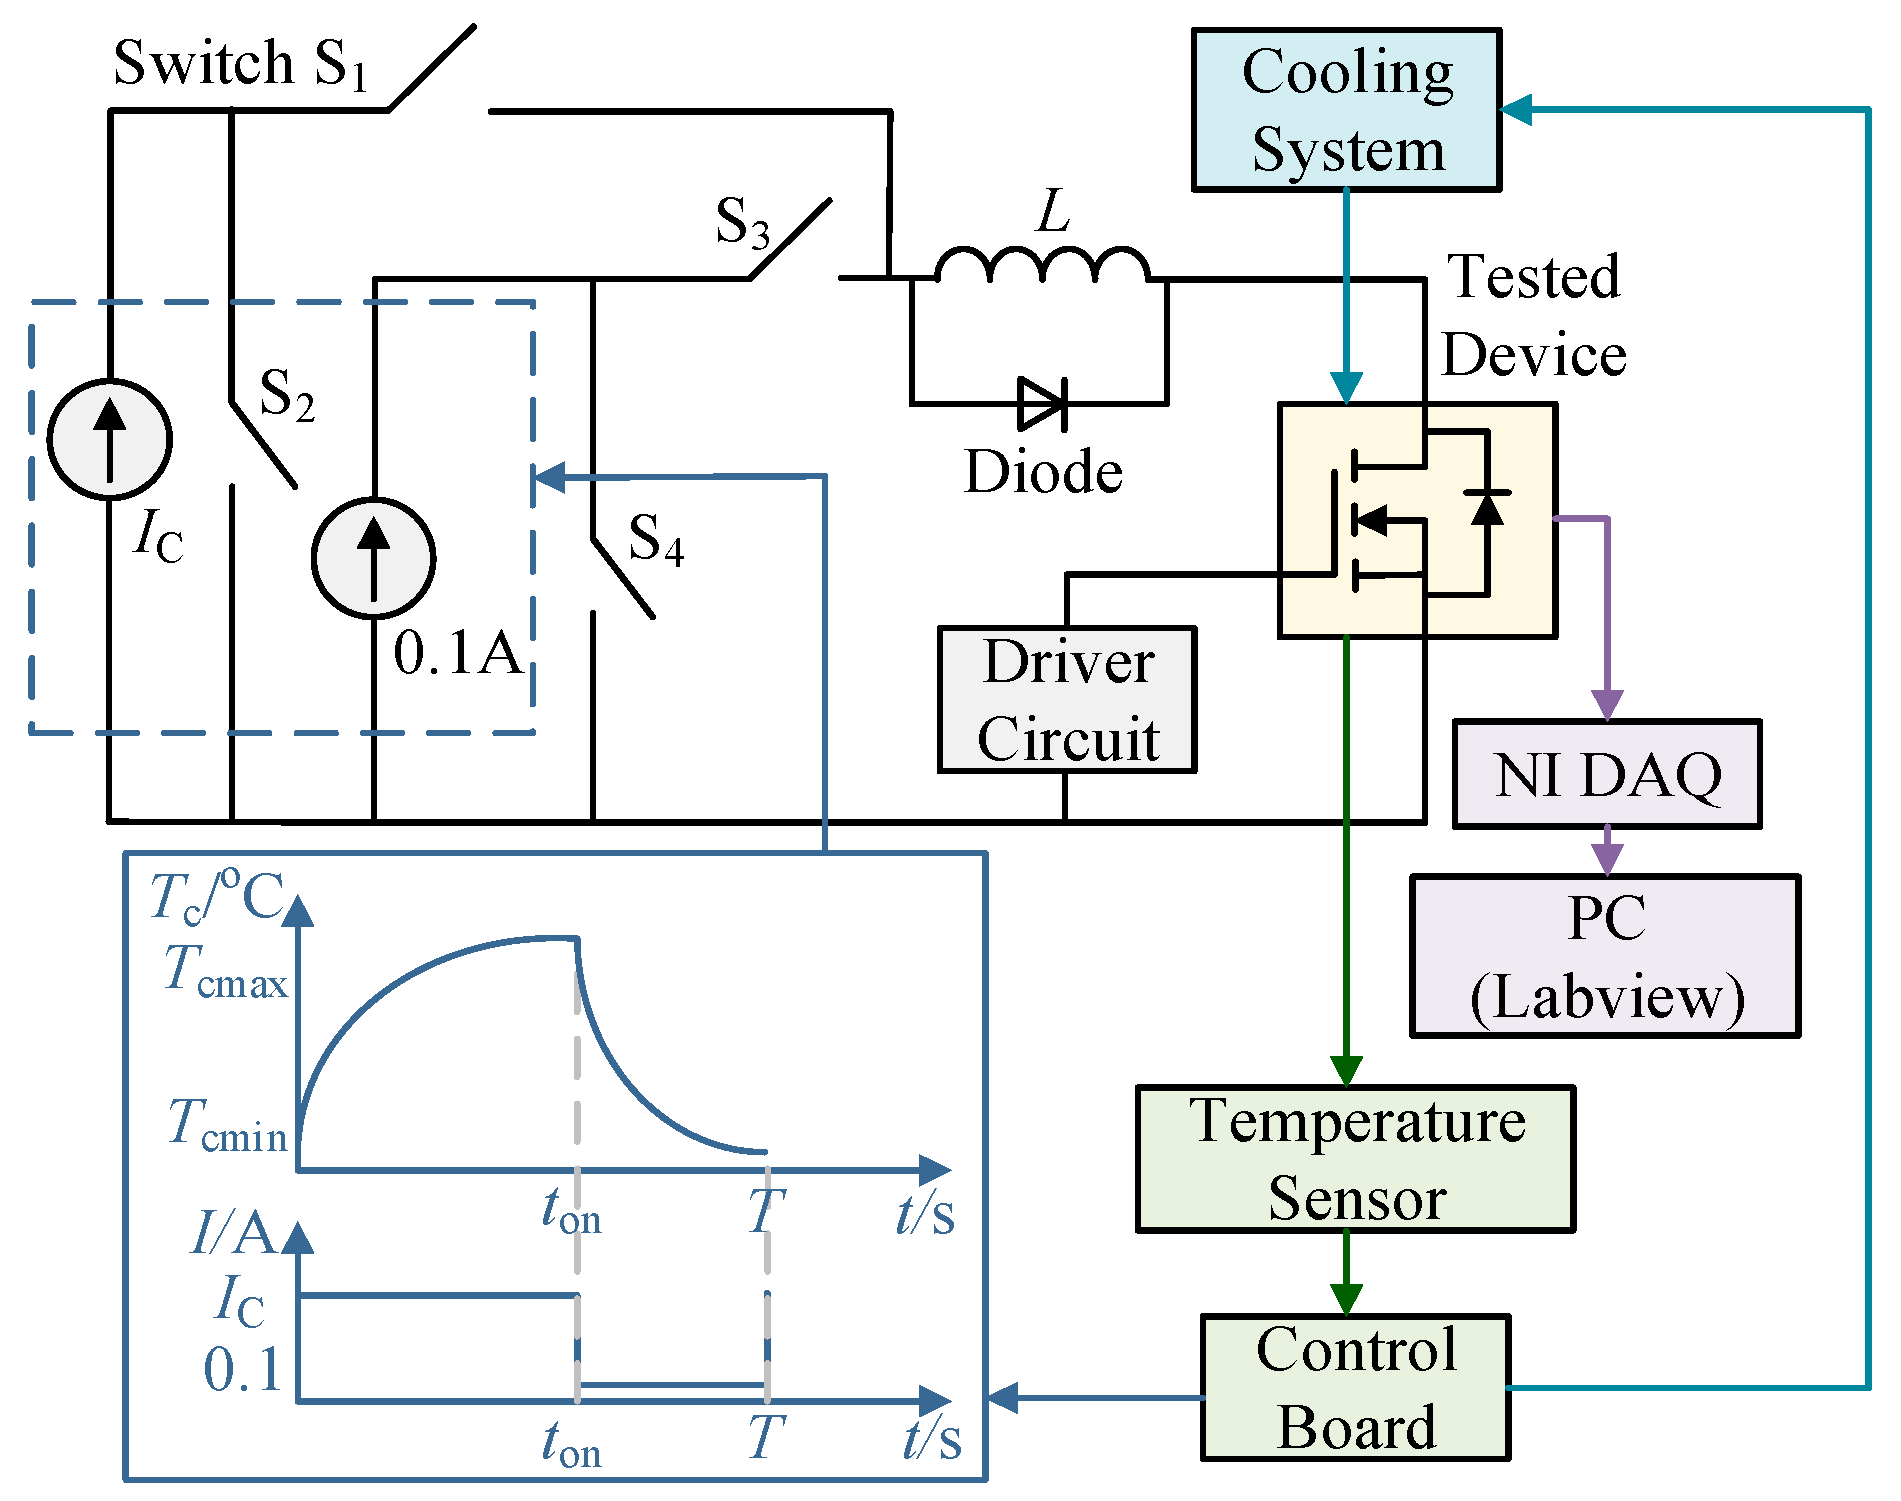
A typical power cycling test is reported in Figure 13, where the maximum case temperature Tcmax and the minimum case temperature Tcmin are fixed to the desired values. Tc is selected as the indicator for the end of the heating and cooling process since Tc can be directly measured by a temperature sensor without damaging the packaging. When the control switch S1 provides an on-state signal, SiC MOSFET experiences high power consumption due to the large current, making Tc rise rapidly [42]. Moreover, the external high-current is removed once Tc reaches Tcmax, and a 100 mA current is applied. (The low current maintains weak thermal conduction, ensuring more stable measurements during current switching.) Simultaneously, the cooling system operates to reduce Tc of SiC MOSFET until it reaches Tcmin. This cycle repeats continuously until the failure criterion of SiC MOSFET is satisfied.
Table 3 presents the details of the test conditions used in PCTs. The minimum case temperature (Tcmin) was set at 50 °C and the maximum case temperature (Tcmax) was set at 155 °C in this experiment. Temperature fluctuations were achieved by applying a periodic current. Research shows that the fast power cycling (time period is tens of seconds) and higher temperature swing (ΔT > 100 K) leads to wire bond failure [43]. This study employs SiC MOSFET devices with similar specifications but significantly different internal resistances. A rated current is applied to each device to ensure consistent relative current stress conditions, thereby simulating their lifetime performance. The IMW65R060M2H device exhibits reduced power dissipation and thus generates less heat with slower temperature rise rates, due to its consequent lower on-state resistance. In addition, Vds is proved to be the typical failure indicator, and the failure criterion is considered as an increase of Vds by 5%, which represents the bond wire degradation with cracks [44].
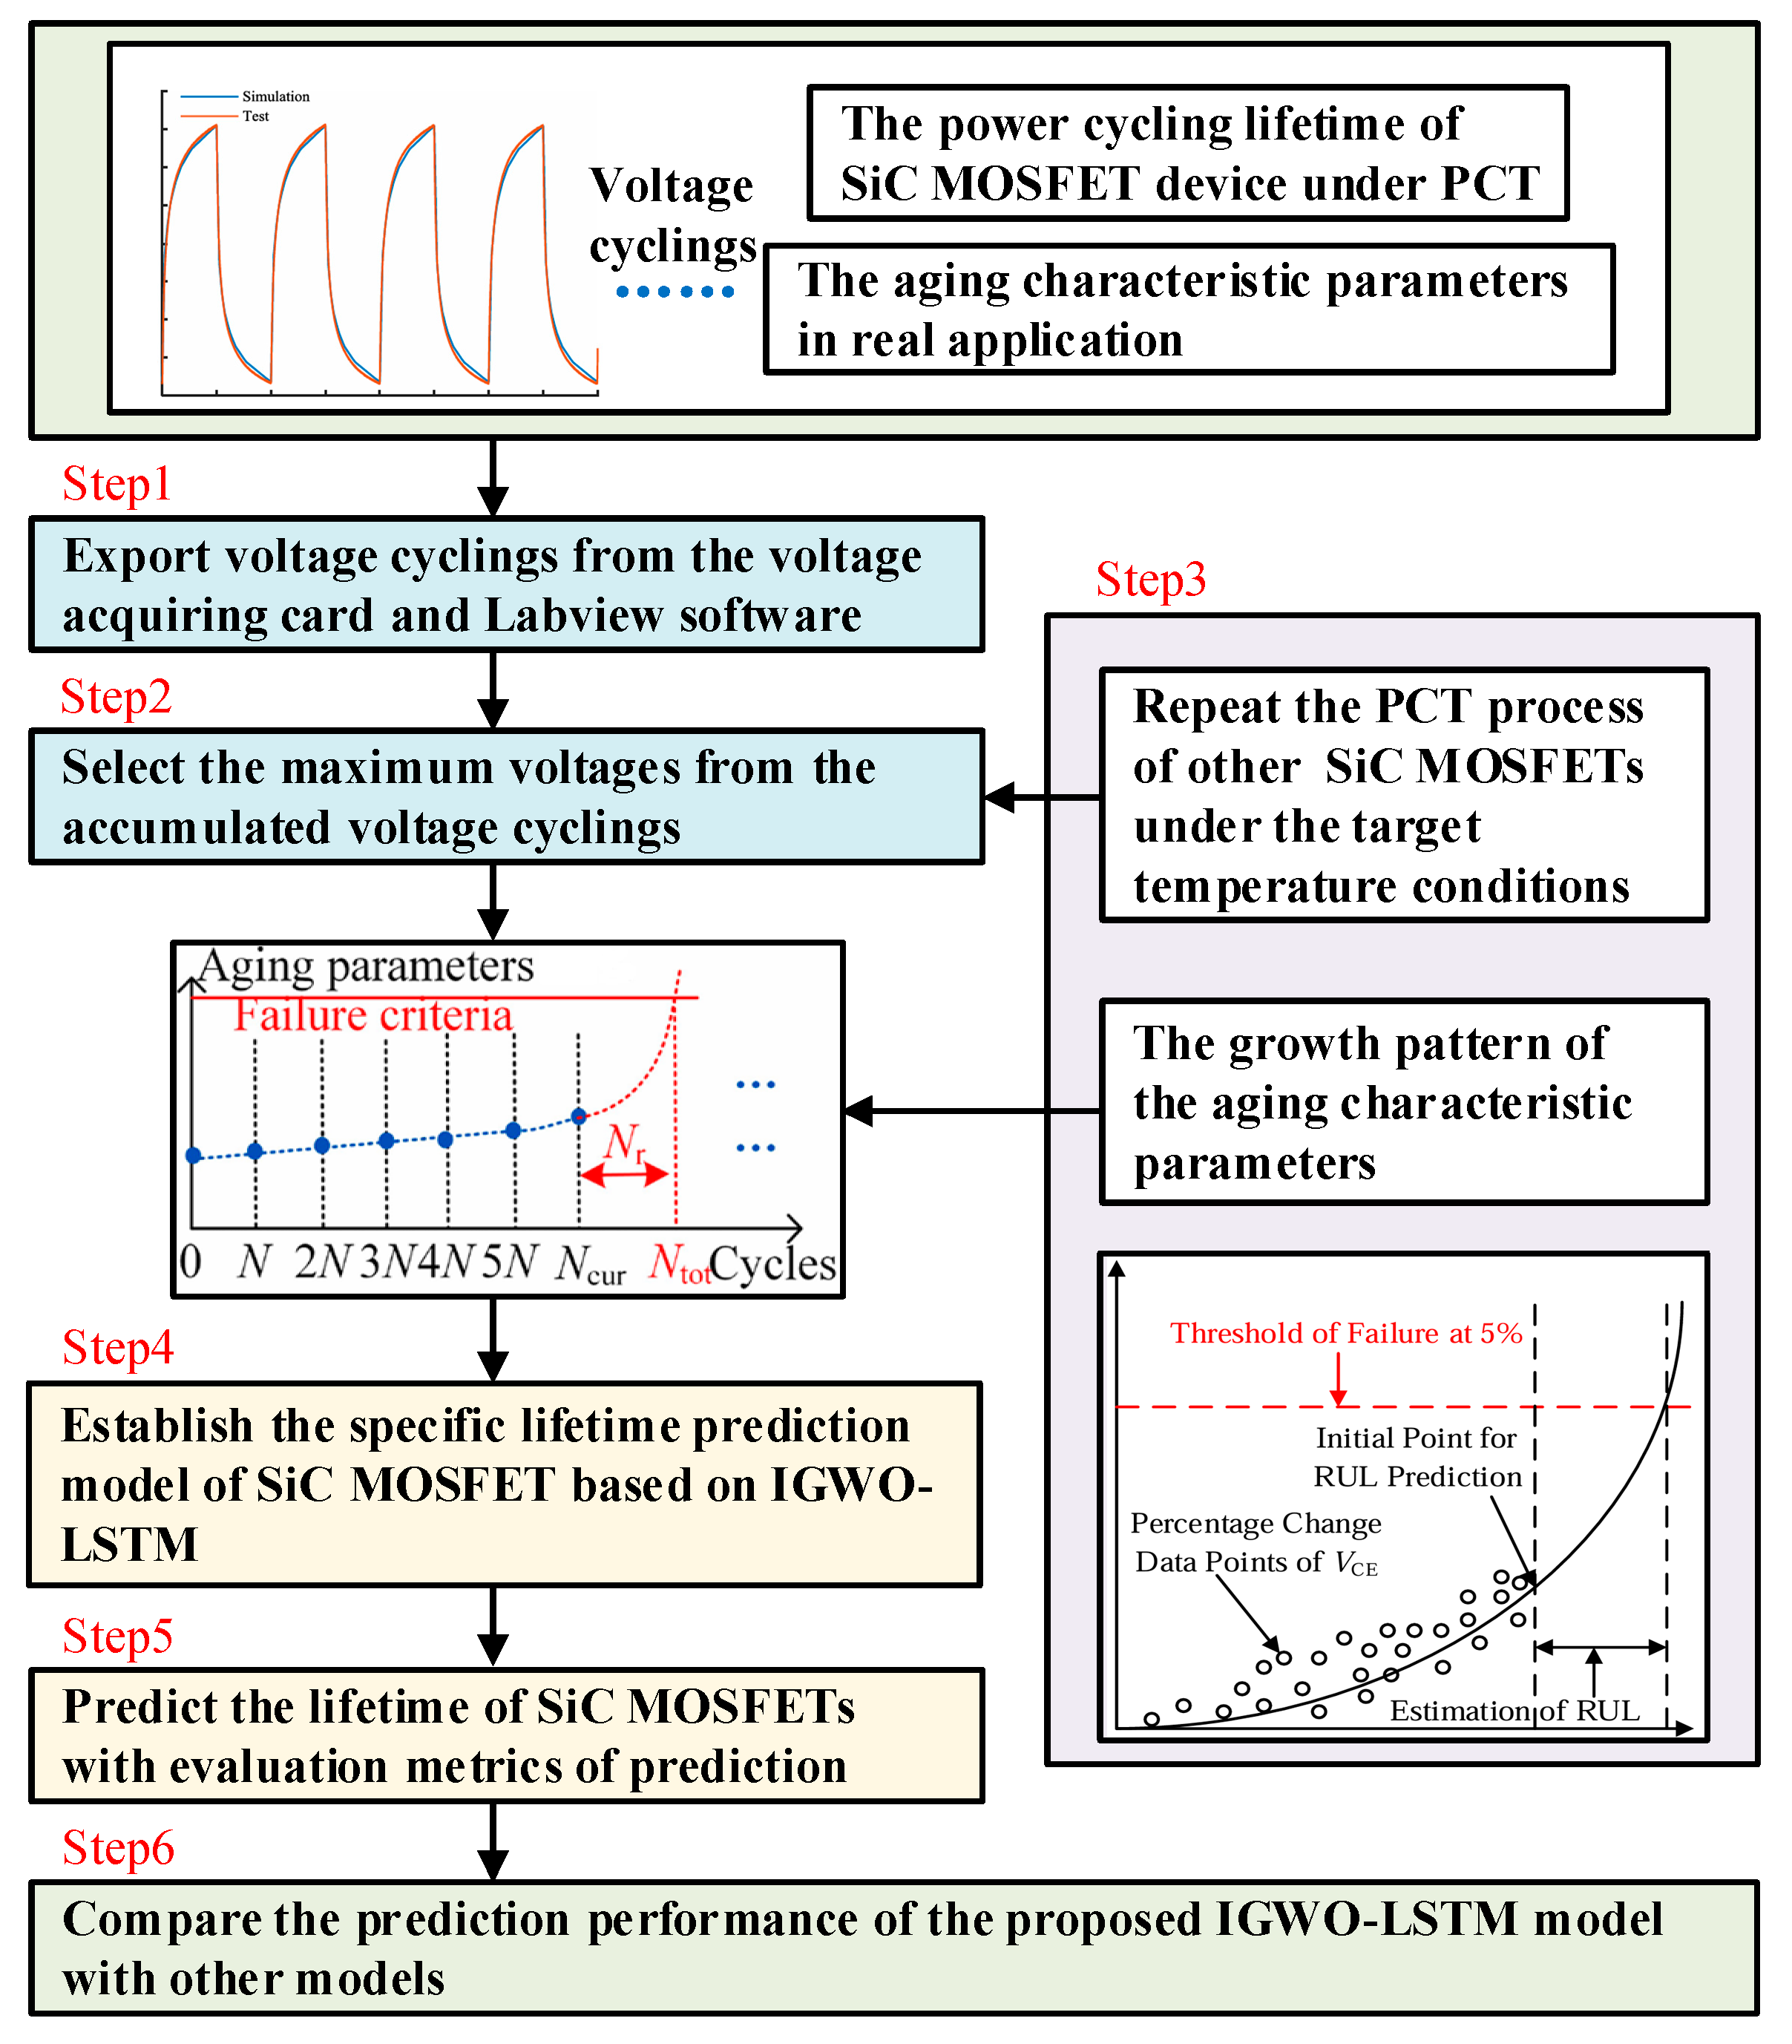
The experimental platform shown in Figure 14 is divided into three parts: the main power circuit, the drive circuit, and the measurement circuit. The main power circuit is composed of a DC power supply, a tested SiC MOSFET device, control switches, and a protective inductor. The drive circuit provides a drive voltage ranging from −5 V to 15 V. The measurement circuit employs isolated operational amplifiers for galvanic isolation from the main circuit and adopts a differential configuration to reduce common-mode interference and enhance accuracy. In addition, a K-type thermocouple is mounted on the substrate of MOSFET for temperature acquisition, ranging from −20 °C to 200 °C. Periodic calibration procedures are used to suppress error propagation induced by sensor degradation. After that, the voltage from the thermocouple is converted into temperature via the NI USB-6009 data acquisition card, and these readings are displayed in LabView-2016 software on a PC. The specific procedure is shown in Figure 15. The maximum Vds value is extracted from each complete power cycling cycle to build the time-series dataset for model training, as it directly corresponds to the maximum junction temperature and is the most sensitive indicator of bond wire ageing-induced conduction resistance degradation.

5. Analysis of Prediction Results

5.1. Health Assessment Model of SiC MOSFET

This paper selects the root mean square error (RMSE), the coefficient of determination named R-squared (R2), mean absolute error (MAE), and mean absolute percentage error (MAPE) as the evaluation metrics for the model to quantitatively evaluate the predictive performance [45]. RMSE penalizes larger errors, while MAE offers an intuitive measure of average absolute deviation. MAPE provides a scale-independent measure of relative error, facilitating cross-dataset comparisons. Finally, R2 determines the predictive consistency by measuring the strength of the alignment between the model’s predictions and the actual data. The calculation formulas are as follows.
RMSE = 1 n i = 1 n Y i y i 2
R 2 = 1 i = 1 n y i Y i 2 i = 1 n y i y ¯ 2
MAE = 1 n i = 1 n y i Y i
MAPE = 100 % n i = 1 n y i Y i y i
In the formula, yi represents the actual output value, Yi represents the predicted value of the model, n represents the number of data points, and y ¯   indicates the average of the actual values.

5.2. The Process of Data Processing

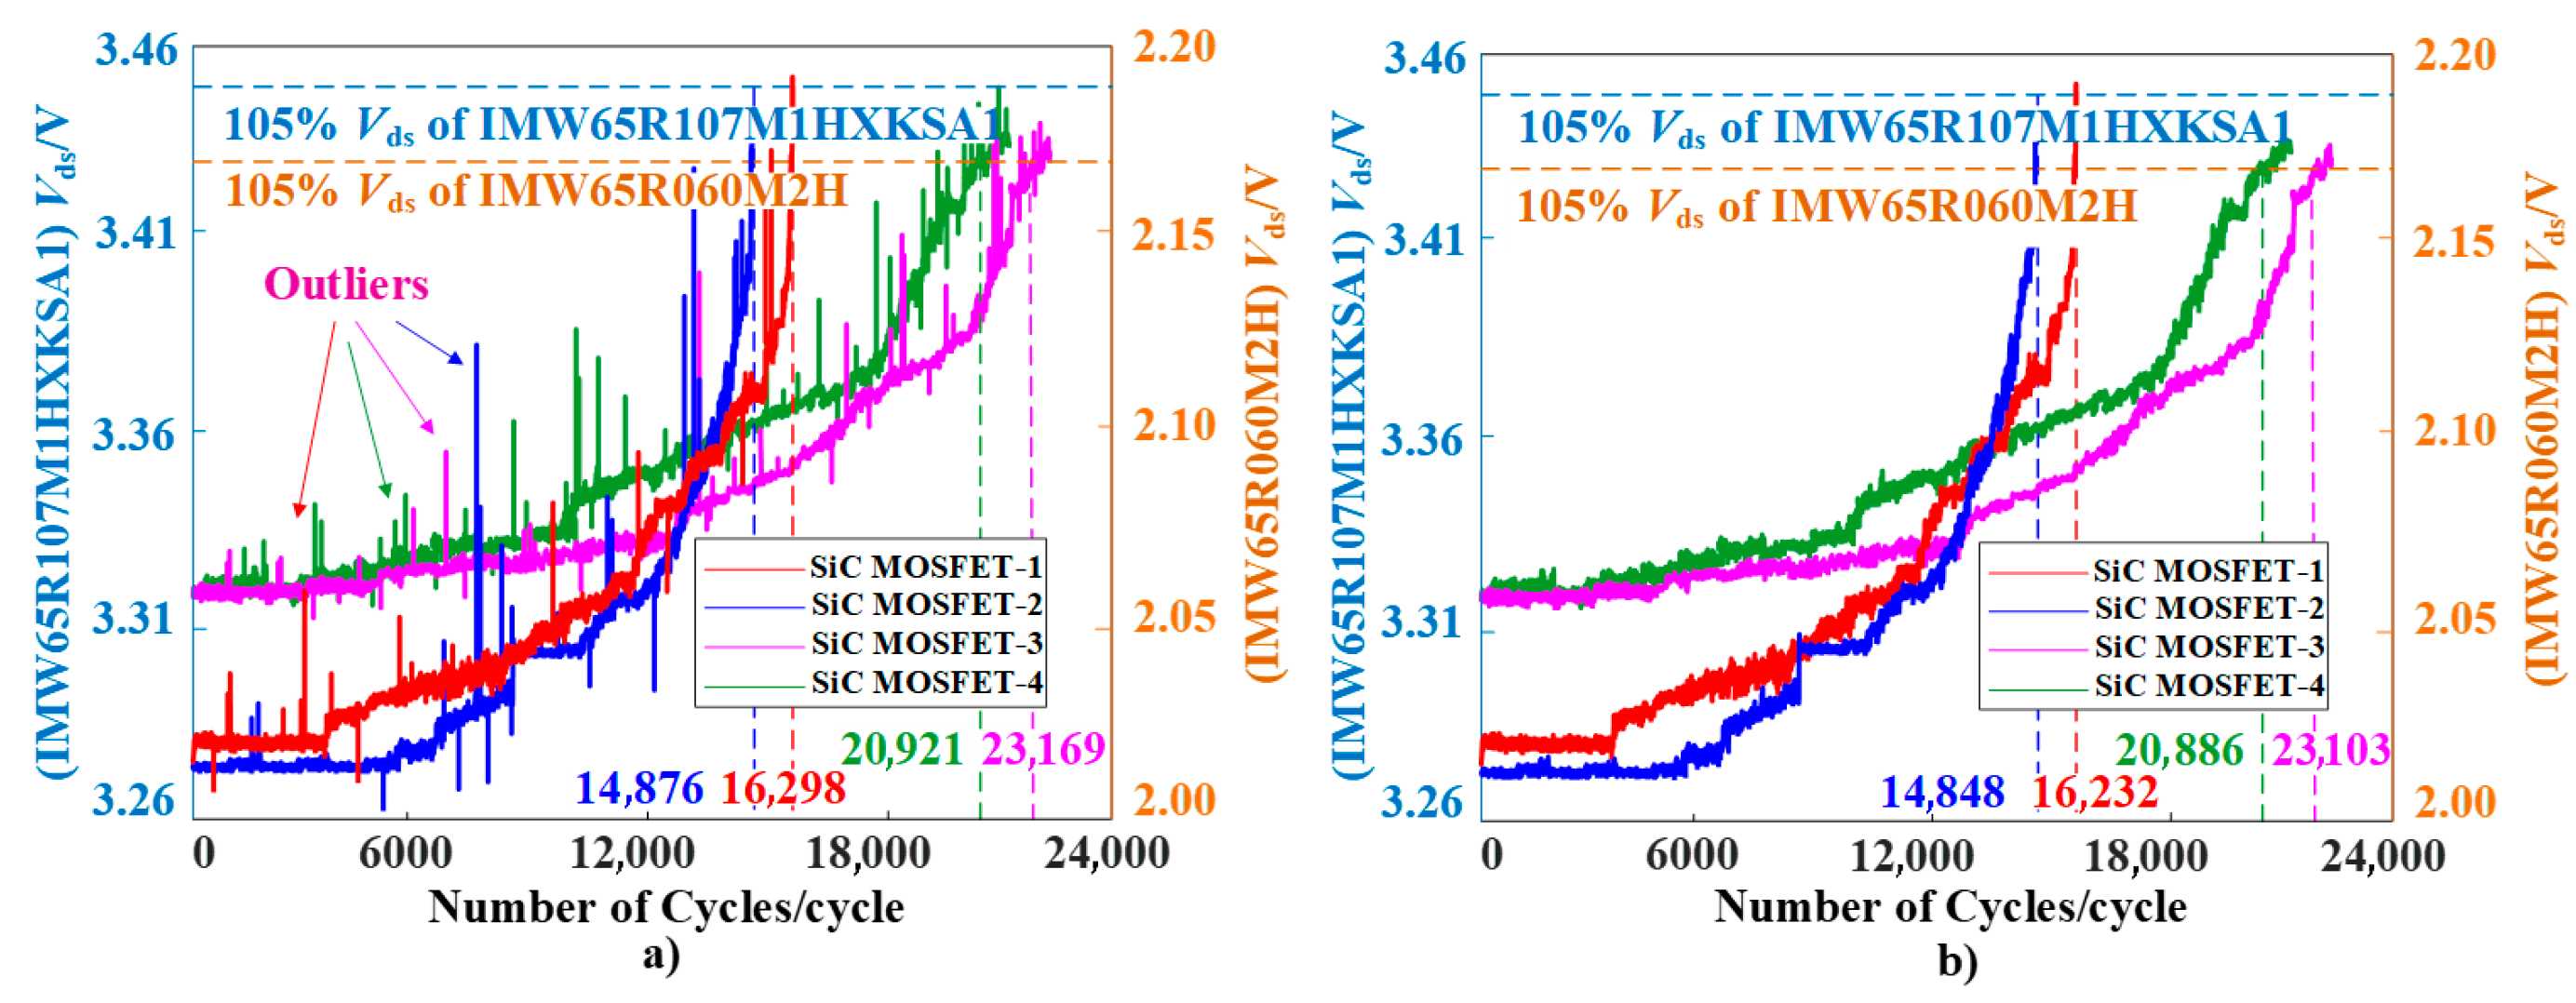
The first step in lifetime prediction is obtaining the Vds data of SiC MOSFET. External environmental interference and measurement noise may impact the data acquisition and result in noise signals. Data points exhibiting amplitude deviations exceeding 10% from the normal operational range are classified as anomalies. The experimental data after being processed by moving average filtering is shown in Figure 16. The number of burrs and abrupt changes in the curve decreases significantly after processing and the denoised curve becomes smoother compared to original curves and exhibits a more pronounced upward trend.
The experiment recorded 16,232, 14,848, 23,103, and 20,886 Vds data points after data processing from initial operation to failure, respectively. The higher Rdson leads to more conduction loss, while causing a significant elevation in Tj and inducing accelerated thermal fatigue degradation of device materials. Consequently, SiC MOSFET-1 and SiC MOSFET-2 suffer from markedly shorter lifetimes under same constant case temperature power cycling conditions. Vds of four SiC MOSFETs exhibited a gradual increase and rise drastically from the 14,264 cycle, 13,257 cycle, 20,528 cycle, and 18,323 cycle at 3.3845 V, 3.3811 V, 2.1300 V, and 2.1321 V, respectively. It is clear that all four Vds curves of SiC MOSFET exhibit the same change trend. They exhibit a linear low-speed growth stage initially and exhibit a polynomial high-speed growth stage after the specific number of cycles. This could be attributed to the bond wire liftoff, which leads to the large current in the remaining bond wires and forms a local hotspot around the left wire bonds on the chip. In other words, there was a significant jump in Vds after the failure of the bonding wire in SiC MOSFET.

5.3. The Analysis of Life Prediction Results

The four failure datasets are partitioned as follows: the first 65% of each is designated as the training set, 10% is allocated for validation, and the remaining portion is reserved for testing. The predictive performance increases with the size of the training set, but we should prevent the steeply rising failure part of data in later stages from being included in the training set. All models in this study consist of a neural network where one input neuron involved Vds, five hidden layer neurons, and one output neuron involved lifetime cycles. Five hidden layers can not only meet the learning demands for the complex features of data but also control training complexity and time. A comparative analysis was performed between the IGWO-LSTM model and existing prediction approaches including WOA-LSTM, PSO-LSTM, and GWO-LSTM models to evaluate their respective characteristics.
Figure 17 presents that the predicted curves of IGWO-LSTM are shown to align more precisely with the actual curves for four SiC MOSFETs. The model exhibits exceptional accuracy in high-variability regions, which typically correspond to the critical acceleration phase of bond wire fatigue, indicating that the IGWO-LSTM model has successfully learned the underlying nonlinear physical evolution of the failure mechanism. Furthermore, the error distribution curve of IGWO-LSTM is concentrated around zero error, but curves of other algorithms are more dispersed with larger error values. Table 4 exhibits that IGWO-LSTM achieves higher R2 recorded at 96.2%, 94.8%, 94.1%, and 93.9%, respectively, outperforming WOA-LSTM, PSO-LSTM, and GWO-LSTM by an average of 16, 8, and 4 percentage points. The results demonstrate that IGWO-LSTM enhanced prediction accuracy and its capability to search for nonlinear model patterns. Additionally, the RMSEs of IGWO-LSTM are measured at 0.0117, 0.0143, 0.0152, and 0.0158. It reduces average error of 67.03%, 50.39%, and 31.57% relative to the other methods. Similarly, IGWO-LSTM achieves reductions in MAE of approximately 68%, 50%, and 30%, with corresponding reductions in MAPE of about 70%, 48%, and 26%, respectively, further validating its superior stability and precision in prediction. In addition, the LSTM baseline is omitted from the figures for brevity due to its significantly lower prediction accuracy compared to IGWO-LSTM.
Overall, IGWO-LSTM exhibits higher prediction accuracy and stronger potential when handling complex fluctuating data. The experimental results demonstrate that IGWO-LSTM surpasses conventional methods in the dynamic consistency for long-term prediction, offering a more dependable and precise solution for the lifetime prediction of SiC MOSFET. This conclusion verifies the effectiveness of the proposed method.

6. Conclusions

This paper innovatively proposes a lifetime prediction model for SiC MOSFET based on improved grey wolf-optimized long short-term memory (IGWO-LSTM) networks. The enhanced performance is achieved through three key modifications to the standard GWO algorithm. Tent chaotic mapping is employed for population initialization to improve search efficiency, a sinusoidal-based nonlinear convergence factor strategy is developed to better balance global and local exploration, and the PSO historical best-position mechanism is incorporated to prevent premature convergence. The proposed model has been validated through device-level power cycling tests, and the methodology shows potential for system-level lifecycle analysis. For example, in a Wireless Electric Vehicle Charging (WEVC) system, the core high-frequency inverter utilizes SiC MOSFETs that endure dynamic electro-thermal stresses, which are intensified by factors such as misalignment between the ground and vehicle assemblies. The model can be trained to evaluate the accumulated damage of MOSFETs under such system operating conditions and predict their remaining useful life from mission profiles characterized by current and temperature fluctuations. Its practical value in system-level lifecycle management will be further demonstrated in future work.

Author Contributions

Writing—original draft, P.D. and J.B.; Writing—review & editing, P.D. and J.B.; Supervision, M.G. and Q.X.; Funding acquisition, Z.G. All authors have read and agreed to the published version of the manuscript.

Funding

This work was supported in part by the National Natural Science Foundation of China under Grant 52277205 and in part by the Natural Science Foundation of Jiangsu Province under Grant BK20230108.

Data Availability Statement

Data are contained within the article.

Conflicts of Interest

The authors declare no conflict of interest.

References

  1. Ni, Z.; Lyu, X.; Yadav, O.P.; Singh, B.N.; Zheng, S.; Cao, D. Overview of Real-Time Lifetime Prediction and Extension for SiC Power Converters. IEEE Trans. Power Electron. 2020, 35, 7765–7794. [Google Scholar] [CrossRef]
  2. Cheng, H.-C.; Syu, J.-Y.; Wang, H.-H.; Liu, Y.-C.; Kao, K.-S.; Chang, T.-C. Power Cycling Modeling and Lifetime Evaluation of SiC Power MOSFET Module Using a Modified Physical Lifetime Model. IEEE Trans. Device Mater. Reliab. 2024, 24, 142–153. [Google Scholar] [CrossRef]
  3. Ceccarelli, L.; Kotecha, R.M.; Bahman, A.S.; Iannuzzo, F.; Mantooth, H.A. Mission-profile-based lifetime prediction for a SiC MOSFET power module using a multi-step condition-mapping simulation strategy. IEEE Trans. Power Electron. 2019, 34, 9698–9708. [Google Scholar] [CrossRef]
  4. Hanif, A.; Yu, Y.; DeVoto, D.; Khan, F. A Comprehensive Review Toward the State-of-the-Art in Failure and Lifetime Predictions of Power Electronic Devices. IEEE Trans. Power Electron. 2019, 34, 4729–4746. [Google Scholar] [CrossRef]
  5. Dusmez, S.; Duran, H.; Akin, B. Remaining useful lifetime estimation for thermally stressed power MOSFETs based on on-state resistance variation. IEEE Trans. Ind. Appl. 2016, 52, 2554–2563. [Google Scholar] [CrossRef]
  6. Shu, X.; Li, G.; Zhang, Y.; Shen, S.; Chen, Z.; Liu, Y. Stage of Charge Estimation of Lithium-Ion Battery Packs Based on Improved Cubature Kalman Filter With Long Short-Term Memory Model. IEEE Trans. Transp. Electrif. 2021, 7, 1271–1284. [Google Scholar] [CrossRef]
  7. Nguyen, B.V.; Jeon, J.W. Enhancing Particle Filter Performance for High Accuracy State Estimation and RUL Prediction. IEEE Trans. Instrum. Meas. 2025, 74, 3537112. [Google Scholar] [CrossRef]
  8. Martínez, A.L.H.; Khursheed, S.; Alnuayri, T.; Rossi, D. Online Remaining Useful Lifetime Prediction Using Support Vector Regression. IEEE Trans. Emerg. Top. Comput. 2022, 10, 1546–1557. [Google Scholar] [CrossRef]
  9. Qian, Y.; Hou, F.; Fan, J.; Lv, Q.; Fan, X.; Zhang, G. Design of a Fan-Out Panel-Level SiC MOSFET Power Module Using Ant Colony Optimization-Back Propagation Neural Network. IEEE Trans. Electron Devices 2021, 68, 3460–3467. [Google Scholar] [CrossRef]
  10. Wang, L.; Littler, T.; Liu, X. Dynamic Incipient Fault Forecasting for Power Transformers Using an LSTM Model. IEEE Trans. Dielectr. Electr. Insul. 2023, 30, 1353–1361. [Google Scholar] [CrossRef]
  11. Miao, Y.; Bai, X.; Cao, Y.; Liu, Y.; Dai, F.; Wang, F.; Qi, L.; Dou, W. A Novel Short-Term Traffic Prediction Model Based on SVD and ARIMA With Blockchain in Industrial Internet of Things. IEEE Internet Things J. 2023, 10, 21217–21226. [Google Scholar] [CrossRef]
  12. Shi, J.; Wang, Y.; Zhou, Y.; Ma, Y.; Gao, J.; Wang, S.; Fu, Z. Bayesian Optimization—LSTM Modeling and Time Frequency Correlation Mapping Based Probabilistic Forecasting of Ultra-short-term Photovoltaic Power Outputs. IEEE Trans. Ind. Appl. 2024, 60, 2422–2430. [Google Scholar] [CrossRef]
  13. Yu, Y.; Jiang, Y.; Li, C. Remaining Life Prediction Method for Mechano-Thermal Aged Insulating Paper Based on Whale Optimization Algorithm-Long Short-Term Memory Network Model. Trans. China Electrotech. Soc. 2022, 37, 3162–3171. [Google Scholar]
  14. Liu, Q. Failure Modeling and Prediction of Low-Power IGBT. Master’s Thesis, Beijing Jiaotong University, Beijing, China, 2022. [Google Scholar]
  15. Xu, H.; Xu, Q.; Duanmu, F.; Shen, J.; Jin, L.; Gou, B.; Wu, F.; Zhang, W. State-of-Charge Estimation of Lithium-Ion Batteries Based on EKF Integrated With PSO-LSTM for Electric Vehicles. IEEE Trans. Transp. Electrif. 2025, 11, 2311–2321. [Google Scholar] [CrossRef]
  16. Pan, J.; Jing, B.; Jiao, X.; Wang, S. Analysis and Application of Grey Wolf Optimizer-Long Short-Term Memory. IEEE Access 2020, 8, 121460–121468. [Google Scholar] [CrossRef]
  17. Zhu, N.; Mantooth, H.A.; Xu, D.; Chen, M.; Glover, M.D. A Solution to Press-Pack Packaging of SiC MOSFETS. IEEE Trans. Ind. Electron. 2017, 64, 8224–8234. [Google Scholar] [CrossRef]
  18. Chen, W.; Jiang, J.; Meda, A.H.; Ibrahim, M.S.; Zhang, G.; Fan, J. A Thin and Low-Inductance 1200 V SiC MOSFET Fan-Out Panel-Level Packaging With Thermal Cycling Reliability Evaluation. IEEE Trans. Electron Devices 2023, 70, 2268–2275. [Google Scholar] [CrossRef]
  19. Lee, H.; Smet, V.; Tummala, R. A Review of SiC Power Module Packaging Technologies: Challenges, Advances, and Emerging Issues. IEEE J. Emerg. Sel. Top. Power Electron. 2020, 8, 239–255. [Google Scholar] [CrossRef]
  20. DiMarino, C.; Mouawad, B.; Johnson, C.M.; Wang, M.; Tan, Y.-S.; Lu, G.-Q.; Boroyevich, D.; Burgos, R. Design and Experimental Validation of a Wire-Bond-Less 10-kV SiC MOSFET Power Module. IEEE J. Emerg. Sel. Top. Power Electron. 2020, 8, 381–394. [Google Scholar] [CrossRef]
  21. Li, Q.; Li, Y.-B.; Fu, H.-D.; Tu, C.-M.; Xiao, B.; Xiao, F.; Zhai, D.-Y.; Lu, J.-W. Review of the Failure Mechanism and Methodologies of IGBT Bonding Wire. IEEE Trans. Compon. Packag. Manuf. Technol. 2023, 13, 1045–1057. [Google Scholar] [CrossRef]
  22. Chen, J.; Deng, E.; Liu, P.; Yang, S.; Huang, Y. The Influence and Application of Bond Wires Failure on Electrothermal Characteristics of IGBT Module. IEEE Trans. Compon. Packag. Manuf. Technol. 2021, 11, 1426–1434. [Google Scholar] [CrossRef]
  23. Yang, X.; Ye, J.; Wu, X.; Heng, K.; He, Y.; Liu, G. Lifetime Prediction for Lift-off of Bond Wires in IGBTs Using Paris Law With Analytical Calculation of Crack Length. IEEE Trans. Power Electron. 2023, 38, 13099–13110. [Google Scholar] [CrossRef]
  24. Vemulapati, U.R.; Bianda, E.; Torresin, D.; Arnold, M.; Agostini, F. A Method to Extract the Accurate Junction Temperature of an IGCT During Conduction Using Gate–Cathode Voltage. IEEE Trans. Power Electron. 2016, 31, 5900–5905. [Google Scholar] [CrossRef]
  25. Yi, J.; Ma, C.; Wang, H. A Data-Driven Remaining Useful Life Prediction Method for Power MOSFETs Considering Nonlinear Dynamical Behaviors. IEEE Trans. Electron Devices 2025, 72, 1885–1892. [Google Scholar] [CrossRef]
  26. Yang, L.; Agyakwa, P.A.; Johnson, C.M. Physics-of-failure lifetime prediction models for wire bond interconnects in power electronic modules. IEEE Trans. Device Mater. Reliab. 2012, 13, 9–17. [Google Scholar] [CrossRef]
  27. Li, Y.; Zhou, X.; Zhao, Y.; Jia, Y.; Hu, D.; Wu, Y.; Zhang, L.; Chen, Z.; Huang, A.Q. Gate Bias Dependence of VTH Degradation in Planar and Trench SiC MOSFETs Under Repetitive Short Circuit Tests. IEEE Trans. Electron Devices 2022, 69, 2521–2527. [Google Scholar] [CrossRef]
  28. Smirnov, V.; Gavrikov, A.; Neichev, V. Measuring Specificities of Thermal Resistance of IGBT Power Modules. IEEE Trans. Compon. Packag. Manuf. Technol. 2024, 14, 2348–2354. [Google Scholar] [CrossRef]
  29. Zhang, Z.; Dyer, J.; Wu, X.; Wang, F.; Costinett, D.; Tolbert, L.M.; Blalock, B.J. Online junction temperature monitoring using intelligent gate drive for SiC power devices. IEEE Trans. Power Electron. 2019, 34, 7922–7932. [Google Scholar] [CrossRef]
  30. Karki, U.; Peng, F.Z. Effect of gate oxide degradation on electrical parameters of power MOSFETs. IEEE Trans. Power Electron. 2018, 33, 10764–10773. [Google Scholar] [CrossRef]
  31. AQG 324; Qualification of Power Modules for Use in Power Electronics Converter Units (PCUs) in Motor Vehicles. ECPE: Nuremberg, Germany, 2021.
  32. GSO IEC 60749-34:2014; Semiconductor Devices—Mechanical and Climatic Test Methods—Part 34: Power Cycling. Gulf Standardization Organization (GSO): Riyadh, Saudi Arabia, 2014.
  33. JEDEC JESD22-A122A; Power Cycling. JEDEC Solid State Technology Association: Arlington, VA, USA, 2016.
  34. Qin, Y.; Xiang, S.; Chai, Y.; Chen, H. Macroscopic–Microscopic Attention in LSTM Networks Based on Fusion Features for Gear Remaining Life Prediction. IEEE Trans. Ind. Electron. 2020, 67, 10865–10875. [Google Scholar] [CrossRef]
  35. Xu, L.; Wang, H.; Lin, W.; Gulliver, T.A.; Le, K.N. GWO-BP Neural Network Based OP Performance Prediction for Mobile Multiuser Communication Networks. IEEE Access 2019, 7, 152690–152700. [Google Scholar] [CrossRef]
  36. Hou, K.; Guo, M.; Li, X.; Zhang, H. Research on Optimization of GWO-BP Model for Cloud Server Load Prediction. IEEE Access 2021, 9, 162581–162589. [Google Scholar] [CrossRef]
  37. Deng, W.; Feng, J.; Zhao, H. Autonomous Path Planning via Sand Cat Swarm Optimization With Multistrategy Mechanism for Unmanned Aerial Vehicles in Dynamic Environment. IEEE Internet Things J. 2025, 12, 26003–26013. [Google Scholar] [CrossRef]
  38. Duan, B.; Ma, Y.; Liu, J.; Jin, Y. A Nonlinear Grey Wolf Optimizer Based on Chaotic Mapping and Opposition-Based Learning Mechanism. Softw. Eng. 2023, 26, 36–40. [Google Scholar]
  39. Teng, Z.; Lv, J.; Guo, L.; Xu, Y. An Improved Hybrid Grey Wolf Optimization Algorithm Based on Tent Mapping. J. Harbin Inst. Technol. 2018, 50, 40–49. [Google Scholar]
  40. Liu, J.; Li, L.; Chen, G.; Liu, Y. High Precision IGBT Health Evaluation Method: Extreme Learning Machine Optimized by Improved Krill Herd Algorithm. IEEE Trans. Device Mater. Reliab. 2023, 23, 37–50. [Google Scholar] [CrossRef]
  41. Zhu, H.; Liu, T. Rotor Displacement Self-Sensing Modeling of Six-Pole Radial Hybrid Magnetic Bearing Using Improved Particle Swarm Optimization Support Vector Machine. IEEE Trans. Power Electron. 2020, 35, 12296–12306. [Google Scholar] [CrossRef]
  42. Pu, S.; Yang, F.; Vankayalapati, B.T.; Akin, B. Aging Mechanisms and Accelerated Lifetime Tests for SiC MOSFETs: An Overview. IEEE J. Emerg. Sel. Top. Power Electron. 2022, 10, 1232–1254. [Google Scholar] [CrossRef]
  43. Wang, B.; Cai, J.; Du, X.; Zhou, L. Review of power semiconductor device reliability for power converters. CPSS Trans. Power Electron. Appl. 2017, 2, 101–117. [Google Scholar] [CrossRef]
  44. Ren, H.; Yu, Y.; Du, X.; Liu, J.; Zhou, J. A Lifetime Prediction Model for IGBT Based on Optimized Long Short-Term Memory Neural Network. Trans. China Electrotech. Soc. 2024, 39, 1074–1086. [Google Scholar]
  45. Ma, X.; Wang, J.; Wei, Z.; Ding, L. Online Prediction Method for the Remaining Useful Life of Power Devices Based on Composite Indicator. IEEE Trans. Power Electron. 2024, 39, 10326–10338. [Google Scholar] [CrossRef]
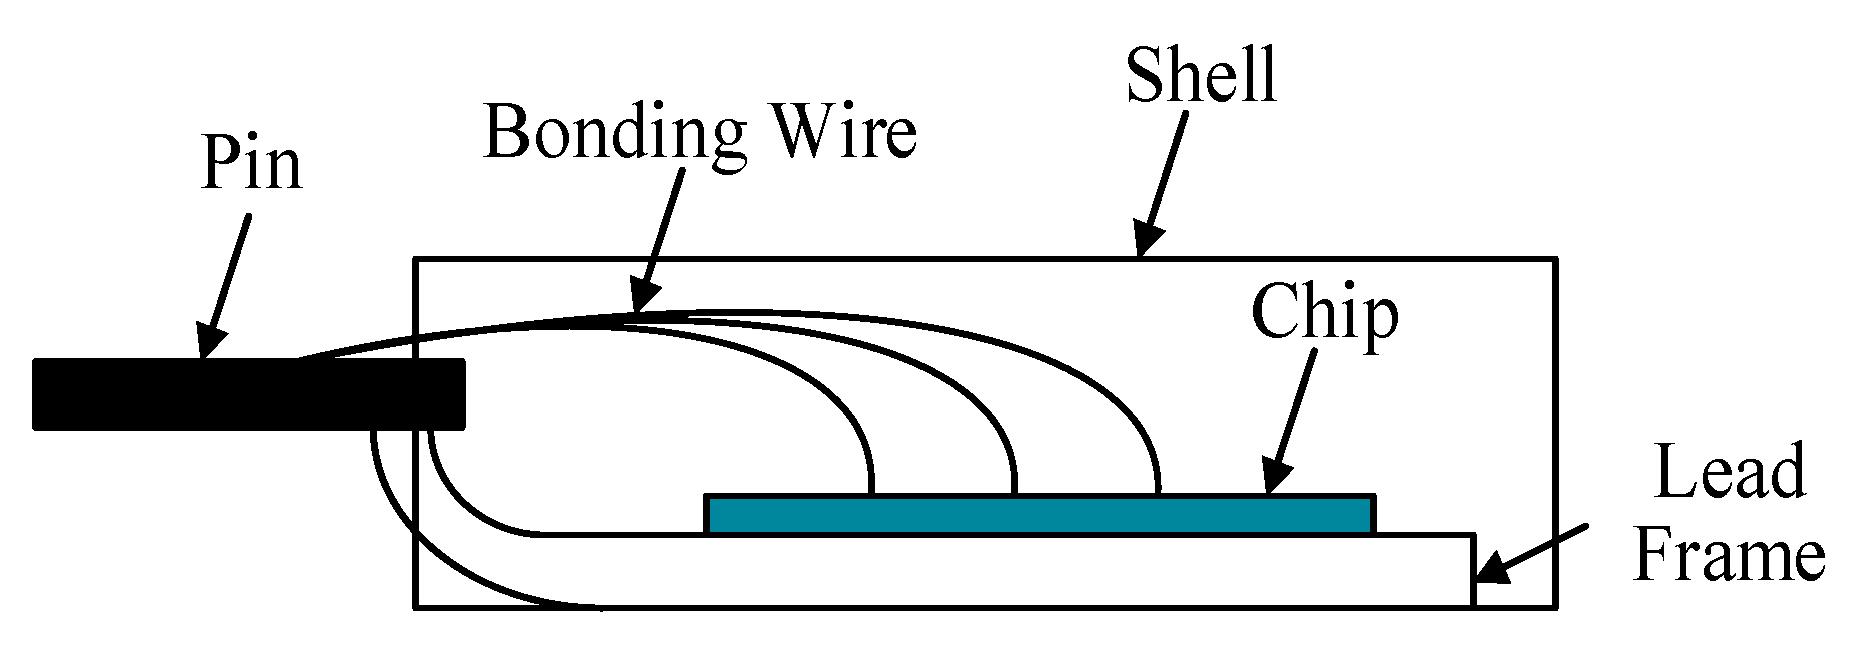
Figure 1. The internal structure of the discrete packaging.
Electronics 14 04486 g001
Figure 2. The internal structure of the module packaging.
Electronics 14 04486 g002
Figure 3. The analysis of stress distribution in SiC MOSFET.
Electronics 14 04486 g003
Figure 4. The failure determination method for SiC MOSFET.
Electronics 14 04486 g004
Figure 5. The internal structure of an LSTM unit.
Electronics 14 04486 g005
Figure 6. The leadership hierarchy of wolf group.
Electronics 14 04486 g006
Figure 7. The updating method of individual grey wolves.
Electronics 14 04486 g007
Figure 8. The performance comparison between linear and nonlinear convergence factors.
Electronics 14 04486 g008
Figure 9. The visualization of accuracy and stability for optimization algorithms.
Electronics 14 04486 g009
Figure 10. The convergence curves of the algorithms.
Electronics 14 04486 g010
Figure 11. The independent running time of each algorithm.
Electronics 14 04486 g011
Figure 12. The flowchart of SiC MOSFET lifetime prediction.
Electronics 14 04486 g012
Figure 13. The schematic diagram of DC power cycling with constant case temperature control.
Electronics 14 04486 g013
Figure 14. The ageing test platform.
Electronics 14 04486 g014
Figure 15. The specific procedure of the verification process.
Electronics 14 04486 g015
Figure 16. The data processing for four SiC MOSFETs. (a) Before data processing. (b) After data processing.
Electronics 14 04486 g016
Figure 17. The prediction results for SiC MOSFETs.
Electronics 14 04486 g017aElectronics 14 04486 g017b
Table 1. Test functions for algorithm evaluation.
FunctionLowerUpperDimOptimum
F1−100100300
F2−1010300
F3−3232300
F4−5.125.12300
F5−5540.1484
F60104−1
Table 2. The test results of the algorithm.
FunctionWOAGWOPSOIGWO
MeanStdMeanStdMeanStdMeanStd
F13.49 × 10−143.59 × 10−113.23 × 10−781.87 × 10−563.66 × 10−291.65 × 10−313.06 × 10−1571.94 × 10−92
F25.05 × 10−171.08 × 10−124.68 × 10−555.34 × 10−432.81 × 10−344.92 × 10−281.18 × 10−834.11 × 10−67
F35.11 × 10−94.23 × 10−101.03 × 10−193.11 × 10−164.29 × 10−121.48 × 10−1100
F45.68 × 10−87.16 × 10−64.12 × 10−224.30 × 10−121.31 × 10−151.12 × 10−121.62 × 10−286.11 × 10⁻¹⁹
F54.89 × 10−48.03 × 10−24.46 × 10−96.27 × 10−81.63 × 10−64.18 × 10−82.34 × 10−195.14 × 10⁻¹²
F6−5.99 × 10−23.01 × 10−3−1.09 × 10−53.91 × 10−6−3.65 × 10−38.87 × 10−400
Table 3. The conditions for power cycling experiments.
SiC MOSFETVgsRdsTcmaxTcminTaIctonCoolingSampling Rate
IMW65R107M1HXKSA115 V142 mΩ155 °C50 °C25 °C20 A5 sAir Cooling10 Hz
IMW65R060M2H15 V73 mΩ155 °C50 °C25 °C23 A8 sAir Cooling10 Hz
Table 4. The predictive results of all models.
SampleModelR2RMSEMAEMAPE
1WOA-LSTM77.5%0.04470.03584.35%
PSO-LSTM85.9%0.02870.02252.78%
GWO-LSTM92.7%0.01840.01431.80%
IGWO-LSTM96.2%0.01170.00891.15%
2WOA-LSTM80.6%0.03920.03083.85%
PSO-LSTM84.2%0.03160.02473.05%
GWO-LSTM91.3%0.01980.01541.92%
IGWO-LSTM94.8%0.01430.01101.40%
3WOA-LSTM78.4%0.04210.03324.15%
PSO-LSTM87.7%0.02650.02052.55%
GWO-LSTM89.2%0.02360.01832.25%
IGWO-LSTM94.1%0.01520.01161.48%
4WOA-LSTM75.8%0.04690.03724.70%
PSO-LSTM86.1%0.02810.02182.72%
GWO-LSTM90.3%0.02150.01662.08%
IGWO-LSTM93.9%0.01580.01211.55%
Disclaimer/Publisher’s Note: The statements, opinions and data contained in all publications are solely those of the individual author(s) and contributor(s) and not of MDPI and/or the editor(s). MDPI and/or the editor(s) disclaim responsibility for any injury to people or property resulting from any ideas, methods, instructions or products referred to in the content.