Article

Explaining Grid Strength Through Data: Key Factors from a Southwest China Power Grid Case Study

Southwest Branch, State Grid Corporation of China, Chengdu 610095, China
*
Author to whom correspondence should be addressed.
Electronics 2025, 14(21), 4303; https://doi.org/10.3390/electronics14214303

Submission received: 22 September 2025 / Revised: 25 October 2025 / Accepted: 28 October 2025 / Published: 31 October 2025

Abstract

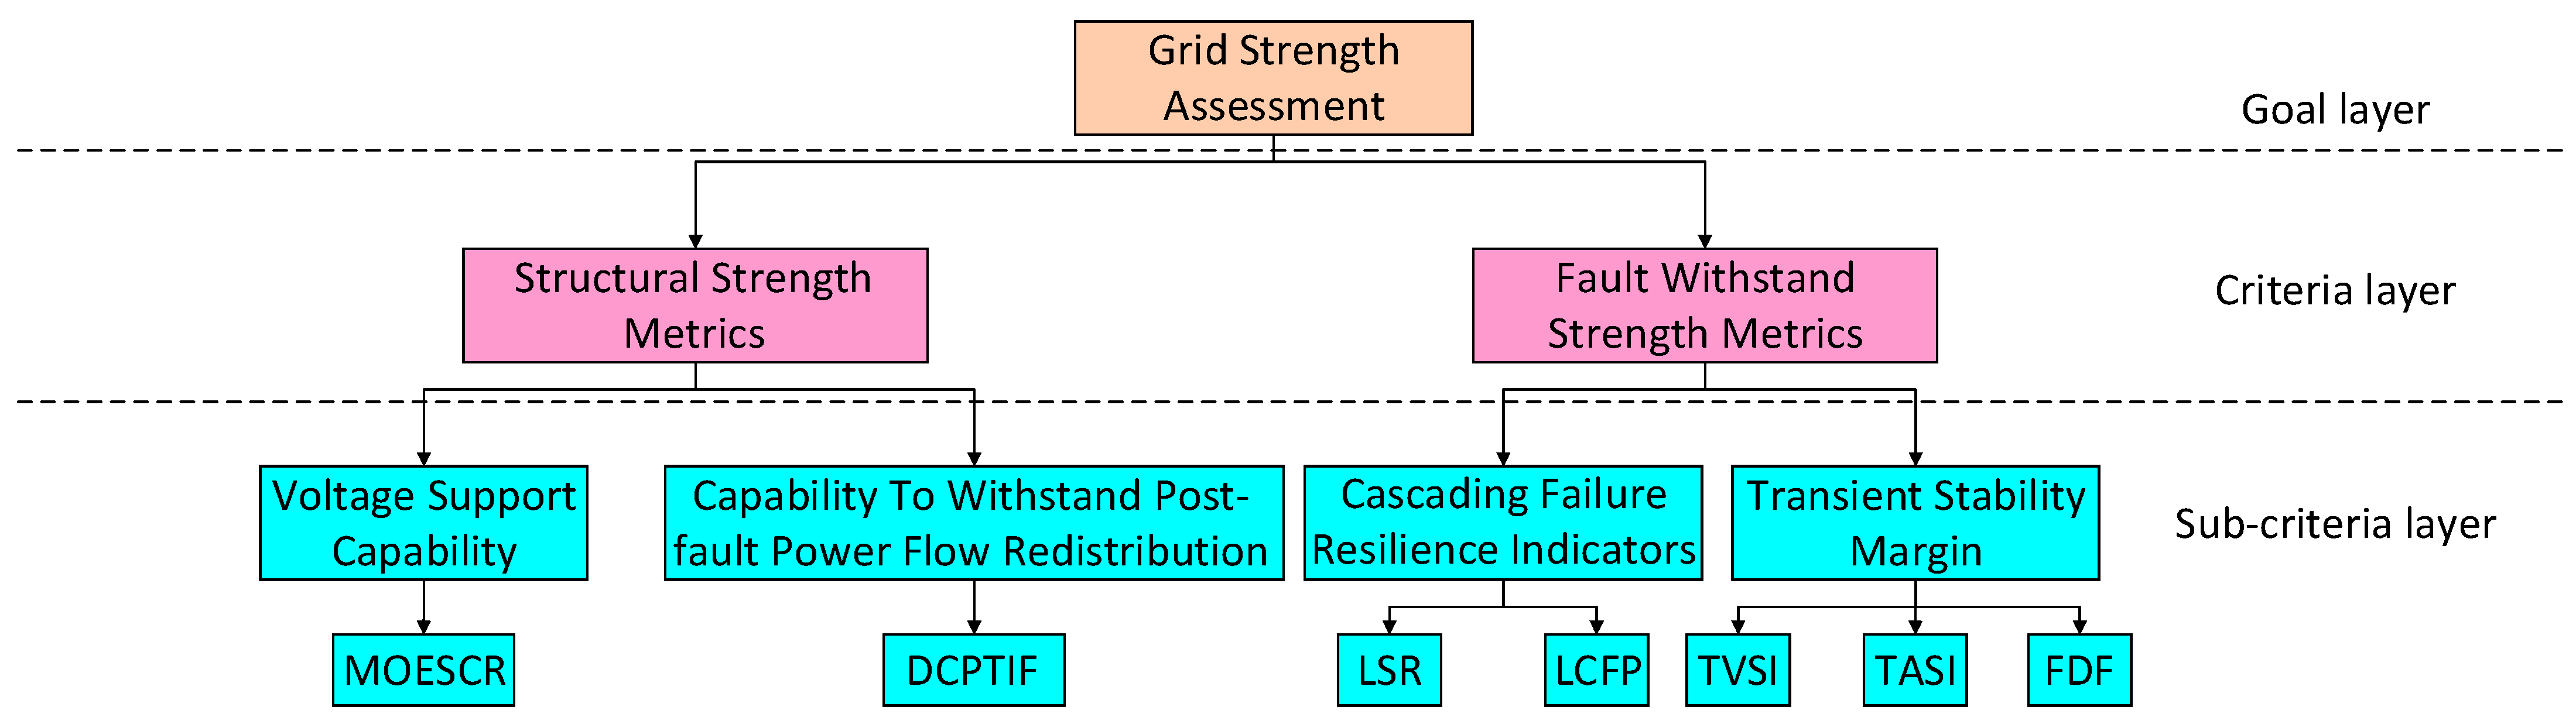
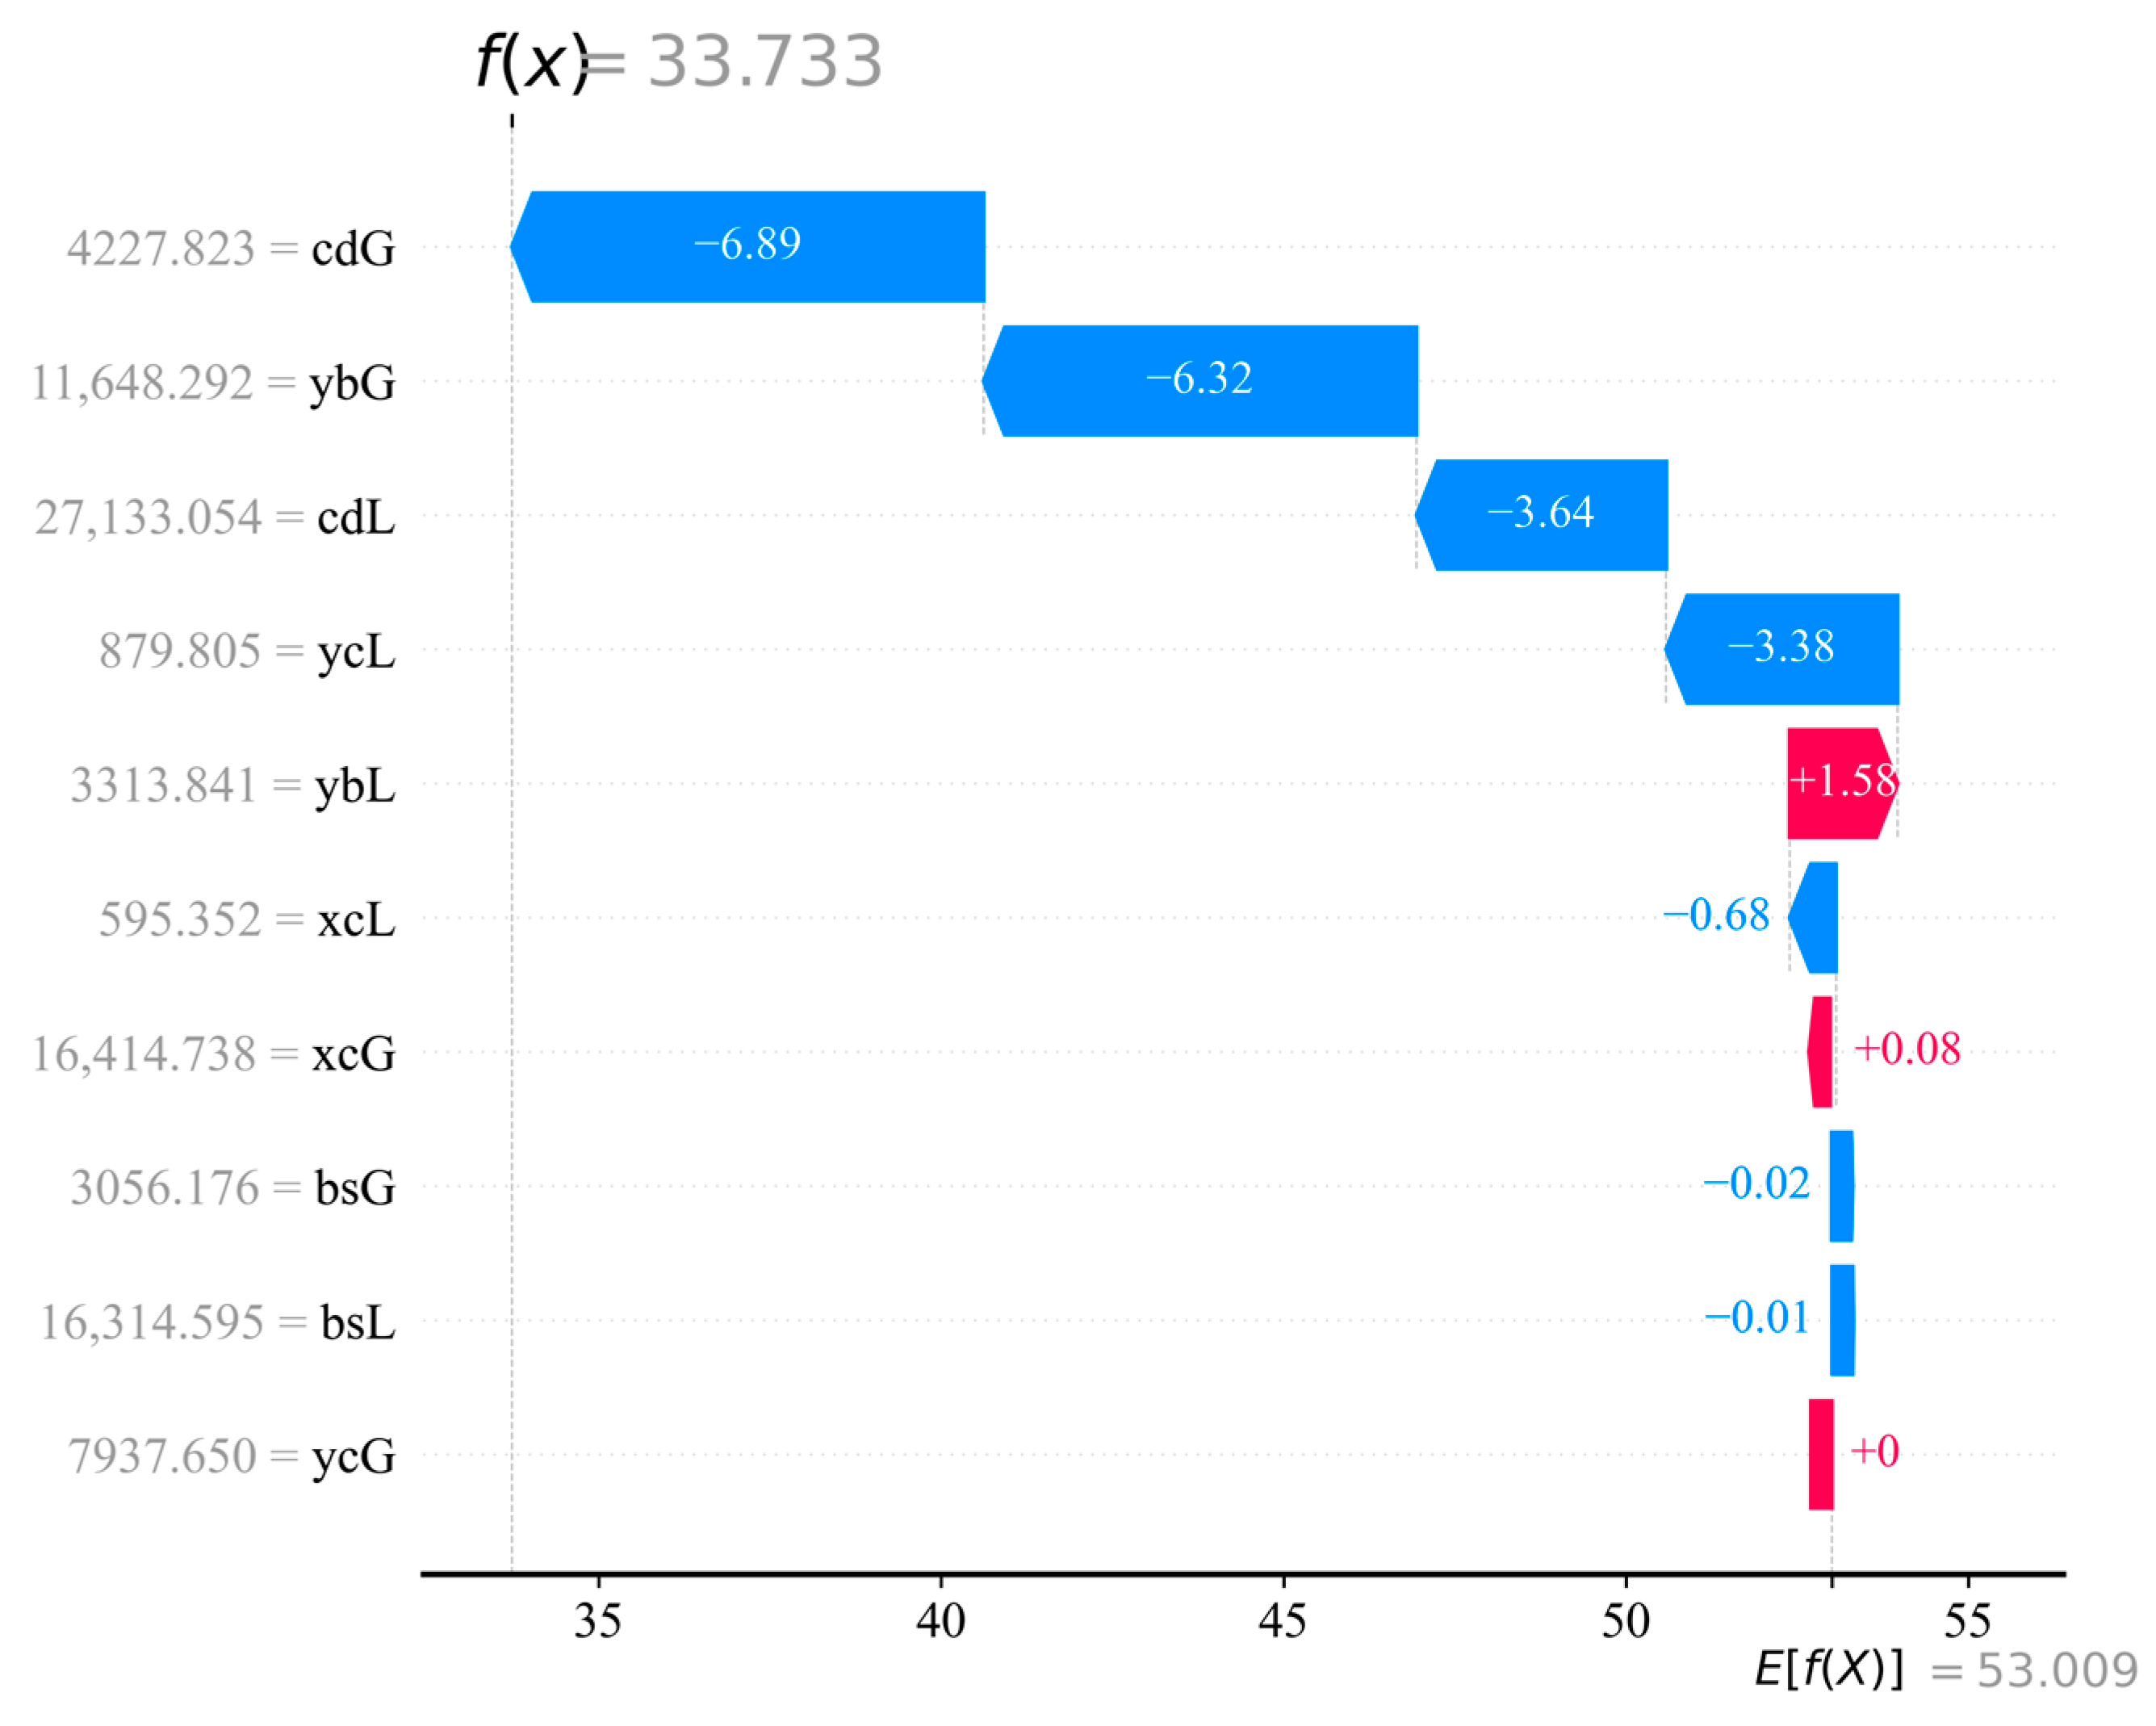
The increasing integration of High-Voltage Direct Current (HVDC) systems and renewable energy challenges traditional grid strength assessment. This paper proposes a comprehensive framework that combines a composite strength index with an interpretable importance analysis to address this issue. First, a composite index is developed using the AHP-CRITIC method to fuse structural and fault withstand metrics. Then, to identify the factors influencing this index, SHapley Additive exPlanations (SHAP) is employed, accelerated by a high-fidelity Gaussian Process Regression (GPR) surrogate model that overcomes the computational burden of large-scale simulations. This GPR-SHAP approach provides both global parameter rankings and local, scenario-specific explanations, overcoming the limitations of conventional sensitivity analysis. Validated on a detailed model of the Southwest Power Grid in China, the framework successfully quantifies grid strength and pinpoints key vulnerabilities. Verification through a typical scenario demonstrates that implementing coordinated increases in both generation and load (each by 1000 MW) in the Chengdu area, as guided by local SHAP explanations, significantly improves the grid strength index from 33.73 to 47.61. It provides operators with a dependable tool to transition from experience-based practices to targeted, proactive stability management.
Keywords: power system stability; AC/DC hybrid grids; composite grid strength index; feature importance analysis; SHAP; sensitivity analysis power system stability; AC/DC hybrid grids; composite grid strength index; feature importance analysis; SHAP; sensitivity analysis