Figure 1.
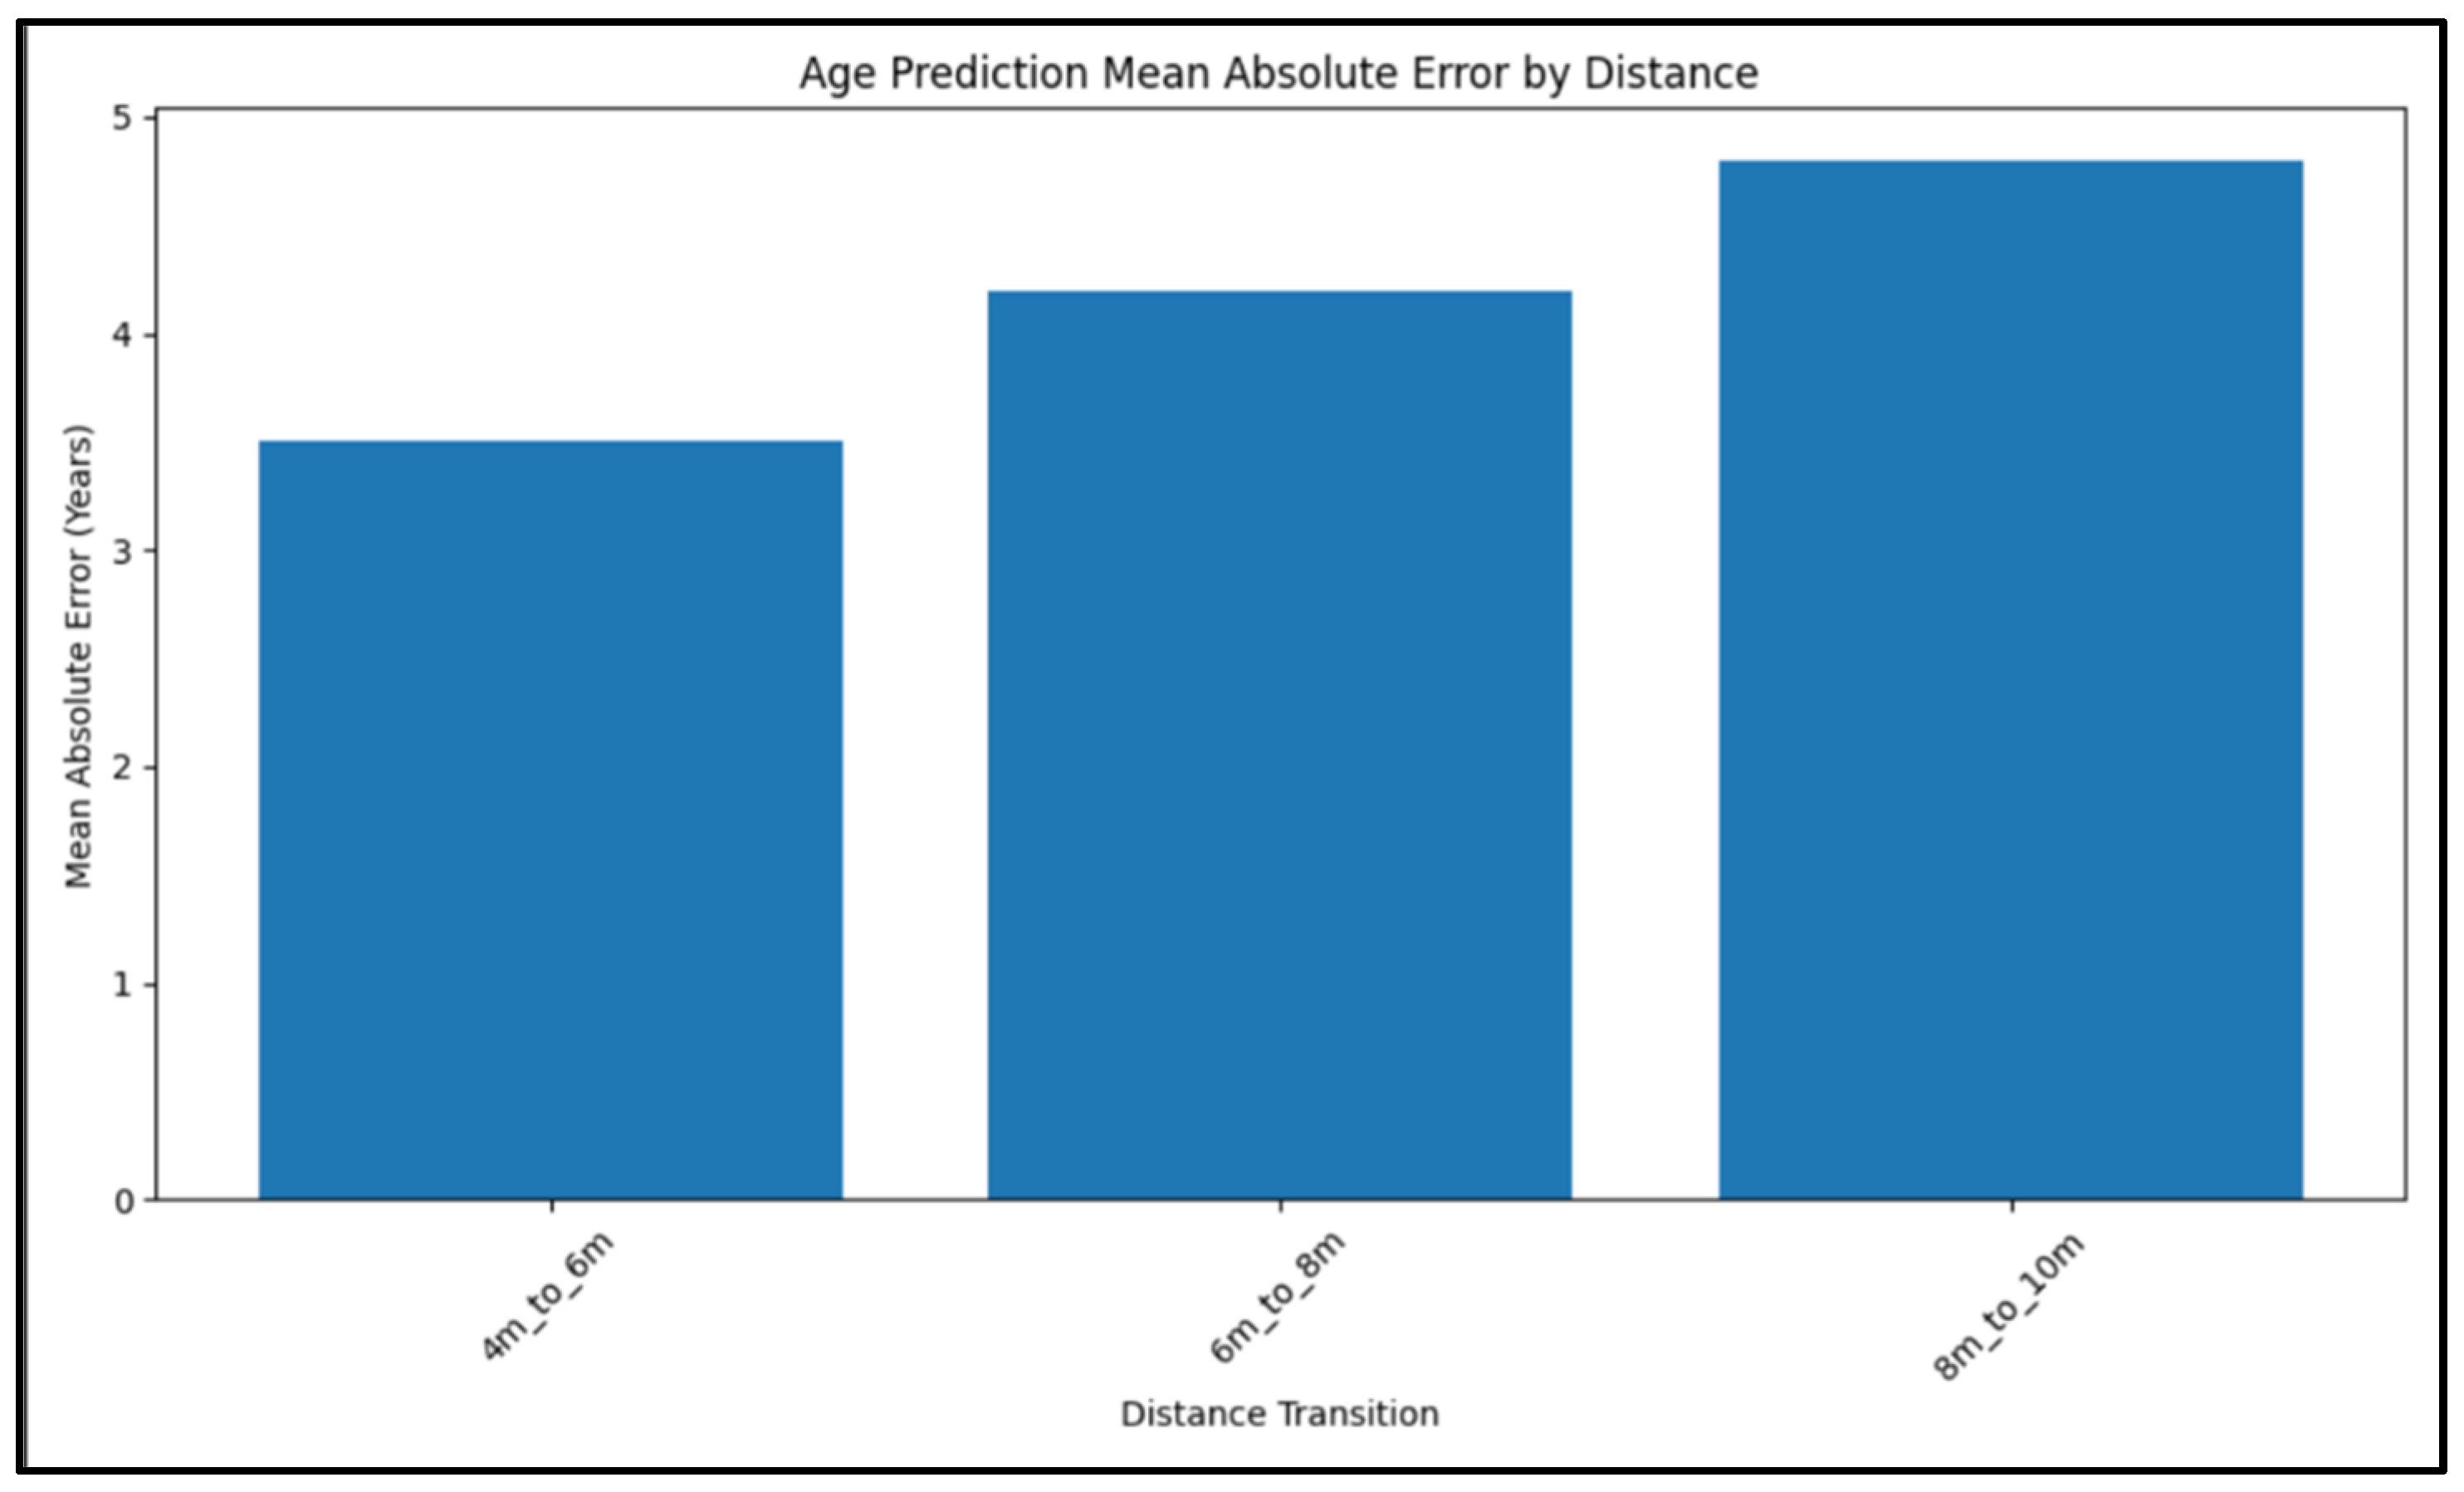
Prediction performance across varying distances (4 m–10 m) for soft biometric traits. Gender and ethnicity performance is reported in terms of classification accuracy (%), while age estimation is reported using mean absolute error (MAE, in years). Results are averaged over 5-fold cross-validation, with error bars showing ±1 standard deviation. Number of test samples per distance: 4 m (5563), 6 m (4973), 8 m (4500), 10 m (4200).
Figure 2.
Age and gender distribution.
Figure 2.
Age and gender distribution.
Figure 3.
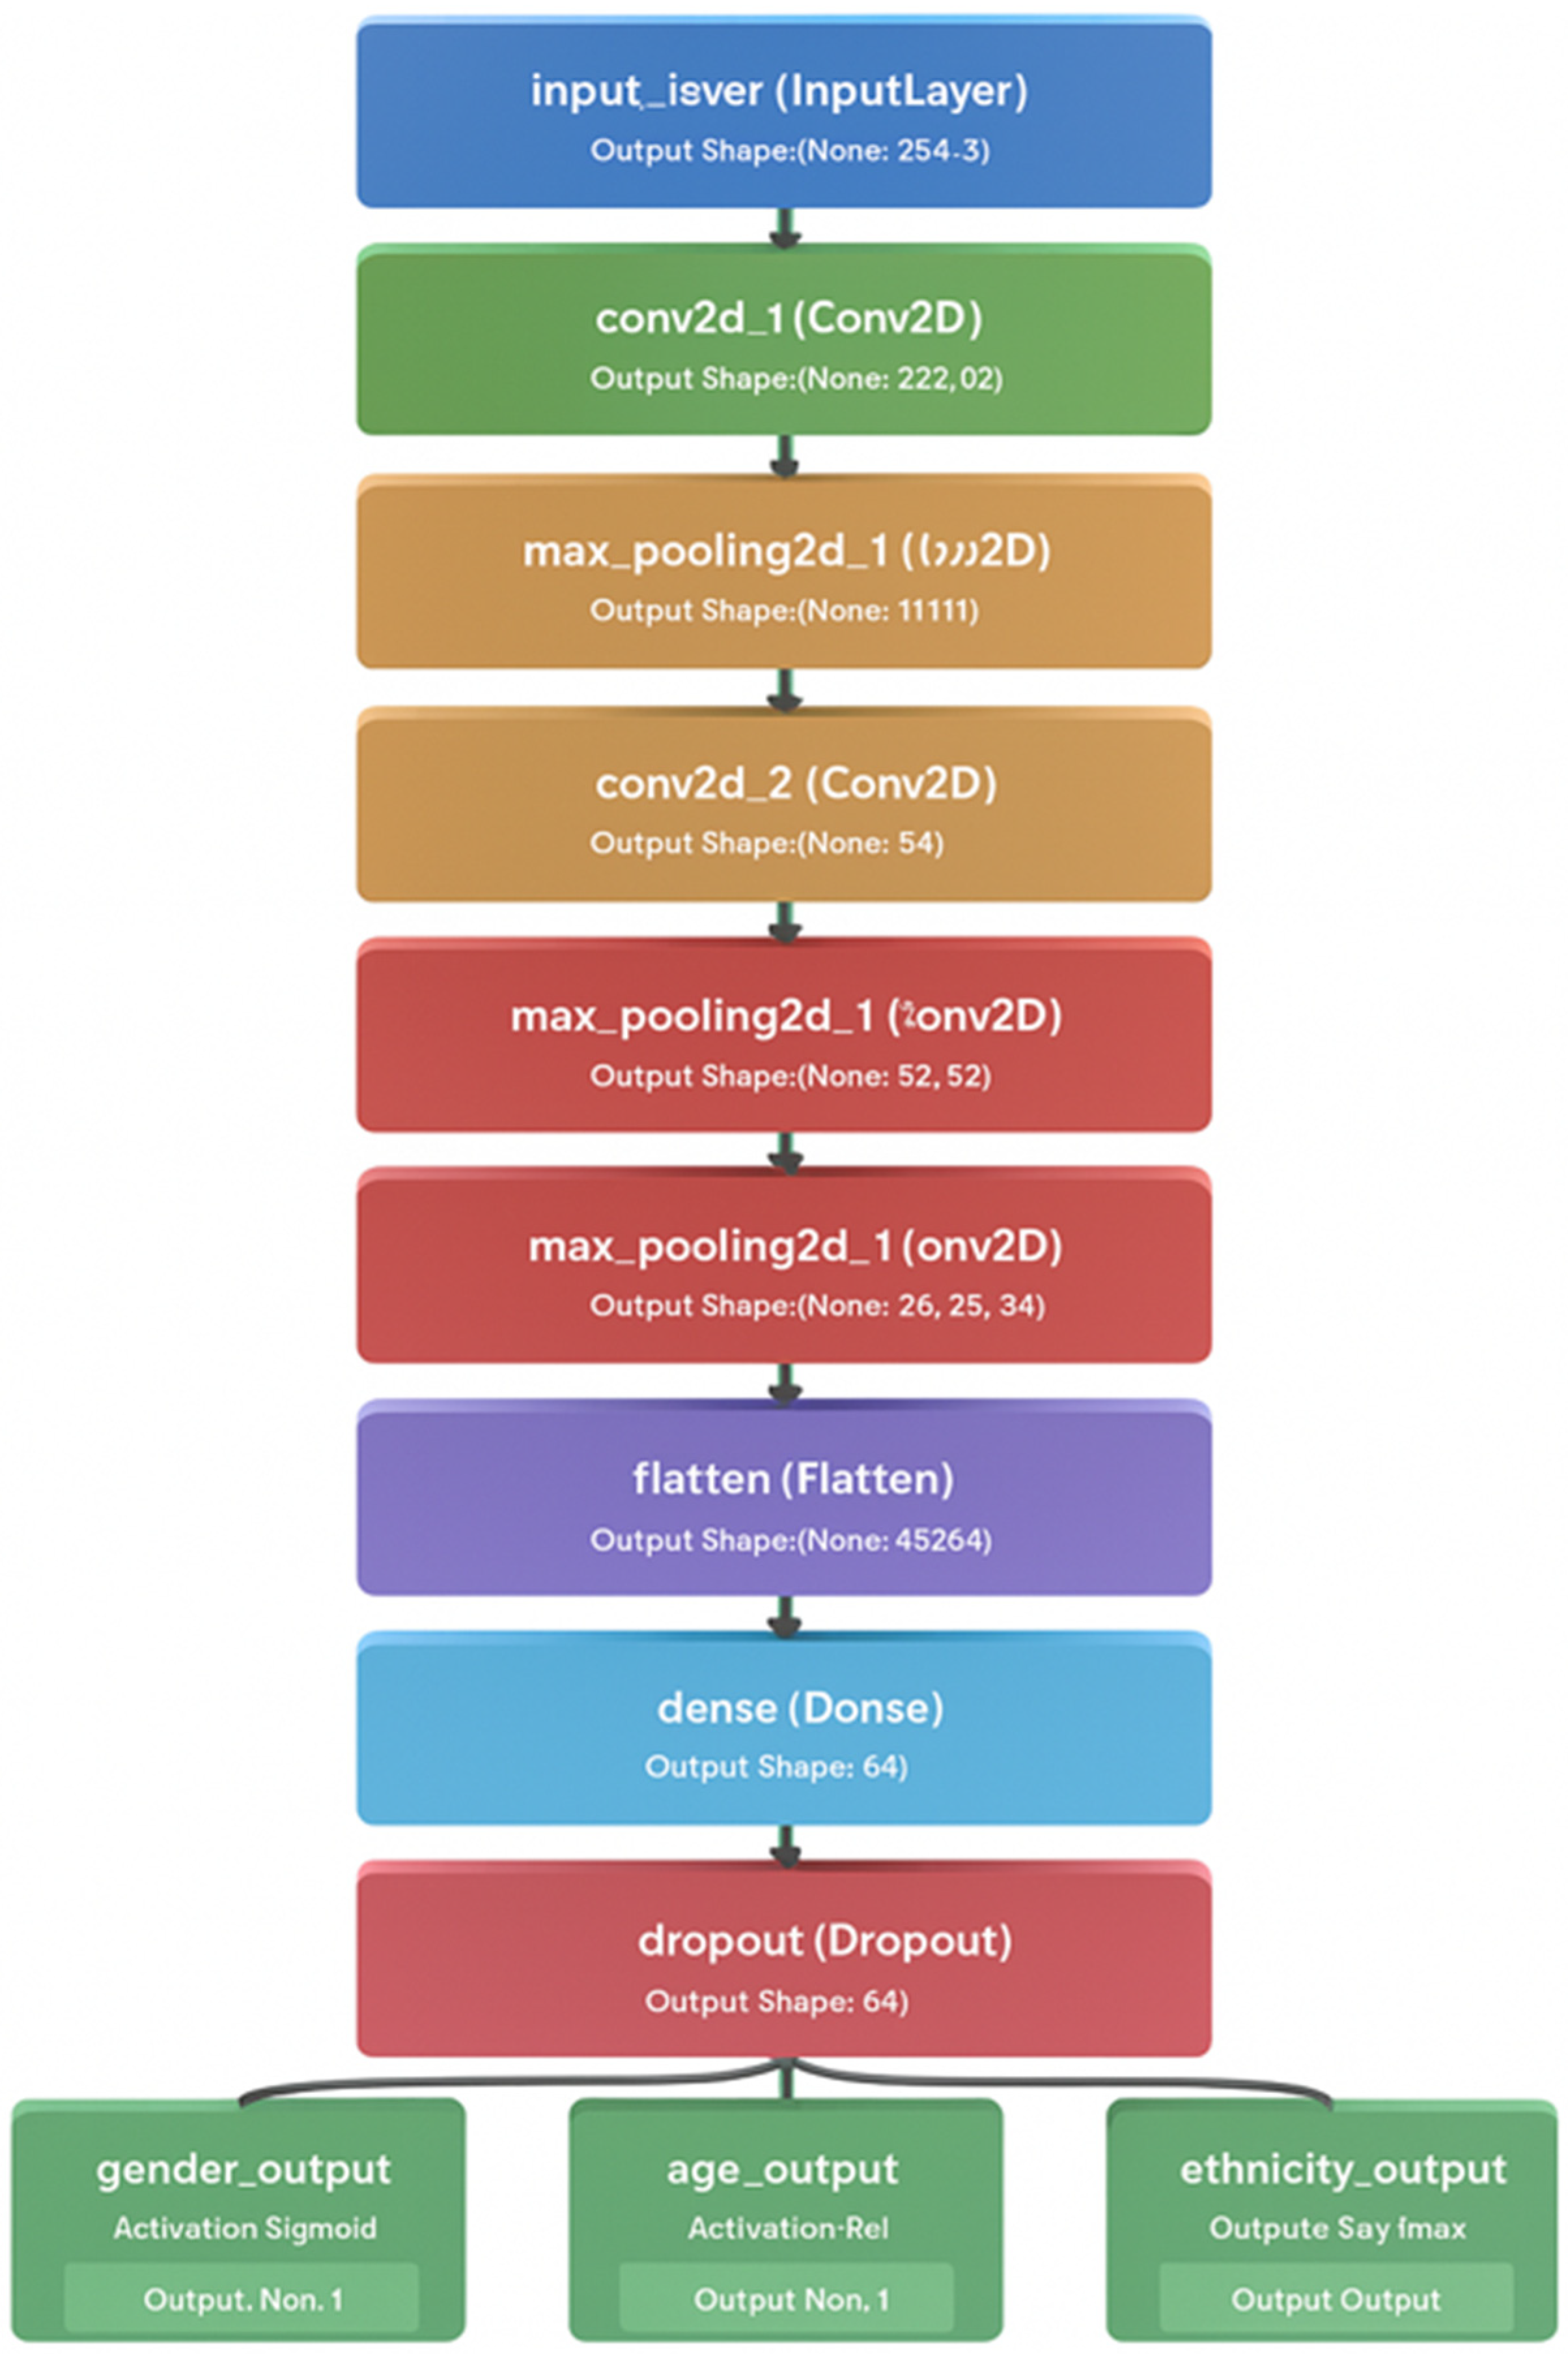
Unified architecture of the proposed multi-task distance-adaptive network. The input images, collected at varying distances, are processed through a shared EfficientNetB3 backbone. Features are fused at the mid-level stage and passed through three separate task-specific heads for gender classification, ethnicity classification, and age estimation. The architecture incorporates a distance-adaptive learning module to enhance robustness across variable capture ranges.
Figure 4.
Proposed training protocol for distance-adaptive soft biometric system. The diagram highlights data augmentation, feature freezing, head-specific training, and distance-targeted fusion during progressive training phases.
Figure 4.
Proposed training protocol for distance-adaptive soft biometric system. The diagram highlights data augmentation, feature freezing, head-specific training, and distance-targeted fusion during progressive training phases.
Figure 5.
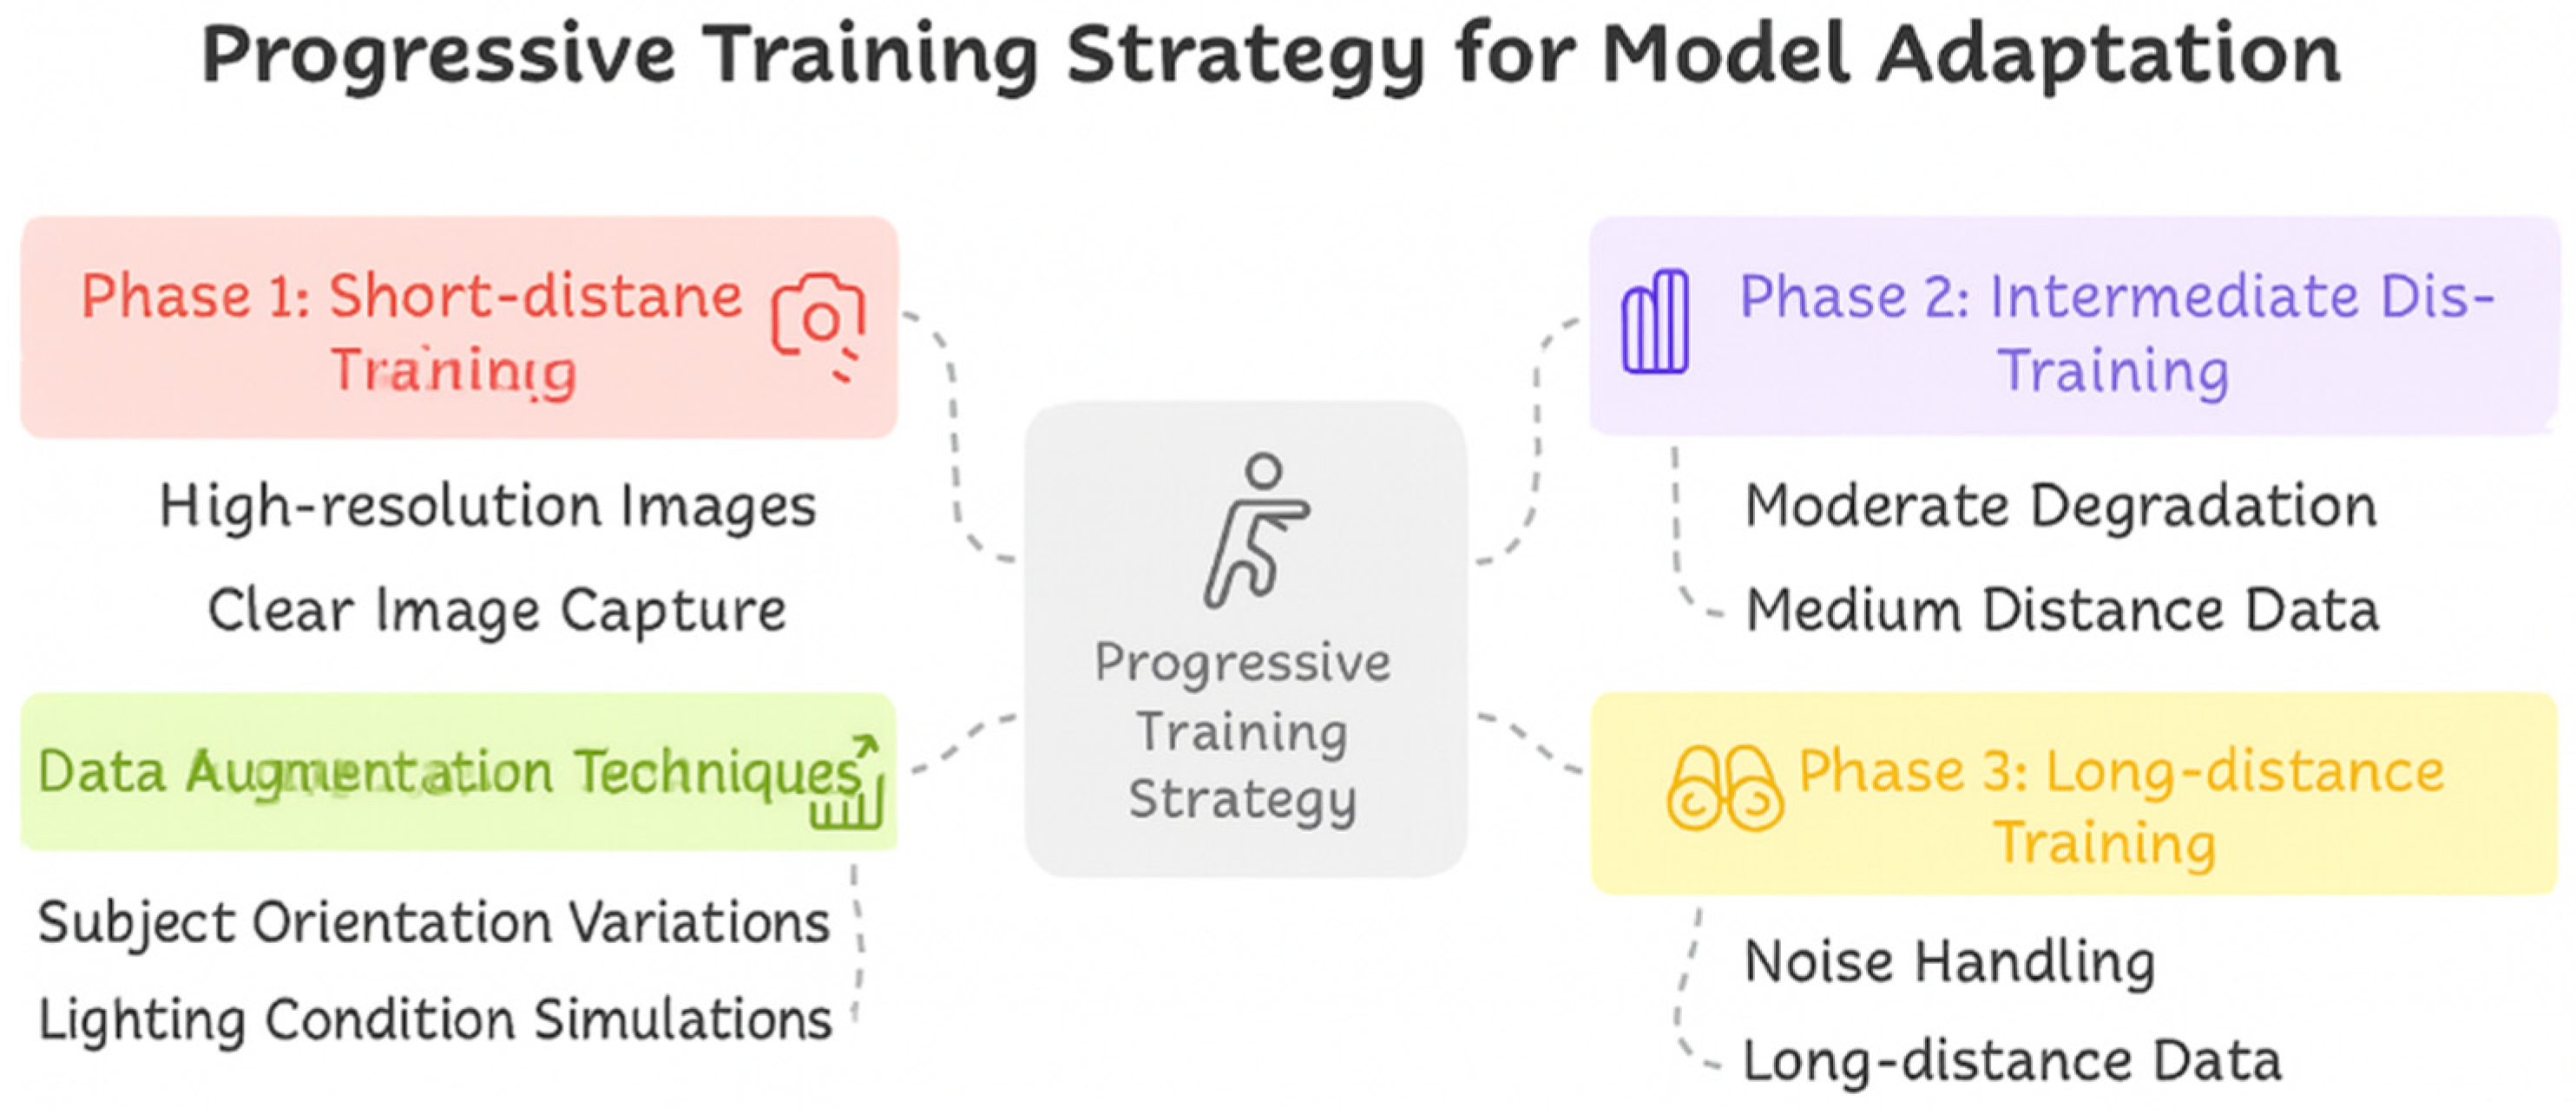
Overview of the progressive training strategy phases. Each training phase introduces incremental complexity to the network, enabling robust learning under varied distance and environmental constraints. Phases are sequential and build upon previously optimized parameters.
Figure 5.
Overview of the progressive training strategy phases. Each training phase introduces incremental complexity to the network, enabling robust learning under varied distance and environmental constraints. Phases are sequential and build upon previously optimized parameters.
Figure 6.
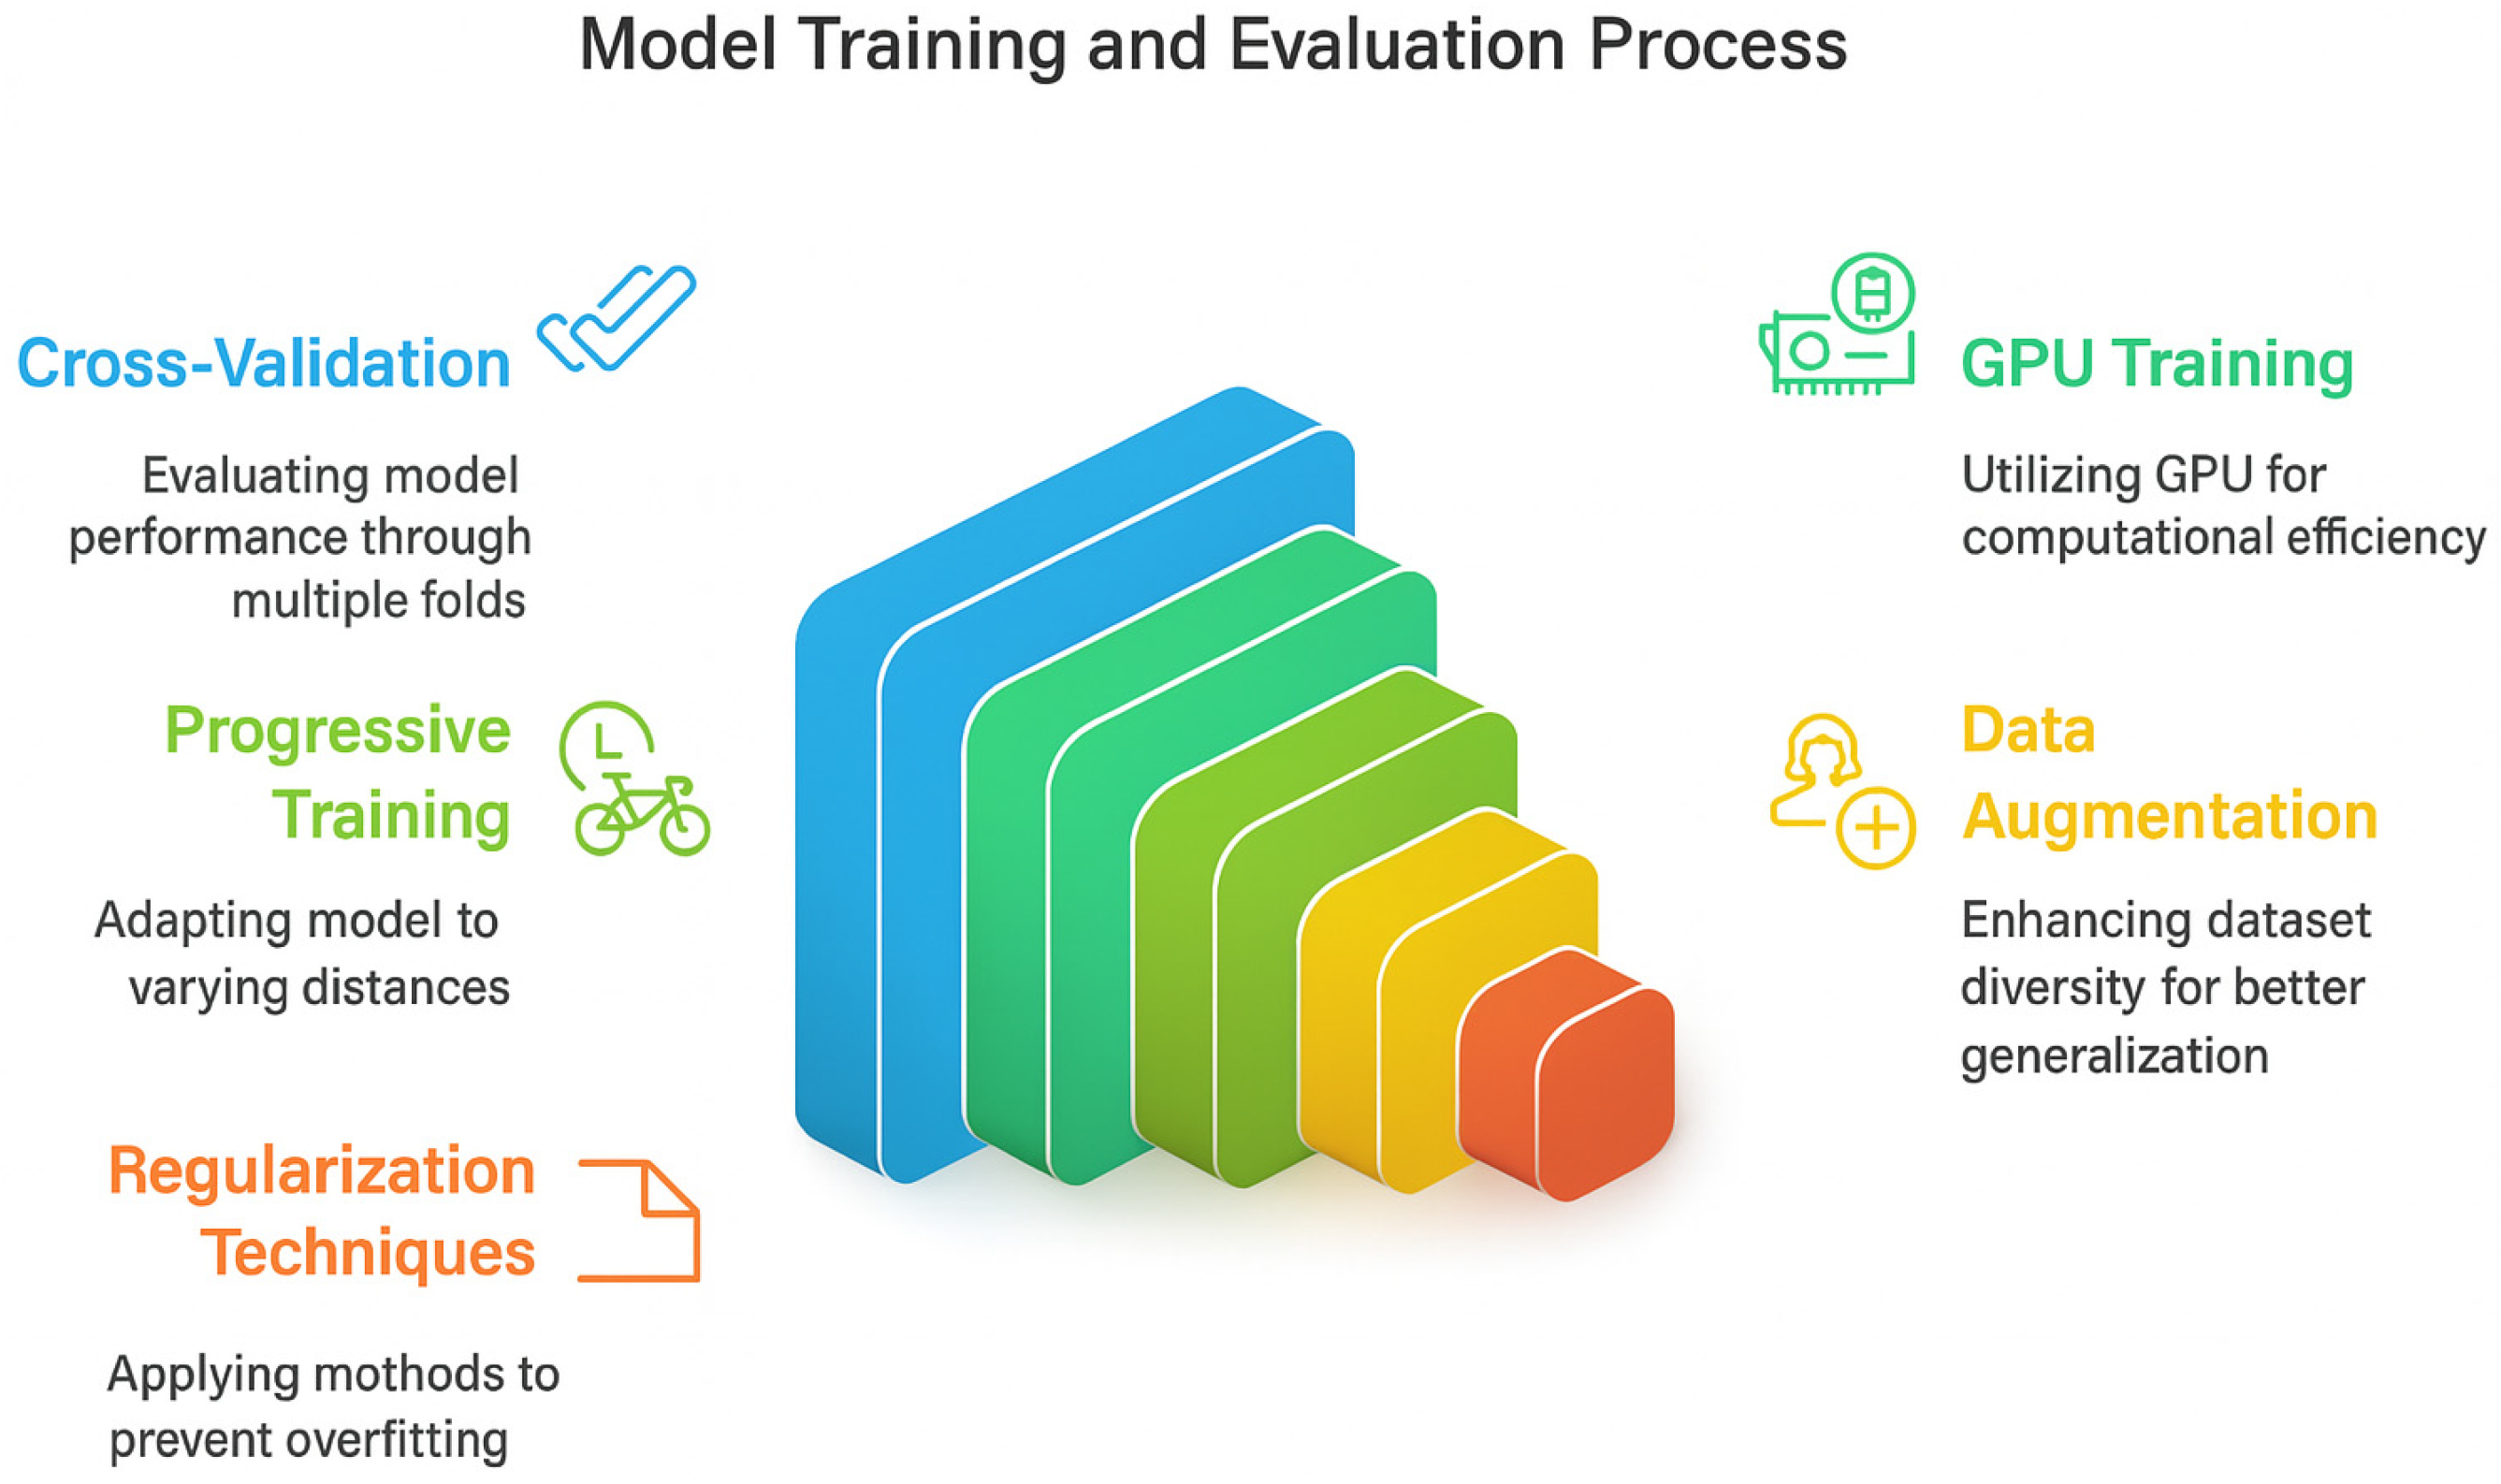
Model training and evaluation process.
Figure 6.
Model training and evaluation process.
Figure 7.
Training and validation accuracy curves across 10 epochs for one representative fold. Solid lines represent mean values, while shaded bands indicate standard deviation over 5-fold cross-validation. The x-axis represents training epochs, and the y-axis shows accuracy. The legend differentiates between training and validation performance.
Figure 8.
Cross-validation performance metrics showing training and validation loss/accuracy across different distances for gender, age, and ethnicity prediction. The observed volatility, particularly at longer distances (8 m and 10 m), reflects inherent noise due to reduced visual feature quality and highlights the increased challenge of maintaining learning stability as distance increases.
Figure 9.
Component-wise training metrics showing overall model loss, gender classification accuracy, ethnicity classification accuracy, age regression loss, and mean absolute error (MAE). The plots demonstrate the training progression across epochs for both.
Figure 9.
Component-wise training metrics showing overall model loss, gender classification accuracy, ethnicity classification accuracy, age regression loss, and mean absolute error (MAE). The plots demonstrate the training progression across epochs for both.
Figure 10.
Comparative analysis of model performance across different distance ranges (4 m to 10 m). Plots include mean values and 95% confidence intervals for gender accuracy, ethnicity accuracy, and age MAE. Performance was measured over 5-fold cross-validation, confirming consistent accuracy with increasing distance.
Figure 11.
Comprehensive model evaluation showing classification accuracy for gender and ethnicity prediction and component-specific loss metrics including age MAE, gender loss, and ethnicity loss across training epochs.
Figure 11.
Comprehensive model evaluation showing classification accuracy for gender and ethnicity prediction and component-specific loss metrics including age MAE, gender loss, and ethnicity loss across training epochs.
Figure 12.
Impact of subject-to-camera distance on prediction accuracy, showing performance trends from 4 m to 10 m for person recognition (blue), gender classification (orange), and ethnicity prediction (green).
Figure 12.
Impact of subject-to-camera distance on prediction accuracy, showing performance trends from 4 m to 10 m for person recognition (blue), gender classification (orange), and ethnicity prediction (green).
Figure 13.
Performance comparison of baseline and ensemble models on gender prediction across distances. Both models were trained under identical parameter settings; the baseline uses ResNet-50 while the ensemble incorporates EfficientNetB3 with distance-aware heads.
Figure 13.
Performance comparison of baseline and ensemble models on gender prediction across distances. Both models were trained under identical parameter settings; the baseline uses ResNet-50 while the ensemble incorporates EfficientNetB3 with distance-aware heads.
Figure 14.
Ethnicity classification accuracy across varying distances for baseline and ensemble approaches. Both models were trained under identical parameter settings; the baseline uses ResNet-50 while the ensemble incorporates EfficientNetB3 with distance-aware heads.
Figure 14.
Ethnicity classification accuracy across varying distances for baseline and ensemble approaches. Both models were trained under identical parameter settings; the baseline uses ResNet-50 while the ensemble incorporates EfficientNetB3 with distance-aware heads.
Figure 15.
Performance comparison between deep learning, baseline, and ensemble approaches showing classification accuracies and loss metrics for each prediction task. Both models were trained under identical parameter settings; the baseline uses ResNet-50 while the ensemble incorporates EfficientNetB3 with distance-aware heads.
Figure 16.
Ensemble recognition outcomes showing combined model performance metrics, including classification accuracies and component-specific losses. Both models were trained under identical parameter settings; the baseline uses ResNet-50 while the ensemble incorporates EfficientNetB3 with distance-aware heads.
Figure 17.
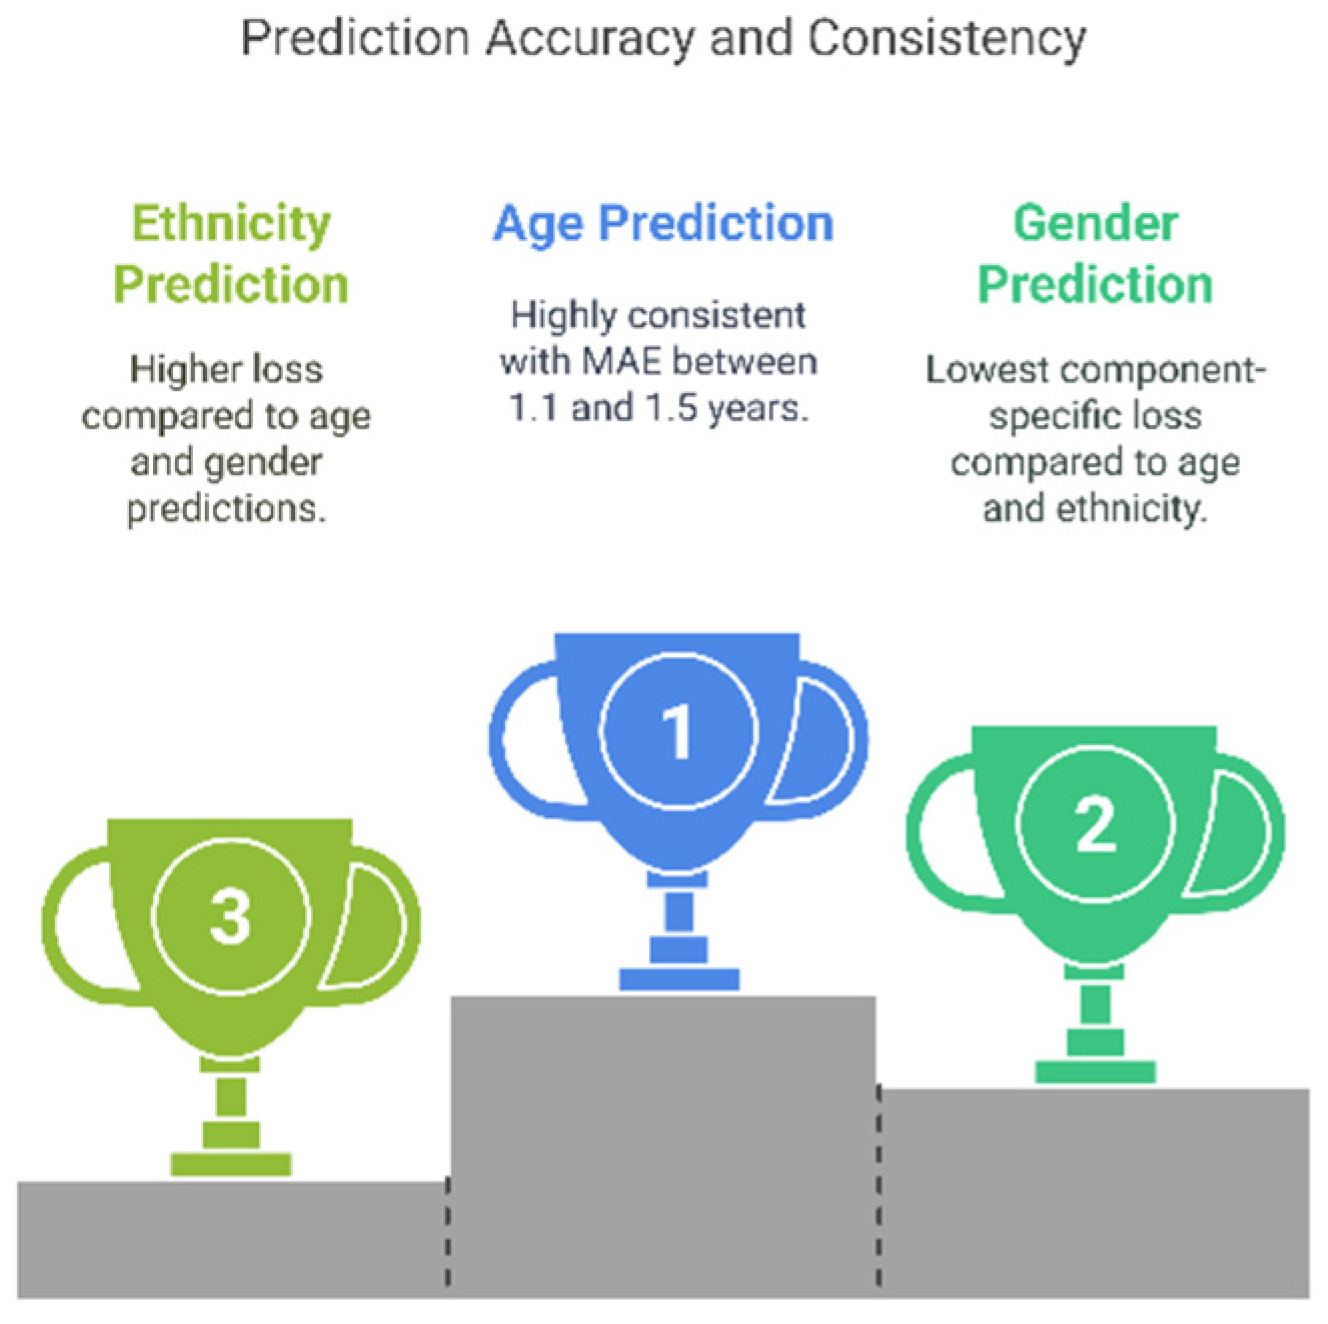
Prediction accuracy and consistency of our model.
Figure 17.
Prediction accuracy and consistency of our model.
Table 1.
Comparison of deep learning architectures for soft biometrics.
Table 1.
Comparison of deep learning architectures for soft biometrics.
| Model | Key Features | Advantages | Limitations |
|---|
| ResNet-50 | Deep CNN with residual learning | High accuracy, handles vanishing gradients well | Computationally expensive |
| VGG-16 | Deep CNN with simple architecture | Easy to implement, widely used in early models | High parameter count, slow training |
| MobileNetV2 | Depth wise separable convolutions | Lightweight, efficient for mobile/edge devices | Lower accuracy compared to deeper networks |
| EfficientNet | Compound scaling optimization | High accuracy with fewer parameters | Requires more hyperparameter tuning |
| Vision Transformers (ViTs) | Self-attention mechanism for image processing | High performance in large-scale datasets | Requires large training data |
Table 2.
Summary of utilizing transfer learning for distance-adaptable global soft biometrics from (2019–2025).
Table 2.
Summary of utilizing transfer learning for distance-adaptable global soft biometrics from (2019–2025).
| Ser | Year | Authors | Dataset | Features | Method | Performance (Accuracy, F1, MAE, Distance Context) |
|---|
| 1 | 2019 | Zhang et al. [1] | FVG dataset | Gait patterns across distances | DL-based gait recognition with TL | Accuracy >90% at 4–6 m; drops to ~82% at 10 m |
| 2 | 2019 | Minaee et al. [9] | Multiple biometric datasets | CNN-extracted features | Review of deep learning in biometrics | Overview only; no metrics reported |
| 3 | 2019 | Kumar & Nagabhushan [10] | Custom datasets | Height, build, clothing color | Semantic matching + soft traits | Rank-1: 88% @ 5 m; robust to clothing variation |
| 4 | 2020 | Lai et al. [11] | Dog photos | Breed, gender, height + face image | CNNs + soft/hard fusion | Accuracy: 78.1% (image only), 84.9% (fusion); range: 3–7 m |
| 5 | 2020 | Mehraj & Mir [11] | Various biometric sets | CNN deep features | Review of deep learning frameworks | No experimental benchmarks reported |
| 6 | 2021 | Wang & Li [2] | MMV pedestrian dataset | Real-world pedestrian images | CNN for soft trait classification | F1-score: 0.86 for gender at 5–10 m |
| 7 | 2021 | Alonso-Fernandez et al. [12] | Smartphone selfie ocular data | Ocular features | Lightweight CNNs, face-pretrained | Accuracy: age 83%, gender 90%; consistent across 0.5–2 m |
| 8 | 2021 | Talreja et al. [13] | Periocular datasets | Periocular + soft biometrics | Fusion-based DL model | F1 (gender): 0.89; stable up to 4 m |
| 9 | 2023 | Guarino et al. [14] | Mobile touch gesture data | Gesture-derived feature maps | CNN with fusion strategy | Accuracy: gender 94%, age-group 99%; no distance data |
| 10 | 2023 | Xu et al. [15] | Public palmprint datasets | Palmprint + soft traits | Multi-task CNN with TL | Accuracy: 92.3%, F1 (gender): 0.88; range < 2 m |
Table 3.
Distance-based challenges in soft biometrics.
Table 3.
Distance-based challenges in soft biometrics.
| Challenge | Impact | Proposed Solutions |
|---|
| Low image resolution | Degraded feature extraction accuracy | Super-resolution techniques, adaptive filtering |
| Lighting variations | Inconsistent model performance | Data augmentation, HDR-based preprocessing |
| Feature occlusions | Loss of key biometric traits | Multimodal fusion, occlusion-aware models |
| Varying distances | Accuracy drops at long distances (>10 m) | Distance-invariant feature extraction methods |
Table 4.
Distance-based sample distribution.
Table 4.
Distance-based sample distribution.
| Distance Interval | Number of Samples | Percentage of Dataset |
|---|
| 4 m (m) | 5563 | 28.9% |
| 6 m (m) | 4973 | 25.9% |
| 8 m (m) | 4500 | 23.4% |
| 10 m (m) | 4200 | 21.8% |
Table 5.
Class-wise demographic distribution.
Table 5.
Class-wise demographic distribution.
| Attribute | Class | Sample Count |
|---|
| Age | 0–17 | 3421 |
| | 18–40 | 8719 |
| | 41–65 | 5066 |
| | 66+ | 2030 |
| Gender | Male | 1017 |
| | Female | 9059 |
| Ethnicity | Group A | 7220 |
| | Group B | 4835 |
| | Group C | 3048 |
| | Group D | 4133 |
Table 6.
Hyperparameter configuration.
Table 6.
Hyperparameter configuration.
| Hyperparameter
| Value
| Purpose
|
|---|
| Learning Rate | 1 × 10 − 41 × 10{−4} (adaptive) | Gradual adaptation for convergence stability |
| β1, β2 (Adam Betas) | 0.9, 0.999 | Momentum control for gradient updates |
| Weight Decay | 1 × 10 − 61 × 10{−6} | Prevents overfitting by penalizing large weights |
| Dropout Rate | 0.2 | Regularization to reduce overfitting risks |
| Batch Size | 32 samples | Efficient mini-batch training |
Table 7.
Loss functions and mathematical formulations used for each biometric prediction task.
Table 7.
Loss functions and mathematical formulations used for each biometric prediction task.
| Biometric Task | Loss Function | Mathematical Formulation |
|---|
| Gender Classification | Binary Cross-Entropy (BCE) | L_gender = −∑ y log(ŷ) |
| Age Estimation | Mean Squared Error (MSE) | L_age = (1/n) ∑ (y − ŷ)2 |
| Ethnicity Classification | Categorical Cross-Entropy (CCE) | L_ethnicity = −∑ y log(ŷ) |
Table 8.
Model comparison with standardized metrics and distance robustness.
Table 8.
Model comparison with standardized metrics and distance robustness.
| Model | Gender Acc (%) | Ethnicity Acc (%) | Age MAE (years) | ΔPerformance
(4 m → 10 m) |
|---|
| Proposed (Ours) | 92.3 | 67.1 | 1.2 | −7.3% |
| MobileNetV2 | 88.5 | 62.3 | 1.9 | −12.6% |
| EfficientNetB0 | 89.4 | 64.1 | 1.5 | −10.8% |
| D-ViT | 91.0 | 66.0 | 1.4 | −9.6% |
| TFormer++ | 91.6 | 65.5 | 1.3 | −9.1% |
Table 9.
Summary of the average scores across all folds.
Table 9.
Summary of the average scores across all folds.
| Task | Precision (%) | Recall (%) | F1-Score (%) |
|---|
| Gender Classification | 94.2 | 93.8 | 94.0 |
| Ethnicity Classification | 68.4 | 66.9 | 67.6 |
Table 10.
Accuracy and MAE metrics for gender, age, and ethnicity classification at 10 m distance.
Table 10.
Accuracy and MAE metrics for gender, age, and ethnicity classification at 10 m distance.
| Model | Gender Accuracy (%) | Ethnicity Accuracy (%) | Age MAE (Years) |
|---|
| Proposed Model | 85 | 65 | 1.5 |
| CNN-Based Adaptation [23] | 79 | 58 | 2.1 |
| Multi-View Attribute Recognition [2] | 81 | 61 | 1.9 |
| Attribute-Based Periocular Recognition [13] | 80 | 59 | 2.0 |


