Article

Research on the Time-Varying Network Topology Characteristics of Cryptocurrencies on Uniswap V3

by
Xiao Feng
1,
Mei Yu
1,*,
Tao Yan
2,
Jianhong Lin
2,* and
Claudio J. Tessone
2
1
Department of Economics, Chengdu College of University of Electronic Science and Technology of China, Chengdu 611730, China
2
Blockchain and Distributed Ledger Technologies Group, Department of Informatics, Blockchain Center, University of Zurich, 8050 Zurich, Switzerland
*
Authors to whom correspondence should be addressed.
Electronics 2025, 14(12), 2444; https://doi.org/10.3390/electronics14122444
Submission received: 13 May 2025 / Revised: 4 June 2025 / Accepted: 11 June 2025 / Published: 16 June 2025
(This article belongs to the Special Issue Complex Networks and Applications in Blockchain-Based Networks)

Abstract

This study examines the daily top 100 cryptocurrencies on Uniswap V3. It denoises the correlation coefficient matrix of cryptocurrencies by using sliding window techniques and random matrix theory. Further, this study constructs a time-varying correlation network of cryptocurrencies under different thresholds based on complex network methods and analyzes the Uniswap V3 network’s time-varying topological properties and risk contagion intensity of Uniswap V3. The study findings suggest the presence of random noise on the Uniswap V3 cryptocurrency market. The strength of connection relationships in cryptocurrency networks varies at different thresholds. With a low threshold, the cryptocurrency network shows high average degree and average clustering coefficient, indicating a small-world effect. Conversely, at a high threshold, the cryptocurrency network appears relatively sparse. Moreover, the Uniswap V3 cryptocurrency network demonstrates heterogeneity. Additionally, cryptocurrency networks exhibit diverse local time-varying characteristics depending on the thresholds. Notably, with a low threshold, the local time-varying characteristics of the network become more stable. Furthermore, risk contagion analysis reveals that WETH (Wrapped Ether) exhibits the highest contagion intensity, indicating its predominant role in propagating risks across the Uniswap V3 network. The novelty of this study lies in its capture of time-varying characteristics in decentralized exchange network topologies, unveiling dynamic evolution patterns in cryptocurrency correlation structures.

1. Introduction

In recent years, blockchain technology has experienced rapid development, and one of its most powerful innovations is the decentralized transfer and trading of financial assets [1]. Cryptocurrency is based on blockchain technology and is regarded as a single asset class on the financial market [2]. Decentralized exchange (DEX) is a part of the decentralized finance (DeFi) ecosystem [3]. Unlike centralized exchanges, DEXs aim to facilitate cryptocurrency trading by relying on smart contracts and blockchain technology [4], where people can easily create a token on the blockchain and list it on a decentralized exchange for trading. Uniswap is one of the most famous cryptocurrency DEXs built on the Ethereum blockchain [5]. Uniswap was first launched on the Ethereum mainnet in November 2018 and released its third version in May 2021. Its Automated Market Maker (AMM) model significantly improves the convenience of cryptocurrency trading [6]. According to CoinGecko data, Uniswap V3 is currently the highest-volume decentralized exchange (DEX), surpassing competitors like PancakeSwap and Curve by a significant margin.
However, due to the lack of regulations on decentralized exchanges, cryptocurrency prices are highly volatile and prone to violent fluctuations, increasing the risk for investors [7]. At the same time, cryptocurrency has the characteristics of higher returns than traditional stock assets, which makes some speculators exist in the cryptocurrency market, meaning that the market contains significant noise [8]. Therefore, measuring the relationship between cryptocurrencies and their risk contagion accurately is significant for improving market transparency and understanding systemic vulnerabilities in the decentralized exchanges.
The structure of this paper is organized as follows: Section 2 reviews the existing literature on the application of complex network methods and random matrix theory in cryptocurrency markets. Section 3 outlines the methodologies employed in this study. Section 4 describes the data, constructs the correlation coefficient matrix, and applies random matrix theory for denoising. Section 5 explores the topological properties of the cryptocurrency network and analyses risk contagion dynamics within the Uniswap V3 ecosystem. Finally, Section 6 concludes this study.

2. Related Works

Complex network methods are widely regarded as powerful tools for modeling and describing various complex systems [9]. In recent years, this method has been widely applied in blockchain data analysis, including address clustering and entity recognition, transaction pattern recognition, privacy leakage risk analysis, and illegal behavior detection in multiple fields [9]. Jing et al. [10] proposed that the cryptocurrency market is a complex system, and the complex interdependence between cryptocurrencies can be used to construct efficient investment portfolios. Yan et al. [11] employed a complex network approach to analyze the static and dynamic network features of the Uniswap V2 market. They found that the Uniswap V2 market was centralized in terms of token connection and liquidity distribution. Campajola et al. [12] investigated seven blockchains and found increasing centralization over time. Lin et al. [13] examined the Bitcoin Lightning Network and revealed it exhibits a weighted, scale-free topology with pronounced core-periphery structures. Bovet et al. [14] showed that changes in the topology of Bitcoin’s transaction network correlate with significant shifts in price dynamics, especially during periods of rapid price decline. Serena et al. [15] discovered that the trading networks of Bitcoin, Ethereum, Dogecoin, and Ripple exhibit a small world property, while Qiao et al. [16] studied the risk spillover networks between different cryptocurrencies, including cryptocurrencies, DeFi tokens, and NFTs. Another work applied complex network to identify arbitrage opportunities in the decentralized market [17]. In response to the changes in cryptocurrency networks over different time periods, Ho et al. [18] constructed a Minimum Spanning Tree (MST) network based on the historical closing prices of the top 120 cryptocurrencies by market capitalization, and they analyzed the dynamic evolution process of key cryptocurrencies from 2013 to 2022. Mardan et al. [19], Vidal [20], Nguyen et al. [8], and Pagnottoni et al. [21] studied the network topology of cryptocurrencies before and after the outbreak of COVID-19. Unlike other studies, Nguyen [8] proposed that noise and trends in the cryptocurrency market can affect the correlation between cryptocurrencies, and random matrix theory can effectively remove these noises and trends. Based on the theory of random matrices, Chaudhari et al. [22] studied the correlation between cryptocurrencies at different times. Giudici et al. [23] applied the random matrix theory to determine the driving factors of Bitcoin’s price. Soloviev et al. [24] monitor and predict crisis phenomena in stock and cryptocurrency markets based on random matrix theory.
The research studies above focus primarily on the correlation of cryptocurrency prices in centralized markets. Studies on decentralized exchanges are still relatively rare. Moreover, most of these studies analyze specific cryptocurrencies over fixed time intervals, failing to capture the daily dynamics of the market from a comprehensive and time-resolved perspective. In this study, we focus on the decentralized exchange, which is Uniswap V3, and apply a sliding window approach to tokens’ daily price data, enabling the construction of time-varying correlation coefficient matrices. These matrices are denoised using random matrix theory, and corresponding complex networks are built to investigate the temporal variability of network structures and the propagation of risk across the Uniswap V3 ecosystem.

3. Methods

Table 1 presents the key variables employed in this study along with their operational definitions.

3.1. Cryptocurrency Yield Correlation Coefficient Matrix

Assuming that the market is composed of N cryptocurrencies, the daily logarithmic rate of return for cryptocurrencies is
r i ( t ) = log p i ( t ) p i ( t 1 )
where r i ( t ) is the natural logarithmic return of the i-th cryptocurrency on the t-th trading day, and p i ( t 1 ) is the closing price of the i-th cryptocurrency on the ( t 1 ) -th trading day. Then, calculate the correlation coefficients between various cryptocurrencies.
ρ i , j = E { ( r i E ( r i ) ) ( r j E ( r j ) ) } V a r ( r i ) V a r ( r j )
where ρ i , j is the correlation coefficient between cryptocurrencies i and j, E ( r ) is the mathematical expectation of cryptocurrency yield, and V a r ( r j ) is the variance of cryptocurrency returns. The correlation coefficient matrix between n cryptocurrencies can be expressed as
C = c i , j = ρ i , j , i j c i , j = 1 , i = j
where C is the correlation coefficient matrix of size N × N , and c i , j is an element in the correlation coefficient matrix C.

3.2. Random Matrix Theory

Financial time series are typically influenced by multiple factors, and their correlation coefficients often contain noise information [25] that obscures the economic significance of the data [26]. Random matrix theory (RMT) is commonly applied in removing noise from financial time series [27,28,29,30]. The core idea of using random matrix theory for noise reduction is that eigenvalues of the correlation coefficient matrix of the variables, which fall within the range predicted by random matrix theory, are considered to be noise because they do not express the interactions between the variables [31]. A constant “a” should be introduced to replace the noise eigenvalues, resulting in a new correlation coefficient matrix. This new matrix reduces the impact of noise and provides a more accurate depiction of the relationships between variables compared to the original matrix. Consequently, it enables a more effective examination of risk transmission [32]. The specific steps for applying random matrix theory for noise reduction are as follows:
  • Step 1: Assume there are N time series with identical sample size L, from which we construct a random linear correlation matrix R:
    R = 1 L A A T
    where A is composed of N independent sequences of length L, each of which follows an N ( 0 , 1 ) distribution. Assume Q = L N ; thus, the maximum and minimum values of the predicted eigenvalues of a random matrix can be expressed as
    λ ± = δ 2 1 + 1 Q + 2 1 Q
    where λ + and λ are the upper and lower bounds of the random matrix’s predicted eigenvalue spectrum, which measures the range of market noise and unsystematic fluctuations, and δ 2 is the variance of the random matrix R.
  • Step 2: Performing feature decomposition on the cryptocurrency correlation coefficient matrix C:
    C = P Λ P T
    where P is an orthogonal matrix, P T is the transpose of matrix P(i.e., P P T = 1 ) , and Λ is a diagonal matrix containing eigenvalues. Its main diagonal elements are the eigenvalues of the cryptocurrency correlation coefficient matrix. Sort the eigenvalues in the Λ matrix from small to large, and obtain the eigenvalue matrix Λ s , which takes the specific form of
    Λ s = diag λ 1 , , λ m , λ m + 1 , , λ k , λ k + 1 , , λ n
    where λ m < λ and λ k + 1 > λ + . Simultaneously, perform feature decomposition on the random matrix R.
  • Step 3: Replace the eigenvalues of the correlation coefficient matrix that fall within the predicted range of the random matrix theory with 0 [33] as follows:
    Λ new = diag λ 1 , , λ m , 0 , , 0 , λ k + 1 , , λ n
    Meanwhile, the eigenvector matrix of the correlation coefficient also retains the eigenvectors at the same position. Therefore, the denoised correlation coefficient matrix can be expressed as follows:
    C new = P new Λ new P new T
    where C new is the new correlation coefficient matrix with its main diagonal elements set to 1, and P new is the new matrix of eigenvectors. By improving the correlation coefficient matrix of cryptocurrencies through the above method, the noise in the correlation coefficient matrix can be removed.

3.3. Cryptocurrency Network Topology Indicators

The cryptocurrency association network constructed in this study is an undirected weighted network. Each node represents a cryptocurrency. The edges between nodes represent the correlation between the fluctuations in cryptocurrency prices, and the weights of the edges indicate the specific magnitude of the correlation. The construction of complex network models based on correlation coefficients typically involves methods such as the minimum spanning tree [34], planar maximum filtering graph [35], and the threshold method [36]. For this study, the threshold method is chosen for constructing the cryptocurrency network. In the threshold method, the threshold θ represents the value of the state parameter that triggers a sudden change in system behavior. If the correlation coefficient ρ i , j between two cryptocurrencies i and j is greater than or equal to the specified threshold θ , it indicates an edge connection between i and j. The magnitude of the correlation coefficient serves as the weight of the edge, and the corresponding adjacency matrix D is constructed as follows:
D = d i , j = 1 , i j , ρ i , j θ d i , j = 0 , i = j
where d i , j is an element in the adjacency matrix D. The value range of θ is 0 < θ 1 . Different values of θ can construct different network topologies. This study analyzes the complex cryptocurrency network of Uniswap V3 using three topological indicators: average degree, average clustering coefficient, and assortativity coefficient.
(1)
Average degree
The degree of a node can be defined as the number of edges connected to neighboring nodes [37], and the average degree of a network is the average degree of nodes in the network. The higher the average degree, the more edges there are for all nodes in the cryptocurrency network, the more complex the network, and the closer the connections between cryptocurrencies.
(2)
Average clustering coefficient
The average clustering coefficient is used to represent the degree of clustering of nodes in the network. Assuming that node i is connected to k i nodes by edges, the clustering coefficient C i of node i in an undirected network is [37]
C i = 2 E i k i ( k i 1 )
where E i is the actual number of edges, and ( k i ( k i 1 ) ) / 2 is the maximum number of edges that may exist between k i nodes. The average clustering coefficient (AC) of the network is
A C = 1 n i = 1 n C i
where the value range of A C is 0 A C 1 . When A C = 0 , it indicates that no node in the network has interconnected neighbors, and all nodes are isolated points; the closer A C is to 1, the higher the tightness of each node. When A C = 1 , every node’s neighbors are fully connected, indicating maximal local clustering throughout the network.
(3)
Assortativity coefficient
The assortativity coefficient is the Pearson correlation coefficient of degrees, used to indicate whether nodes with similar characteristics in a network tend to connect to each other, expressed as r [38]:
r = M 1 u i , j E w i w j M 1 u i , j E 1 2 ( w i + w j ) 2 M 1 u i , j E 1 2 ( w i 2 + w j 2 ) M 1 u i , j E 1 2 ( w i + w j ) 2
where M is the total number of edges, u i , j represents the edge between nodes i and j, and E is the set of all edges in the network. The value of r ranges from 1 to 1. A positive value of r indicates assortative mixing, where high-degree nodes tend to connect with other high-degree nodes, implying a higher likelihood of contagion within similar types of markets. A negative r indicates disassortative mixing, where high-degree nodes tend to connect with low-degree nodes, suggesting potential for risk propagation across heterogeneous market participants. A value of r = 0 indicates no degree correlation.

4. Data and Correlation Coefficient Matrix Denoising

4.1. Data Description

This study analyzes the cryptocurrency of Uniswap V3 decentralized exchange. As tokens are introduced and adopted at different points in time, their trading activity and liquidity vary considerably. Consequently, the correlation structures among tokens and their roles within the market network exhibit substantial temporal variation. Analyzing Uniswap V3 at an aggregated level may therefore obscure dynamic structural changes and transient patterns of influence.
There were around 19,000 cryptocurrencies on Uniswap V3 on 30 October 2024. In order to better represent the market changes of Uniswap V3, this study selects the top 100 cryptocurrencies in the daily market value ranking of Uniswap V3 as the research data. Since the price of fiat-collateralized stablecoins is pegged to the US dollar, their price fluctuations are not significantly related to the price volatility of other cryptocurrencies. Therefore, this study excludes three stablecoins (USDC, USDT, DAI). Uniswap V3 was launched on the Ethereum mainnet on 5 May 2021; therefore, the data scope studied in this study covers 1275 trading days from 5 May 2021, to 30 October 2024, with a dataset dimension of (1275, 100). The research data for this study are sourced from the subgraph with the highest signal value on The Graph website (https://thegraph.com/explorer, accessed on 23 October 2024).

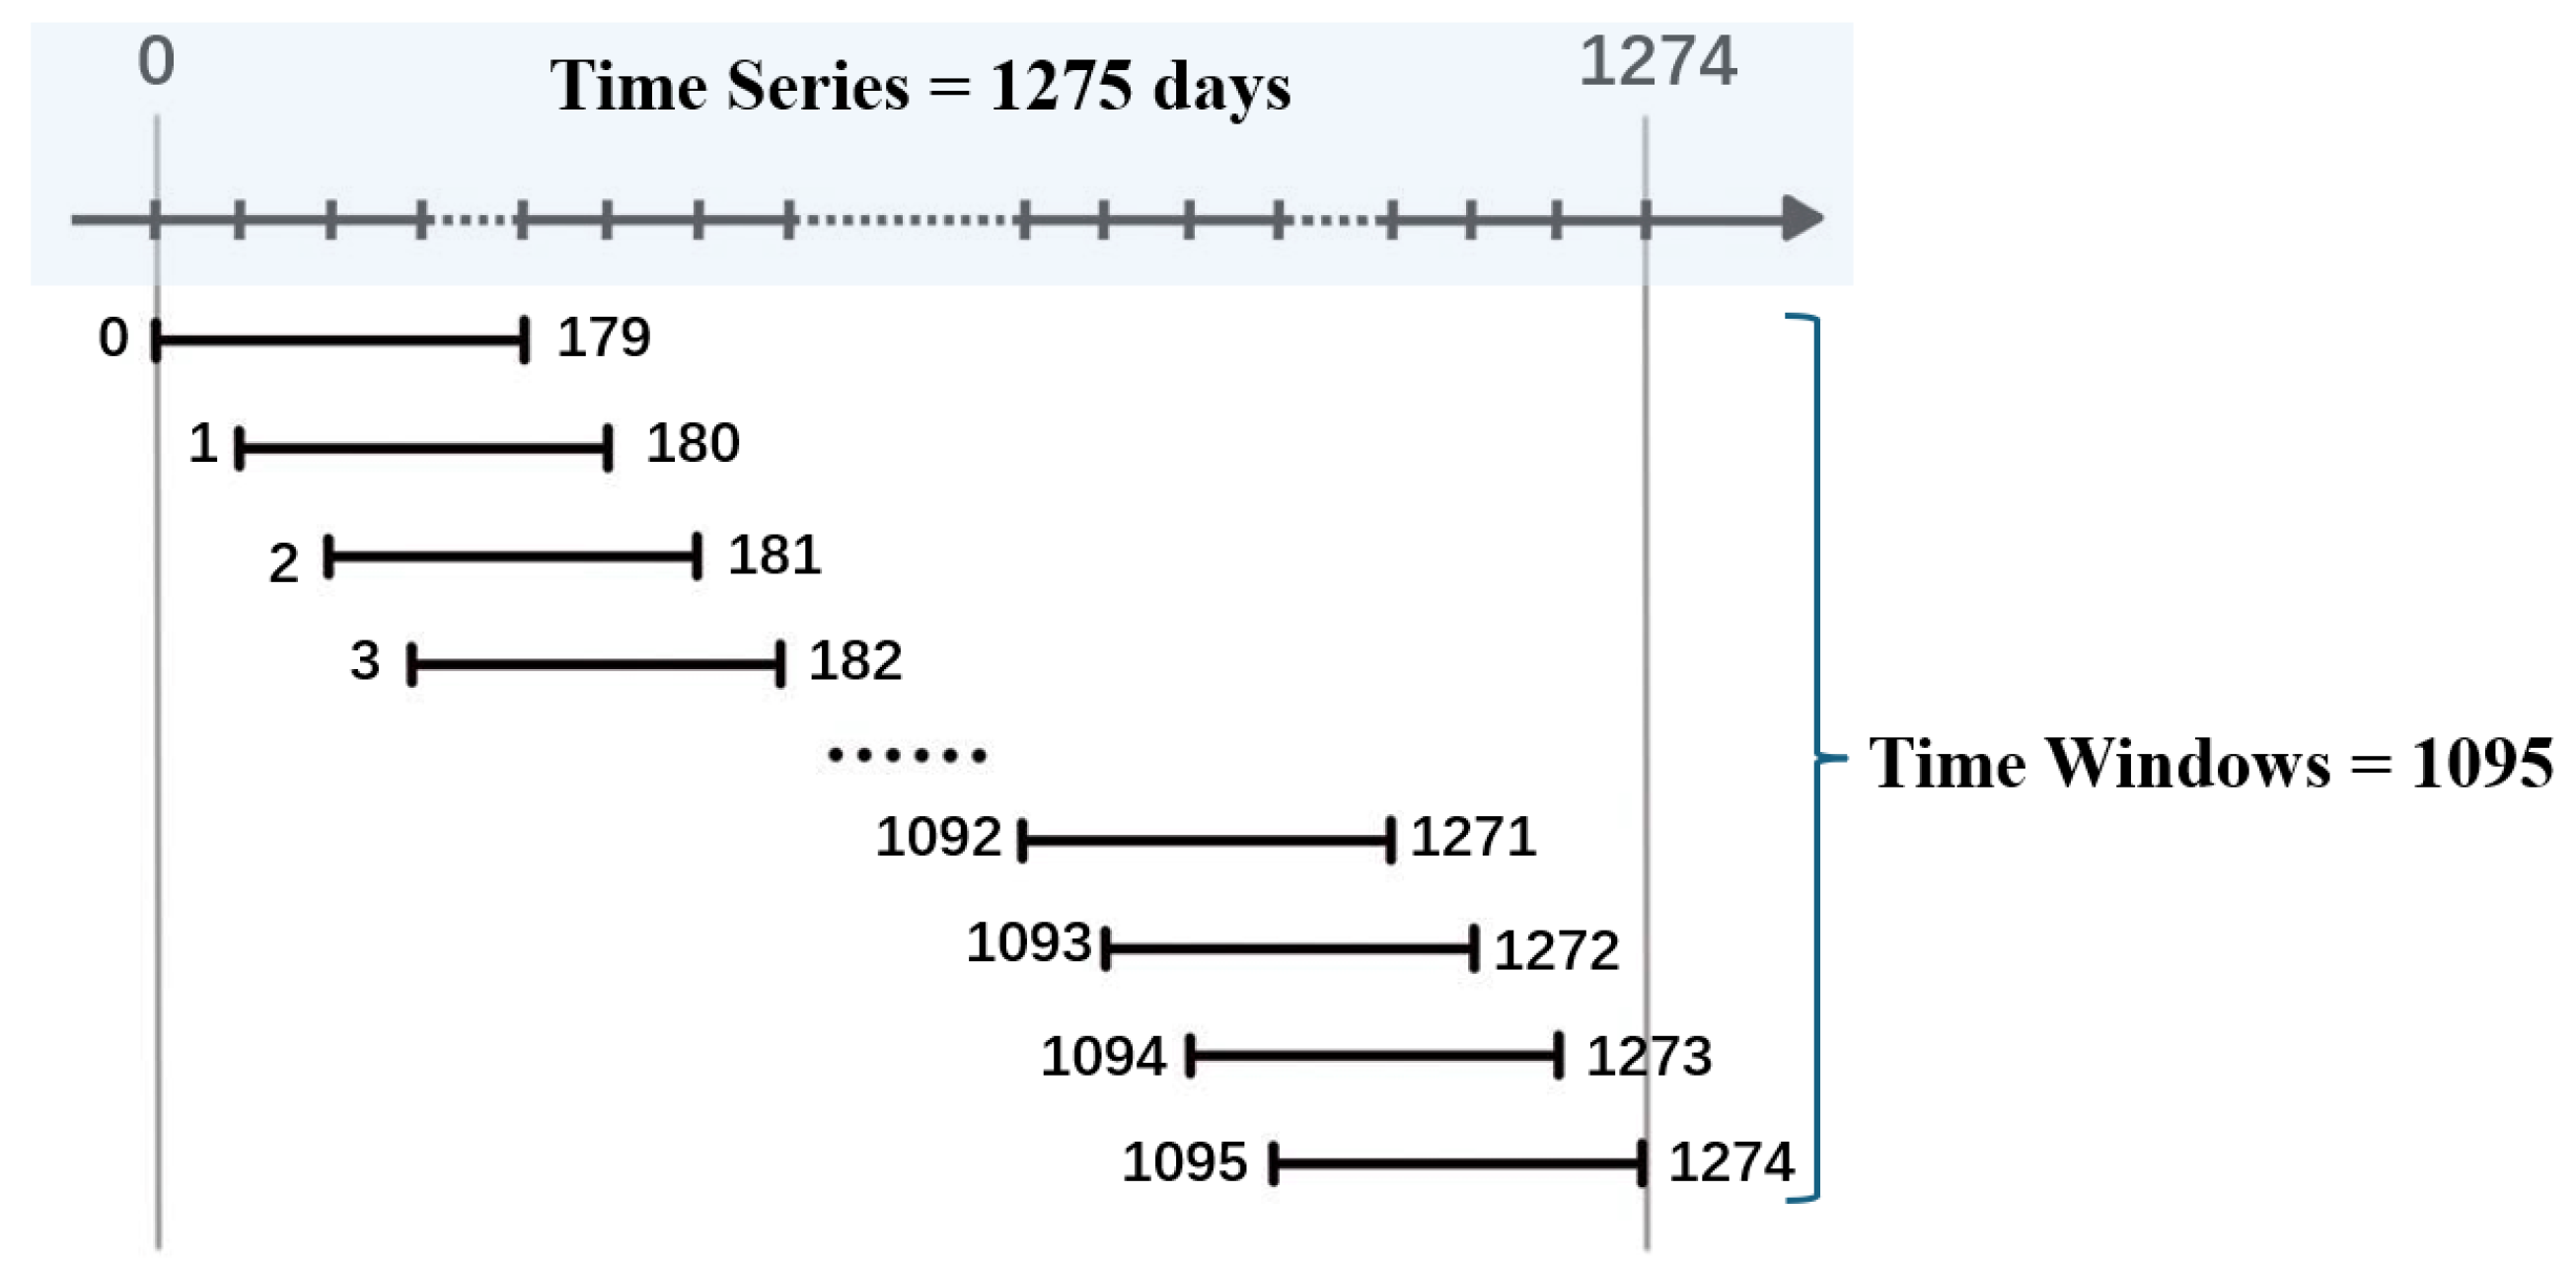
4.2. Sliding Window Processing

The issuance quantity and price fluctuations of cryptocurrencies on Uniswap V3 often exhibit different trends during various time periods, leading to distinct characteristics of the cryptocurrency trading network at different points in time. Therefore, this study uses sliding window technology to study the local time-varying characteristics of the cryptocurrency network topology on Uniswap V3. The specific steps are the following.
  • Firstly, set the sliding window length to 180 days and the sliding step size to 1 day, as shown in Figure 1. There are a total of 1095 sliding windows in the research dataset of this article.
  • Then, calculate the correlation coefficient matrix for the closing price of cryptocurrencies within each sliding window, and construct a random matrix to denoise the correlation coefficient matrix.
  • Finally, within each sliding window, a cryptocurrency network is constructed based on the denoised correlation coefficient matrix, and the network topology index is calculated to perform time-varying feature analysis in the Uniswap V3 network.

4.3. Denoising of Uniswap V3 Cryptocurrency Correlation Coefficient Matrix Based on RMT Theory

This study first calculates the logarithmic rate of return for each sliding window. For the missing rate values within each sliding window, this study uses the forward filling method to fill in cryptocurrency data with a missing rate below 10% and deletes cryptocurrency data with a missing rate equal to or higher than 10%.
The input for constructing the network model is the correlation coefficient between the returns of all cryptocurrency pairs. Therefore, this study calculates the Pearson correlation coefficient of pairwise cryptocurrency returns within each sliding window and constructs a correlation coefficient matrix. Finally, this study constructs a total of 1095 correlation coefficient matrices.
Simultaneously, this study generates a random matrix following a standard normal distribution N(0,1) within each sliding window, where the number of rows in the random matrix is the length of the sliding window and the number of columns is the number of cryptocurrency types in the sliding window. Then, this study calculates the correlation coefficient matrix of the random matrix. Feature decomposition is performed on the correlation coefficient matrix of cryptocurrency and the correlation coefficient matrix of random data, respectively, to obtain the corresponding eigenvalues and their upper and lower bounds. In this study, the range of predicted eigenvalues using random matrix theory is also calculated. Figure 2 shows the range of the eigenvalues of the cryptocurrency correlation coefficient, the eigenvalues of the random data correlation coefficient, and the eigenvalue ranges predicted by the random matrix theory within each sliding window. As shown in Figure 2, the process is as follows:
  • Firstly, the maximum and minimum eigenvalues of the random data correlation coefficient matrix almost coincide with the maximum and minimum predicted values of the random matrix theory, which conforms to the prediction principles of random matrices [31].
  • Secondly, the maximum eigenvalue range of the correlation coefficient matrix is between 5 and 30, which deviates significantly from the range predicted by the random matrix theory. At the same time, the minimum eigenvalue range of the correlation coefficient matrix tends towards 0, which deviates to some extent from the range predicted by the random matrix theory, indicating the existence of special non-random attributes in the cryptocurrency correlation coefficient matrix.
  • Thirdly, some eigenvalues of the linear correlation coefficient matrix fall within the range predicted by random matrix theory. The information contained in these eigenvalues cannot convey interactions between cryptocurrency variables and they are thus considered noise eigenvalues, indicating the presence of random noise in the cryptocurrency correlation coefficient matrix.
Therefore, based on the random matrix theory mentioned earlier, the eigenvalues in the cryptocurrency correlation coefficient matrix that fall within the range predicted by random matrix theory are replaced with 0 [33], thereby allowing us to obtain a denoised correlation coefficient matrix.

4.4. Distribution Attributes of Correlation Coefficient

This study calculates the mean of the correlation coefficient matrix after denoising to reflect the average correlation degree between cryptocurrencies within the sliding window. Figure 3 illustrates the changes in the number of cryptocurrencies and the average correlation coefficient of Uniswap V3 within each sliding window.
From Figure 3, it can be observed that the overall yield of cryptocurrencies on Uniswap V3 is positively correlated. At the beginning of the creation of Uniswap V3, the number of cryptocurrencies on Uniswap V3 was relatively small, and the correlation between these currencies was high. Subsequently, the growth rate of cryptocurrencies was relatively fast, and the entry of new currencies into the market increased the diversity of the Uniswap V3 market, while the correlation between markets decreased to a certain extent. From 2022 to 2024, the overall number of cryptocurrencies on Uniswap V3 has been increasing, with corresponding mean correlation coefficients fluctuating between 0.35 and 0.55.

5. Analysis of Uniswap V3 Network Topology Index Characteristics

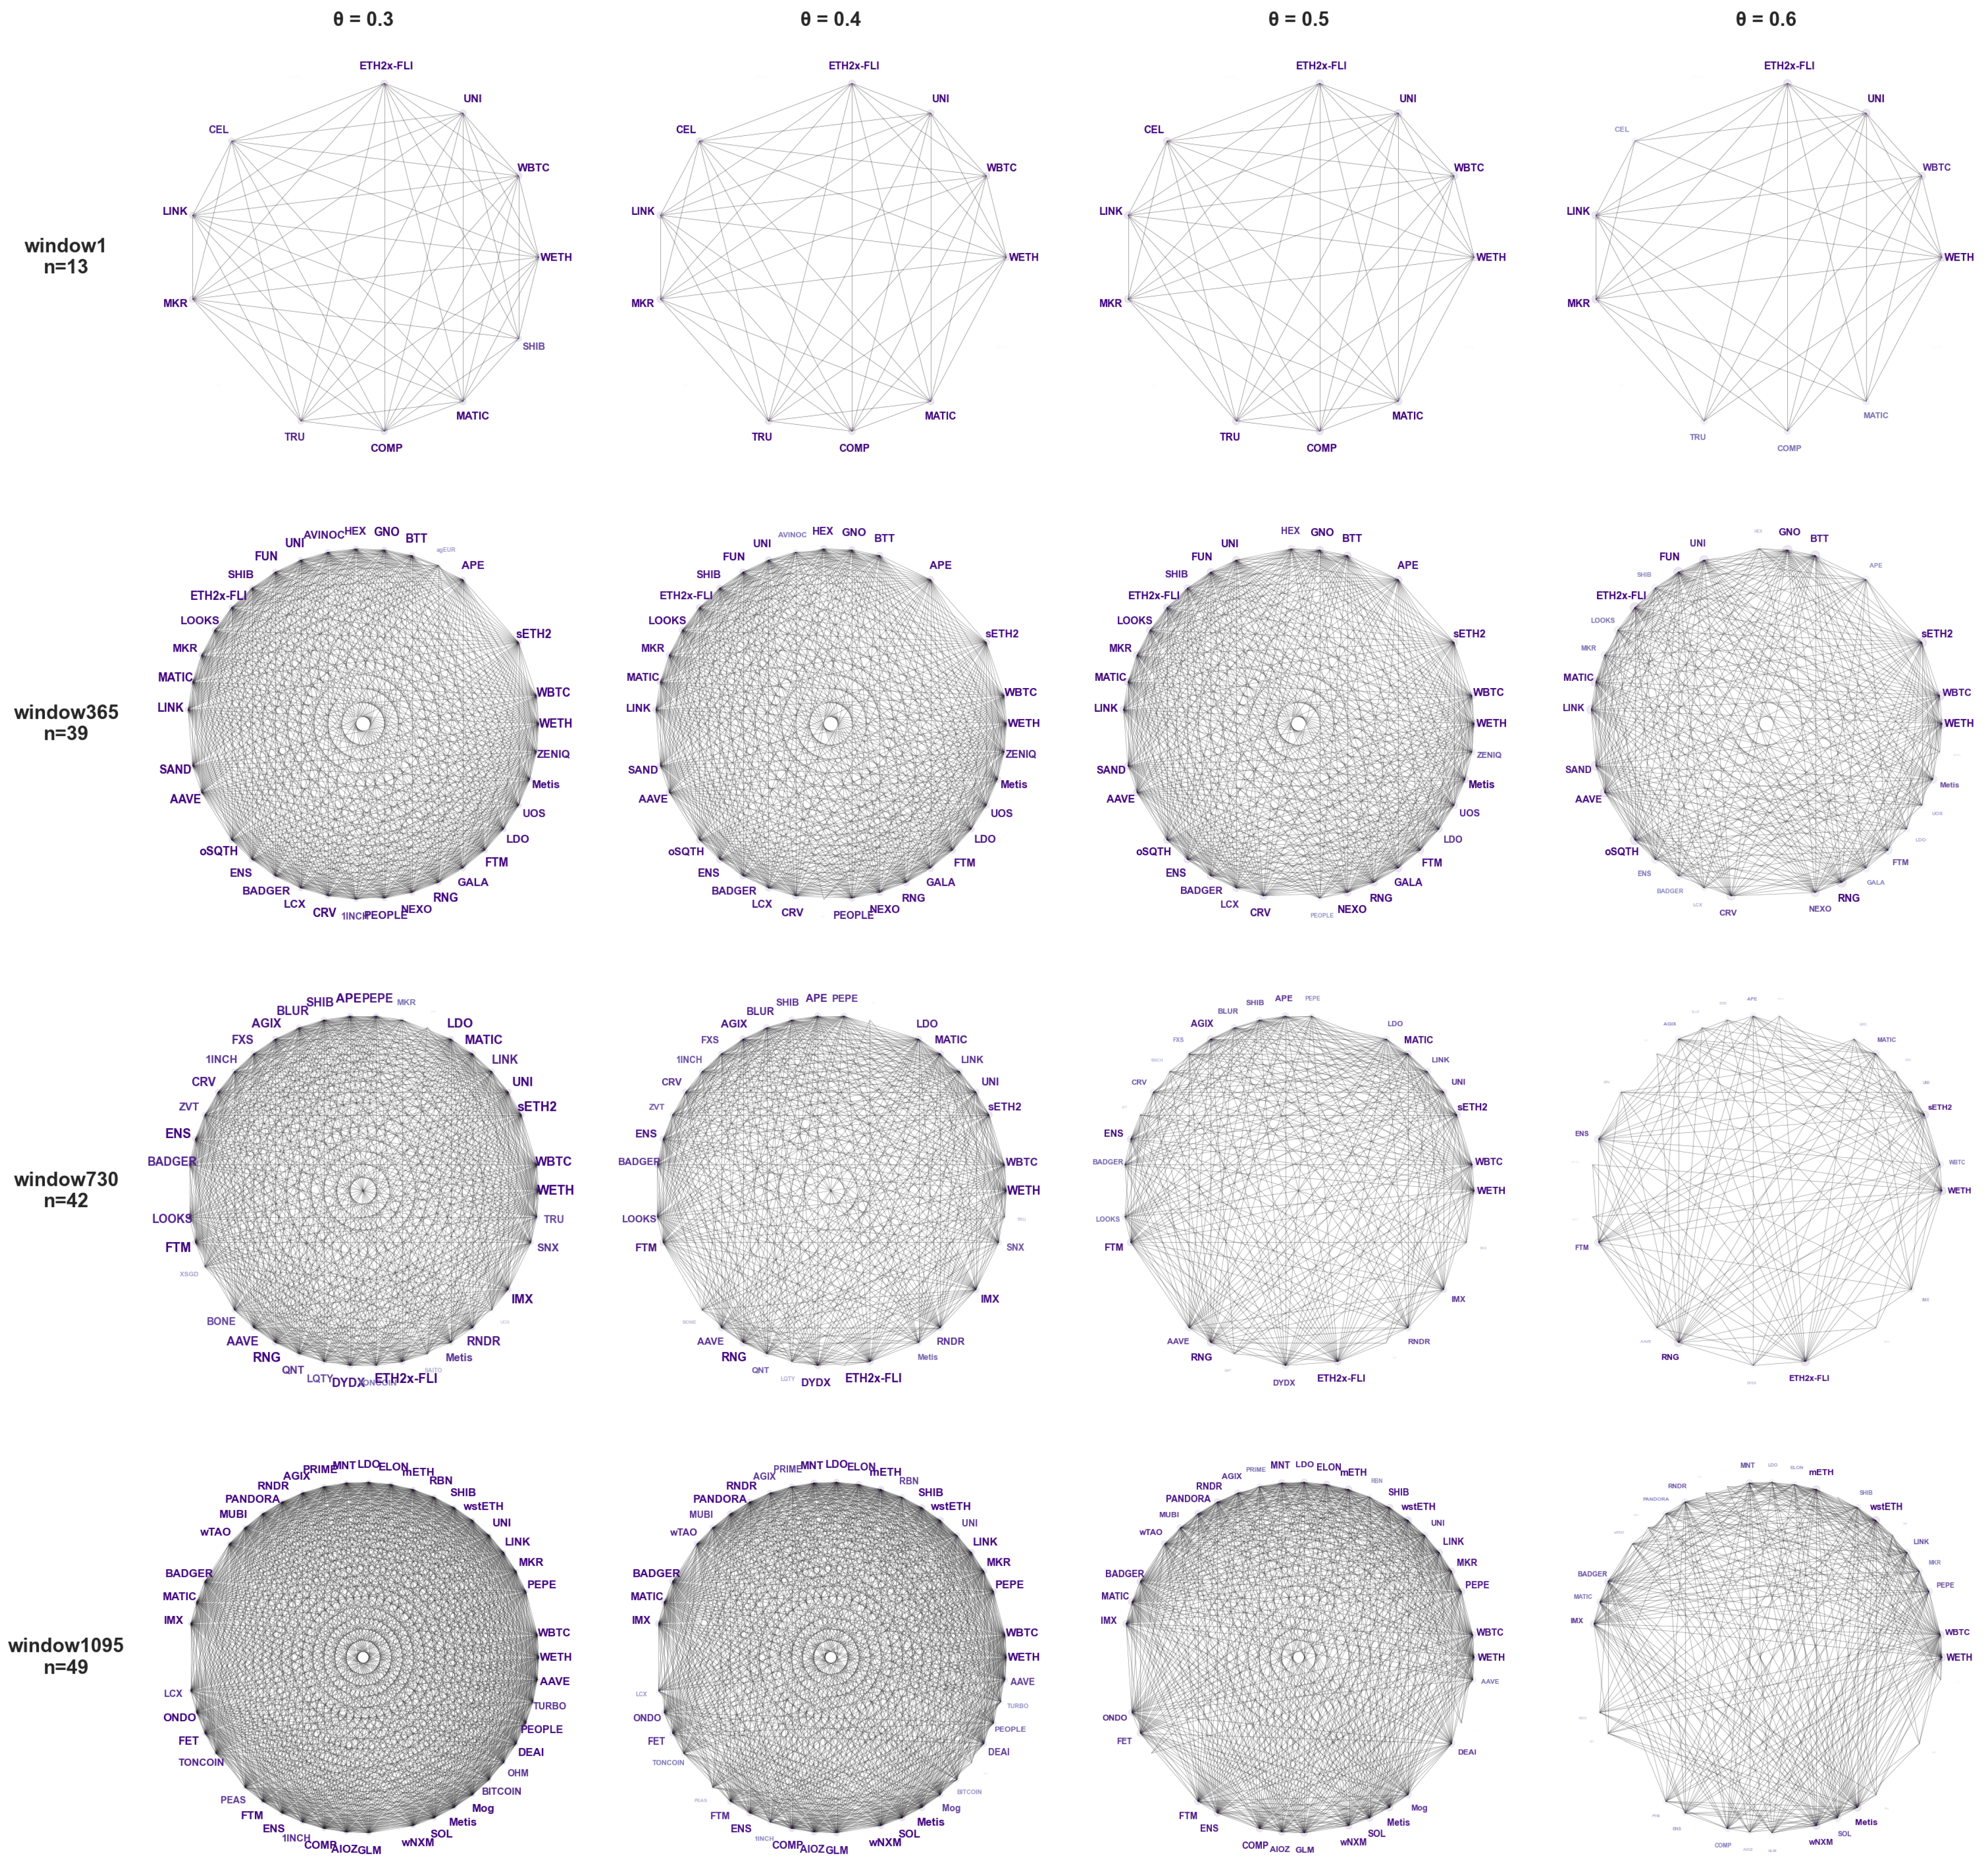
5.1. Uniswap V3 Network Topology Analysis

This study constructs a complex network based on the denoised cryptocurrency correlation coefficient matrix to analyze the network topological properties of Uniswap V3. Since the average correlation coefficient of cryptocurrencies ranges between 0.3 and 0.6 within each sliding window, this study sets the threshold range for the complex network model from 0.3 to 0.6, increasing by 0.1 at each step. To visually display the network topology structure under different time periods and thresholds, this study selects four sliding windows, namely the 1st sliding window, 365th sliding window, 730th sliding window, and 1095th sliding window, where the number of cryptocurrencies in each sliding window is 13, 39, 42 and 49, respectively. Figure 4 shows the Uniswap V3 network topology with different thresholds under the four windows, in which the more connections a node has, the larger and more prominent its label font becomes.
Under different sliding windows and thresholds, the degree of correlation between cryptocurrencies and the complexity of the network on Uniswap V3 vary. As θ increases, the number of edges in the network decreases, resulting in a sparser topology of the cryptocurrency network on Uniswap V3. When the threshold is set to 0.6, the cryptocurrency network on Uniswap V3 still maintains a large number of edges, but there are more isolated nodes at this point. In addition, WETH and WBTC have more edges with other cryptocurrencies under different sliding windows and thresholds, indicating their significant position in the network and noticeable impact on other cryptocurrencies.

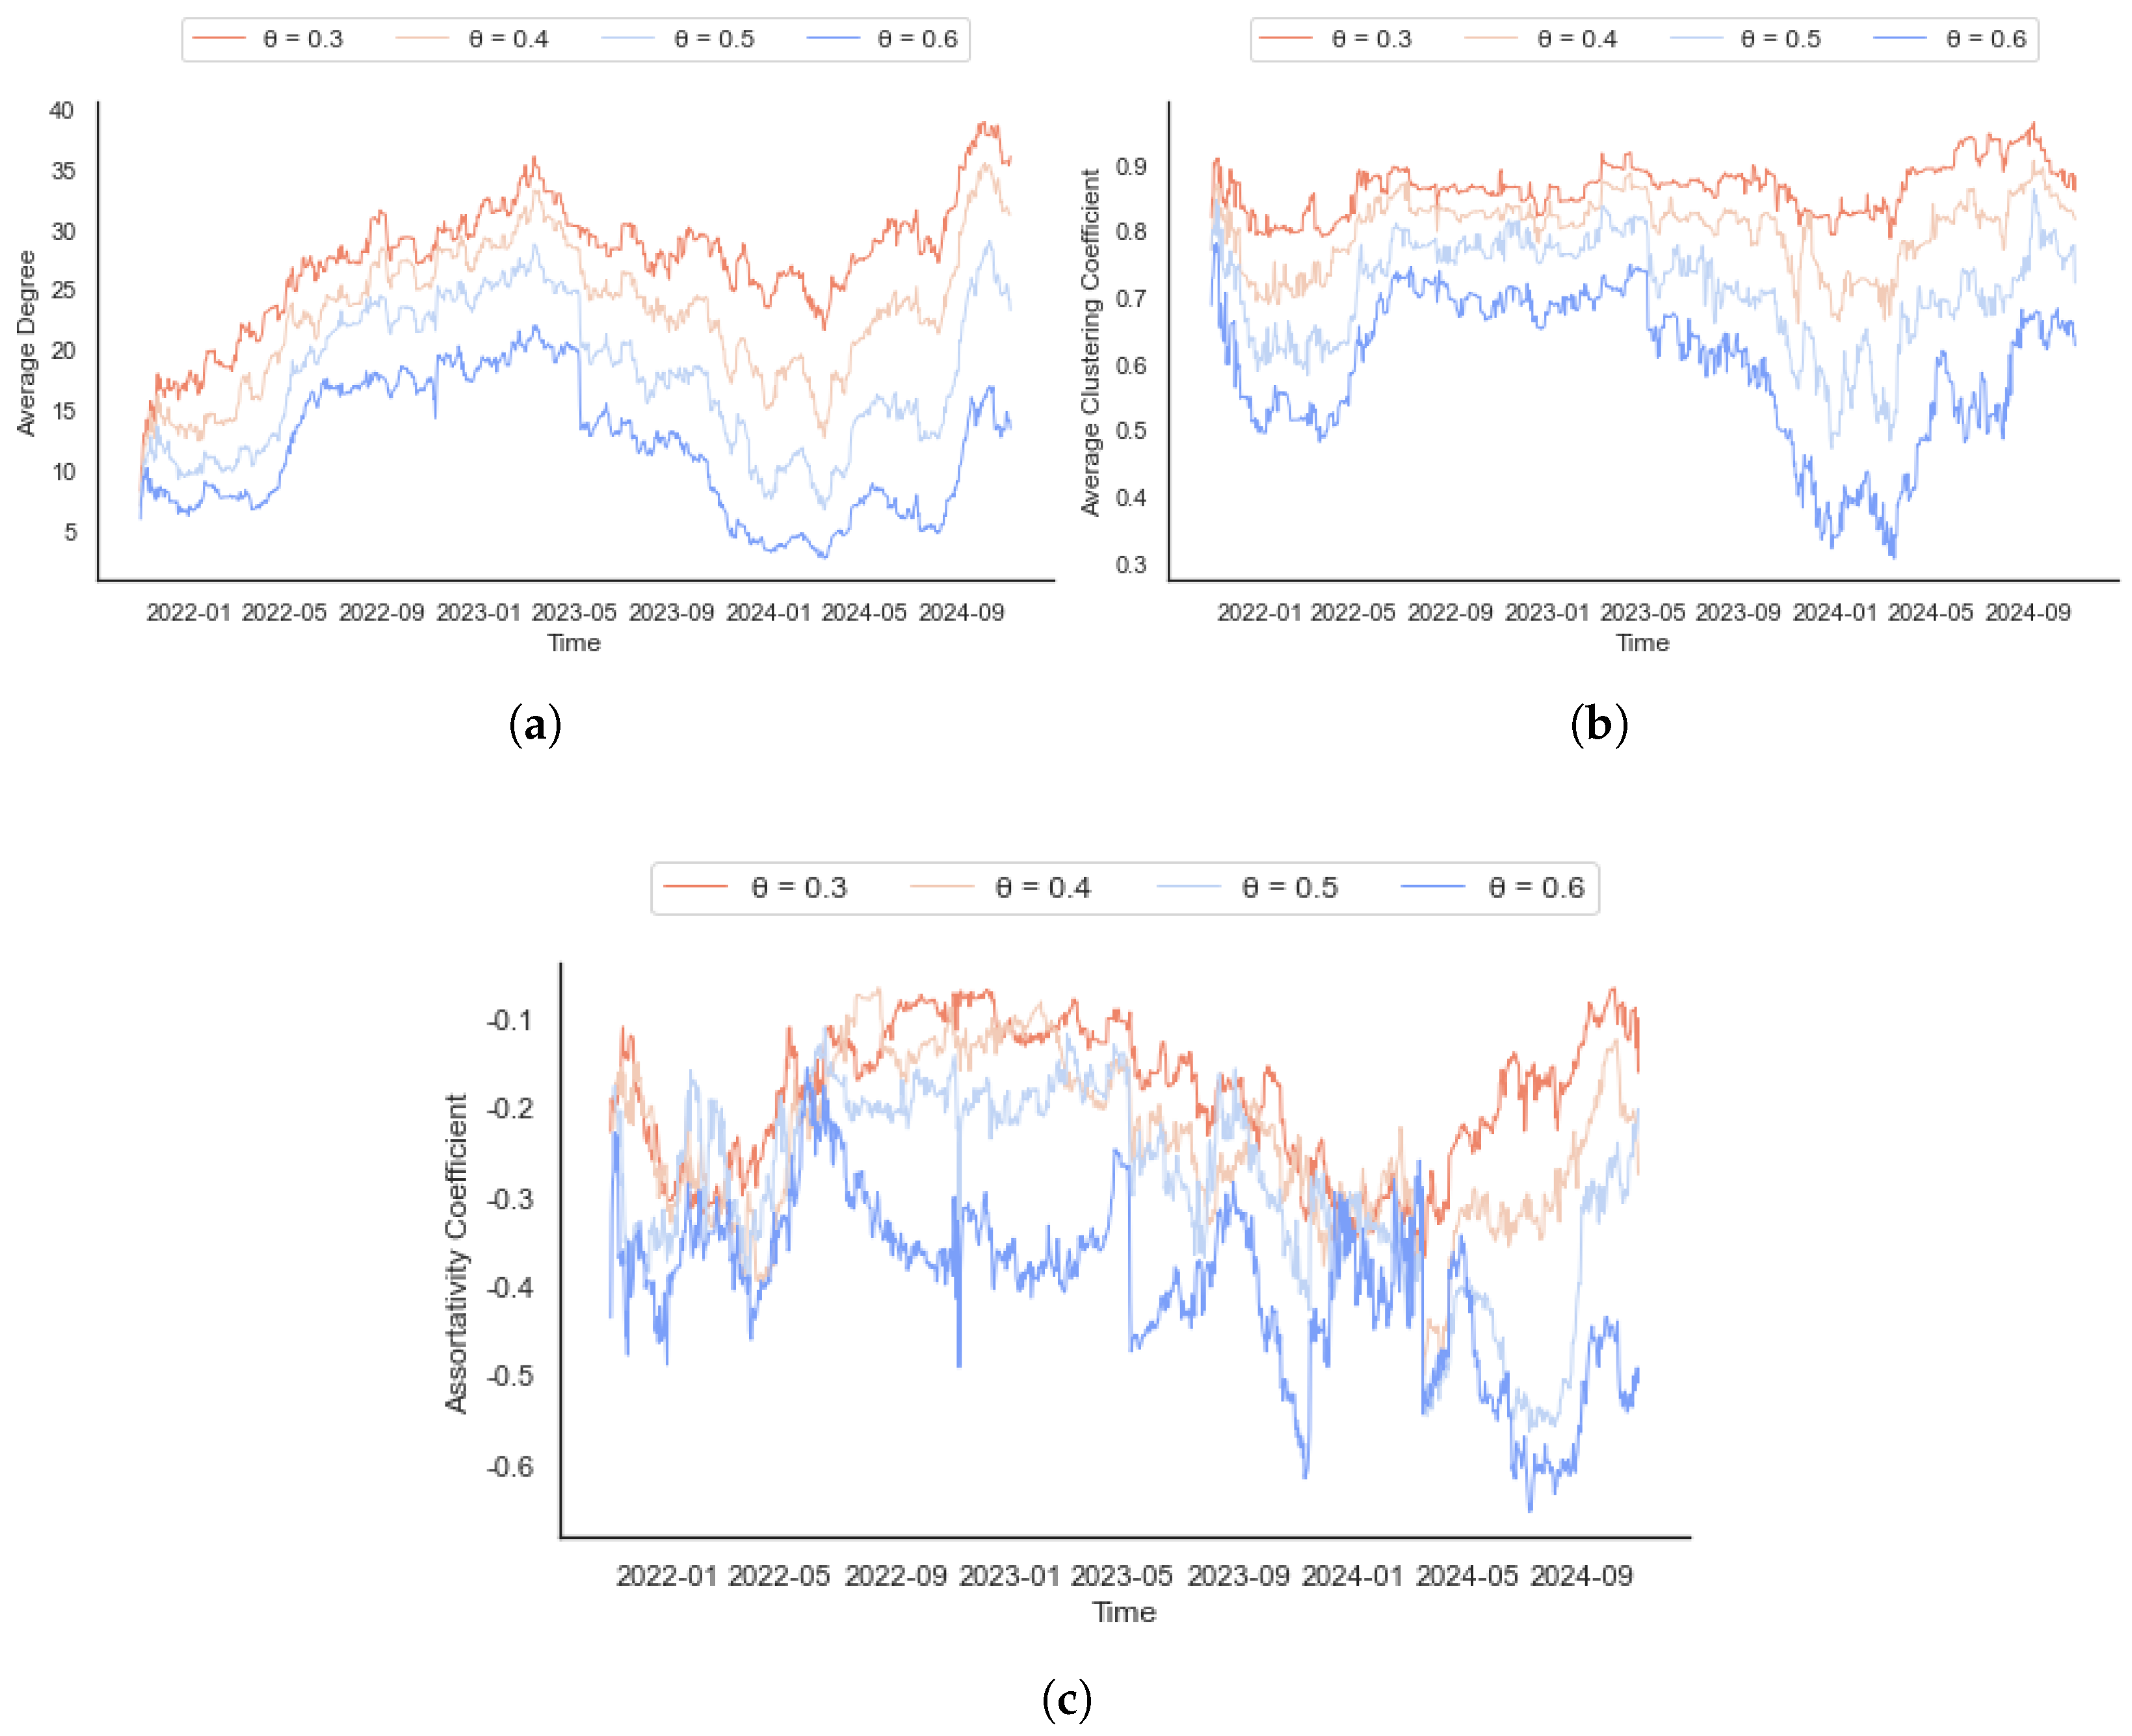
5.2. Analysis of Time-Varying Characteristics of Uniswap V3 Network Topology Indicators

To further investigate the changing trends of the topological features of the cryptocurrency network on Uniswap V3 at each sliding window under different thresholds, this study calculates the average degree, average clustering coefficient, and assortativity coefficient of the cryptocurrency network within each sliding window at each threshold.
Figure 5 illustrates the specific time-varying statistical characteristics of each indicator. It is evident that as the threshold increases, the average degree, average clustering coefficient, and assortativity coefficient of the network all decrease to varying degrees. Furthermore, each metric demonstrates distinct temporal fluctuation patterns under different thresholds on the Uniswap V3 network.
As shown in Figure 5a,b, when the threshold is set to 0.3, the average degree and average clustering coefficient are high, leading to a large number of edges in the cryptocurrency network. The overall network is dense, and local connections are also dense. At this point, the fluctuation of one cryptocurrency within the network can easily exert an influence on other cryptocurrencies, leading to risk contagion. On the other hand, when the threshold is 0.6, the average degree and average clustering coefficient are low, resulting in only the retention of edges for assets with high correlation coefficients in the network. Consequently, the cryptocurrency network becomes relatively sparse. In Figure 5c, under different thresholds, the assortativity coefficients of cryptocurrencies within various sliding windows are all less than 0, indicating that the Uniswap V3 network is entirely disassortative. This implies that the probability of the risk of a single cryptocurrency on Uniswap V3 being transmitted to different types of cryptocurrencies is relatively high.
In addition, from a temporal perspective, the average degree shows a pattern of initially increasing, then decreasing, and finally increasing once more (Figure 5a). Similarly, the small-world characteristic follows a trend of first increasing, then decreasing, and subsequently increasing again. When the threshold is set at 0.3, the overall average degree of the cryptocurrency network shows a trend of fluctuating upward. However, with a threshold of 0.6, the network connection relationships are relatively sparse, leading to significant fluctuations in the average degree over time with no clear upward trend. In Figure 5b, the average clustering coefficients do not show a notable upward trend over time. Under a threshold of 0.3, the average clustering coefficient of cryptocurrencies shows relatively stable behavior, fluctuating around 0.9 throughout the observation period. As the threshold increases, the strong connections among cryptocurrency nodes diminish, causing instability in the network’s local structure and a gradual increase in the fluctuation amplitude of the average clustering coefficient. The sparsity of the Uniswap V3 network also plays a significant role in the escalating fluctuation amplitude of the assortativity coefficient. In Figure 5c, as the threshold increases, this effect becomes more pronounced, leading to a progressive enhancement in the fluctuation amplitude of the assortativity coefficient over time.

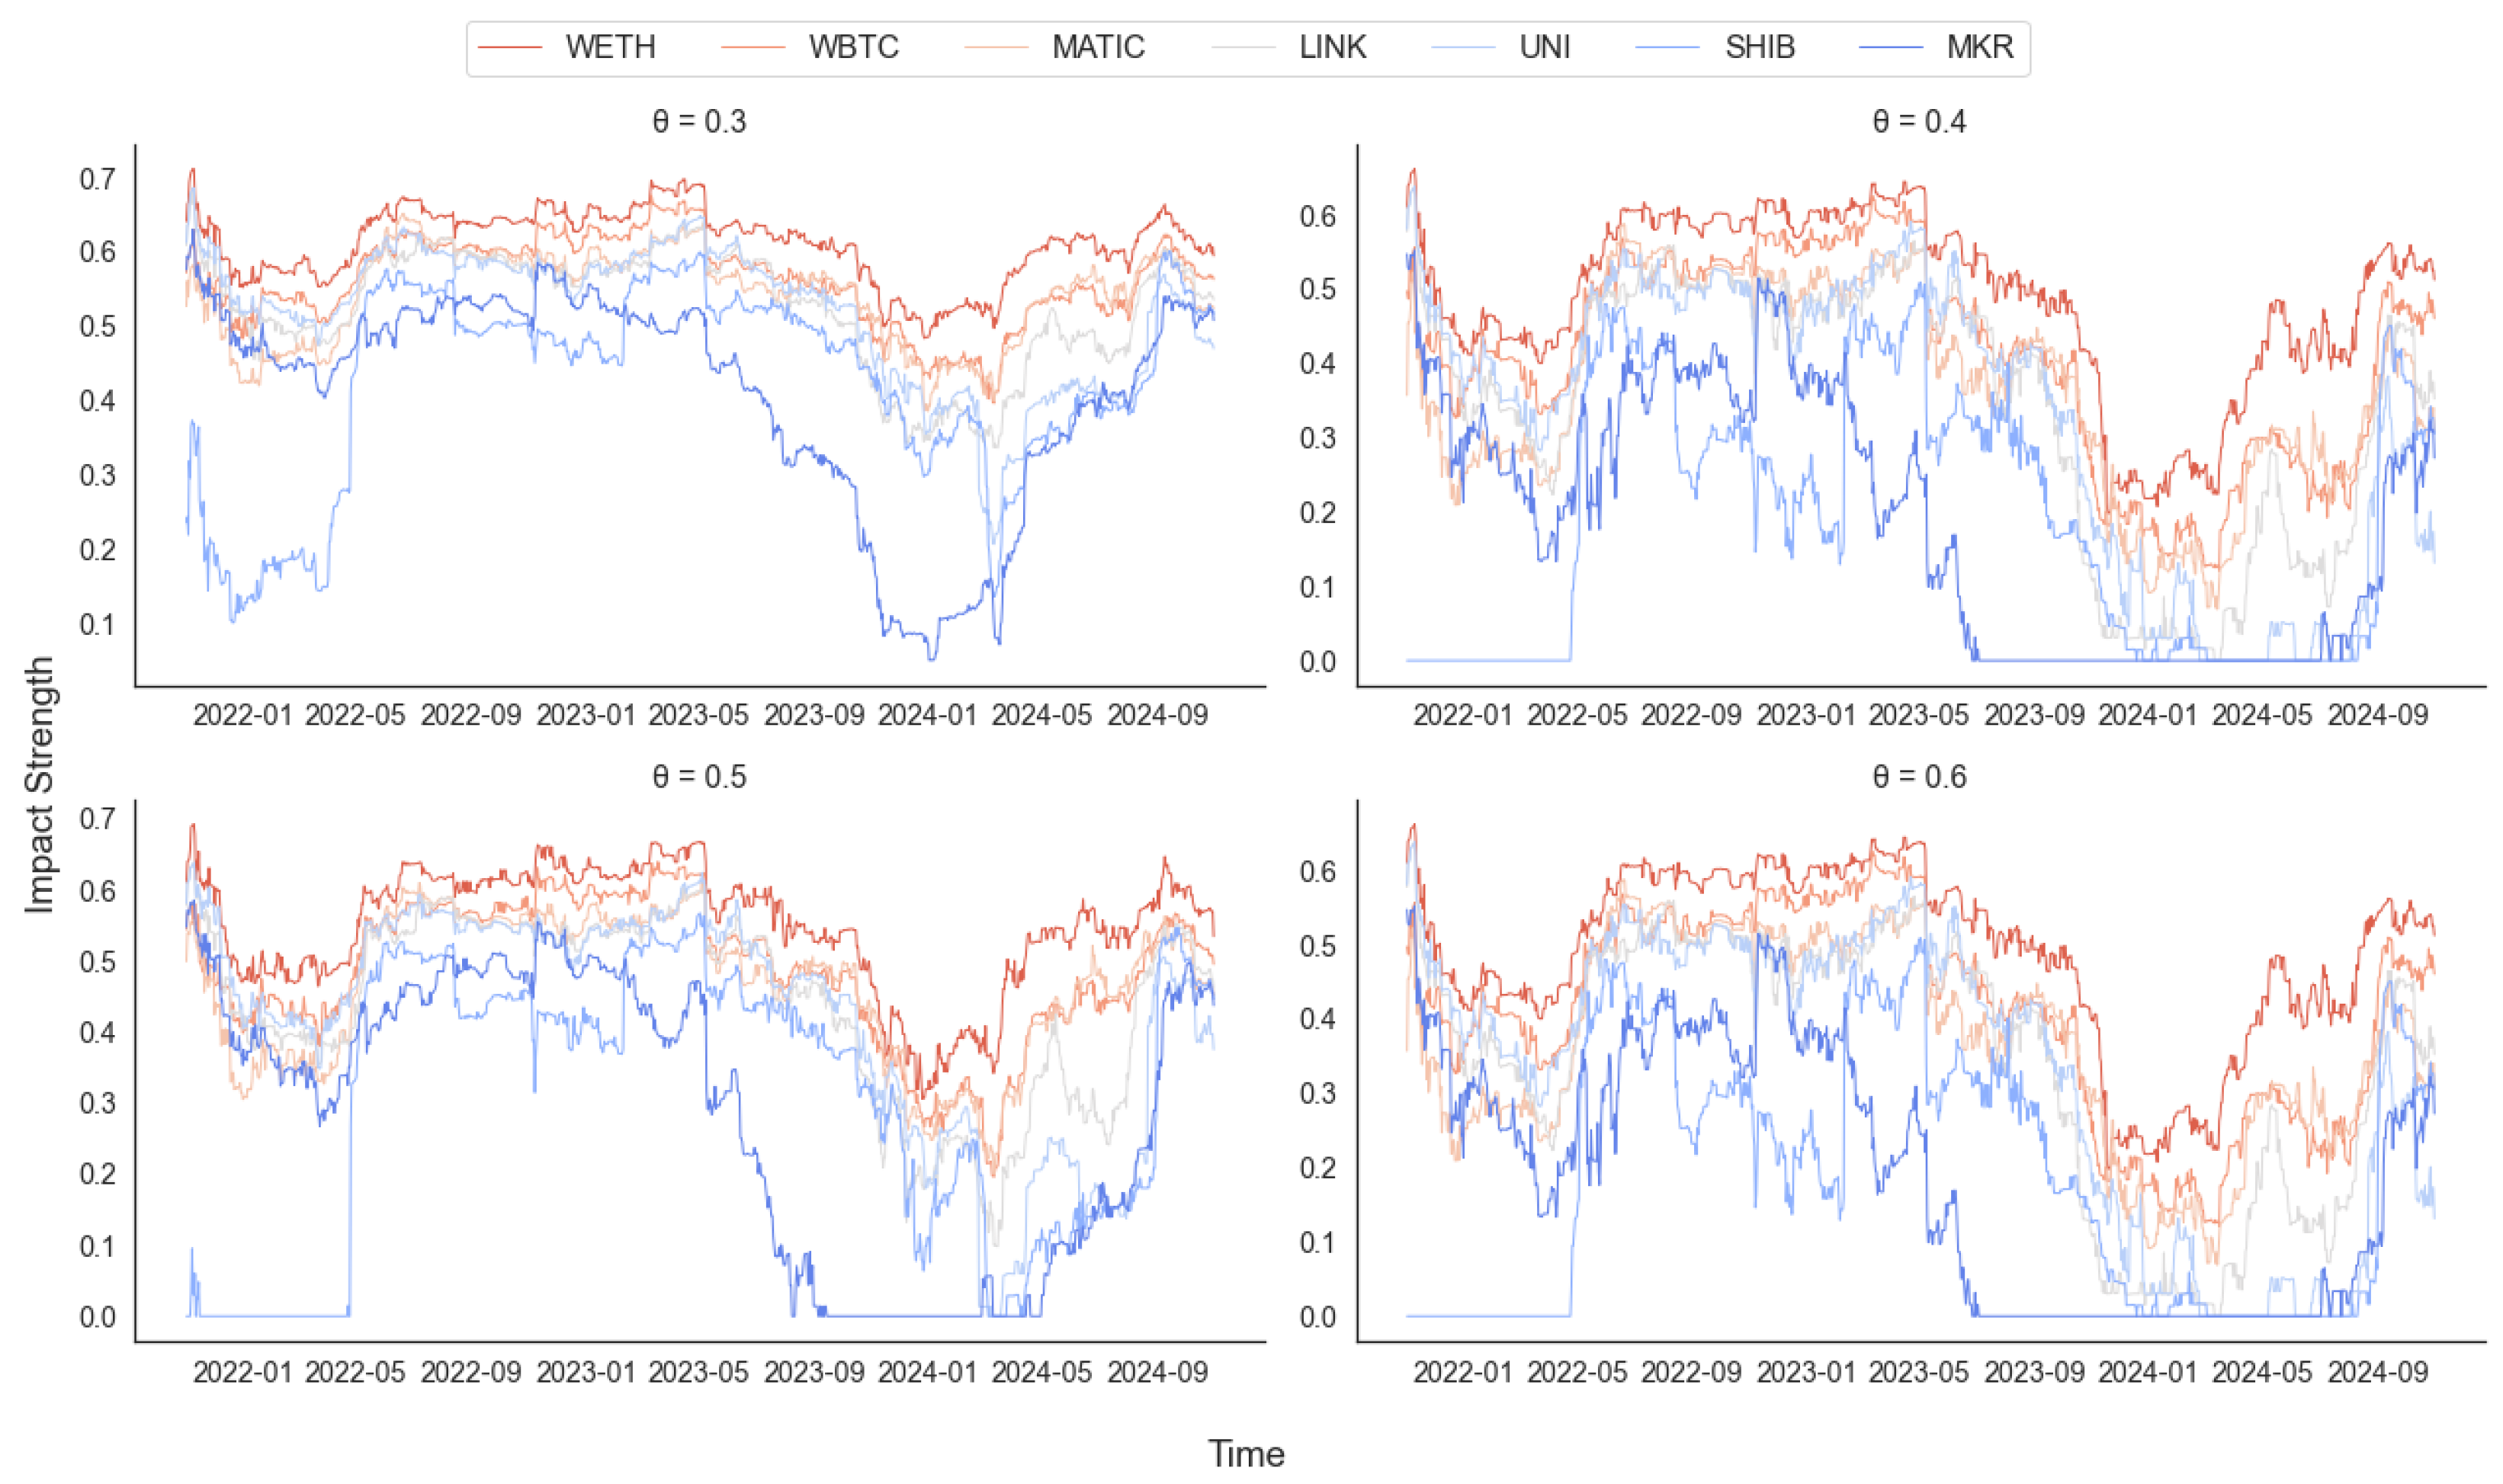
5.3. Analysis of the Impact Strength of Cryptocurrency on Uniswap V3

From the above analysis, it can be seen that there are many cryptocurrencies associated with the Uniswap V3 network, and fluctuations in one cryptocurrency can easily affect other cryptocurrencies, thus causing risk contagion. This study explores the difficulty of transmitting risks from various cryptocurrencies to the overall network by calculating the strength of their impact on the network. Specifically, the overall impact strength q i of cryptocurrency i on the network is defined as follows [39]:
q i = 1 n 1 i j c i , j
Due to the considerable number of sliding windows and the various types of cryptocurrencies present within each sliding window, this study specifically focuses on the cryptocurrencies identified in 1095 sliding windows, labeling them as “long-lived coins”.
Table 2 presents the average impact of “long-lived coins” in all sliding windows under different thresholds. As shown in Table 2, a total of seven “long-lived coins” are observed within all sliding windows of Uniswap V3, namely WETH, WBTC, MATIC, LINK, UNI, SHIB, and MKR. Among them, it is evident that WETH demonstrates the most significant average impact across different thresholds, making it more prone to transmitting risks to other cryptocurrencies on the network, followed by WBTC. With the escalation of the threshold, the cryptocurrency network experiences a reduction in density, resulting in fewer connections between nodes and a subsequent decrease in the average influence of each “long-lived coin” in the market.
Figure 6 illustrates the impact strength of “long-lived coins” on the cryptocurrency network on Uniswap V3 at various time periods under different thresholds. It can be observed that, across different thresholds, the impact strength of each “long-lived coin” on the Uniswap V3 cryptocurrency network follows a similar temporal pattern. Between June 2023 and May 2024, the influence of various “long-lived coins” on the Uniswap V3 cryptocurrency network was relatively weak. Among these “long-lived coins”, WETH exhibits the most significant impact on the cryptocurrency networks across various time periods.

6. Conclusions

This study applies random matrix theory and sliding window technology to denoise the cryptocurrency correlation coefficient matrix on Uniswap V3. It constructs a complex network model and investigates the time-varying topological properties and risk contagion characteristics of the Uniswap V3 cryptocurrency network. Some eigenvalues of the correlation matrix for Uniswap V3 cryptocurrency yield fall within the random matrix theory’s prediction interval, indicating the presence of random noise. The strength of the connection relationship within the Uniswap V3 cryptocurrency network varies at different thresholds and sliding windows. As the threshold increases, the cryptocurrency network becomes increasingly sparse, and the average degree and average clustering coefficient gradually decrease, while the heterogeneity becomes more pronounced. Moreover, the characteristics of the Uniswap V3 cryptocurrency network’s topological indicators exhibit time-varying behavior, which appears more stable when the threshold is small. WETH (Wrapped Ether), the most prevalent cryptocurrency in Ethereum’s ecosystem, shows the strongest influence on other cryptocurrencies on Uniswap V3 and emerges as the primary risk propagation vector. For both financial regulators and investors, it is imperative to closely monitor cryptocurrencies with significant market influence, such as WETH; remain vigilant against systemic risks; and prevent substantial losses. Further research could explore the network topology properties of multiple decentralized exchanges, such as SushiSwap and Curve, and analyze risk contagion processes across different cryptocurrency markets and traditional financial markets.

Author Contributions

Writing—original draft preparation, X.F.; writing—review and editing, M.Y. and T.Y.; data collection, T.Y.; analysis, X.F.; investigation, M.Y.; supervision, C.J.T.; project administration, J.L. All authors have read and agreed to the published version of the manuscript.

Funding

This research was funded by the Humanities and Social Sciences Research Project of the Chinese Ministry of Education, grant number 24XJA790005.

Data Availability Statement

The data can be obtained from the The Graph website.

Conflicts of Interest

The authors declare no conflicts of interest.

References

  1. Wüst, K.; Gervais, A. Do you need a blockchain? In Proceedings of the 2018 Crypto Valley Conference on Blockchain Technology (CVCBT), Zug, Switzerland, 20–22 June 2018; Institute of Electrical and Electronics Engineers—IEEE: New York, NY, USA, 2018; pp. 1–10. [Google Scholar]
  2. Ankenbrand, T.; Bieri, D. Assessment of cryptocurrencies as an asset class by their characteristics. Invest. Manag. Financ. Innov. 2018, 15, 169–181. [Google Scholar] [CrossRef]
  3. Aigner, A.A.; Dhaliwal, G. Uniswap: Impermanent loss and risk profile of a liquidity provider. arXiv 2021, arXiv:2106.14404. [Google Scholar] [CrossRef]
  4. Asef, M.A.; Bamakan, S.M.H. From x* y= k to Uniswap Hooks: A Comparative Review of Decentralized Exchanges (DEX). arXiv 2024, arXiv:2410.10162. [Google Scholar]
  5. Heimbach, L.; Schertenleib, E.; Wattenhofer, R. Risks and Returns of Uniswap V3 Liquidity Providers. In Proceedings of the 4th ACM Conference on Advances in Financial Technologies, Cambridge, MA, USA, 19–21 September 2022; pp. 89–101. [Google Scholar]
  6. Lo, Y.C.; Medda, F. Uniswap and the Emergence of the Decentralized Exchange. J. Financ. Mark. Infrastructures 2021, 10, 1–25. [Google Scholar]
  7. Xia, P.; Wang, H.; Gao, B.; Su, W.; Yu, Z.; Luo, X.; Zhang, C.; Xiao, X.; Xu, G. Trade or Trick? Detecting and Characterizing Scam Tokens on Uniswap Decentralized Exchange. ACM Sigmetrics Perform. Eval. Rev. 2022, 50, 23–24. [Google Scholar] [CrossRef]
  8. Nguyen, A.P.N.; Mai, T.T.; Bezbradica, M.; Crane, M. The cryptocurrency market in transition before and after COVID-19: An opportunity for investors? Entropy 2022, 24, 1317. [Google Scholar] [CrossRef]
  9. Song, W.; Zhang, W.; Wang, J.; Zhai, L.; Jiang, P.; Huang, S.; Li, B. Blockchain data analysis from the perspective of complex networks: Overview. Tsinghua Sci. Technol. 2022, 28, 176–206. [Google Scholar] [CrossRef]
  10. Jing, R.; Rocha, L.E. A network-based strategy of price correlations for optimal cryptocurrency portfolios. Financ. Res. Lett. 2023, 58, 104503. [Google Scholar] [CrossRef]
  11. Yan, T.; Tessone, C.J. Network Analysis of Uniswap: Centralization and Fragility in the Decentralized Exchange Market. arXiv 2025, arXiv:2503.07834. [Google Scholar]
  12. Campajola, C.; Cristodaro, R.; De Collibus, F.M.; Yan, T.; Vallarano, N.; Tessone, C.J. The evolution of centralisation on cryptocurrency platforms. arXiv 2022, arXiv:2206.05081. [Google Scholar]
  13. Lin, J.H.; Marchese, E.; Tessone, C.J.; Squartini, T. The weighted bitcoin lightning network. Chaos Solitons Fractals 2022, 164, 112620. [Google Scholar] [CrossRef]
  14. Bovet, A.; Campajola, C.; Mottes, F.; Restocchi, V.; Vallarano, N.; Squartini, T.; Tessone, C.J. The evolving liaisons between the transaction networks of Bitcoin and its price dynamics. In Proceedings of the Blockchain Kaigi 2022 (BCK22), Sendai, Japan, 4–5 August 2022; p. 011002. [Google Scholar]
  15. Serena, L.; Ferretti, S.; D’Angelo, G. Cryptocurrencies activity as a complex network: Analysis of transactions graphs. Peer- Netw. Appl. 2022, 15, 839–853. [Google Scholar] [CrossRef]
  16. Qiao, X.; Zhu, H.; Tang, Y.; Peng, C. Time-frequency extreme risk spillover network of cryptocurrency coins, DeFi tokens and NFTs. Financ. Res. Lett. 2023, 51, 103489. [Google Scholar] [CrossRef]
  17. Yan, T.; Shang, Q.; Zhang, Y.; Tessone, C.J. Optimizing Arbitrage Strategies on Uniswap: The Impact of Trading Path Length on Profitability and Opportunity Frequency. In Proceedings of the Blockchain Kaigi 2023 (BCK23), Kobe, Japan, 28–29 October 2023; p. 011007. [Google Scholar]
  18. Ho, K.H.; Chiu, W.H.; Li, C. A network analysis of the cryptocurrency market. In Proceedings of the 2020 IEEE Symposium Series on Computational Intelligence (SSCI), Canberra, Australia, 1–4 December 2020; pp. 2178–2185. [Google Scholar]
  19. Mardan, M.; Khosravipour, I. Dynamic Evolution Analysis of Cryptocurrency Market: A Network Science Study. J. Interdiscip. Econ. 2024, 22, 02601079241265744. [Google Scholar] [CrossRef]
  20. Vidal-Tomás, D. Transitions in the cryptocurrency market during the COVID-19 pandemic: A network analysis. Financ. Res. Lett. 2021, 43, 101981. [Google Scholar] [CrossRef]
  21. Pagnottoni, P.; Famà, A.; Kim, J.M. Financial networks of cryptocurrency prices in time-frequency domains. Qual. Quant. 2024, 58, 1389–1407. [Google Scholar] [CrossRef]
  22. Chaudhari, H.; Crane, M. Cross-correlation dynamics and community structures of cryptocurrencies. J. Comput. Sci. 2020, 44, 101130. [Google Scholar] [CrossRef]
  23. Giudici, P.; Polinesi, G. Crypto price discovery through correlation networks. Ann. Oper. Res. 2021, 299, 443–457. [Google Scholar] [CrossRef]
  24. Soloviev, V.N.; Yevtushenko, S.P.; Batareyev, V.V. Comparative analysis of the cryptocurrency and the stock markets using the Random Matrix Theory. In Proceedings of the Computer Science & Software Engineering: Proceedings of the 2nd Student Workshop (CS&SE@ SW 2019), Kryvyi Rih, Ukraine, 29 November 2019; CEUR Workshop Proceedings. pp. 87–100. [Google Scholar]
  25. Tian, J.; Zhao, K. Optimal selection of financial risk investment portfolio based on random matrix method. J. Comput. Methods Sci. Eng. 2020, 20, 859–868. [Google Scholar] [CrossRef]
  26. Laloux, L.; Cizeau, P.; Bouchaud, J.P.; Potters, M. Noise dressing of financial correlation matrices. Sci. Financ. (CFM) Work. Pap. Arch. 1998, 83, 1467. [Google Scholar] [CrossRef]
  27. Chakraborti, A.; Sharma, K.; Pharasi, H.K.; Bakar, K.S.; Das, S.; Seligman, T.H. Emerging spectra characterization of catastrophic instabilities in complex systems. New J. Phys. 2020, 22, 063043. [Google Scholar] [CrossRef]
  28. Jalili, A.; Sabri, H.; Ahmadian, D.; Saleki, Z.; Luo, Y.A.; Chen, A.X. Spectral fluctuations in financial systems: An integrated random matrix theory and machine learning perspective. Eur. Phys. J. Plus 2024, 139, 980. [Google Scholar] [CrossRef]
  29. Potters, M.; Bouchaud, J.P. A First Course in Random Matrix Theory: For Physicists, Engineers and Data Scientists; Cambridge University Press: Cambridge, UK, 2020. [Google Scholar]
  30. Tang, Y.; Xiong, J.; Cheng, Z.; Zhuang, Y.; Li, K.; Xie, J.; Zhang, Y. Looking into the Market Behaviors through the Lens of Correlations and Eigenvalues: An Investigation on the Chinese and US Markets Using RMT. Entropy 2023, 25, 1460. [Google Scholar] [CrossRef]
  31. Kwapień, J.; Drożdż, S.; Oświe¸cimka, P. The bulk of the stock market correlation matrix is not pure noise. Phys. A Stat. Mech. Its Appl. 2005, 359, 589–606. [Google Scholar] [CrossRef]
  32. Sharifi, S.; Crane, M.; Shamaie, A.; Ruskin, H. Random matrix theory for portfolio optimization: A stability approach. Phys. A Stat. Mech. Its Appl. 2004, 335, 629–643. [Google Scholar] [CrossRef]
  33. Plerou, V.; Gopikrishnan, P.; Rosenow, B.; Amaral, L.A.N.; Guhr, T.; Stanley, H.E. Random matrix approach to cross correlations in financial data. Phys. Rev. E 2002, 65, 066126. [Google Scholar] [CrossRef]
  34. Mantegna, R.N. Hierarchical structure in financial markets. Eur. Phys. J. B-Condens. Matter Complex Syst. 1999, 11, 193–197. [Google Scholar] [CrossRef]
  35. Tumminello, M.; Aste, T.; Di Matteo, T.; Mantegna, R.N. A tool for filtering information in complex systems. Proc. Natl. Acad. Sci. USA 2005, 102, 10421–10426. [Google Scholar] [CrossRef]
  36. Boccaletti, S.; Latora, V.; Moreno, Y.; Chavez, M.; Hwang, D.U. Complex Networks: Structure and Dynamics. Complex Syst. Complex. Sci. 2006, 424, 175–308. [Google Scholar] [CrossRef]
  37. Pastor-Satorras, R.; Rubi, M.; Diaz-Guilera, A. Statistical Mechanics of Complex Networks; Springer Science & Business Media: Berlin/Heidelberg, Germany, 2003; Volume 625. [Google Scholar]
  38. Newman, M.E. Assortative mixing in networks. Phys. Rev. Lett. 2002, 89, 208701. [Google Scholar] [CrossRef]
  39. Chi, X.; Jue, H.; Gang-jin, W. Study on Topological Property of Stock Market’s Network Based on Random Matric Method. Oper. Res. Manag. Sci. 2018, 27, 144. [Google Scholar]
Figure 1. Sliding window processing.
Electronics 14 02444 g001
Figure 2. Comparison of eigenvalues of different correlation coefficient matrices within different sliding windows.
Electronics 14 02444 g002
Figure 3. Number of cryptocurrencies and average correlation coefficients within different sliding windows.
Electronics 14 02444 g003
Figure 4. Uniswap V3 network topology with different thresholds under four different sliding windows.
Electronics 14 02444 g004
Figure 5. (a) Average degree, (b) average clustering coefficient, and (c) assortativity coefficient of Uniswap V3 token correlation networks under different thresholds θ over time.
Electronics 14 02444 g005
Figure 6. The impact strength of “long-lived coins” on cryptocurrency networks under various thresholds within distinct sliding windows.
Electronics 14 02444 g006
Table 1. Notation table of key variables.
SymbolDefinitionSymbolDefinition
r i ( t ) Natural logarithmic return of cryptocurrency yield λ Random matrix’s predicted eigenvalue spectrum
ρ i , j Correlation coefficient between cryptocurrenciesPEigenvector matrix of correlation coefficients
CCorrelation coefficient matrix of cryptocurrency yields Λ Eigenvalue matrix of correlation coefficients
RRandom linear correlation matrixDAdjacency matrix constructed by threshold method
NNumber of cryptocurrenciesEActual number of edges in the network
ARandom matrix A C Average clustering coefficient
LLength of cryptocurrenciesrAssortativity coefficient (degree correlation)
Table 2. The average impact strength of “long-lived coins” at various thresholds.
Long-Lived Coins θ = 0.3 θ = 0.4 θ = 0.5 θ = 0.6
WETH0.6110.5900.5490.488
WBTC0.5610.5360.4860.408
MATIC0.5430.5170.4650.369
LINK0.5260.4990.4390.342
UNI0.5190.4860.4230.330
SHIB0.4210.3620.2960.184
MKR0.4100.3620.2850.187
Disclaimer/Publisher’s Note: The statements, opinions and data contained in all publications are solely those of the individual author(s) and contributor(s) and not of MDPI and/or the editor(s). MDPI and/or the editor(s) disclaim responsibility for any injury to people or property resulting from any ideas, methods, instructions or products referred to in the content.

