Article

Feature Decoupling-Guided Annotation Framework for Surface Defects on Steel Strips

Institute of Visual Inspection Technology, Shenyang University of Technology, Shenyang 110870, China
*
Author to whom correspondence should be addressed.
Electronics 2025, 14(11), 2304; https://doi.org/10.3390/electronics14112304
Submission received: 16 April 2025 / Revised: 28 May 2025 / Accepted: 2 June 2025 / Published: 5 June 2025

Abstract

Surface defect detection on steel strips is a critical step in quality control for industrial products. While existing research has made some progress in optimizing annotation strategies and improving efficiency, issues such as feature aliasing during the annotation process, the insufficient utilization of boundary information, and the inaccurate representation of complex defect patterns remain inadequately addressed. To tackle these challenges, this paper proposes an annotation optimization framework from the perspective of feature analysis. The framework decomposes defect features into geometric features and grayscale distribution features and, based on feature decoupling theory, classifies defects into three typical patterns: block, linear, and textured defects. For each pattern, the minimum annotation units that preserved essential features were designed, enabling the standardized representation of complex defects and precise boundary localization. Experiments on the NEU-DET dataset showed that this annotation framework improves the average mAP of six mainstream detection models by 4.9 percentage points, validating its effectiveness in enhancing the detection performance. Additionally, this paper introduces an Efficiency–Cost Ratio (ECR) evaluation metric to quantify the relationship between the annotation cost and performance improvement. The study found that block and linear defect detection achieved optimal performance with only 50% annotation effort. This research not only improved the performance of defect detection models but also quantified the annotation resource utilization efficiency, providing robust theoretical support and practical guidance for efficient defect detection in complex industrial scenarios.

1. Introduction

Strip steel, as an important material in industrial production, has attracted much attention due to its wide range of applications and significant demand [1]. During the production process, various defects may appear on the surface of steel strips due to the influence of various factors such as raw materials, equipment, and processes. These defects directly affect the quality and performance of the final product [2]. Therefore, the efficient and accurate detection of these defects is crucial for ensuring product quality. In recent years, machine vision detection methods based on deep learning have gradually replaced traditional visual inspection methods in online detection scenarios due to advantages such as high accuracy and speed [3,4]. Although researchers have made great efforts in improving the algorithms of deep learning models [5,6,7,8], the model performance depends not only on the algorithm design, but also heavily on the availability of high-quality annotated data [9].
As the foundation for model training, the annotation quality has a direct impact on the model’s ability to identify defect features and the final detection performance [10]. Generally, annotations consist of bounding boxes and labels, providing models with spatial location information and information on the type of defects [11]. In observing and analyzing annotated instances of steel strip defects in public datasets, as shown in Figure 1, three main challenges exist: (a) Overlapping bounding boxes: overlaps among the bounding boxes of adjacent defect areas can cause feature confusion, affecting the model’s ability to recognize individual defects. (b) Uncertain annotation areas: when defects exhibit large irregular distributions, rectangular bounding boxes fail to accurately define the defect regions, which may result in them including excessive background information or missing key features. (c) Incomplete contour annotation: the edges of some defects are not fully annotated, leading to the loss of important morphological feature information, thereby impacting the model’s learning outcomes.
Similar observations have been made in other studies on surface defect detection. For example, Kumar et al. [12] analyzed annotated instances of surface defect data and found that due to the similarity in the defects’ appearances and inconsistent annotation strategies, category confusion and annotation inconsistencies frequently occurred within the same defect area. Regarding annotation inconsistencies, Guo et al. [13] developed annotation guidelines that clearly describe the morphological features and hierarchical structure of different defects, formulating explicit defect classification rules. Cui et al. [14] further analyzed the impact of annotation errors in the position and category on the model performance, discovering that positional annotation errors significantly reduce recall and precision, while category annotation errors have a relatively smaller impact. Moreover, the sensitivity of the detection accuracy to positional errors varies across different defect categories, highlighting the importance of annotation quality. To improve annotation accuracy, Guo et al. [15] proposed a polygon-based precise and enclosed annotation strategy to enhance standardization. Kim et al. [16] suggested splitting cracks into multiple independent units at connection points during crack defect annotation to ensure accuracy. However, Zhao et al. [17] held a contrary view, arguing that discrete annotation might compromise the integrity of defect features. They recommended connecting non-intersecting crack regions via morphological closure operations before unified annotation. This divergence in annotation strategies reflects differing trade-offs between the completeness and independence of defect features in manual annotation processes.
To further minimize subjective factors and the complexity of annotation, some studies have attempted to introduce guiding strategies or auxiliary tools. For instance, Tu et al. [18] proposed the EMBLEM method, which uses AI to identify the most likely problematic samples for manual validation and correction, thereby improving the annotation quality and optimizing the efficiency through human–machine collaboration. Building on this, Yang et al. [19] proposed a semi-automatic annotation framework (ALEAL) that initializes the classifier with a small amount of manual annotation and adopts diverse cost-effective query strategies (DCEQSs) to select high-confidence samples from unlabeled data for automated annotation, while also identifying information-rich samples for manual labeling. This framework significantly reduced the need for manual annotations by combining manual and automated annotation. Similarly, Yang et al. [20] designed a lightweight convolutional neural network (CNN) that uses a small amount of annotated data for initial model training and employs Kullback–Leibler (KL) divergence to evaluate the value of unlabeled samples, prioritizing high-value samples for annotation to iteratively optimize the model performance. This method achieved 97% classification accuracy for steel strip surface defects when annotating only 44% of the high-value samples, significantly reducing annotation costs. Another approach involves generative methods, which directly generate or generalize new samples using a small amount of annotated data. Ran et al. [21] proposed a GAN-based generation method that fully leverages defect edge and background texture information to generate high-quality defect images. This method significantly improved the performance of models on steel strip surface defect detection tasks with the use of minimal annotation data. Putri et al. [22], on the other hand, utilized a Transformer-based architecture to learn meta-features from large-scale foundational datasets, enabling efficient adaptation to new categories through rapid generalization. This method outperformed traditional baseline models on steel surface defect datasets, substantially reducing the reliance on costly annotated data.
Although these studies have made progress in optimizing annotation strategies, it is evident that the effectiveness of these methods fundamentally depends on the annotation accuracy. Regardless of the sample size, the annotation quality remains a critical factor affecting the detection performance. In the field of steel strip surface defect detection, issues such as feature blending, the insufficient utilization of boundary information, and the inaccurate representation of complex defect morphology have not been fully addressed in the existing research. Visual perception theory suggests that the human visual system processes complex visual information by decomposing it into basic feature dimensions, such as the grayscale intensity and geometric shape [23]. This insight led us to consider that the essence of annotation discrepancies lies in the fact that different annotators focus on different feature dimensions. Studies [24] indicate that analyzing defects’ grayscale features can offer new perspectives for developing deep learning detection methods.
Based on the above findings, this paper proposes a feature decoupling-guided annotation optimization framework. The framework utilizes feature decoupling theory as qualitative guidance and focuses on grayscale feature analysis as the core driver of annotation practice, formulating a systematic annotation strategy to enhance objectivity and consistency in annotation. The main contributions of this paper include the following:
(1)
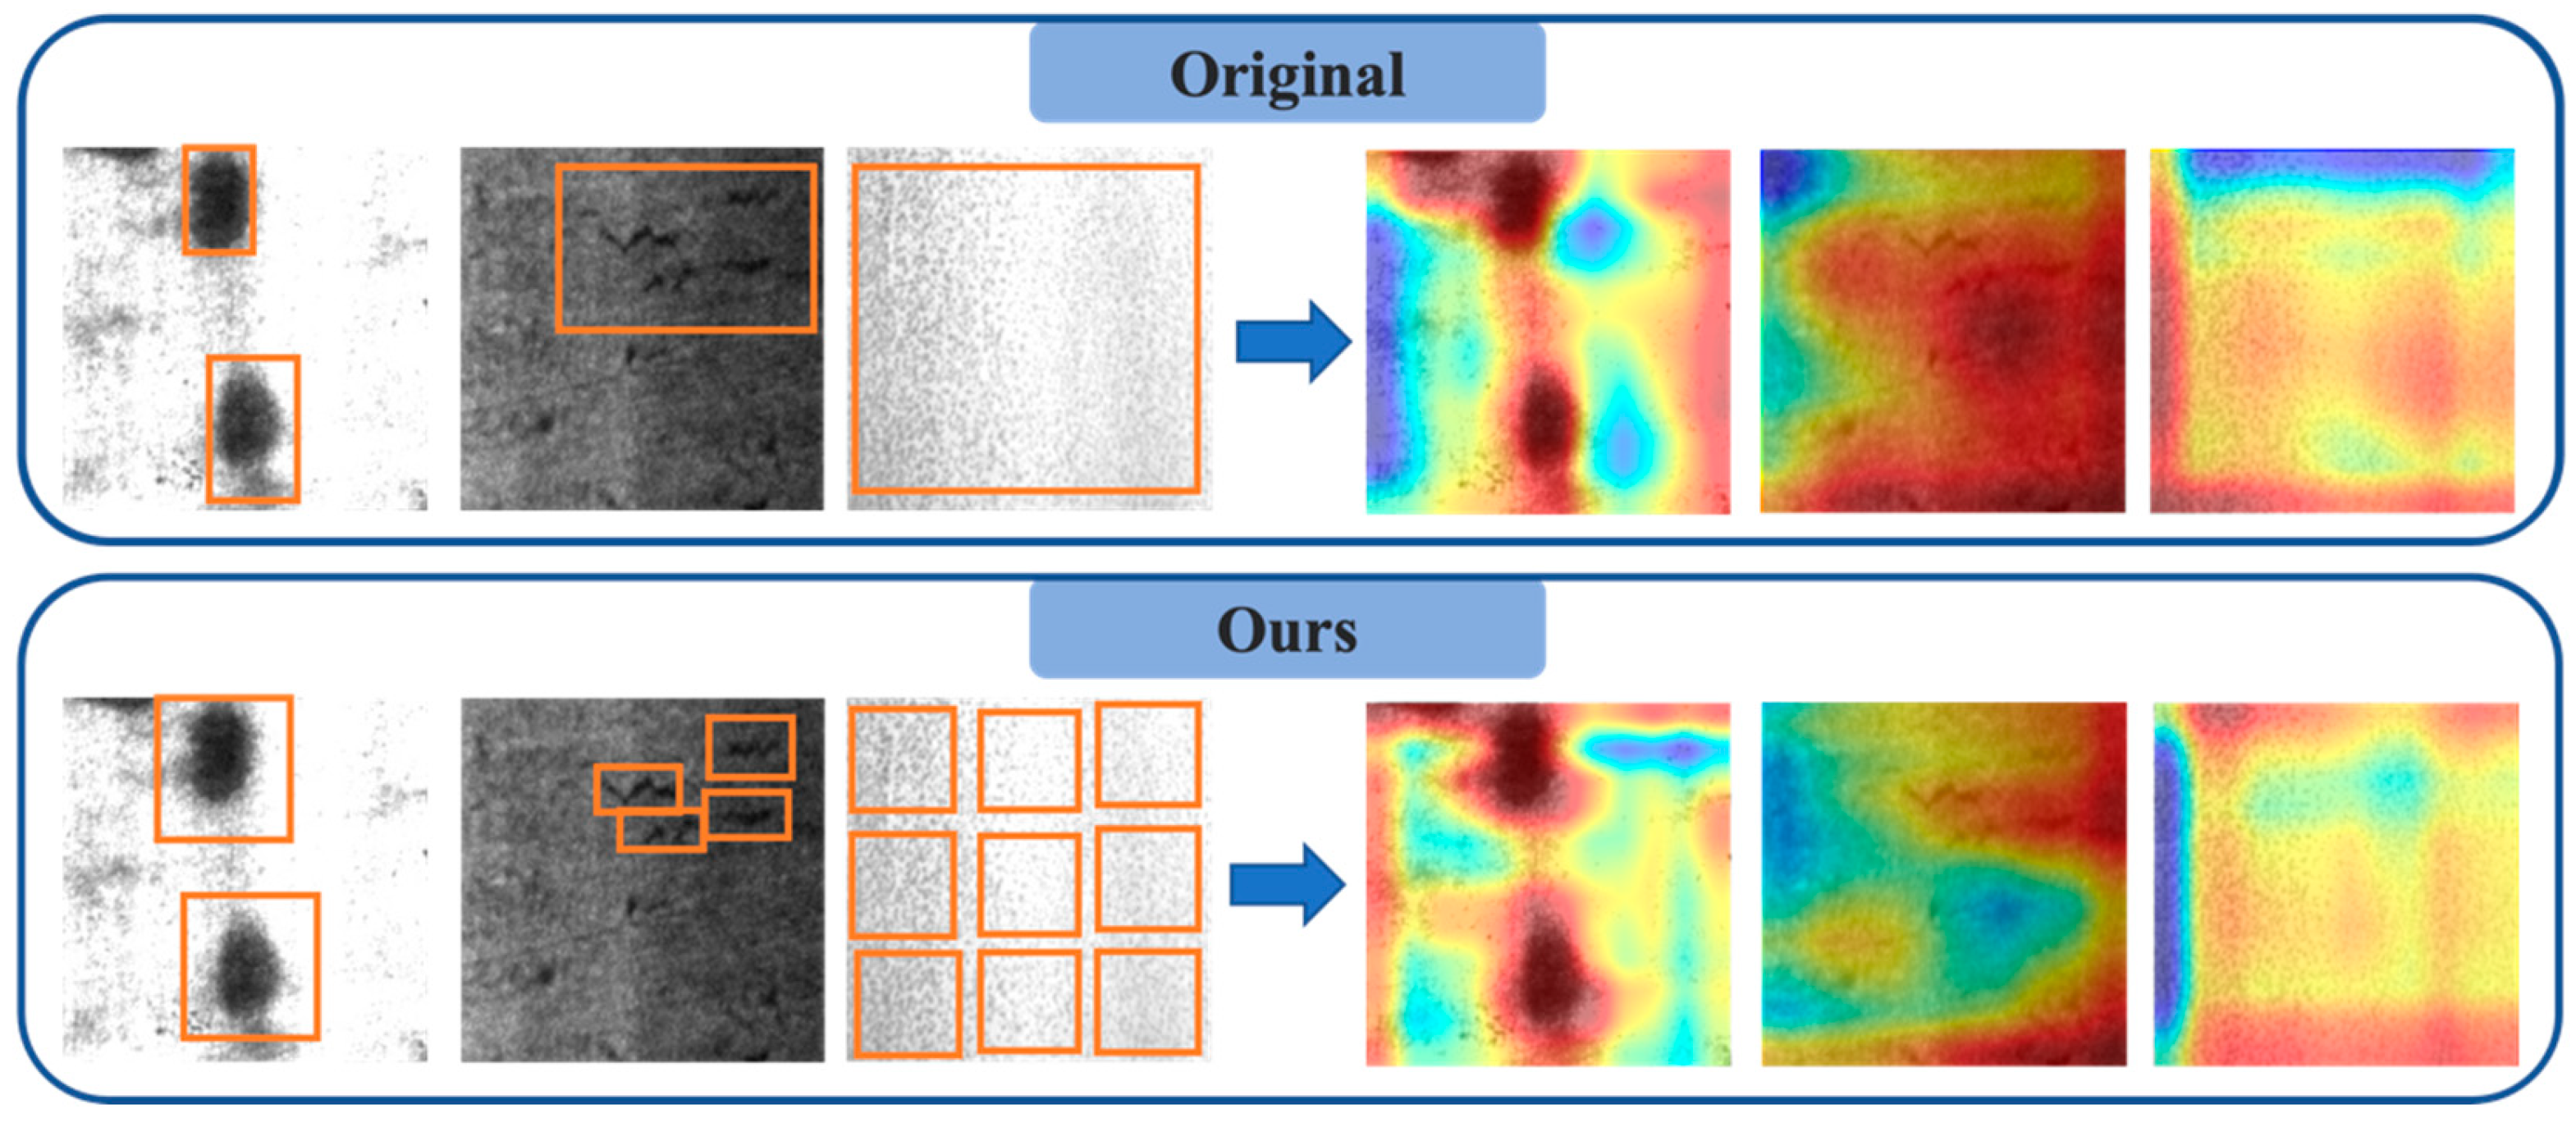
Proposing a feature decoupling-guided defect representation model: To address the issue of feature aliasing, this model systematically analyzes the grayscale distribution patterns of defects and integrates feature decoupling theory to categorize defects into three typical forms: block, linear, and textured defects. This systematic defect representation approach provides a new analytical perspective for defect annotation, enhances objectivity, and helps annotators better understand and annotate defect features with clarity.
(2)
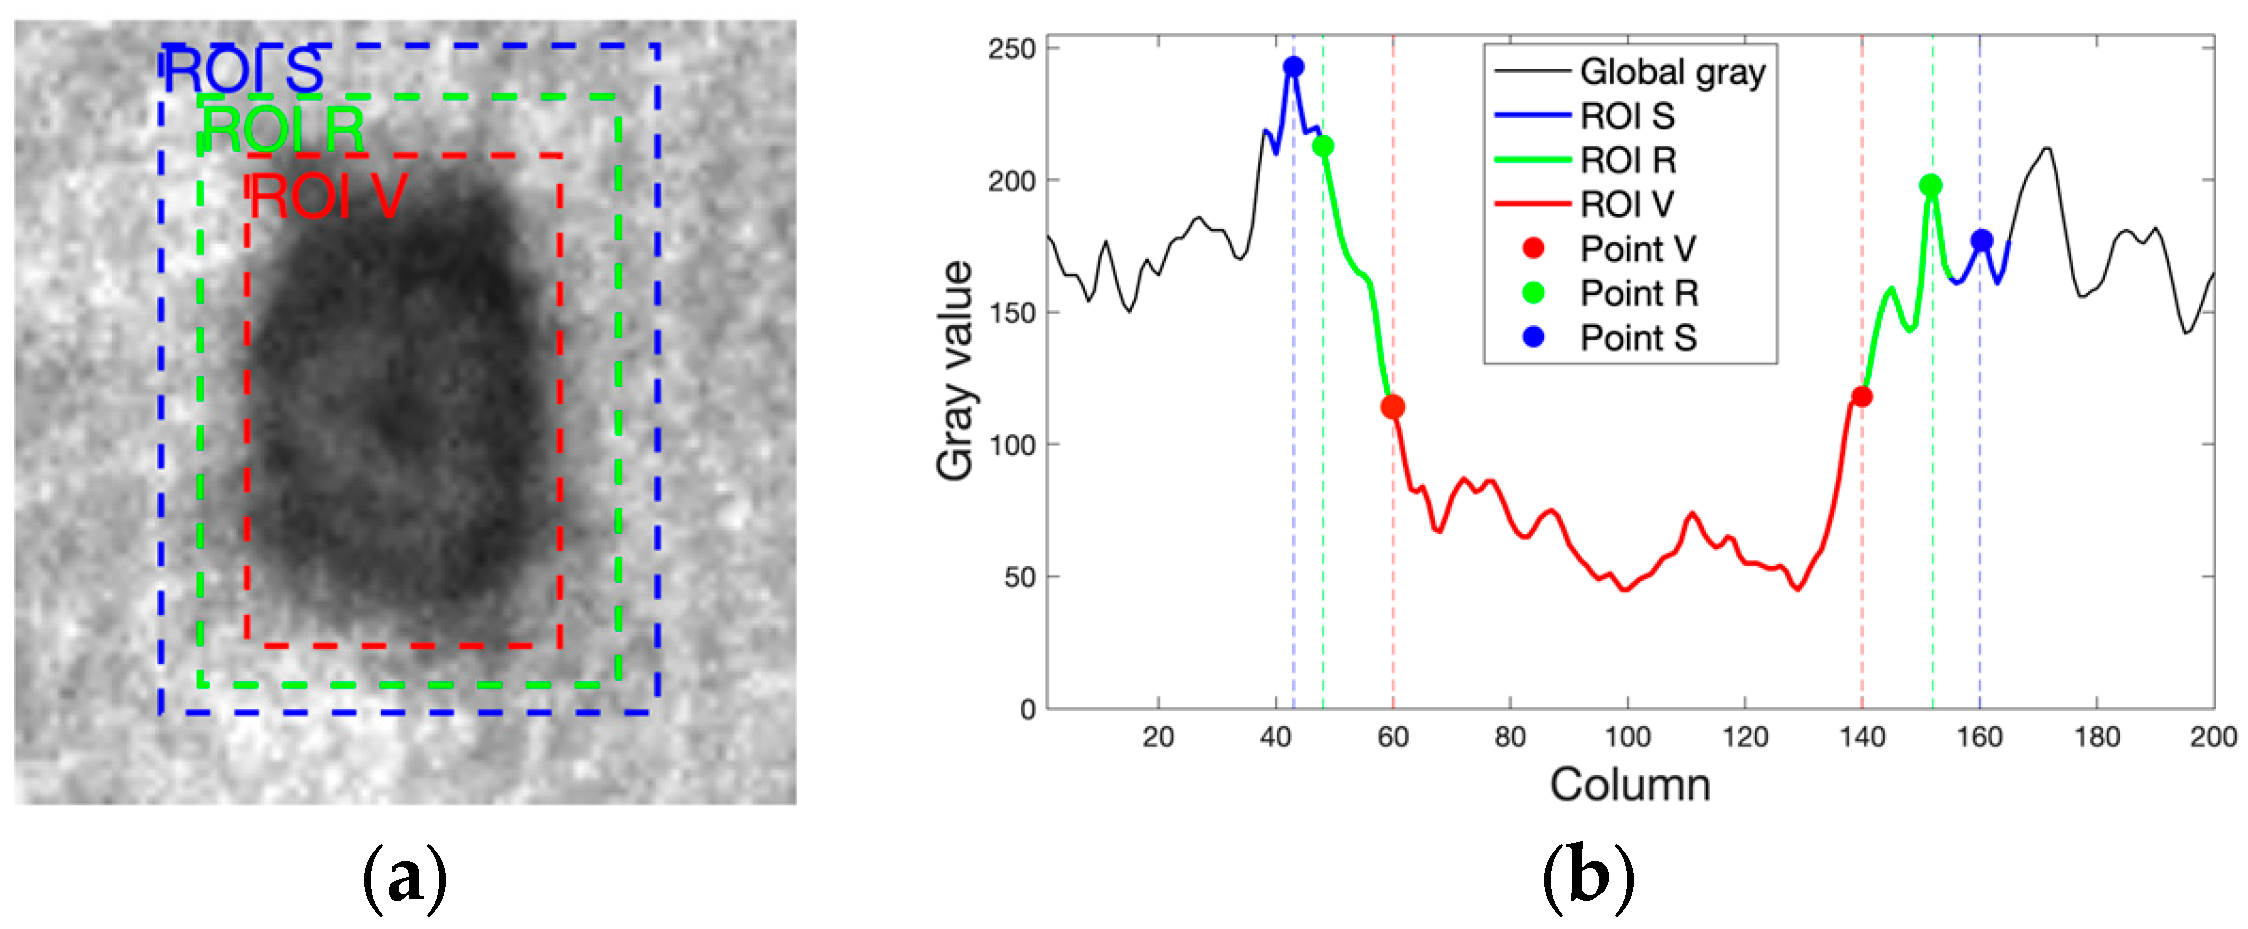
Developing a feature decoupling-guided annotation strategy: To tackle the issues of uncertain annotation areas and boundary ambiguity, this strategy constructs the minimum annotation units for different defect forms and designs boundary localization strategies based on their respective grayscale distribution patterns. This approach effectively mitigates feature aliasing problems and achieves more precise feature representation.
(3)
Establishing a systematic annotation framework: By integrating feature decoupling theory with grayscale distribution analysis, this framework formulates a comprehensive annotation methodology. Experimental results demonstrate that the framework provides systematic practical guidance for annotation, significantly improves the accuracy of feature representation, enhances the detection performance, and offers a practical reference for annotating complex defect scenarios.

2. Methodology

This paper proposes a feature decoupling-guided annotation optimization framework aimed at addressing common issues in defect annotation, such as feature ambiguity, boundary inconsistency, and annotation redundancy, thereby enhancing the accuracy of feature representation. The overall structure of the framework is illustrated in Figure 2 and consists of three key steps: First, guided by feature decoupling theory, the feature distribution patterns of defect images are analyzed, and defects are categorized into three modes, block, linear, and textured, providing a theoretical basis for the annotation strategy. Second, the minimum annotation units are defined for each mode; for instance, block defects are annotated as complete regions, linear defects are segmented for annotation, and textured defects are annotated using local windows. These minimum units serve as the basic building blocks for annotation, improving the annotation consistency. Finally, boundary localization strategies are formulated, integrating grayscale gradients and feature distribution characteristics to ensure the completeness and accuracy of the annotations. This framework achieves the end-to-end optimization of the annotation process, from feature categorization to the definition of annotation units, enhancing the standardization and interpretability of annotations. The following sections will discuss the theoretical foundations and implementation details of each component in greater depth.

2.1. Defect Representation Model Guided by Feature Decoupling

The grayscale distribution features of defects are their most basic visual expressions. Studies have shown that different visual features in defect images usually have different degrees of independence [25]. Feature decoupling theory employs Mutual Information (MI) to measure the statistical correlation between different features, mathematically expressed as [26]
I ( X ; Y ) = p ( x , y ) log p ( x , y ) p ( x ) p ( y ) d x d y
where X and Y represent different feature variables and p ( x , y ) is the joint probability distribution, while p ( x ) and p ( y ) are the marginal probability distributions. A smaller MI value suggests a weaker statistical dependency between the two variables.
This section introduces the concept of feature decoupling and uses MI as a qualitative analysis tool to examine defect features from the perspective of feature independence. First, a mathematical representation model for defect images is constructed. A defect image, I, can be formalized as a combination of the defect feature space F d and the background feature space F b :
I = F d F b
where signifies the operation of combining the feature spaces. In defect detection, the primary focus is on representing the defect feature space F d . Considering that the core objective of annotation is to accurately define defect areas and capture their essential characteristics, this paper emphasizes the use of the geometric and grayscale features that most significantly impact annotation. Thus, the defect feature space F d is represented as
F d = f g e o , f g r a y
where f g e o denotes the geometric feature space, describing spatial attributes like the shape, distribution, and structure of defects, while f g r a y refers to the grayscale feature space, describing the grayscale distribution and change pattern of the defect area.
Based on the above representation model, through morphological analysis and the grayscale distribution modeling of surface defects on steel strips, defects can be categorized into three typical patterns: block, linear, and textured defects. As shown in Figure 3, these different morphological types each show a clear grayscale distribution law and show different degrees of feature decoupling.
Block defects have a morphological structure characterized by regular shapes and aspect ratios in independent regions with clear background separation between adjacent defects. As shown in Figure 3b, their cross-sectional grayscale distribution shows a single concave distribution, and their overall grayscale distribution also displays a regular concave structure (as depicted in Figure 3c). This highly consistent feature distribution indicates significant independence between geometric and grayscale features.
I f g e o , f g r a y 0
The morphological structure of linear defects presents a slender structure extending or bending in a certain direction. Its feature decoupling exhibits notable scale-dependent characteristics. At the local scale, as shown in Figure 3b, the cross-sectional grayscale distribution presents a regular concave distribution, where geometric and grayscale features are essentially decoupled. However, on a global scale, directional changes lead to multiple local convex–concave variations forming a complex surface (as depicted in Figure 3c), creating a linkage between geometric and grayscale features. This scale dependence can be expressed as
I f g e o , f g r a y local   0
I f g e o , f g r a y global   > 0
The morphological structure of texture defects is manifested as a fuzzy boundary area formed by the dense distribution of multiple defects. As shown in Figure 3b, their cross-sectional grayscale distribution exhibits high-frequency irregular fluctuations, while their overall grayscale distribution manifests as a complex irregular surface (as shown in Figure 3c). This highly complex feature leads to strong coupling between geometric features and grayscale features.
I f g e o , f g r a y 0

2.2. Annotation Strategy Based on Minimum Units

The above analysis reveals that different types of defects exhibit varying degrees of decoupling in their geometric and grayscale features. This understanding offers new insights into ways of addressing the issues of feature ambiguity and annotation redundancy in defect labeling. For instance, the same defect might be divided into a different number of areas by various annotators, leading to subjective differences in boundary localization, especially noticeable in complex-shaped defects. To address this, this section establishes a representation model for minimum annotation units based on the feature decoupling results and grayscale distribution characteristics, using these as the basic unit of annotation to enhance the annotation consistency and effectiveness.
For block defects, given their global grayscale distribution showing a single concave pattern and high-feature-decoupling characteristics, the minimum unit is defined as an independent, complete region with clear boundaries:
Block m i n = { D ( x , y ) C ( D ) , A ( D ) , B ( D ) }
where C ( D ) represents the contrast between defect area D and the background, A ( D ) denotes the area of the defect, and B ( D ) indicates a recognizable closed boundary. This definition ensures that the minimum unit of a block defect can include complete morphological features while effectively distinguishing the defect from the background in actual images.
For linear defects, the definition of minimum units must account for their scale-dependent characteristics. Due to directional variations, their global grayscale distribution shows complex patterns. Based on this local–global feature disparity, regions with similar concave grayscale distributions can be defined as minimum units. For lines with minimal directional changes, complete regions with concave grayscale distributions serve as minimum units. For lines with significant directional changes, line segments with similar local grayscale patterns are defined as minimum units:
Line min   = L ( s ) L ( s ) S stable
where S stable represents segments of lines with stable directional changes. This representation applies to both lines with insignificant directional changes and those with complex directional variations.
Texture defects manifest as densely distributed structures with fuzzy individual boundaries and minimal background separation, showing irregular grayscale distributions. Analysis has revealed that compared to their global patterns, the grayscale variations at local scales tend to follow more regular patterns, while the global grayscale patterns become more complex due to the accumulation of local variations. Based on this scale-dependent characteristic, we propose using local windows as minimum units for texture defects:
Texture m i n = { W ( x , y ) W T }
where W denotes the local window and T represents the complete textured defect area. This definition achieves feature preservation while reducing the representation complexity.
It is important to note that the focus of this study was to validate the feasibility of the feature decoupling-guided annotation strategy. Therefore, the definition of the minimum annotation units was based on the practical needs and experience of manual annotation, without the strict quantification of specific dimensions.
The definition of the minimum units establishes the basic objects for annotation, but transforming theoretical definitions into practical annotation strategies requires the determination of precise boundary positioning within the image space. Since different defect types exhibit varying degrees of feature decoupling, their boundary box localization strategies must be adjusted accordingly.
For block and linear defects, which have distinct boundary features, the key challenge lies in determining the optimal position for the annotation boundaries. From the perspective of maintaining the integrity of the feature space, three critical boundary positions can be defined:
P o i n t v = ( x , y ) I ( x , y ) n = m a x
P o i n t R = ( x , y ) 2 I ( x , y ) n 2 = 0
Point s = ( x , y ) ( x , y ) = P o i n t R + λ n
where P o i n t v represents the edge perceived by human vision, corresponding to the location of the maximum grayscale gradient. P o i n t R indicates the true feature edge, corresponding to the location where the second derivative of the grayscale is zero. P o i n t s is the recommended annotation position, ensuring feature integrity by extending in the boundary’s normal direction n with an expansion coefficient, λ.
As shown in Figure 4, if the bounding box is positioned at P o i n t v , it might lead to the incomplete representation of the defect feature space because the full grayscale features of the defect actually extend to P o i n t R . To ensure the complete coverage of the defect’s grayscale features while considering practical feasibility, it is advisable to extend the bounding box boundary to P o i n t s . However, extending the annotation box could introduce feature interference, manifesting in the following ways: The bounding box may include excessive background areas, potentially including irrelevant grayscale information. The features of adjacent defects might overlap, affecting the accuracy of feature extraction. Multiple defect targets could be contained within one annotation box, leading to unclear feature expression. In this study, the expansion coefficient λ was flexibly adjusted based on manual annotation experience, aiming to strike a balance between feature integrity and interference control. The experimental results show that the flexible adjustment of λ during the annotation process enabled the reasonable expansion of the annotation boxes, ensuring the complete representation of defect features while minimizing the background interference and feature overlap.
For textured defects, due to their high feature coupling and blurred boundaries, traditional gradient-based boundary localization methods are unsuitable. Given their relatively lower local feature complexity, annotation boxes should encompass areas with a consistent feature distribution. Since texture defect boundaries typically present gradual transitions, the boxes should include complete textured regions, even if this incorporates some of the background area. As demonstrated in Figure 5, this minimum unit-based strategy achieves more focused and distinct feature representation across defect patterns.

2.3. Annotation Framework Based on Feature Decoupling

This section establishes an annotation strategy framework for different types of defects. The framework is based on the degree of feature decoupling as the theoretical basis, takes the minimum unit as the annotation unit, and ensures that the defect features are expressed in a standardized manner using a systematic annotation strategy.
For block defects, given their high degree of feature decoupling, the annotation strategy emphasizes feature independence and completeness. The strategy includes the following requirements: (a) Each bounding box should contain only one independent target to ensure feature regularity and avoid feature aliasing. (b) The bounding box should extend beyond the visual edge to include the grayscale transition points, fully capturing the concave grayscale distribution features of the defect. (c) The proportion of the background area within the bounding box should be controlled to avoid introducing redundant background interference.
For linear defects, based on their scale-dependent characteristics, annotation focuses on directional variation properties. The strategy is as follows: (a) For directionally stable linear defects, use a single bounding box containing only one independent target and include complete endpoint features. (b) For defects with significant directional changes, employ a segmented annotation strategy where each segment contains a defect with a locally consistent direction. Each bounding box should fully encompass the width of its corresponding directionally consistent segment. (c) For parallel lines with spacing less than the size of the feature transition zone, apply holistic annotation to maintain feature continuity.
For textured defects, considering their strong feature coupling characteristics, annotation emphasizes statistical representation rather than precise boundaries. The strategy focuses on the following: (a) ensuring a relatively consistent texture feature distribution within the selected area, allowing for flexible window scaling; (b) given the wide-ranging distribution characteristics of texture defects, employing multi-point sampling to increase the sample diversity and enhance the model’s adaptability to different texture patterns.

3. Experiments and Results

3.1. Dataset

The NEU-DET dataset is a standardized and high-quality dataset for surface defects on hot-rolled steel strips [27], featuring six typical defect types: Crazing (Cr), Inclusions (In), Patches (Pa), Pitted Surfaces (Ps), Rolled-in Scale defects (Rs), and Scratches (Sc). Each defect type appears in 300 grayscale images at a resolution of 200 × 200 pixels, totaling 1800 images. The dataset was randomly divided into three parts while maintaining the class balance: 80% for training, 10% for validation, and 10% for testing.
As shown in Table 1, the annotation strategy based on feature decoupling increased the total number of bounding boxes in the dataset from an original count of 4108 to 11,803, achieving an increase of 187.3%. The most significant growth was observed in the defect types Rs and Ps. For Rs, decomposing the combined annotations into independent units led to a 476.8% increase in the bounding box count. For Ps, the discretization of the feature space was achieved using the localized windowing strategy, and the number of bounding boxes increased by 430.0%. In contrast, for Pas, as sparsely distributed block defects, independent annotations had already primarily been used, causing only a slight increase to 1054 bounding boxes. The number of bounding boxes for directionally stable linear defects like In and Sc saw moderate growth through independent annotation optimization, with increases of 48.1% and 73.9%, respectively. Figure 6 shows a comparison of the annotation effects for the six defect types, showing how this feature decoupling-guided strategy provides more fine-grained defect representation while maintaining feature integrity.

3.2. Implementation Details

The experiments were conducted using Python 3.8 and PyTorch 1.7.1 on an Ubuntu 18.04 system equipped with an RTX 3090 GPU (24 GB). The training parameters and data augmentation strategies are detailed in Table 2.

3.3. Evaluation Metrics

The experiments illustrated changes in the model detection performance achieved by plotting PR curves, calculated using the precision (P) and recall (R) [28]. For evaluating the overall detection performance of the model, the mean Average Precision (mAP), widely used in object detection tasks as defined in the PASCAL VOC challenge, was adopted as the core metric [29]. The evaluation metrics were defined as follows:
m A P = i = 0 n   A P i n
A P = 1 11 R [ 0,0.1 , , 1 ]   m a x R R   P R
Precision   = T P T P + F P
Recall   = T P T P + F N
where AP stands for the average accuracy, TP represents the positive cases successfully predicted by the model, FP represents the negative cases wrongly predicted as positives by the model, FN refers to the positive cases wrongly predicted as negatives by the model, and n denotes the total number of model prediction classes.

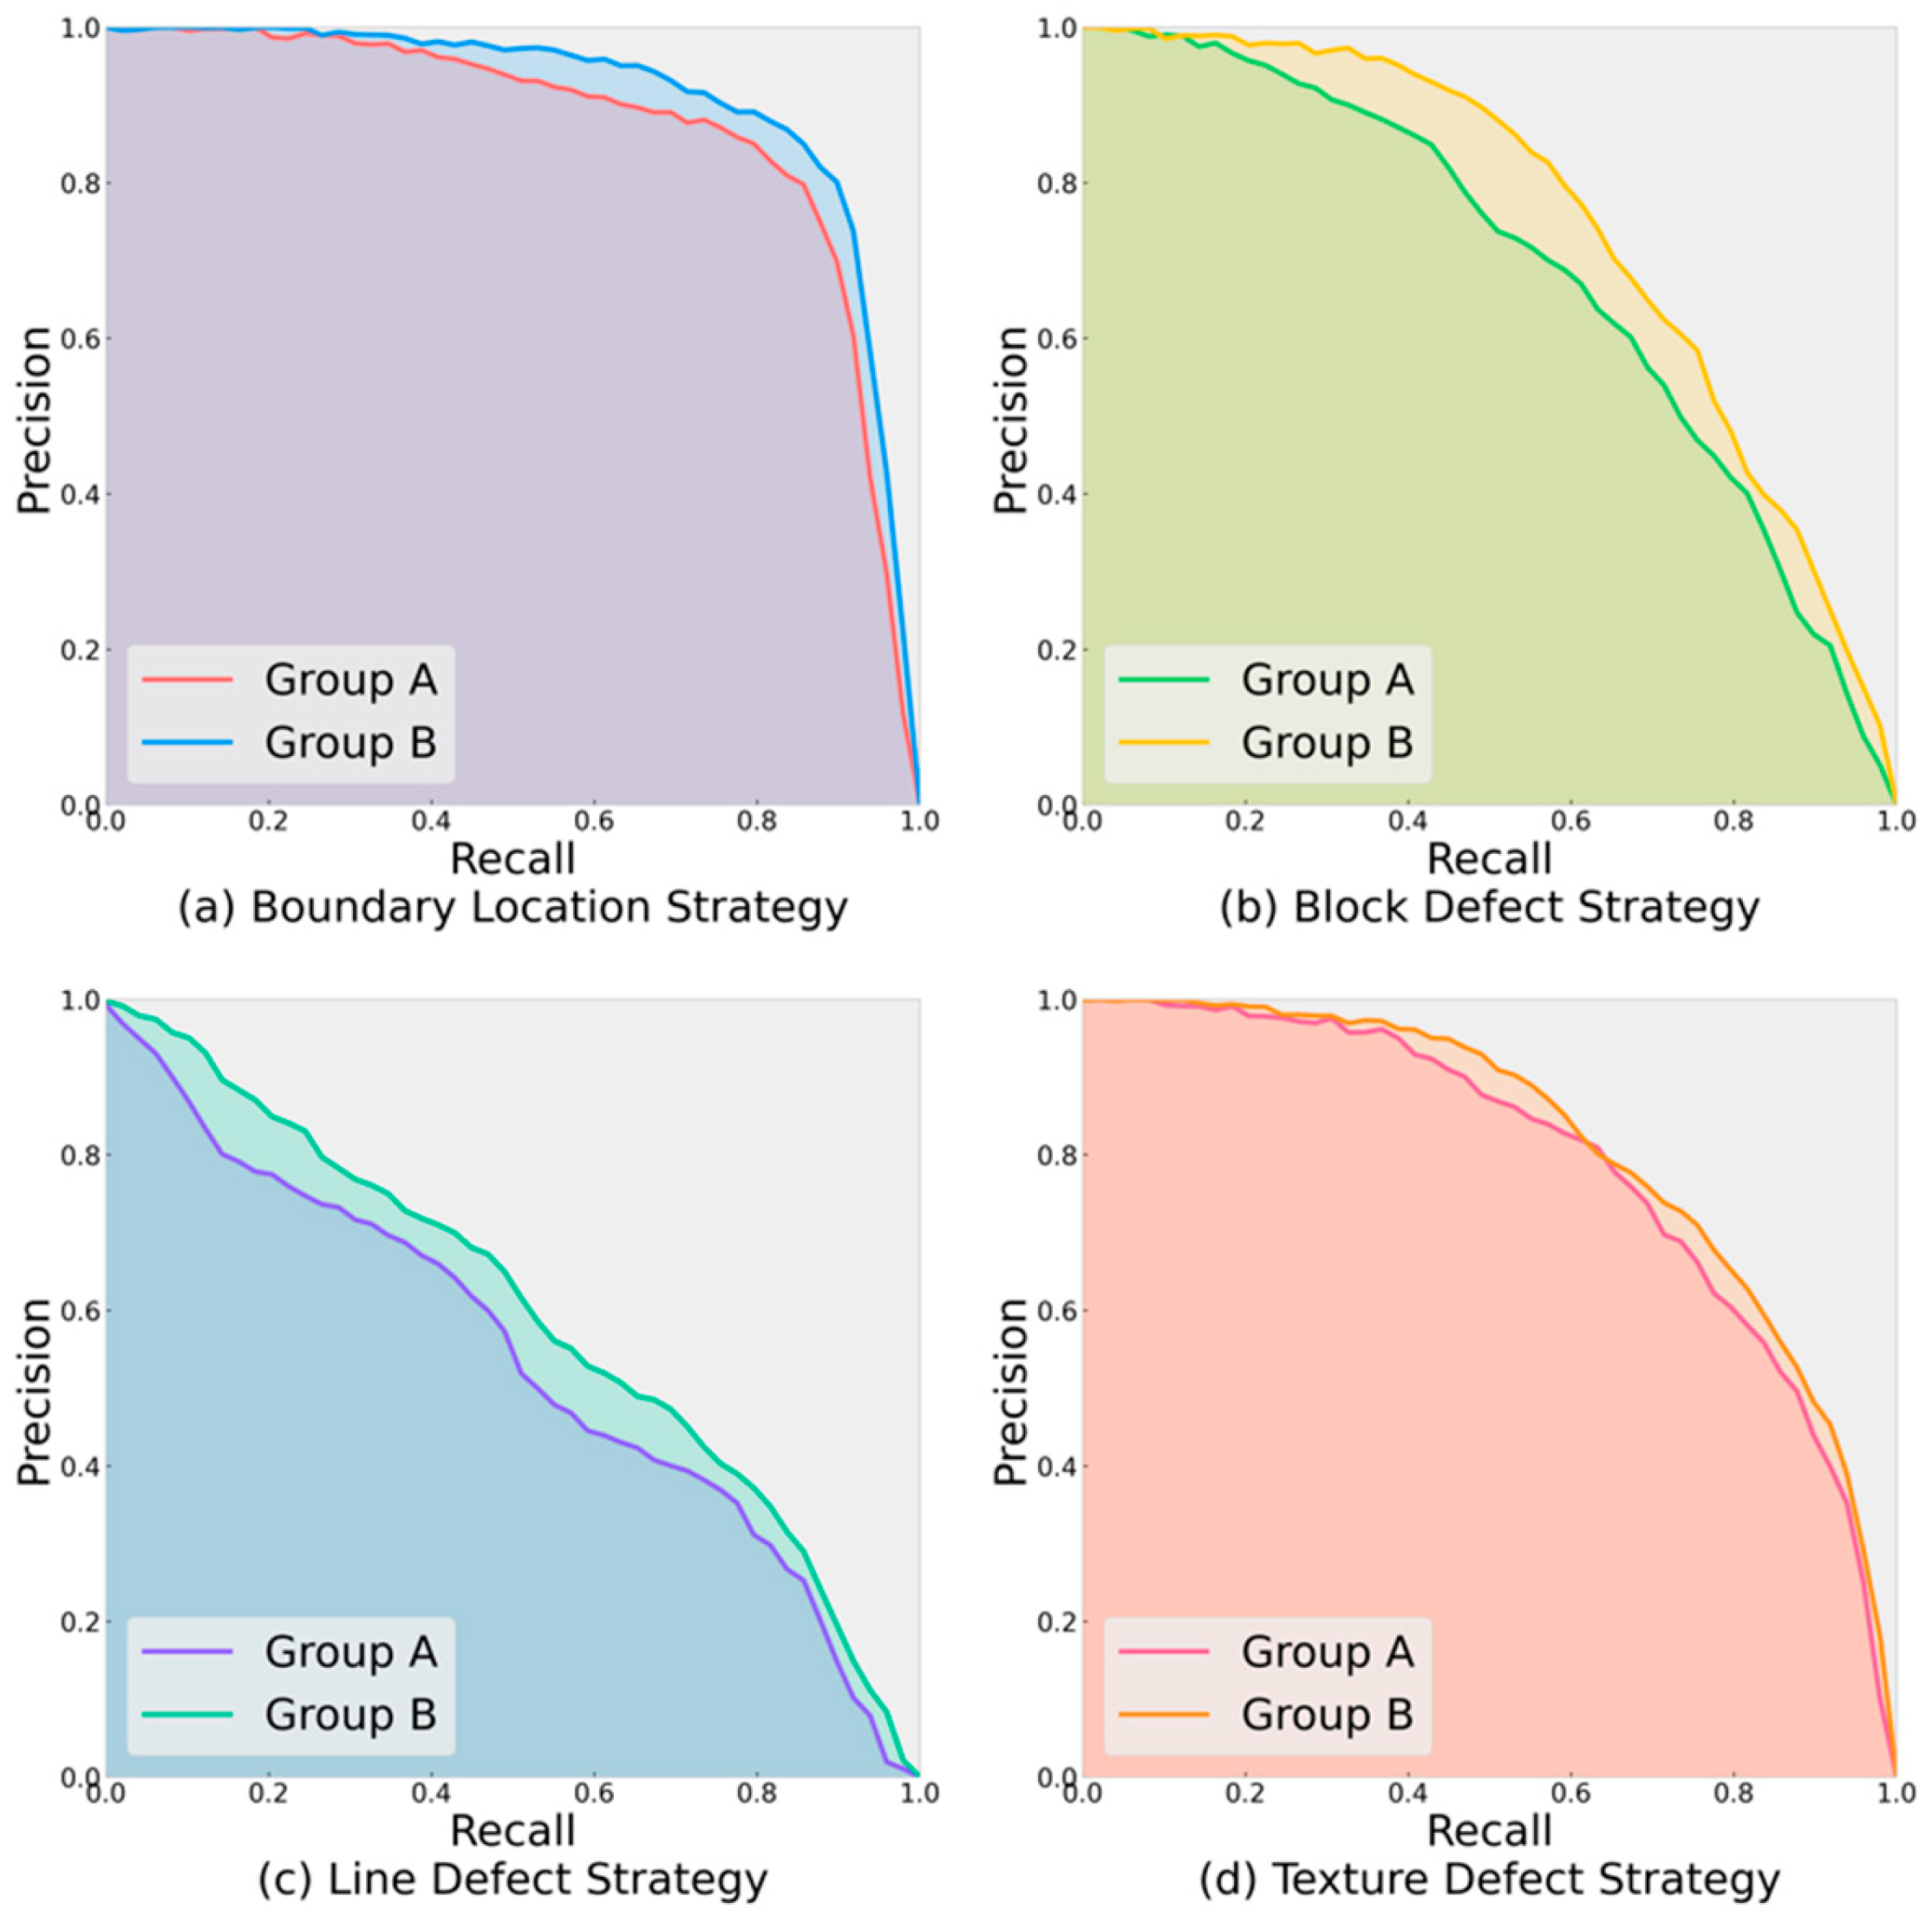
3.4. Ablation Studies on Annotation Strategies

To assess the effectiveness of the annotation strategy proposed in this paper, Faster R-CNN was used as the baseline model for ablation experiments [30]. Table 3 presents the results of four sets of ablation experiments, each verifying the impact of four key components of the annotation strategy on the detection performance. In each experiment, Group A represented the baseline method while Group B implemented our proposed strategy. The key components included (a) a boundary positioning strategy, (b) an independent unit strategy for block defects, (c) a directional segmentation strategy for linear defects, and (d) a local window strategy for texture defects. The corresponding PR curves for each group are shown in Figure 7.
First, the results for the annotation box boundary at the visual edge (Group A) and the expanded boundary position (Group B) were compared. The results indicate that the AP value of Group B increased by 2.7%, with the precision and recall improving by 0.7% and 6.5%, respectively. The PR curve (Figure 7a) shows that Group B maintained a higher precision rate in high-recall regions. This suggests that extending the bounding box beyond the visual edge more completely preserves the transition area of defect features, effectively reducing the probability of missed detection and repeated detection.
Subsequently, the effectiveness of the minimum unit representation for different patterns of defects was validated. For block defects, multi-target mixed annotation (Group A) was compared with single-target complete annotation (Group B). The experimental results show that in Group B the AP, precision, and recall improved by 6.6%, 8.4%, and 5.6%, respectively. The PR curve (Figure 7b) reveals that the minimum units for Group B notably covered the area analyzed for Group A, verifying that the minimum unit representation of block defects can effectively reduce feature aliasing by maintaining target independence, thereby improving the detection accuracy.
For linear defects, the comparison between segment-based annotation (Group B) and complete annotation (Group A) showed that Group B’s AP value increased by 7.8%, with the precision and recall improving by 6.8% and 11.3%, respectively. Furthermore, the PR curve (Figure 7c) verifies that for linear defects with directional changes, a segmentation strategy can be used to decompose the unstable directional defects into multiple directionally stable minimum units, which can simplify the feature representation and effectively improve the detection performance of the model.
Regarding textured defects, the experiments compared the local window-based annotation strategy (Group B) with traditional global annotation methods (Group A). The results show that although the overall performance improvement in Group B was relatively small, observations from the PR curve (Figure 7d) show that Group B had more stable detection accuracy while maintaining a high recall rate. This result shows that although the local window annotation strategy does not bring a significant overall performance improvement, it still has practical value in actual application scenarios with high-precision detection requirements.

3.5. Evaluation of Model Performance Improvement

In order to further evaluate the generalizability of the proposed annotation strategy, six representative object detection models were selected for use in comparative experiments. These models included traditional two-stage detectors such as Faster R-CNN with VGG16 [31] and Cascade R-CNN [32], single-stage detectors such as SSD [33] and YOLOv8 [34], and Transformer-based detectors such as Deformable DETR [35] and RT-DETR [36]. The experiments were conducted on the NEU-DET dataset, using both the dataset’s original annotations and the new annotations generated by our method for training and testing. Table 4 presents the detection performance of these models under the two annotation schemes.
The experimental results indicate that all the models achieved varying degrees of performance improvement with the new annotation strategy, with an average mAP increase of 4.9%, confirming the strategy’s broad applicability. Notably, Deformable DETR, based on a Transformer architecture, exhibited the most significant improvement, achieving a 10.5% increase in the mAP. This suggests that finer-grained annotations effectively enhance the ability of attention mechanisms to capture target features, thereby improving the detection performance. Additionally, by analyzing the visualized detection results for various defects obtained under different annotation strategies, as shown in Figure 8, a detailed examination of the detection performance variations across different defect types was conducted.
For morphologically complex Cr defects, the segmentation-based annotation strategy decomposed intricate linear structures into multiple segments with smoother directional changes. This refined processing enhanced the model’s ability to capture local features, resulting in an average AP improvement of 7.7% across all six models. The results indicate that constraining annotations to the minimum geometric units of defects effectively reduces ambiguities during the feature extraction process. This improvement was particularly significant for models that rely on local texture features, such as SSD and Cascade R-CNN.
For Rs defects with a dense spatial distribution, the independent labeling principle decoupled complex targets into multiple simpler ones, effectively addressing the issue of missed detections in small, scattered regions under the original annotation strategy. Although the combined annotation method reduced the workload to some extent, it increased the spatial complexity of the targets, thereby limiting the detection performance. Models that perform well in detecting small objects, such as RT-DETR and YOLOv8, achieved significant AP improvements under the independent annotation strategy proposed in this study. This demonstrates that reducing the spatial complexity, while maintaining the inherent characteristics of individual defects, is key to improving the detection performance for densely distributed defects.
For Pa defects, characterized by their larger spacing and size, the boundary extension strategy ensured the complete capture of grayscale features, effectively reducing false detections caused by local repeated detections. However, as these defects already exhibited a high degree of decoupling, the performance improvements were relatively limited. This suggests that for low-complexity defects, existing annotation methods are sufficient to fully utilize the potential of detection models, leaving limited room for further optimization.
For linear defects such as In and Sc, which exhibit minimal directional variation, enforced independent labeling combined with appropriate boundary expansion improved the model’s sensitivity to small, independent targets. This annotation strategy achieved stable performance improvements across all the models, further validating that even for minor defect features, improving the annotation accuracy can effectively enhance the detection performance.
For Ps defects with typical texture characteristics, the local window-based annotation strategy aligned the prediction boxes more closely with the actual defect distribution. By simplifying the representation of texture features, this strategy effectively enhanced the detection robustness, particularly in models that rely on regional feature extraction, such as Faster R-CNN and Cascade R-CNN.
The above analysis demonstrates that the annotation optimization framework proposed in this study effectively enhances the detection accuracy for various defects through feature decoupling mechanisms. Moreover, there was a significant correlation between the geometric characteristics of defects and the performance improvements achieved using the different annotation strategies. For defects with high geometric complexity, such as Rs, Ps, and Cr, the feature decoupling and minimal unit annotation strategies significantly improved the detection performance, exhibiting strong adaptability and robustness. In contrast, for defects with lower complexity, such as Pas, existing annotation methods are already sufficient to fully leverage the model’s capabilities, and further optimization offers limited benefits. This indicates that the design of annotation strategies should fully consider the geometric characteristics of defects to maximize the model performance. Additionally, the substantial performance improvements observed in Transformer-based models (particularly Deformable DETR) suggest that refined annotations play a critical role in enhancing attention mechanisms. This further validates the high compatibility of the feature decoupling strategy with advanced detection architectures.

4. Discussion

4.1. Analysis of Failure Cases

Although the annotation strategy proposed in this study significantly improved detection performance, it still had certain limitations in specific scenarios. As concluded in Section 3.5, the performance improvement for different defects was closely related to the compatibility between their geometric characteristics and the annotation strategy. For example, in the case of low-complexity defects such as Pa, due to their inherently high degree of decoupling, the existing annotation strategies had already maximized the model’s performance, leaving limited room for further optimization. Conversely, for morphologically complex defects such as Rs and Cr, while the novel annotation strategy substantially enhanced the detection performance, its ability to handle boundary ambiguity and densely distributed defects still requires further improvement.
As shown in Figure 9, an analysis of the failed cases revealed the following typical limitations:
(a)
Over-segmentation issues: For adjacent linear defects with similar features and gradual transitions between segments, the segmentation-based annotation strategy may lead to over-segmentation, causing a single defect to be mistakenly identified as multiple independent segments. This issue was particularly evident in morphologically complex linear defects (e.g., Cr), indicating that the stability of the segmentation strategy still needs optimization.
(b)
Boundary ambiguity issues: When neighboring defects are closely spaced and the boundary features are not prominent, the model may exhibit inaccuracies in boundary localization, causing a single complete defect to be incorrectly divided into multiple parts. Although the proposed boundary extension strategy alleviated this issue to some extent, it remains difficult to fully avoid for densely distributed defects.
(c)
Boundary delineation deviation: In areas where the transition between the defect and the background is gradual, inconsistencies may arise between the detection result boundaries and the annotated labels. In such cases, even when using the boundary extension annotation strategy, it is challenging to ensure perfect alignment between the detection results and manually annotated boundaries, highlighting the need for further improvement in the strategy’s adaptability to complex backgrounds.
Additionally, there are some limitations in the method’s practical application. Due to the significant differences in the surface properties and defect types across different materials, the method’s generalization requires tailoring the annotation strategy to specific scenarios. For instance, on transparent or highly reflective surfaces, strong light reflection or transmission may result in a minimal grayscale contrast or blurred boundaries between defect regions and the background, affecting the applicability of the grayscale distribution-based annotation strategy proposed in this study.
Figure 9. Failure cases: (a) Over-segmentation of adjacent defects with similar features, leading to single defects being mistaken as multiple segments; (b) Boundary ambiguity in closely spaced defects, causing inaccuracies in defect localization; (c) Boundary delineation deviations in gradual transitions, making alignment between detection results and annotated boundaries challenging in complex backgrounds. In the figure, the orange boxes represent the original annotation boxes, while the other colors represent the predicted boxes.
Electronics 14 02304 g009

4.2. Analysis of Balance Between Accuracy and Annotation Cost

Although the proposed annotation strategy significantly improved the model detection performance, it inevitably increased the annotation time costs when applied to industrial-scale defect datasets with fine-grained annotations. To comprehensively evaluate the actual utility of the annotation strategy, this study introduced the Efficiency–Cost Ratio (ECR) for in-depth analysis. The ECR assesses the relationship between the annotation investment and performance improvement, defined as follows:
E C R n = A c c u r a c y T i m e
where A c c u r a c y represents the accuracy improvement from applying fine-grained annotation rules, T i m e denotes the corresponding increase in the annotation time cost, and n is the percentage of annotated images relative to the total number of images. By calculating the value of the E C R n , the efficiency of model performance optimization considering the unit time cost can be effectively reflected, providing a quantitative basis for selecting annotation strategies.
The experiment analyzed the balance between the annotation cost and detection performance by gradually increasing the proportion of labeled images used for training (from 30% to 100%). Figure 10a shows the time overhead of feature decoupling-based refined annotation compared to the original annotation strategy, while Figure 10b illustrates the ECR trends for different defect types under various annotation proportions. The analysis of the ECR trends revealed valuable patterns. When the ECR was positive, it indicated that the investment of the annotation time per unit led to an improvement in the detection accuracy, meaning the new annotation strategy was more effective in terms of performance compared to the original annotation strategy. Block and linear defects achieved positive peak ECR values at a 50% annotation proportion, indicating that despite an increased annotation time, the improvement in the detection accuracy was more substantial, thus yielding optimal cost-effectiveness. This can be attributed to their relatively regular geometric features, where the fine annotation of half the samples sufficiently represents their feature space. In contrast, texture defects maintained negative ECR values until reaching a 90% annotation proportion, indicating that the new annotation method actually yielded lower detection accuracy than the original method before this threshold. This suggests that texture defects, due to their irregular features, require a higher proportion of fine annotation for this strategy to demonstrate advantages, ensuring sufficient sample coverage.
These findings reveal the characteristics of our feature decoupling-guided annotation strategy: while it increases the per-sample annotation time, it simplifies the feature space complexity by decomposing complex targets into minimum units with independent feature expressions. This enables satisfactory detection performance with fewer training samples. This result has practical value for industrial applications. In resource-constrained scenarios, annotation strategies can be flexibly chosen based on the defect types: for block and linear defects, a 50% fine annotation proportion can achieve optimal cost-effectiveness, while for texture defects, the use of additional annotation resources should be considered based on specific requirements. This ECR-based quantitative analysis method provides objective criteria for selecting annotation strategies, helping to achieve rational resource utilization while ensuring detection performance.

5. Conclusions

This study addressed issues such as feature aliasing and boundary ambiguity in data annotation for surface defect detection on steel strips and proposed an annotation framework based on feature decoupling theory. Starting from the grayscale distribution features of defects, a representation model decoupling geometric and grayscale features was constructed, providing a theoretical foundation for annotation optimization. Based on this model, a minimal unit boundary localization strategy was designed for defects with different geometric morphologies, enabling the accurate and standardized representation of complex defects. Ultimately, a complete annotation framework was developed. Validation experiments on the NEU-DET dataset demonstrated that this method improves the average mAP of mainstream detection models by 4.9 percentage points, with particularly significant performance improvements for morphologically complex defects such as Rss and Cr, confirming the effectiveness of the proposed annotation framework. Additionally, the proposed ECR evaluation method revealed the relationship between the defect types and annotation efficiency. The experiments showed that for block-shaped and linear defects, the ECR reaches its positive peak at a 50% annotation proportion, where the annotation efficiency was the highest and the detection performance improved significantly. This indicates that for defect types with well-structured geometric features, reducing the annotation proportion of the training dataset appropriately can achieve a good balance between the annotation cost and detection performance, providing valuable guidance for optimizing annotation resources in industrial practice.
Although the proposed annotation strategy is generally effective, it still has some limitations, including the over-segmentation of adjacent linear defects with similar features and boundary localization issues in gradient regions. Future work will focus on further optimizing annotation strategies to address the issues of boundary ambiguity and densely distributed defects, as well as exploring adaptations to different materials and defect types to enhance the strategy’s applicability in real-world industrial scenarios.

Author Contributions

Conceptualization, W.Y. and W.L.; data curation, W.L.; formal analysis, W.L.; funding acquisition, W.Y. and W.L.; investigation, W.Y. and W.L.; methodology, W.Y. and W.L.; project administration, W.Y. and W.L.; resources, W.Y. and W.L.; software, W.Y. and W.L.; supervision, W.Y. and W.L.; validation, W.Y. and W.L.; visualization, W.L.; writing—original draft, W.L.; writing—review and editing, W.Y. and W.L. All authors have read and agreed to the published version of the manuscript.

Funding

This research received no external funding.

Data Availability Statement

The data that support the findings of this study are available from the NEU-DET dataset. For access to the dataset, please contact the corresponding author.

Acknowledgments

We are grateful to all those who provided useful suggestions for this study.

Conflicts of Interest

The authors declare no conflicts of interest.

References

  1. Yue, H.; Li, X.; Sun, Y.; Zhang, L.; Feng, Y.; Guo, H. ASOD: Attention-based salient object detector for strip steel surface defects. Electronics 2025, 14, 831. [Google Scholar] [CrossRef]
  2. Han, L.; Li, N.; Li, J.; Gao, B.; Niu, D. SA-FPN: Scale-aware attention-guided feature pyramid network for small object detection on surface defect detection of steel strips. Meas. J. Int. Meas. Confed. 2025, 249, 117019. [Google Scholar] [CrossRef]
  3. Zhang, L.; Fu, Z.; Guo, H.; Feng, Y.; Sun, Y.; Wang, Z. TAFENet: A two-stage attention-based feature-enhancement network for strip steel surface defect detection. Electronics 2024, 13, 3721. [Google Scholar] [CrossRef]
  4. Chen, H.; Du, Y.; Fu, Y.; Zhu, J.; Zeng, H. DCAM-Net: A rapid detection network for strip steel surface defects based on deformable convolution and attention mechanism. IEEE Trans. Instrum. Meas. 2023, 72, 5005312. [Google Scholar] [CrossRef]
  5. Chen, B.; Wei, M.; Liu, J.; Li, H.; Dai, C.; Liu, J.; Ji, Z. EFS-YOLO: A lightweight network based on steel strip surface defect detection. Meas. Sci. Technol. 2024, 35, 116003. [Google Scholar] [CrossRef]
  6. Lu, M.; Sheng, W.; Zou, Y.; Chen, Y.; Chen, Z. WSS-YOLO: An improved industrial defect detection network for steel surface defects. Meas. J. Int. Meas. Confed. 2024, 236, 115060. [Google Scholar] [CrossRef]
  7. Shen, K.; Zhou, X.; Liu, Z. MINet: Multiscale interactive network for real-time salient object detection of strip steel surface defects. IEEE Trans. Ind. Inform. 2024, 20, 7842–7852. [Google Scholar] [CrossRef]
  8. Liu, R.; Huang, M.; Gao, Z.; Cao, Z.; Cao, P. MSC-DNet: An efficient detector with multi-scale context for defect detection on strip steel surface. Meas. J. Int. Meas. Confed. 2023, 209, 112467. [Google Scholar] [CrossRef]
  9. Bishop, C.M.; Nasrabadi, N.M. Pattern Recognition and Machine Learning; Springer: Cham, Switzerland, 2006. [Google Scholar]
  10. Agnew, C.; Scanlan, A.; Denny, P.; Grua, E.M.; van de Ven, P.; Eising, C. Annotation Quality Versus Quantity for Object Detection and Instance Segmentation. IEEE Access 2024, 12, 140958–140977. [Google Scholar] [CrossRef]
  11. Lin, T.; Maire, M.; Belongie, S.; Hays, J.; Perona, P.; Ramanan, D.; Dollar, P.; Zitnick, C.L. Microsoft COCO: Common objects in context. In Proceedings of the Computer Vision–ECCV 2014: 13th European Conference, Zurich, Switzerland, 6–12 September 2014. [Google Scholar]
  12. Kumar, S.S.; Wang, M.; Abraham, D.M.; Jahanshahi, M.R.; Iseley, T.; Cheng, J.C. Deep learning–based automated detection of sewer defects in CCTV videos. J. Comput. Civ. Eng. 2020, 34, 04019047. [Google Scholar] [CrossRef]
  13. Guo, J.; Wang, Q.; Li, Y. Façade defects classification from imbalanced dataset using meta learning-based convolutional neural network. Comput. Aided Civ. Infrastruct. Eng. 2020, 35, 1403–1418. [Google Scholar] [CrossRef]
  14. Cui, J.; Zhang, B.; Wang, X. Impact of annotation quality on model performance of welding defect detection using deep learning. Weld. World 2024, 68, 855–865. [Google Scholar] [CrossRef]
  15. Guo, J.; Wang, Q.; Li, Y. Evaluation-oriented façade defects detection using rule-based deep learning method. Autom. Constr. 2021, 131, 103910. [Google Scholar] [CrossRef]
  16. Byunghyun, K.; Soojin, C. Image-based concrete crack assessment using mask and region-based convolutional neural network. Struct. Control. Health Monit. 2019, 26, e2381.1–e2381.15. [Google Scholar] [CrossRef]
  17. Zhao, S.; Zhang, D.; Xue, Y.; Zhou, M.; Huang, H. A deep learning-based approach for refined crack evaluation from shield tunnel lining images. Autom. Constr. 2021, 132, 103934. [Google Scholar] [CrossRef]
  18. Tu, H.; Yu, Z.; Menzies, T. Better data labelling with EMBLEM (and how that impacts defect prediction). IEEE Trans. Softw. Eng. 2022, 48, 278–294. [Google Scholar] [CrossRef]
  19. Yang, H.; Song, K.; Mao, F.; Yin, Z. Autolabeling-enhanced active learning for cost-efficient surface defect visual classification. IEEE Trans. Instrum. Meas. 2021, 70, 5004815. [Google Scholar] [CrossRef]
  20. Yang, W.; Zhou, Y.; Meng, G. Improving the Efficiency of Steel Plate Surface Defect Classification by Reducing the Labelling Cost Using Deep Active Learning. Stroj. Vestn. J. Mech. Eng. 2024, 70, 554–568. [Google Scholar] [CrossRef]
  21. Ran, G.; Yao, X.; Wang, K.; Ye, J.; Ou, S. Sketch-guided spatial adaptive normalization and high-level feature constraints-based GAN image synthesis for steel strip defect detection data augmentation. Meas. Sci. Technol. 2024, 35, 045408. [Google Scholar] [CrossRef]
  22. Putri, W.R.; Li, Y.-H.; Wang, J.C. Advancing Robust Few-shot Surface Defect Detection through Meta-learning. In Proceedings of the 2024 9th International Conference on Integrated Circuits, Design, and Verification (ICDV), Hanoi, Vietnam, 6–7 June 2024; pp. 45–48. [Google Scholar] [CrossRef]
  23. Yang, C.; Wu, W.; Wang, Y.; Zhou, H. A novel feature-based model for zero-shot object detection with simulated attributes. Appl. Intell. 2022, 52, 6905–6914. [Google Scholar] [CrossRef]
  24. Zhao, S.; Zhong, R.Y.; Wang, J.; Xu, C.; Zhang, J. Unsupervised fabric defects detection based on spatial domain saliency and features clustering. Comput. Ind. Eng. 2023, 185, 109681. [Google Scholar] [CrossRef]
  25. Hoyer, P.O. Natural image statistics and efficient coding. In Proceedings of the IEEE Workshop on Neural Networks for Signal Processing, Martigny, Switzerland, 6 September 2002; pp. 557–565. [Google Scholar]
  26. Shannon, C.E. A mathematical theory of communication. Bell Syst. Tech. J. 1948, 27, 379–423. [Google Scholar] [CrossRef]
  27. Song, K.; Yan, Y. A noise robust method based on completed local binary patterns for hot-rolled steel strip surface defects. Appl. Surf. Sci. 2013, 285, 858–864. [Google Scholar] [CrossRef]
  28. Fisher, R.A. The use of multiple measurements in taxonomic problems. Ann. Eugen. 1936, 7, 179–188. [Google Scholar] [CrossRef]
  29. Everingham, M.; Eslami, S.M.; Van Gool, L.; Williams, C.K.; Winn, J.; Zisserman, A. The pascal visual object classes challenge: A retrospective. Int. J. Comput. Vis. 2015, 111, 98–136. [Google Scholar] [CrossRef]
  30. He, Y.; Song, K.; Meng, Q.; Yan, Y. An end-to-end steel surface defect detection approach via fusing multiple hierarchical features. IEEE Trans. Instrum. Meas. 2020, 69, 1493–1504. [Google Scholar] [CrossRef]
  31. Simonyan, K.; Zisserman, A. Very Deep Convolutional Networks for Large-Scale Image Recognition. In Proceedings of the International Conference on Learning Representations (ICLR), San Diego, CA, USA, 7–9 June 2015; pp. 1–14. [Google Scholar]
  32. Cai, Z.; Vasconcelos, N. Cascade R-CNN: High quality object detection and instance segmentation. IEEE Trans. Pattern Anal. Mach. Intell. 2019, 43, 1483–1498. [Google Scholar] [CrossRef]
  33. Liu, W.; Anguelov, D.; Erhan, D.; Szegedy, C.; Reed, S.; Fu, C.Y.; Berg, A.C. SSD: Single shot multibox detector. In Computer vision–ECCV 2016; Leibe, B., Matas, J., Sebe, N., Welling, M., Eds.; Springer: Cham, Switzerland, 2016; pp. 21–37. [Google Scholar]
  34. Varghese, R.; Sambath, M. YOLOv8: A novel object detection algorithm with enhanced performance and robustness. In Proceedings of the 2024 International Conference on Advances in Data Engineering and Intelligent Computing Systems (ADICS), Chennai, India, 18–19 April 2024. [Google Scholar]
  35. Zhu, X.; Su, W.; Lu, L.; Li, B.; Wang, X.; Dai, J. Deformable detr: Deformable transformers for end-to-end object detection. arXiv 2020, arXiv:2010.04159. [Google Scholar]
  36. Zhao, Y.; Lv, W.; Xu, S.; Wei, J.; Wang, G.; Dang, Q.; Liu, Y.; Chen, J. DETRs beat YOLOs on real-time object detection. In Proceedings of the IEEE/CVF Conference on Computer Vision and Pattern Recognition, Vancouver, BC, Canada, 17–24 June 2023. [Google Scholar]
Figure 1. Key challenges in analyzing defect annotations: (a) overlapping bounding boxes causing feature confusion, (b) uncertain annotation areas due to irregular defect shapes, (c) incomplete contour annotations leading to loss of morphological features. Rectangular boxes represent annotation boxes.
Electronics 14 02304 g001
Figure 2. The feature decoupling-guided annotation optimization framework: defect analysis, minimum units, and boundary strategies. The orange rectangular boxes represent the annotation boxes.
Electronics 14 02304 g002
Figure 3. Analysis of surface defect images and grayscale distributions: (a) original defect images, (b) curves of cross-sectional grayscale distribution along orange dotted lines, (c) global grayscale distribution maps illustrating feature decoupling for block, linear, and textured defects.
Electronics 14 02304 g003
Figure 4. Cross-sectional grayscale distribution curve of a defect image. (a) Annotation ranges for a blocky defect: the red area represents the bounding box at the visual edge, the green area at the actual grayscale edge, and the blue area at the recommended annotation position. (b) The corresponding cross-sectional grayscale distribution curve for the middle of the defect image: red points indicate visual edge positions, green points indicate actual edge positions, and blue points indicate recommended annotation positions.
Electronics 14 02304 g004
Figure 5. Comparison of feature maps created using different bounding box localization strategies: the left images show the comparison of bounding box annotations, where the ‘Original’ strategy uses larger and less precise bounding boxes, while the ‘Ours’ strategy employs smaller and more refined bounding boxes to better focus on detailed regions. The right images illustrate the heatmaps of feature intensity distributions, where red indicates stronger feature responses and blue indicates weaker responses. This comparison highlights the effectiveness of the ‘Ours’ strategy in capturing distinct and focused feature representations across defect patterns.
Electronics 14 02304 g005
Figure 6. Comparison between original and proposed annotations for six defect types. (a) Cr. (b) In. (c) Pa. (d) Ps. (e) Rs. (f) Sc.
Electronics 14 02304 g006
Figure 7. Precision–recall (PR) curves from ablation studies evaluating impact of different annotation strategies on detection performance.
Electronics 14 02304 g007
Figure 8. Examples of detection results: comparison between original and optimized annotation strategies for various defect types.
Electronics 14 02304 g008
Figure 10. Annotation time cost and corresponding accuracy. (a) Annotation time for defects with different geometric features under various annotation rules. (b) ECR for different geometric feature types when annotating 30%, 50%, 70%, 90%, and 100% of samples.
Electronics 14 02304 g010
Table 1. Comparison of bounding box numbers between original and proposed annotations.
LabelCrInPaPsRsScTotal
Original 6899818754306085254108
Ours2597145310542279350791311,803
Table 2. Experimental environment and training strategies.
ItemParameterValue
Training parametersOptimizerAdam
Batch size16
Learning rate0.0001
Epochs200
Weight decay1 × 10−4
Learning rate decay factor0.1
Data augmentationRandom rotation±10°
Random horizontal flipProbability of 0.5
Random vertical flipProbability of 0.5
Table 3. Performance comparison of different annotation strategies.
StrategyAP (%) P 0.5 (%) R 0.5 (%) AP
ABABAB
Boundary Positioning Strategy84.989.686.687.381.988.4+2.7
Independent Unit Strategy for Block Defects68.875.475.483.866.171.7+6.6
Directional Segmentation Strategy for Linear Defects42.950.772.679.467.378.6+7.8
Local Window Strategy for Texture Defects79.180.385.384.689.890.1+1.2
Table 4. Detection performance comparison on NEU-DET dataset.
MethodLabelsAP%mAP%
CrInPaPsRsSc
Faster R-CNN Original42.967.984.979.168.889.972.3
New50.776.589.680.375.495.378.0
SSD Original37.477.389.775.960.484.370.8
New46.379.693.978.864.888.175.3
Cascade R-CNN Original41.378.693.992.463.991.977.0
New51.882.494.193.171.293.681.0
Deformable DETR Original26.466.073.767.139.178.158.4
New40.273.189.670.256.483.868.9
YOLOv8n Original46.781.494.391.566.693.078.9
New49.182.795.490.968.494.880.2
RT-DETR-R18 Original47.978.796.091.467.694.279.3
New50.683.997.292.476.395.182.6
Disclaimer/Publisher’s Note: The statements, opinions and data contained in all publications are solely those of the individual author(s) and contributor(s) and not of MDPI and/or the editor(s). MDPI and/or the editor(s) disclaim responsibility for any injury to people or property resulting from any ideas, methods, instructions or products referred to in the content.

