Abstract
Wireless communication has been widely used in emergency rescue, including from command vehicles to command vehicles, command vehicles to rescue teams, command vehicles to wireless sensors, and rescue teams to intelligent platforms such as unmanned vehicles. Compared to those used in cities and suburbs, when the same communication equipment is used in forests, its communication performance, such as transmission distance, is entirely different. The main reason for this phenomenon is the extraordinary complexity of wireless signal propagation in forest scenarios. Therefore, in order to accurately and quantitatively describe the wireless channel characteristics in forest scenarios, a frequency channel measurement activity is conducted in a forest and analysis is performed to acquire the channel characteristics in forest scenarios. The measurements are carried out at 380 MHz, 640 MHz, and 1420 MHz in virgin forest. Based on the measurement data, the average power delay profile (APDP) is obtained, and multipath components (MPCs) are extracted. Root mean square (RMS) delay spread and path loss (PL) are analyzed according to MPCs. Furthermore, a new path loss model is proposed. Finally, a new path loss model and relative analysis are provided.
1. Introduction
To ensure the reliability of communication systems in different environments, many global standards organizations and research institutions have developed their propagation models through many field measurements and data analysis. Typical propagation models include the IEEE 802.16d model [1] and SUI [2,3] for suburbs, and the 3GPP TR 38.901 [4], ITU-R M.1225 [5], and Oku-mura/Hata models [6] for suburban, rural, factory, and urban scenarios. These models apply to classic scenarios and not to virgin forest scenarios. When a fire occurs or a person loses contact in a forest, the reliability of emergency command communications directly affects rescue efficiency. The accuracy of wireless network deployment in virgin forest areas requires a precise channel model so as to predict coverage and optimize infrastructure correctly. ITU-R P.833-10 [7] mainly focuses on the propagation and PL of electromagnetic waves in vegetation but lacks a description of delay domain characteristics. In addition, factors such as different vegetation types, vegetation density, and frequency have different effects on propagation characteristics. Complex propagation effects should be addressed to a certain extent, which leads to better generalization of the analysis and models.
In recent years, researchers have carried out channel measurement and modeling campaigns mainly related to urban cities, the Internet of Things, satellite communications, and the Internet of Vehicles (V2X) with the deployment of 5G and research on 6G technology. These studies have mainly focused on the availability of higher frequency bands, higher data rates, more complex antenna configurations, and richer application scenarios. However, signals propagating in high-frequency bands experience more significant attenuation and are susceptible to obstruction in a virgin forest environment. The advantages of signals transmitted in the low-frequency band include good penetration, long transmission distance, and low loss in specific scenarios, demonstrating excellent performance. Therefore, low-frequency-band communication is better suited for the harsh conditions of virgin forests. In practical emergency communication networks, low-frequency applications such as ultra-short waves and short waves are more commonly used.
Currently, research on channel measurement and modeling in primeval forested scenarios is relatively rare. Ref. [8] conducted channel measurements in the millimeter wave band in a coniferous forest and established a PL model based on the test data. However, whether the model based on the millimeter wave frequency band can accurately describe fast fading and shortwave transmission in the original forest environment still needs to be studied. Ref. [9] conducted continuous measurements at a center frequency of 605 MHz on predetermined routes in different types of forest areas and proposed a new short-distance wireless channel propagation model. Ref. [10] calculated PL by receiving signals and produced a PL model. Ref. [11] conducted 5 GHz channel measurement activities in a park forest and analyzed delay domain parameters based on the measurement data. Reference [12] measured channel activity between emergency vehicles and personnel inside buildings. Then, PL and RMS delay propagation were analyzed. Reference [13] conducted channel measurements in forest environments at 2.3 GHz and provided a PL model, but it lacked an analysis of delay domain characteristics. Ref. [14] studied the propagation loss of near-ground wireless sensor networks on snow. Measurement activities were carried out in a dense forest with thick snow accumulation at a center frequency of 2.45 GHz. According to the results, the PL and shadowing effects of near-ground wireless sensor networks on snow are given. Ref. [15] conducted a 380 MHz channel measurement activity in primary forest. However, more analysis and modeling of delay domain characteristics were required, and the differences in channel characteristics across multiple frequency bands were not considered for comparison. In addition, some teams have already carried out corresponding work in other emergency communication scenarios. Ref. [16] conducted channel measurements and analyzed complete channel parameters in mountainous communication scenarios assisted by 6G drones. Ref. [17] considers the impact of different operating trajectories on channel modeling in scenarios assisted by drones. Ref. [18] conducted channel modeling for emergency communication scenarios in urban areas and proposed a height-based adaptive channel model. Ref. [19] conducted channel measurements inside emergency staircases and established a path loss model. Ref. [20] conducted channel measurements in the millimeter wave frequency band at emergency exits and analyzed path losses.
To sum up, most of the existing tests were conducted in parks, urban areas, and other environments with trees, and there are almost no specific testing cases of primitive forest scenarios aimed at emergency communication. Though some measurement activities were carried out in forested scenarios, the research on delay domain characteristics is relatively limited, and only highly complex path loss models related to distance have been established. In addition, existing measurements in forest scenarios were conducted at higher carrier frequencies with a limited transmission range, making them unsuitable for emergency communication. As mentioned above, we conducted a multi-frequency, long-distance channel measurement activity at a low frequency in the Greater Khingan Mountains of China to address this gap. The test field is located in a bright coniferous forest area in the cold temperate zone with solid representativeness in emergency rescue and universality in primary forest areas. Additionally, we collected the correction data of the measurement system to compute channel impulse response (CIR) and PDP. To eliminate the randomness of noise and extract more accurate multipath information, we analyzed the APDP. Based on the APDP, the time delay and energy domain characteristics were analyzed, and PL was calculated. Finally, we proposed a frequency-based PL model for the primeval forest scenario and conducted a specific analysis based on this scenario. This work contributes to the design, performance evaluation, and signal processing of emergency communication systems in pristine forest environments. This work can also effectively improve the efficiency of emergency communication network deployment, promote the upgrading of emergency communication equipment such as individual terminals, and accelerate the development of intelligent rescue equipment such as unmanned vehicles.
The rest of this paper is organized as follows. In Section 2, we introduce a channel measurement activity in the pristine forest at three frequency bands, including the measurement system, detailed measurement parameters, and experimental data processing results. In Section 3, based on the acquired measurement results, we analyze the parameters of the three frequency bands, such as MPCs, PDP, APDP, RMS, and PL, and establish a PL model. Finally, in Section 4, we draw our conclusions.
2. Measurement Campaign
2.1. Measurement Scenarios
The Greater Khingan Mountains are located in the northern parts of Heilongjiang Province and the Inner Mongolia Autonomous Region. They act as a watershed between the Inner Mongolian Plateau and the Songliao Plain. The pristine forests of the Greater Khin-gan Mountains are dense and constitute one of China’s essential forestry bases. According to on-site surveys and considering factors such as vegetation coverage, terrain features, and feasibility, the measurement activity was conducted near a watchtower of Dongshan Mountain in the northeastern region of the Greater Khingan Mountains in June 2022. The Dongshan regional environment, location, and surrounding terrain are shown in Figure 1. The measurement activities were carried out deep in the dense forest. By deploying transmitters and receivers, measurements were simultaneously conducted in three frequency bands within the forest. Due to differences in measurement schemes, channel measurements were divided into low-frequency (F1 380 MHz and F2 640 MHz) measurements and high-frequency (F3 1420 MHz) measurements. A 20 MHz bandwidth single-input single-output (SISO) measurement system was used for low-frequency measurements, and a 40 MHz bandwidth 4 × 4 multiple-input multiple-output (MIMO) measurement system was used for high-frequency measurement.
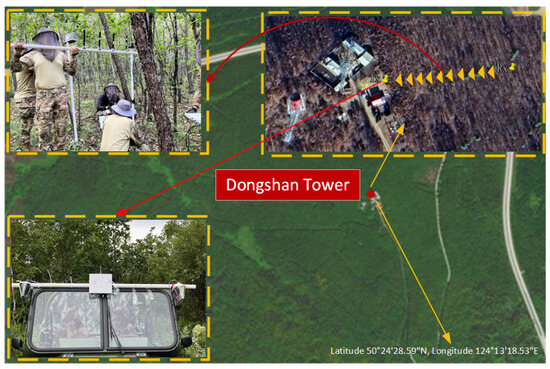
Figure 1.
Location of Dongshan Tower, measurement route and representation of experimental equipment deployment.
2.2. Measurement System
In this measurement activity, National Instruments (NI) Universal Software Radio Peripheral (USRP) 2954 was used as the measurement transceiver device for the F1 and F2 cases, and NI USRP X410 was used for the F2 case. A 20 W power amplifier was used at the transmitting end for the F1 and F2 cases, and a 40 W power amplifier was used at the transmitting end for the F3 case. In addition, inverters and uninterruptible power supplies were used to provide a stable energy supply to the measurement system. Two directional shark fin antennas were used as transmitting antennas for the F1 and F2 cases, and a panel antenna was used as the transmitting antenna for the F3 case. The detailed diagram of the channel measurement system is shown in Figure 2. The numbers on the connecting lines between the devices correspond to the cable used during testing. The power amplifier is provided by Beijing Jiaotong University, Beijing, China, and the antennas are provided by PCTEL, Tianjin, China.
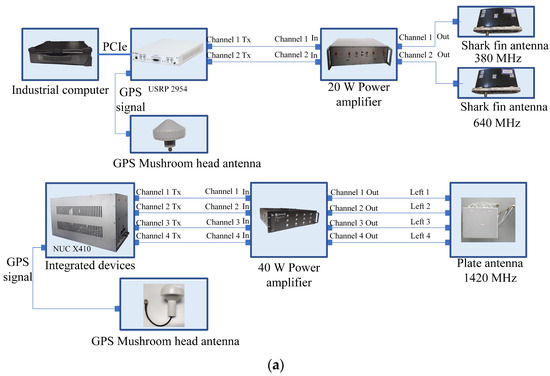
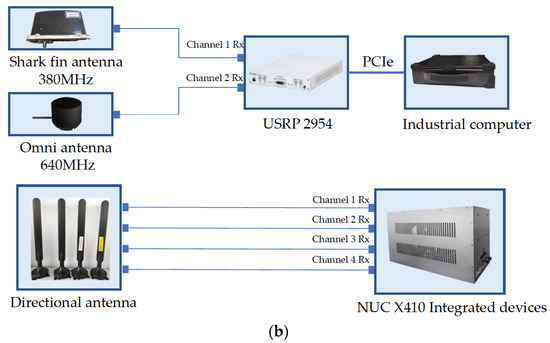
Figure 2.
Diagram of the channel measurement system. (a) Diagram of Tx end. (b) Diagram of Rx end.
2.3. Measurement Activity
We encountered many difficulties in conducting channel measurement activities in primitive forests. Firstly, it was difficult for us to deploy the receiving end in the primitive forest. In addition, we supplied the power provided by the car to the receiving end through cables. Secondly, we used professional GPS recorders to obtain geographic information. Finally, we contacted the local fire department and provided professional field testing assistance to deal with potentially hazardous situations.
The deployment diagram for the transmitter end is shown in Figure 3. The transmitter equipment was fixed in the all-terrain vehicle running in the forest area, and the transmitting antenna was fixed on a pipe set at the front of the all-terrain vehicle. Shark fin directional antennas were used in the F1 and F2 cases, and the panel directional antenna was used in the F3 case. The deployment diagram for the receiving end is shown in Figure 4. A shark fin antenna and one omnidirectional antenna were used as receiving antennas for the F1 and F2 cases, and four whip antennas were used as receiving antennas for the F3 case. The receiving antennas were fixed on the tubes and were held by the tester for dynamic measurement. Detailed channel measurement parameters are shown in Table 1.
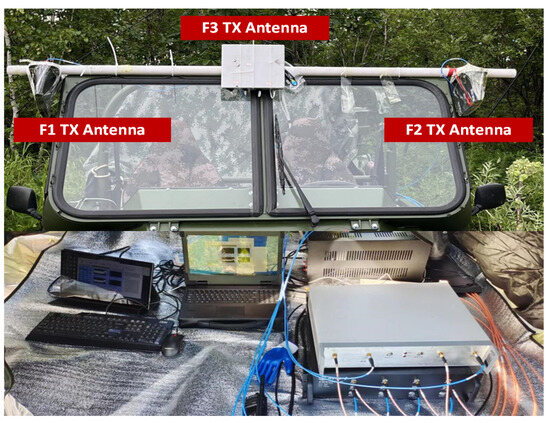
Figure 3.
Measuring transmitter antenna in Dongshan dense coniferous forest.
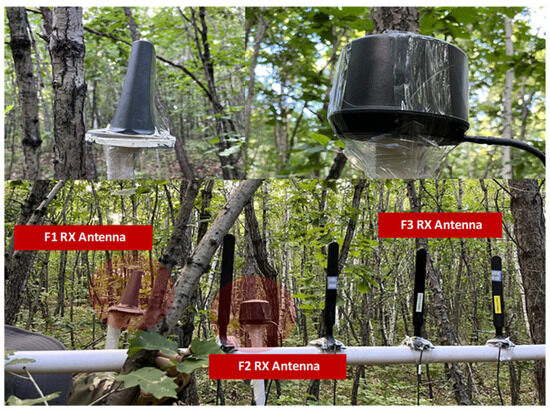
Figure 4.
Deployment of measurement receiving-end antenna in Dongshan dense coniferous forest.

Table 1.
Parameters of channel measurement.
The researchers held the receiving device and approached the transmitting end from the depths of the forest area one hundred meters away from the transmitting end. We marked the cable each 5 m as a mark to assess the distance while traveling and recorded the measurement data for each 5 m. A total of 1000 snapshots were collected for the F1 and F2 cases and 1600 snapshots were collected for the F3 case. A GPS logger was used to record accurate GPS in real time for each measurement process at the Rx end. Additionally, we tried our best to eliminate interference caused by human factors during the test.
2.4. Data Processing
2.4.1. Calibration
A back-to-back (B2B) calibration experiment was conducted before the measurement campaign. The purpose of B2B calibration is to eliminate the influence of the measurement system. This method directly and comprehensively acquires the equipment’s system channel transfer function (CTF) through cables and attenuators. A more accurate CIR is obtained through the B2B calibrated and received signals. During our B2B testing, we required cascading attenuators to prevent equipment from being damaged by high-power signals. Accurate acquisition of attenuator values is also necessary for subsequent analysis. The attenuator values obtained from the tests are marked on the lines in the diagram. We first conducted system tests involving cascaded attenuators, then individually acquired the specific attenuator values, and finally obtained an accurate B2B response. The equipment connection for the B2B calibration experiment is shown in Figure 5. The values of the attenuators are also recorded in the diagram, and these values were considered within the B2B calibrated signal during the final computation of the system’s CTF.
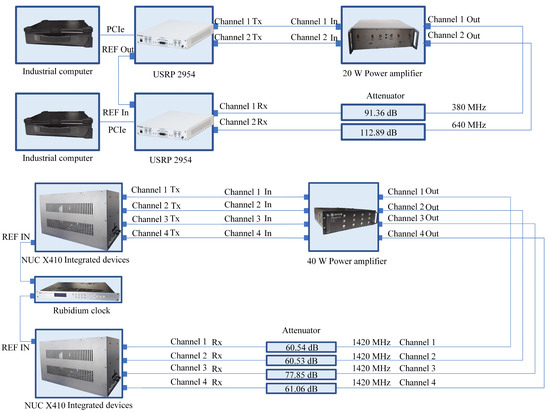
Figure 5.
Diagram of calibration experiment connection.
The calibrated CIR can be defined as follows:
where and represent the received signal and calibrated signal in the frequency domain, respectively.
2.4.2. Average Power Delay Profile (APDP) Acquisition
Power delay profile (PDP) is widely used to describe the power of multipath components (MPCs) with propagation delay. The instantaneous PDP can be expressed by the CIR as follows [21]:
Measurement samples during each distance point were averaged to obtain the APDP. The process is as follows:
where is the average number of samples in the time domain from Table 1.
3. Channel Characteristics Analysis
3.1. Multipath Component Extraction
Multipath is a parameter worthy of attention in channel measurements, especially in forested environments, due to a lack of research. The number of MPCs is calculated based on the APDP.
Figure 6a shows the result of 1000 consecutive PDPs continuously collected at a distance of 70 m under the 380 MHz condition. MPCs mainly exist in a delay range due to the propagation loss, so a practical range is necessary [13]. We display the PDP starting from the strongest path with a 3000 ns effective range to observe the stability and reliability of data. We obtained multipaths by performing peak detection after setting dynamic thresholds [22], and we used a 3 dB [23] threshold to eliminate fake MPCs caused by noise fluctuations. Obvious MPCs could be found, and the multipath components were stable. Figure 6b shows the results of multipath extraction for a single APDP. The multipath component in the triangle in the figure has stable energy fluctuations near the average value, and the energy fluctuates significantly in the noise floor range. The averaged PDP has six multipaths, and continuous PDP slice correspondence shows that the APDP can effectively characterize multipath characteristics.
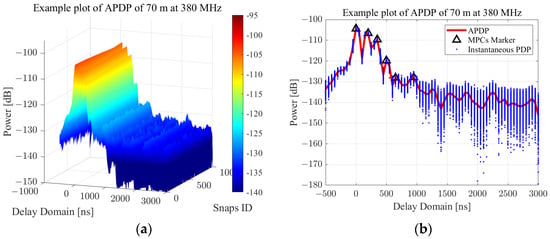
Figure 6.
(a) The 380 MHz PDP within 3000 ns effective range at 70 m. (b) Single APDP for multipath extraction.
Figure 6b displays the results of extracting MPCs from the APDP. It can be observed that six multipaths were identified and marked by triangular symbols. The blue dots represent the energy of instantaneous 1000 PDPs. The floating offset values of multipath power are within 3 dB, indicating the stability of the MPCs’ results. In contrast to Figure 6a, it is evident that the multipath power is continuous and stable at the corresponding delays.
Based on the multipath extraction results of analytical APDP, the number of multipaths changing with distance in the three frequency bands is depicted in Figure 7. It can be seen that the number of multipaths increases as the distance increases. This is obviously attributed to the forest area’s complex reflection and scattering environment conditions. However, the number of multipaths does not indicate a very high value, as shown in Figure 7. A single tree causing a 20 dB loss [7] results in the fast decay of signal energy in densely forested environments. The multipath power is close to the noise intensity, so these multipaths cannot be identified.
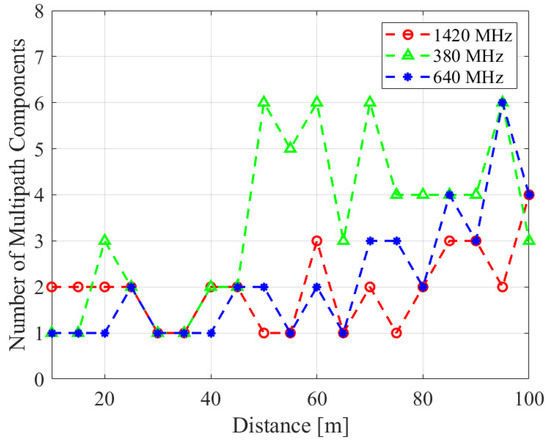
Figure 7.
The number of multipaths varying with distance at 3 frequency bands.
3.2. PDP
Based on the acquisition of the APDP mentioned above, the PDP varying with distance at the three frequency bands during this measurement is shown in Figure 8. Based on the abovementioned multipath extraction, we set the first multipath delay to 0 ns and focused on the relative delay. Characterizing the multipath distribution within a 3000 ns impact range shows that the number of multipaths gradually increases, and the multipath energy gradually decreases with increasing distance. At the same time, the number of multipaths gradually decreases as the frequency increases. The wavelength is shorter at higher frequencies, corresponding to weaker penetration capabilities, and the multipaths are more likely to be weakened and annihilated at a higher frequency band in forest areas.
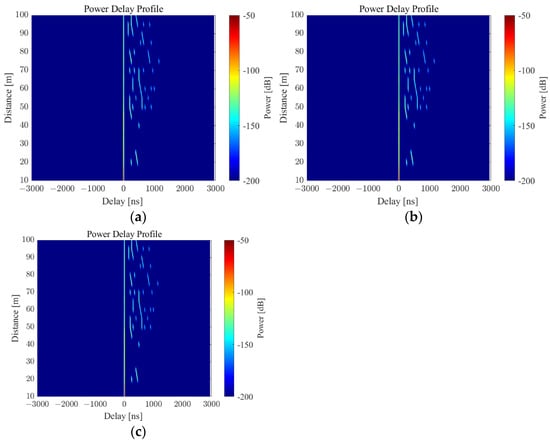
Figure 8.
PDP varying with distance at three frequency band scenarios. (a) PDP at 380 MHz. (b) PDP at 640 MHz. (c) PDP at 1420 MHz.
3.3. RMS Delay Spread
RMS delay spread is a critical parameter that measures channel time dispersion. The study of root mean square (RMS) delay spread can provide an adequate time interval reference for avoiding inter-symbol interference (ISI) in communication systems [24]. The RMS delay spread can be obtained from the MPC information as follows:
where is the multipath index, is the number of multipaths, and is the delay of the multipath. RMS delay spreads are analyzed in the logarithmic dimension due to the description in [4]. Then, empirical cumulative distribution functions (CDFs) of RMS delay spread are analyzed. The normal distribution is usually used to fit RMS delay spreads, and Table 2 shows the parameter values of the normal model established for RMS delay spread at three frequency bands. Figure 9 provides the CDF curve of RMS delay spread values and the modeled CDF curve. The fitted variance shows that the RMS delay spread is almost consistent at different frequency bands, indicating that the fluctuation of MPC characteristics is stable. The main difference comes from the mean value in different frequency bands. The fitted mean values of measurement show that RMS delay spread generally decreases with increasing frequency. Higher frequencies result in faster propagation losses of radio waves, which leads to a decrease in the number of MPCs. The decline further leads to a reduction in RMS delay spread, which varies with frequency. The measured results indicate that log-delay spread values are less than 2.27 ns, 2.10 ns, and 1.63 ns for the F1, F2, and F3 cases with a probability of 90%, respectively.
Table 2.
Fitting results in three frequency bands.
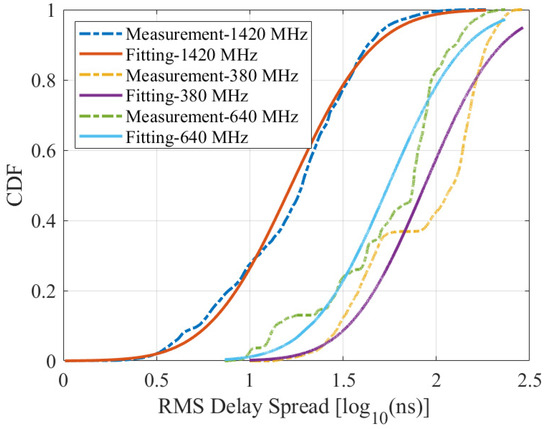
Figure 9.
CDF distribution of RMS delay spread in three frequency bands.
3.4. Path Loss
PL refers to the energy loss after the signal propagates through the wireless channel [25]. It can be calculated by the PDP. The power of MPCs is considered to avoid the impact of noise, and then PL can be obtained by summing the power of MPCs as follows:
where and represent the antenna gain of the end and end, respectively. Only antenna gains need to be calibrated here because the amplitude response of the system has been calibrated during the acquisition of the CTF.
The FSPL model is widely used to describe PL, which represents an ideal propagation situation in the LOS scenario, and it is shown below:
where is the distance and is the carrier frequency. Due to the fundamental assumption of the FSPL model that there are no obstacles along the signal propagation path, shadow fading (SF) is not considered. In the existing standard protocols, 3GPP defines a rural macro (RMa) scenario similar to this article and provides two path loss models under LOS and NLOS propagation conditions. The specific formula can be found in [4].
Traditional modeling generally employs floating intercept (also known as the AB model) and close-in (CI) models [26] to fit the PL. Compared with the AB model, the CI model has a fixed intercept, resulting in a more extensive root mean square error and poorer applicability [27]. The intercept and slope of the AB model are both variables to be estimated, which enjoy a more robust adaptability for dense forest scenes with faster fading. Considering the multi-frequency measurement in our work, we built an alpha–beta–gamma (ABG) model, an extension of the AB model [28], to perform data fitting on the measurement results and conduct a comparative analysis with the existing model. The ABG model is shown as follows:
where , , and represent logarithmic slope, floating offset, and frequency dependence, respectively. measures the decay rate of PL with distance, and characterizes the dynamic relationship between PL and frequency. represents the SF. The SF can be obtained by subtracting the curve fitting results from the actual test results. Compared with the traditional AB model, the ABG model introduces a third parameter, , to describe the impact of frequency on path loss. In addition, the ABG model is fitted from data in different frequency bands, and the model applies to all frequency bands tested, so the ABG model parameters in different frequency bands are consistent. However, the fitted curve differs across frequencies, resulting in different shadow fadings.
The PL results calculated at the three frequency bands and the fitted ABG model are shown in Figure 10. In addition, we display the FSPL model and PL model of the 3GPP RMa scenario in the F3 band to compare with the established model. The parameters of the model are shown in Table 3. represents the shadow fading standard deviation. As shown in the figure, it can be found that the PL increases with the increases in distance and frequency, comparing the measurement result data of the three frequency bands. The slope of the ABG model is 5.60, which is consistent with the forest NLOS scenario. When comparing the ABG model of F3 and the 3GPP RMa NLOS scenario, it was found that the PL was much larger than the standard model. This was attributed to the high loss caused by a high density of trees. In the fitting results of the SF at three frequency bands, the F2 case was slightly larger. This is due to the strong shadowing at some distance sampling points. This causes a locally larger PL and causes a greater fluctuation. The variance in SF is larger for three frequency bands, consistent with the NLOS case in 3GPP, which represents a relatively unstable environment. In summary, the model established in the three frequency bands matches the high-loss characteristics of the forested scene well.
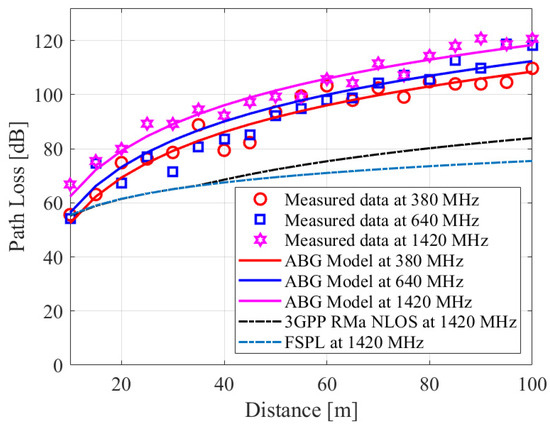
Figure 10.
PL results calculated in three frequency bands and fitted ABG model.
Table 3.
Modeling parameters.
The analysis of channel characteristics in forest areas has practical significance. Low-frequency signals are more suitable for propagation in forest areas than high-frequency signals, and the frequency band we have chosen is the border emergency communication frequency band. Further, within our limited knowledge, we obtained a multi-frequency path loss model for longer distances in the original dense forest scenario for the first time and analyzed the relevant delay domain characteristics. After inputting the obtained large-scale path loss channel model and multipath information into the channel simulator, we can simulate the channel environment indoors in forest areas and conduct the relevant tests. This technology can be applied to simulation planning software to solve the challenge of selecting the location of communication base stations in emergency scenarios. In addition, in the internal testing and evaluation of outdoor equipment, this technology can assist in planning reasonable testing routes and plans.
4. Conclusions
In this paper, a channel measurement activity was conducted in forest scenarios at three frequency bands. We also obtained B2B calibration data of measurement system to obtain the corrected CIR. An averaging process of the CIR at each measure points was performed to obtain the APDP and we demonstrated the reliability of this process. Then, we extracted MPC information based on the APDP and presented the heatmap of the PDP at three frequency band scenarios. Additionally, RMS delay spreads were calculated and the parameters of the fitted log-normal model provided. We explained the differences in RMS delay spread fluctuation and MPC fading in forested areas due to varying frequency and distance. Based on the MPC result, we calculated the PL and established an ABG model considering frequency and distance factors. Compared with existing models, the ABG model matches the characteristics of rapid loss in forest scenarios well, and the proposal of the ABG model fills the gap in PL modeling in low-frequency forest areas. Finally, SF was calculated and modeled as a normal distribution at three frequency bands. The fitted parameters of SF demonstrate the strong fluctuation in the high instability of the forested scenarios. The measurement results can provide reliable references for the system evaluation and design of emergency communication scenarios in forest areas.
Author Contributions
Methodology, D.F.; Software, K.G.; Validation, H.M.; Formal analysis, H.C.; Writing—original draft, W.G.; Writing—review & editing, W.G. and W.C.; Supervision, Y.Y.; Project administration, R.Y., Y.S. and Y.F. All authors have read and agreed to the published version of the manuscript.
Funding
This research was funded by the National Key R&D Program of China, grant number 2023YFC3011505 and the National Key R&D Program of China, grant number 2021YFC3002103.
Data Availability Statement
Data are contained within the article.
Conflicts of Interest
Author Wei Guo was employed by Ministry of Emergency Management Big Data Center. The remaining authors declare that the research was conducted in the absence of any commercial or financial relationships that could be construed as a potential conflict of interest.
References
- Document IEEE P802.16/D3. IEEE Draft Standard for Air Interface for Broadband Wireless Access Systems. Available online: https://ieeexplore.ieee.org/document/7954064 (accessed on 15 November 2023).
- Erceg, V.; Greenstein, L.; Tjandra, S.; Parkoff, S.; Gupta, A.; Kulic, B.; Julius, A.; Bianchi, R. An empirically based path loss model for wireless channels in suburban environments. IEEE J. Sel. Areas Commun. 1999, 17, 1205–1211. [Google Scholar]
- Khaled, Z.; Ajib, W.; Mcheick, H. An Accurate Empirical Path Loss Model for Heterogeneous Fixed Wireless Networks below 5.8 GHz Frequencies. IEEE Access 2020, 8, 182755–182775. [Google Scholar] [CrossRef]
- Document TR 38.901 V17.0.0, 3GPP. Study on Channel Model for Frequencies From 0.5 to 100 GHz. 2022. Available online: https://portal.3gpp.org/desktopmodules/Specifications/SpecificationDetails.aspx?specificationId=3173 (accessed on 24 November 2023).
- Document ITU-R M, 1225. Guidelines for Evaluation of Radio Transmission Technologies for IMT-2000. Available online: https://www.itu.int/dms_pubrec/itu-r/rec/m/R-REC-M.1225-0-199702-I!!PDF-E.pdf (accessed on 22 November 2023).
- Hata, M. Empirical formula for propagation loss in land mobile radio services. IEEE Trans. Veh. Technol. 1980, 29, 317–325. [Google Scholar] [CrossRef]
- Document ITU-R P.833-10. Attenuation in Vegetation. Available online: https://www.itu.int/rec/R-REC-P.833/en (accessed on 27 September 2021).
- Zhang, Y.; Anderson, C.; Michelusi, N.; Love, D.; Baker, K.; Krogmeier, J. Propagation Modeling Through Foliage in a Coniferous Forest at 28 GHz. IEEE Wirel. Commun. Lett. 2019, 8, 901–904. [Google Scholar] [CrossRef]
- Xiao, Z.; Sun, S.; Liu, Z.; Xu, L.; Huang, W.; Wang, L.; Fei, A. Propagation Path Loss Models in Forest Scenario at 605 MHz. In Proceedings of the 2022 IEEE 96th Vehicular Technology Conference (VTC2022-Fall), London, UK, 26–29 September 2022. [Google Scholar]
- Nowak, T.; Hartmann, M.; Zech, T.; Thielecke, J. A path loss and fading model for RSSI-based localization in forested area. In Proceedings of the 2016 IEEE-APS Topical Conference on Antennas and Propagation in Wireless Communications (APWC), Cairns, QLD, Australia, 19–23 September 2016. [Google Scholar]
- Matolak, D.; Yang, F.; Riley, H. Short range forest channel modeling in the 5 GHz band. In Proceedings of the 2012 6th European Conference on Antennas and Propagation (EUCAP), Prague, Czech Republic, 26–30 March 2012; pp. 3337–3341. [Google Scholar]
- Bultitude, R.; Jong, Y.; Pugh, J.; Salous, S.; Khokhar, K. Measurement and Modelling of Emergency Vehicle-to-Indoor 4.9 GHz Radio Channels and Prediction of IEEE 802.16 Performance for Public Safety Applications. In Proceedings of the 2007 IEEE 65th Vehicular Technology Conference (VTC), Dublin, Ireland, 22–25 April 2007; pp. 397–401. [Google Scholar]
- Voldhaug, J.; Bråten, L.; Sander, J. Deployable WiMAX in a forest area; channel measurements and modelling. In Proceedings of the Military Communications Conference (MILCOM), San Jose, CA, USA, 31 October–3 November 2010; pp. 2400–2405. [Google Scholar]
- Javali, S.; Torabi, A.; Zekavat, S. Snow covered forest channel modeling for near-ground Wireless Sensor Networks. In Proceedings of the 2017 IEEE International Conference on Wireless for Space and Extreme Environments (WiSEE), Montreal, QC, Canada, 10–12 October 2017; pp. 69–74. [Google Scholar]
- Chen, H.; Ai, B.; Fei, D.; Guan, K.; An, H. Channel Measurement and Analysis at Emergency Frequency Band in Primeval Forest. In Proceedings of the 2023 IEEE International Symposium on Antennas and Propagation and USNC-URSI Radio Science Meeting (USNC-URSI), Portland, OR, USA, 23–28 July 2023; pp. 409–410. [Google Scholar]
- Zhang, Z.; Liu, Y.; Huang, J.; Zhang, J.; Li, J.; He, R. Channel Characterization and Modeling for 6G UAV-Assisted Emergency Communications in Complicated Mountainous Scenarios. Sensors 2023, 23, 4998. [Google Scholar] [CrossRef] [PubMed]
- Zhang, J.; Liu, Y.; Huang, J.; Chang, H.; Zhang, Z.; Li, J. Channel Modeling and Characteristics Analysis under Different 3D Dynamic Trajectories for UAV-Assisted Emergency Communications. Sensors 2023, 23, 5372. [Google Scholar] [CrossRef] [PubMed]
- Han, B.; Qin, D.; Zheng, P.; Ma, L.; Teklu, M.B. Modeling and performance optimization of unmanned aerial vehicle channels in urban emergency management. ISPRS Int. J. Geo-Inf. 2021, 10, 478. [Google Scholar] [CrossRef]
- Samad, M.; Choi, D.; Choi, K. Path loss measurement and modeling of 5G network in emergency indoor stairwell at 3.7 and 28 GHz. PLoS ONE 2023, 18, e0282781. [Google Scholar] [CrossRef]
- Samad, M.; Choi, D.; Son, H.; Choi, K. Analysis of Centimeter and Millimeter-Wave Path Loss at Emergency Exit. IEEE Access 2023, 11, 34217–34226. [Google Scholar] [CrossRef]
- Yang, J.; Ai, B.; Salous, S.; Guan, K.; He, D.; Shi, G.; Zhong, Z. An Efficient MIMO Channel Model for LTE-R Network in High-Speed Train Environment. IEEE Trans. Veh. Technol. 2019, 68, 3189–3200. [Google Scholar]
- Yu, J.; Chen, W.; Li, F.; Li, C.; Yang, K.; Liu, Y.; Chang, F. Channel Measurement and Modeling of the Small-Scale Fading Characteristics for Urban Inland River Environment. IEEE Trans. Wirel. Commun. 2020, 19, 3376–3389. [Google Scholar] [CrossRef]
- Fang, C.; Allen, B.; Liu, E.; Karadimas, P.; Zhang, J.; Glazunov, A.; Tufvesson, F. Indoor-indoor and indoor-outdoor propagation trial results at 2.6 GHz. In Proceedings of the 2012 Loughborough Antennas & Propagation Conference (LAPC), Loughborough, UK, 12–13 November 2012. [Google Scholar]
- Yang, M.; Ai, B.; He, R.; Wang, G.; Chen, L.; Li, X.; Huang, C.; Ma, Z.; Zhong, Z.; Wang, J.; et al. Measurements and cluster-based modeling of vehicle-to-vehicle channels with large vehicle obstructions. IEEE Trans. Wirel. Commun. 2020, 19, 5860–5874. [Google Scholar] [CrossRef]
- Yang, M.; Ai, B.; He, R.; Ma, Z.; Mi, H.; Fei, D.; Zhong, Z.; Li, Y.; Li, J. Dynamic V2V Channel Measurement and Modeling at Street Intersection Scenarios. IEEE Trans. Antennas Propag. 2023, 71, 4417–4432. [Google Scholar]
- Kim, M.; Liang, J.; Lee, J.; Park, J.; Park, B. Path loss measurements and modeling for indoor office scenario at 28 and 38 GHz. In Proceedings of the 2016 International Symposium on Antennas and Propagation (ISAP), Okinawa, Japan, 24–28 October 2016. [Google Scholar]
- Thomas, T.; Rybakowski, M.; Sun, S.; Rappaport, T.; Nguyen, H.; Kovacs, I.; Rodriguez, I. A Prediction Study of Path Loss Models from 2–73.5 GHz in an Urban-Macro Environment. In Proceedings of the 2016 IEEE 83rd Vehicular Technology Conference (VTC Spring), Nanjing, China, 15–18 May 2016. [Google Scholar]
- Huang, F.; Tian, L.; Zheng, Y.; Zhang, J. Propagation Characteristics of Indoor Radio Channel from 3.5 GHz to 28 GHz. In Proceedings of the 2016 IEEE 84th Vehicular Technology Conference (VTC-Fall), Montreal, QC, Canada, 18–21 September 2016. [Google Scholar]
Disclaimer/Publisher’s Note: The statements, opinions and data contained in all publications are solely those of the individual author(s) and contributor(s) and not of MDPI and/or the editor(s). MDPI and/or the editor(s) disclaim responsibility for any injury to people or property resulting from any ideas, methods, instructions or products referred to in the content. |
© 2024 by the authors. Licensee MDPI, Basel, Switzerland. This article is an open access article distributed under the terms and conditions of the Creative Commons Attribution (CC BY) license (https://creativecommons.org/licenses/by/4.0/).