Abstract
Similarly to the majority of deep learning applications, diagnosing skin diseases using computer vision and deep learning often requires a large volume of data. However, obtaining sufficient data for particular types of facial skin conditions can be difficult, due to privacy concerns. As a result, conditions like rosacea are often understudied in computer-aided diagnosis. The limited availability of data for facial skin conditions has led to the investigation of alternative methods of computer-aided diagnosis. In recent years, generative adversarial networks (GANs), mainly variants of StyleGANs, have demonstrated promising results in generating synthetic facial images. In this study, for the first time, a small dataset of rosacea with 300 full-face images was utilized to further investigate the possibility of generating synthetic data. Our experimentation demonstrated that the strength of regularization is crucial for generating high-fidelity rosacea images using a few hundred images. This was complemented by various experimental settings to ensure model convergence. We successfully generated 300 high-quality synthetic images, significantly contributing to the limited pool of rosacea images for computer-aided diagnosis. Additionally, our qualitative evaluations by 3 expert dermatologists and 23 non-specialists highlighted the realistic portrayal of rosacea features in the synthetic images. We also provide a critical analysis of the quantitative evaluations and discuss the limitations of solely relying on validation metrics in the field of computer-aided clinical image diagnosis.
1. Introduction
Computer-aided diagnosis of skin diseases has become more popular since the introduction of Inception v3 [1] that achieved a performance accuracy of 93.3% [2] in classifying various cancerous skin conditions. A large dataset with approximately 129,450 images was utilized to develop a skin cancer classification model with Inception v3 [1]. However, gathering such a large amount of data is not feasible for some skin conditions such as rosacea. Although many skin conditions can lead to fatal consequences, cancer has been considered the most serious of all and has motivated the gathering of the most data over time. As a result, many teledermatology [3] websites have a substantial amount of skin cancer images. On the other hand, there is very limited data for non-fatal chronic skin conditions such as rosacea. Deep convolutional neural networks (DCNNs), e.g., Inception v3, perform relatively well when provided with a large training dataset [4]. However, their performance significantly degrades in the absence of large amounts of data. A possible solution is to utilize a small amount of the available data by leveraging the concept of generative adversarial networks (GANs) [5] to generate synthetic images. Synthetic images can aid in expanding a small dataset significantly, potentially enabling more effective training of DCNNs. Generating synthetic datasets for diseases may also help educate non-specialist populations, to create awareness and improve publicity.The generation of synthetic data using deep generative algorithms, mirroring the characteristics of authentic data, is an innovative approach to circumventing data scarcity [6]. This research aims to generate synthetic images by means of expanding a small dataset for the rosacea skin condition using a variant of the StyleGAN architecture [7] trained with only 300 images of rosacea.
1.1. A Brief Introduction to Skin Diseases and Rosacea
The observational and analytical complexities of skin diseases are challenging aspects of diagnosis and treatment. In most cases, at the early stage, skin diseases are examined visually. Depending on the complexity of the early examination and severity of the disease, several different clinical or pathological measures using images of the affected region may be followed. These include dermoscopic analysis, biopsy, and histopathological examination. Depending on the nature of the skin disease, whether it is acute or chronic, the diagnosis and treatment may be time-consuming.
Rosacea is a chronic facial skin condition and a cutaneous vascular disorder that goes through a cycle of fading and relapse [8,9]. It is a common skin condition in native people from northern countries with fair skin or with Celtic origins [10]. Rosacea is often characterised by signs of facial flushing and redness, inflammatory papules and pustules, telangiectasias, and facial edema. The symptom severity varies greatly among individuals [11]. In the medical diagnostic approach, rosacea is classified into four subtypes—subtype 1 (Erythematotelangiectatic rosacea), subtype 2 (Papulopustular Rosacea), subtype 3 (Phymatous Rosacea), and subtype 4 (Ocular Rosacea). Each subtype may be further classified based on the severity of the condition, e.g., mild, moderate, or severe [9,12]. For this study, we considered subtype 1 and subtype 2, due to their progressive nature and tendency to intensify if remaining untreated, with subtype 1 often transitioning into subtype 2. This progression makes these subtypes particularly relevant for study. Additionally, other subtypes do not exhibit similar patterns in localized facial areas, which is crucial for our synthetic image generation process. Including other subtypes might hinder or mislead the generation, as they manifest differently on the face, thus not aligning with our study’s focus on localized symptom representation.
There are only a few hundred images publicly available for analysis and diagnosis of rosacea [13]. Among the available images, only a small number have full-face visibility. Some of the datasets with full-face visibility are watermarked, which does not satisfy our selection criteria, as discussed further in Section 3.3.1 and Section 3.3.2. There are a few teledermatology websites that have images of rosacea publicly available for research, namely Dermatology ATLAS [14], DanDerm [15], DermIS [16], DermNetNZ [17], Dermatoweb.net [18], and Hellenic Dermatological Atlas [19].
Compared to recent studies published on skin cancer classification, which all used an adequate number of images, there is a very limited number of annotated rosacea images. This introduces a significant challenge for the dataset split (train, validation, and test) needed when training deep learning models.
1.2. Contribution
A primary research gap in computer-aided rosacea diagnosis is the limited access to a sufficient number of rosacea images for analysis and classification. This limitation prompted the exploration of techniques to leverage small datasets for specific disease categories, such as rosacea. In this study, we present a standardized approach to data preparation for rosacea skin, emphasizing full-face images. This comprehensive view is crucial, as rosacea is not confined to specific areas but progresses across the entire face, including the cheeks, forehead, and beyond. Notably, previous studies did not adhere to this standardized approach in their dataset preparation and generation. Consequently, this work delves into the potential of GANs to generate a synthetic dataset of full faces with rosacea from a scarce/small dataset with 300 images.
However, another research gap and challenge arises when generating synthetic datasets using GANs. Due to their inherent nature, GANs often struggle to converge using small-scale datasets, especially when the dataset size is in the order of hundreds. This highlights the complexities of synthetic image generation in data-scarce scenarios. To address this challenge, we delved into the theoretical understanding of one of the crucial factors impacting convergence: the cost function, which is regulated by regularization. We further complemented our approach with rigorous experimentation.
We emphasize that regularization plays a pivotal and indispensable role in facilitating GAN convergence, particularly when working with limited data. This insight is not only significant but also transformative for the field, presenting a potential solution to one of the most pressing challenges in GAN-based synthetic image generation for clinical images with limited data.
While the StyleGAN2-ADA [20] demonstrated model convergence with at least of 1000 images, we elucidate the profound impact of fine-tuning the StyleGAN2-ADA model and varying experimental settings on the fidelity of the generated rosacea features. This emphasizes the nuances of model optimization in contexts with limited data. This exploration may prove helpful in low-data regimes in medical image analysis.
To summarize, our contributions are as follows:
- 1.
- In this study, to the best of our knowledge, for the first time, a small dataset of rosacea with 300 full-face images was utilized for synthetic image generation;
- 2.
- We discuss and demonstrate that the strength of regularization facilitated convergence in the GAN model using only 300 images, while achieving high-fidelity characteristics of the rosacea condition;
- 3.
- We show how fine-tuning the model (StyleGAN2-ADA) and varying experimental settings significantly affected the fidelity of rosacea features;
- 4.
- We generated 300 high-fidelity synthetic full-face images with rosacea, which could be further utilized to expand the rosacea face dataset for computer-aided clinical diagnosis;
- 5.
- We present qualitative evaluations of synthetic/generated faces by expert dermatologists and non-specialist participants, and these show the realistic characteristics of rosacea in generated images;
- 6.
- We critically analyse our quantitative evaluation such as the validation metrics(s) from the list of conducted experiments and point out the limitations of the usage of validation metric(s) alone as evaluation criteria in computer-aided medical image diagnosis field.
2. Background and Related Work
2.1. Related Work on Rosacea Diagnosis and StyleGAN2-ADA
There have been a few noteworthy works conducted on rosacea by Thomsen et al. [21], Zhao et al. [22], Zhu et al. [23], Binol et al. [24], and Xie et al. [25], with significant quantities of data collected from dermatology departments in hospitals. However, the datasets used in these studies were entirely confidential. In these studies, the early detection problem of rosacea was addressed by performing ‘image classification’ among different subtypes of rosacea and other common skin conditions. The classifier was trained using data augmentation and transfer learning from the pretrained weights of ImageNet. In total, over 10,000 images were used in these studies, along with transfer learning. Transfer learning works well when a significant number of images are available, typically over 1000. Following the previous studies mentioned, Mohanty et al. [13] conducted several experiments on full-face rosacea image classification using Inception v3 [1] and VGG16 [26]. In their experiments, the aforementioned deep learning models tended to overfit during training and validation, due to insufficient data.
Although there have been a few studies [27,28,29,30,31,32] on generating synthetic images of skin cancer lesions using various types of GANs architecture, the images were captured through a dermatoscope and other imaging devices that focus only on a specific locality i.e., cancerous regions of the skin. Carrasco et al. [33] and Cho et al. [34] explored the generation of cancerous skin lesion images using the StyleGAN2-ADA architecture. Carrasco et al. [33] employed a substantial dataset comprising 37,648 images in both conditional and unconditional settings. On the other hand, Cho et al. [34] focused on creating a melanocytic lesion dataset using non-standardized Internet images, annotating approximately 500,000 photographs to develop a diverse and extensive dataset.
In the study of Carrasco et al. [33], to address scenarios where hospitals lack large datasets, a simulation involving three hospitals with varying amounts of data was proposed, using federated learning to synthesize a complex, fair, and diverse dataset collaboratively. They utilized the EfficientNetB2 model for classification tasks and conducted expert assessments on 200 images to determine if they were real or synthetically generated by the conditionally trained StyleGAN2-ADA. In their study, the main insights included recognizing the dependency of the chosen architectures on computational resources and time constraints. Unconditional GANs were noted as beneficial for fewer classes, due to the lengthy training required for a single GAN. When a large annotated dataset is available, central training of GAN is preferable. However, for institutions with data silos, the benefits of federated learning are particularly notable, especially for smaller institutions. The study also underscored the importance of a multifaceted inspection of the synthetic data created.
The main objective of Cho et al’s [34] study was to explore the possibility of image generation using images scrapped from various online sources where data are not structured. They created a diverse LESION130k dataset of potential lesions and generated 5000 synthetic images with StyleGAN2-ADA, illustrating the potential of AI in diversifying medical image datasets from various sources. The goal was to investigate image generation from unstructured data scraped from the internet. The team created the LESION130k dataset and 5000 synthetic images using StyleGAN2-ADA, demonstrating AI’s capacity to diversify medical image datasets. They then evaluated the model’s performance using an EfficientNet Lite0 and a test set of 2312 images from seven well-known public datasets to identify malignant neoplasms.
However, there have been no studies that utilized StyleGAN2-ADA for skin disease involving full-face images, especially when available only in limited numbers. In contrast, the rosacea dataset used in our study contains full-face images. Hence, the modalities of skin cancer images and full-face images with rosacea are entirely different. An important reason to consider a full-face image for rosacea analysis is that different subtypes of the disease can affect multiple parts of the face. The impact of rosacea on facial skin can be assessed by considering different local regions of the skin and diagnosing the subtype of rosacea.
2.2. Related Work on Synthetic Facial Image Generation
The first facial image generator using generative adversarial networks (GANs) was designed by Goodfellow et al. [5] in 2014. The generated synthetic faces were very noisy and required more work to make them convincing. Later, in 2015, deep convolutional GANs (DCGANs) [35] were introduced and used 350,000 face images without any augmentation. DCGANs came with some notable features that resulted in better synthetic faces, such as
- Improved architectural topology;
- Trained discriminators;
- Visualization of filters;
- Generator manipulation.
However, the DCGAN model had some limitations, noticeable in
- Model instability;
- Mode collapse;
- Filter leakage after a longer training time;
- Small resolutions of generated images.
These limitations strongly influenced the topics of future work on GANs.
The progressive growing of GANs (ProGANs) introduced by Karras et al. [36], improved the resolution of the generated images with a stable and swifter training process. The main idea of ProGANs is to start from a low resolution, e.g., 4 × 4, and then progressively increase the resolution, e.g., up to 1024 × 1024, by adding layers to the networks. The training time is 2–6 times faster depending on the desired output resolution. ProGANs could generate 1024 × 1024 facial images using the CelebA-HQ [36] dataset with 30,000 selected real images in total. The idea of ProGAN emerged from one of the GAN architectures introduced by Wang et al. [37]. Although ProGAN successfully generated facial images with large resolution, it did not function adequately in generating realistic features and microstructures.
Although the generation of high-resolution images was achieved using GANs, there were still indispensable research gaps that needed to be addressed. Thus, the introduction of StyleGAN [7] allowed further improvements which helped in understanding various characteristics and phases in synthetic image generation/image synthesis. Important improvements with the StyleGAN architecture included
- Upgrading the number of trainable parameters in style-based generators; this is now 26.2 million, compared to 23.1 million parameters in the ProGAN [36] architecture;
- Upgrading the baseline using upsampling and downsampling operations, increasing the training time and tuning the hyperparameters;
- Adding a mapping network and adaptive instance normalization (AdaIN) operations;
- Removing the traditional input layer and starting from a learned constant tensor that is 4 × 4 × 512;
- Adding explicit uncorrelated Gaussian noise inputs, which improves the generator by generating stochastic details;
- Mixing regularization, which helps in decorrelating the neighbouring styles and taking control of fine-grained details in the synthetic images.
In addition to the improvements in generating high-fidelity images, StyleGAN introduced a new dataset of human faces called Flickr Faces HQ (FFHQ). FFHQ has 70,000 images at 1024 × 1024 resolution and has a diverse range of ethnicities, ages, backgrounds artifacts, make-up, lighting, image viewpoints, and various accessories such as eyeglasses, hats, sunglasses, etc. Based on these improvements, comparative outcomes were evaluated using a metric called Fréchet inception distance (FID) [38] on two datasets, i.e., CelebA-HQ [36] and FFHQ. Recommended future investigations include separating high-level attributes and stochastic effects, while achieving linearity of the intermediate latent space.
Successively, another variant of StyleGAN was introduced by Karras et al., called StyleGAN2 [39], in which the key focus was exclusively on the analysis of the latent space W. As the generated output images from StyleGAN contained some unnecessary and common blob-like artifacts, StyleGAN2 addressed the causes of these artifacts and eliminated them by defining some changes in the generator network architecture and in the training methods. Hence, the generator normalization was redesigned, and the generator regularization was redefined to boost conditioning and to improve output image quality. The notable improvements in the StyleGAN2 architecture include
- The presence of blob-like artifacts such as those in Figure 1 is solved by removing the normalization step from the generator (generator redesign);
 Figure 1. An example of blob-like artifacts in the generated images. This image was taken from Karras et al. [39] indicates that the figure is demonstrating a common issue in image generation, where unintended and irregularly shaped distortions—referred to as “blob-like artifacts” — appear in the output. These artifacts are typically the result of imperfections in the image generation process, which could be due to a variety of factors like model training deficiencies, data quality issues, or algorithmic limitations. The highlighted areas in red show where these artifacts have occurred across different images, pointing out the flaws that can arise when using generative models for creating synthetic images.
 - Grouped convolutions are employed as a part of weight demodulation, in which weights and activation functions are temporarily reshaped. In this setting, one convolution sees one sample with N groups, instead of N samples with one group;
- Adaption of lazy regularization, in which regularization is performed only once in 16 mini-batches. This reduces the total computational costs and the memory usage;
- Adding a path length regularization aids in improving the model reliability and performance. This offers a wide scope for exploring this architecture at the latter stages. Path length regularization helps in creating denser distributions, without mode collapse problems;
- Revisiting the ProGAN architecture to adapt benefits and remove drawbacks, e.g., progressive growing in the residual block, of the discriminator network.
The datasets LSUN [40] and FFHQ were used with StyleGAN2 to obtain quantitative results through metrics such as FID [38], perceptual path length (PPL) [7], and precision and recall [41].
Another set of GAN architectures called BigGAN and BigGAN-deep [42] expanded the variety and fidelity of the generated images. These improvements included making architectural changes that improved scalability, and a regularization scheme to recuperate conditioning as well as to boost performance. The above modifications gave a lot of freedom to apply the “truncation trick”, a sampling method that aids in controlling the sample variety and fidelity in the image generation stage. Even though different GAN architectures produced improved results over a period, model instability during training was a common problem in large-scale GAN architectures [43]. This problem was investigated and analyzed through the introduction of BigGAN by leveraging existing techniques and by presenting novel techniques. The ImageNet ILSVRC 2012 dataset [44] with resolutions 128 × 128, 256 × 256, and 512 × 512 was used in BigGAN and BigGAN-deep architectures to demonstrate quantitative results through metrics such as FID and inception score (IS) [45].
The aforementioned GAN architectures were trained on a large amount of data and can generate high-resolution outputs with variety and a fine-grained texture. Although a large amount of data helps GAN models to learn and generate more realistic-looking synthetic images, it is not possible to acquire a large amount of data for certain fields/domains. For example, in the medical/clinical imaging domain, it is hard to acquire a large number of images for each disease case. Therefore, it is important to expand the potential of GAN architectures to perform well and produce high-fidelity synthetic images, even if there are limited images available.
However, the key problem with having a small number of images is the overfitting of training examples in the discriminator network. Hence, the training process starts to diverge, and the generator does not generate anything meaningful because of overfitting. The most common strategy for tackling overfitting in deep learning models is “data augmentation”. There are instances in which augmentation functions learn to generate the augmented distribution, which results in “leaking augmentations” in the generated samples. These leaking augmentations are the features that are learned from the augmentation style rather than the features that are originally present in the real dataset.
Hence, to prevent the discriminator from overfitting when there is only limited data available, a variant of StyleGAN2 called StyleGAN2-ADA [20] was introduced with a wide range of augmentations. An adaptive control scheme was presented, in order to prevent such augmentations from leaking in the generated images. This work produced promising results in generating high-resolution synthetic images obtained with a few thousand images. The significant improvements of StyleGAN2-ADA include
- Stochastic discriminator augmentation is a flexible method of augmentation that prevents the discriminator from becoming overly confident by showing all the applied augmentation to the discriminator. This assists in generating the desired outcomes;
- The addition of adaptive discriminator augmentation (ADA), through which the strength of augmentation ‘p’ can be adjusted at every interval of four mini-batches N. This technique helps in achieving convergence during training without the occurrence of overfitting, irrespective of the volume of the input dataset;
- Invertible transformations are applied to leverage the full benefit of the augmentation. The proposed augmentation pipeline contains 18 transformations grouped in 6 categories, viz. pixel blitting, more general geometric transformations, colour transforms, image-space filtering, additive noise, and cutout;
- The capability to handle small-volume datasets, such as the 1000 and 2000 images from FFHQ dataset, 1336 images of METFACES [46], 1994 overlapping cropped images from 162 breast cancer histopathology images called BRECAHAD [47], nearly 5000 images of AFHQ, and 50,000 images of CIFAR-10 [48].
- Although the small volume of the dataset is the main feature in the StyleGAN2-ADA, some high-volume datasets are broken down into different sizes for monitoring the model performance. The FFHQ dataset is used for training the model. Various subsets of the dataset such as 140,000, 70,000, 30,000, 10,000, 5000, 2000, and 1000 are used to test the performance. Similarly, the dataset LSUN CAT is considered with the volume starting from 200 k to 1 k for model evaluation. FID is used as an evaluation metric for comparative analysis and the demonstration of StyleGAN2-ADA model performance.
Amongst the studies and related work regarding face generation using GANs, as discussed above and represented in Figure 2, StyleGAN2-ADA appeared to work adequately with a small volume of data. Especially in the case of small volumes of medical/clinical images, StyleGAN2-ADA is a useful method for investigation. Considering the advantages of StyleGAN2-ADA, in this research, we implemented and trained a model with 300 images of rosacea, which will be discussed in Section 4.
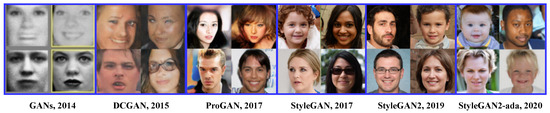
Figure 2.
Progress in synthetic face generation using various GAN models with the maximum volume of dataset available.
3. Methodology
3.1. StyleGAN2 with Adaptive Discriminator Augmentation
The above analysis of the state-of-the-art techniques indicated that StyleGAN2-ADA can potentially be used to address the data scarcity of rosacea by generating synthetic samples.
The most attractive point of StyleGAN2-ADA is its ability to handle a small amount of data, in fact the minimum is 1000 images. This is achieved by utilizing the concept of adaptive discriminator augmentation (ADA).
The concept of ADA is motivated by three well-known limitations of GAN models [5,49]:
- 1.
- Difficulty in handling small amounts of data;
- 2.
- Discriminator overfitting, which leads to mode collapse;
- 3.
- Sensitivity to the selection of hyperparameters.
Generally, when condition 1 exists, it is more probable for condition 2 to occur, and when both exist, this leads to catastrophic failure in most GAN models. Nevertheless, when limited data are available, one possible solution for overfitting is “data augmentation”. Data augmentation helps in expanding the input images by applying temporary alterations, such as geometric transformations and preprocessing tasks. This practice helps in increasing the input feature space during training.
However, these augmentations can have negative effects, as most of the existing GAN models augment the real images and the discriminator learns that the augmented images are part of the real image distribution that should be adapted for generating synthetic images [50]. Hence, the generator learns to produce images with undesired augmentation artifacts such as noise, colour, cutout, and geometric operations. This learning practice and producing images with undesired augmentation artifacts are called “leaky augmentations”.
A wide range of augmentations may be used to stop the discriminator from overfitting, while ensuring that applied augmentations do not leak into the resulting generated images. In addition, an adaptive control procedure may enable the model to function effectively, irrespective of the volume of training data, the dataset’s nature/characteristics, and the training approach.
Overfitting in various GAN models, especially in the variants of StyleGANs, can be observed when the value of the Fréchet inception distance (FID) [38] metric starts to increase without any decline, leading to leakage in the augmentations. To prevent such behaviour, a pipeline known as “stochastic discriminator augmentation” was introduced. This approach is inspired by the balanced consistency regularization (bCR) approach by Zhao et al. [51], designed to prevent leaking of the augmentations. Stochastic discriminator augmentation is a flexible type of augmentation that prevents the discriminator from becoming overly confident by showing all the applied augmentation to the discriminator. The discriminator is evaluated based on the augmented images, using the same augmentation as applied when training the generator. In this practice, the discriminator can see the training images, which assists the generator in generating the desired ideal outcome. Figure 3 shows the workflow of stochastic discriminator augmentation.
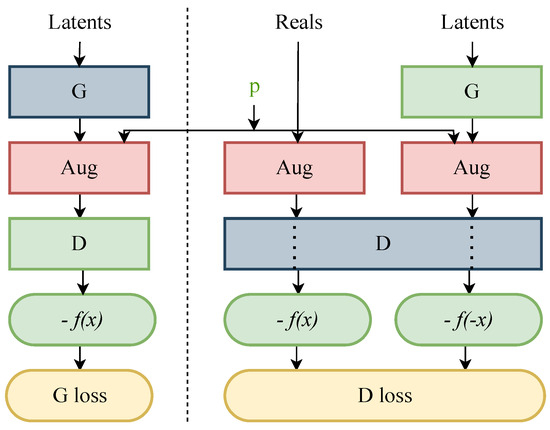
Figure 3.
Flow diagram of stochastic discriminator augmentation [20], where G is the generator and D is the discriminator. The red boxes represent the 18 augmentation operations. The set of selected augmentation are controlled by the augmentation probability ‘p’ and these augmentations are visible to the discriminator D in the green box. The blue boxes represent the networks that are trained during the training process. The outcomes −f(x) and −f(−x) in the green boxes indicate the discriminator’s assessment of the images, which contributes to the calculation of the GAN’s loss functions, such as the G loss and D loss, shown in yellow boxes. In this set up, the non-saturating logistic loss is accommodated to calculate the final probability of the images being predicted as fake.
Similarly, in order to regulate the distribution in the generated images, the concept of invertible transformation is used. Invertible transformations are beneficial when applying a wide range of augmentations; for example, 18 types (clustered into 6 categories) of augmentations are used. Invertible transformation in the augmentation can be defined as “for a target distribution y and an augmentation operator T, the generated distribution x is trained such that the augmented distributions match with the target distribution y” [20]. If a transformation is non-invertible, there will be leakage, but if all the transformations are invertible, there will be no leakage. Invertible transformations can be reversed by the generator and removed from the distribution, while non-invertible ones cannot be removed and can result in leakage. The generator network learns to generate the images in the correct underlying distribution by undoing any augmentation that does not fit the right kind of distribution. Hence, applying this concept of invertible transformation in augmentation [52] helps with determining the correct target distribution for the data.
Another trick used to prevent leaking is to apply different augmentations in a particular fixed order; for example, blitting, geometry, and colour. Therefore, a sequential composition of augmentations that do not leak will ensure no leakage to the generated images.
Although the invertible transformation process prevents the augmentation from leaking, at least in the very early stages of training, which is desirable, a few constraints still need to be addressed. Augmentation leaking is highly dependent on a probability value, ‘p’. Higher values of ‘p’ may confuse the generator by picking one of the random possibilities of the augmentation and image distribution; this phenomenon makes the chosen augmentations leak. If ‘p’ is under a safety limit, it is less likely to produce leaking augmentation on the generated images. To keep track of the safety limit value, an adaptive approach was introduced.
The concept of adaptive discriminator augmentation is supported by controlling the augmentation strength ‘p’ with which the augmentation is applied as the training progresses. The initial value of ‘p’ starts from 0 and is regulated every 4 mini-batches as training progresses. If overfitting occurs during the training, the p-value can be adjusted using a fixed rate. A given target value can control the strength of the p-value. This concept of setting a target value, i.e., “ADA target”, came from observing the training process and the safety limit of value ‘p’. For example, in the study by Karras et al. [20], it was observed that the FID value declined after ‘p’ became close to 0.5. Hence, the ADA target was set to 0.6. Regardless of the dataset volume, discriminator overfitting was avoided by implementing this strategy, and convergence was achieved during the training.
Despite the fact that GAN models are very sensitive towards hyperparameter selection, StyleGAN2-ADA supports a reasonable quality of results without major changes in the hyperparameters and loss functions while training from scratch or performing transfer learning.
3.2. The Impact of Regularization ‘’ for 300 Images
As discussed in Section 3.1, one of the limitations of GANs is that a small amount of data may lead to overfitting, divergence, or mode collapse. These grounds motivated our work to adopt StyleGAN2-ADA, which uses a minimum of 1000 images for experimental purposes. In this work, we used a limited amount of input images, i.e., 300 images, but with fine-grained vital features, i.e., rosacea condition. Given the limited number of images, it might be hard to retain the most important features while training the networks and generating synthetic images. Hence, it was necessary to explore the strategies that could help obtain better results, along with the adaptation of StyleGAN2-ADA.
The StyleGAN2-ADA architecture functions very well, even without changing network architectures, loss functions, or other key parameters. As GANs are sensitive to hyperparameters, in this work, most of the hyperparameters were kept unchanged, except for the regularization weight/strength ‘’. According to certain studies, regularization has a significant impact on stabilizing GAN training. Regularization helps to produce high-quality images by stabilizing a broad range of noise levels [53]. In the instance of images with a high number of features, regularization ( norm regularization) performs satisfactorily in feature selection by removing some unimportant features.
While norm regularization, known for penalizing larger errors more heavily, is widely used in image processing, it tends to retain all features with small adjustments. This can be less effective in our context, where reducing the feature space to retain only the most significant features is crucial. regularization, in contrast, is more suitable for feature selection with high-dimensional data like images, as it can shrink the coefficients of less important features to zero, effectively removing them. This property of regularization aligns better with our objective of maintaining the most relevant features in rosacea images, especially given the limited dataset size. regularization helps to prevent overfitting. To prevent overfitting due to the small volume of data, regularization extensively reduces the variance of the model, without losing important attributes in the input image features and without a significant increase in the bias in the model. On the contrary, after a certain numerical value for the strength ‘’, the model cannot capture the input images’ vital attributes. In this work, those particular numerical values of ‘’ are explored, with the aim of retaining vital details of the input images.
In GANs, the generator G and discriminator D are the two modules/networks optimized by playing a Minimax zero-sum game with each other, where the task is to learn the distribution of data. The distribution of images means the distribution of pixel values in a particular pattern that makes all the images align similarly. The task of the generator is to generate synthetic images that follow the same distribution as the input images and look similar to the input images, such that it is hard to differentiate between synthetic and real images. The task of the discriminator is to differentiate between the real input images and the synthetic images created by the generator. Hence, the key goal of the generator is to create images in such a way that the discriminator is deceived in determining the difference between real and synthetic images. These events are regulated by a cost/value function, which is optimized during the training process. Hence, the output of the discriminator is a cost function given by the negative log-likelihood of the binary discrimination task between real and synthetic images and another output is a probability of the images being real and synthetic. So, the discriminator attempts to minimize this binary discrimination error, while the generator attempts to maximize this error. The binary discriminator error is directly proportional to the network (G and D) loss. As the discriminator error is minimized, the loss (D loss) is maximised; as the generator error is maximized, the loss (G loss) is minimized, and this is the main goal of GANs. The equation below represents the cost/value function V that the GANs optimize during training. In this equation, the first term only applies to real data and the second term only applies to synthetic data. represents a real image and z represents the random input values/noise for G. The cost/value function is defined as
As the GAN concept is based on a zero-sum game, it is expected to attain a Nash equilibrium in which each player cannot reduce their cost function without changing the parameters of the other player [54]. As defined, equilibrium is a situation in which no player can improve its position by choosing an available alternative strategy(’cost function’ in this case), without implying that each player’s privately held best choice will lead to a collectively optimal result [55].
The cost/loss/value function is affected by the integrated regularization. It is necessary to achieve the lowest divergence between the training distribution and the model distribution that obtains the minimum loss at equilibrium. Despite this, it is hard to reach the closest point towards the equilibrium when the input images are in short supply. Hence, it is essential to leverage the advantage of regularization strength to achieve the minimum loss. The study by Mescheder et al. [56] stated that using regularization helps achieve stable training, as well as high-resolution image distribution for CelebA and LSUN datasets. Under suitable assumptions, regularization strength has an impact on obtaining notably better results for the generated image quality.
Regularization is added to the cost function of GANs (in Equation (2)) as
where
- is the regularization strength that decides the amount of regularization to be applied;
- is the absolute value of each weight in the model, which forces the smaller weights towards zero and hence reduces the model complexity;
- n represents the number of parameters in the model.
When the regularization term is integrated into the original cost function, the new cost function becomes
To minimize this, we need to consider both terms. When taking the derivative with respect to the parameters (for gradient descent), this will involve the derivatives of both the original cost function and the regularization term. The regularization term’s derivative has a component from the sign of the weight, enforcing the sparsity.
Using gradient descent methodologies, each parameter is iteratively adjusted using:
where
- is the learning rate determining the step size in the direction opposite to the gradient;
- is the partial derivative of the original cost function with respect to the weight .
The optimal regularization strength and learning rate need to be tuned carefully using techniques like cross-validation, to achieve a trade-off between model fit and model complexity, ensuring generalized and stable models. This nuanced interplay of mathematical operations and strategic integration of regularization in the cost function helps in achieving balanced, robust, and efficient GAN models. It is this intricate math that empowers the model to learn and generalize effectively, producing high-quality synthetic images that are nearly indistinguishable from real ones.
Hence, this work examines the effects of regularization, to find the most favourable strength ‘’ that suits the nature of our dataset, since choosing the value of ‘’ is highly dependent on the size and nature of the dataset. However, a few studies have proposed a mathematical formulation to initiate the value of ‘’ as an initial guess in Equation (5); where (in this case 512 × 512) and M is the size of the minibatch, and w and h are the number of pixels [20,53]. In the study by Mescheder et al. [57] on the impact of regularization, even though only a handful of images were used, the authors proved that an appropriate choice of leads to better convergence properties near the local Nash equilibrium, which further leads to the generation of high-fidelity images, while preserving fine-grained details learned from the input images.
3.3. Rosacea Datasets
GANs have produced impressive results, due to the availability of an enormous volume of images on various web sources, which have relaxed terms of privacy and copyright. Most of the large datasets used in the improvement and study of GANs contain objects, animals, paintings, or faces of celebrities. StyleGAN2-ADA uses histopathological images of breast cancer, which do not disclose patients’ identities. Similarly, some other imaging modalities such as dermoscopic imaging, X-ray imaging, and MRI scans may not disclose the person’s identity. In particular, when a skin condition is captured directly, focusing on the affected region of the body, a person’s identity is normally not identifiable. However, in the case of full-facial images with skin conditions such as rosacea, capturing the entire face can result in identifying the patient.
3.3.1. Publicly Available Data
A few teledermatology [3] web resources support computer-aided skin disease diagnosis research and development. The available rosacea images from various web sources were listed by Mohanty et al. [13]. There are about 208 rosacea images in total. Among these, there are only a few images with full-face visibility and a few others are watermarked, which may affect the features in the generated images. In order to examine the nature of rosacea in the facial region, it is essential to access high-quality full-face images, which are rarely found in online teledermatology sources. Hence, acquiring full-face images of rosacea is a difficult task.
3.3.2. Rosacea Dataset-‘rff-300’
Acquiring a large volume of medical/clinical images of facial skin conditions, including rosacea, can be a time-consuming task. Moreover, there are privacy concerns to be addressed when distributing such images. Hence, data acquisition is the main obstacle in this research. In this study, we had access to a small dataset, which is referred to as the ’Irish Dataset’ in the rest of the paper. The ’Irish Dataset’ was provided by The Powell Lab, Charles Institute of Dermatology, University College Dublin [58,59]. The dataset contains 70 high-quality full-face images of rosacea. The original images have various resolutions, ranging from 800 × 1000 to 900 × 1200. These were later resized for the experiments. Among the 70 images available, 67 were chosen based on specific screening criteria, focusing on the orientation of the images. We excluded 3 images that were taken from the side of the face, prioritizing only frontal full-face images for our experiments. This criterion was essential to ensure consistency and relevance in the context of our study on rosacea, which required clear frontal facial features for accurate data preparation and synthesis.
Given the low number of images in the Irish dataset, it was essential to collect more data from various web sources, i.e., teledermatology web sources and other Google search results. Thus, another 67 full-face images were taken from SD-260 [60]. A few more images were obtained from Google search results and teledermatology websites, in accordance with the following criteria/standards:
- The resolution is a minimum of 250 × 250;
- Visibility of the full face, including forehead to chin and both cheeks;
- The images are labelled/captioned/described under subtypes 1 and 2.
Given these standards/criteria, many rosacea labelled images with partially visible faces were not considered in this study. This data gathering resulted in a total number of 300 real-world images for the experiments, to generate synthetic full-face images with rosacea. These 300 images are full front-view facial images with rosacea subtype 1 or subtype 2.
All 300 images were manually centre-cropped, while preserving the visibility of the face and eliminating unnecessary background details and accessories around the ears and heads. The images were resized to 512 × 512 pixels, to keep the optimum details of the disease. The preferred file format type “.png” was chosen to preserve the best possible sharpness of the original images. For ease of understanding and usage, the entire dataset used in the experiments is referred to as “rff-300 (Rosacea-full-face-300)”.
3.3.3. Implementation Specifications
A system equipped with an Nvidia Geforce RTX 3090 (24 GB) GPU, an AMD Ryzen 9 5900X 12-core CPU, and 32 GB RAM was used to carry out the experiments. The complete implementation was carried out on Pytorch 1.7.1. with CUDA version 11.1 on Linux.
4. Experiments and Results
The implementation choices in this work were the same as in the original work on StyleGAN2-ADA, with some minor changes to the configuration. As the original work claimed to have chosen the ideal configuration of network architecture and loss functions, these units were kept unaltered in the experimental implementations. The learning rate of 0.0025 was kept unchanged to examine the effect of augmentation and the other hyperparameters on the output. All the 300 input images with resolution 512 × 512 were x-flipped, which brought the number of input images to 600.
In most cases, augmentation choices are limited to pixel-blitting and geometric augmentation, because other augmentations such as colour, filter, noise, and cutout may affect the desired features of the disease. For instance, in our transfer learning setup, the augmentations were applied too quickly in the early stages of the training. In the very beginning stage of the implementations and setup, a few experiments were carried out with all the augmentations offered by StyleGAN2-ADA. However, a set of augmentations such as colour, filters, noise, and cutout started to leak during the later stages of the training. One of the augmentations that showed frequent leaking was the colour augmentation. This problem was also encountered in the work by Karras et al. [20]. Hence, those experiments and results were not included in this study. Further experiments were set up with a limited set of augmentations, and these experiments are listed in Table 1.

Table 1.
List of experiments and results.
We explored three experimental setups: training from scratch, training with transfer learning from the FFHQ dataset, and training with transfer learning from FFHQ combined with the freeze-D technique.
While ‘training from scratch’ offers a foundational understanding of model behaviour, its feasibility was significantly limited by our dataset size of only 300 images. Such a constraint poses a high risk of overfitting and insufficient generalization with deep learning models. In contrast, ‘training with transfer learning from the FFHQ dataset [7]’ and its combination with the ‘freeze-D technique [61]’ leveraged pre-learned features from a more extensive dataset. The transfer learning approach helped mitigated the risk of overfitting but also enhanced the model’s focus on complex, rosacea-specific features, making it more suitable for our constrained dataset.
Transfer learning from the FFHQ dataset [7] to a small set of rosacea faces using StyleGAN2-ADA involved leveraging a pretrained model (trained on the FFHQ dataset) and adapting it to generate images of faces with rosacea. The model pretrained on FFHQ possessed extensive knowledge of facial structures such as face shapes and general facial anatomy. It also exceled in recognizing fine-grained details and photographic qualities like image quality characteristics. This knowledge could be transferred, while reducing the amount of training data and time through fine-tuning. This involved adjusting the weights of the model so that it could generate images that were more specific to the characteristics of rosacea faces. This approach often leads to improved performance on a specific task (generating rosacea faces with fine-grained details) compared to training a model from scratch, especially when the available data for the new task are limited. In summary, transfer learning in this context helps in efficiently adapting a model to a new, but related task, leveraging the knowledge it has already acquired from a larger, comprehensive dataset.
Incorporating the freeze-D [61] technique with transfer learning from FFHQ in StyleGAN2-ADA involves selectively freezing the lower layers of the discriminator. This strategy keeps these layers, which primarily learn basic and generic features, unchanged during further training. Consequently, the model’s training focus shifts towards the upper layers responsible for capturing complex high-level patterns. This selective freezing allows for a more efficient allocation of computational resources and learning capacity to these upper layers. They undergo intensive fine-tuning, adapting more effectively to specific details of the dataset. This also aids in achieving a balanced learning process in the discriminator, enabling it to distinguish between real and generated images based on more intricate and sophisticated patterns, rather than basic, common features.
In addition to our exploration of training from scratch, transfer learning from FFHQ, and the freeze-D technique, we considered the crucial role of regularization, as detailed in Section 3.2. The regularization strength parameter plays a pivotal role in stabilizing the training process. This includes mitigating the risk of mode collapse and ensuring the generation of diverse, high-quality images. The careful calibration of was instrumental in balancing the model’s fit to our specific dataset, while iteratively refining weight guided the model towards an equilibrium. This regularization strategy was particularly significant in the context of our constrained dataset size and the complex nature of rosacea-specific features.
In this work, a 24 GB GPU was used for the experiments, and several configuration choices required adjustment and recalculation during the experiments. The minibatch size, mini-batch standard deviation, exponential moving average, and regularization were altered according to the nature of the input and GPU configuration. The alterations of these hyperparameters were dependent on the image resolution and GPU model. The numeric value of these hyperparameters helped in reducing computational space, time, and cost required by leading to smoother progress during the training. As the input image resolution was 512 × 512 and the number of GPUs used was 1, the following configurations were used during the training:
- the minibatch size = max (min (1 · min (4096//512, 32), 64), 1) = 8;
- mini-batch standard deviation = min (minibatch size//GPUs, 4) = 4;
- Exponential moving average = minibatch size · 10/32= 2.5
Among the various implementation choices, regularization weight was given the most importance during the experiments, which will be discussed in further sections.
It is important to measure the image generation quality of synthetic images. The majority of experiments in StyleGAN2-ADA [20] in the literature were evaluated using FID. The Frechet inception distance (FID) between real samples x and generated samples g is given by
where
- and are the means of the real and generated samples, respectively;
- and are the covariances of the real and generated samples, respectively;
- Tr stands for the trace of a matrix.
In this study, the experimental results were assessed using kernel inception distance (KID) [62]. KID is based on the concept of maximum mean discrepancy (MMD), to compute the distance between two distributions; specifically, in the context of evaluating GANs, the distance between the distributions of real images P and generated images Q. Given samples drawn from P and samples drawn from Q, the MMD squared with a certain kernel k is given by
where
- is the kernel function, often chosen as the radial basis function (RBF) or Gaussian kernel:
- is a bandwidth parameter;
- The first term calculates the average similarity between all pairs of real image samples;
- The second term computes the average cross-similarity between real and generated image samples;
- The third term calculates the average similarity between all pairs of generated image samples.
The KID is then the empirical estimate of this . The MMD Squared Equation effectively compares the intra-distribution similarities (within P and within Q) and the inter-distribution similarities (between P and Q). A high MMD value suggests that the distributions are different, while a low MMD suggests that they are similar. In summary, lower values of KID indicate a better performance. The main reasons for considering KID for the experiments are listed below:
- KID functions outperform FID in case of limited samples, i.e., a small number of images;
- KID has a simple, unbiased, and asymptotically normal estimator, in contrast to FID;
- KID compares skewness as well as mean and variance.
As listed in Table 1, various experimental setups were explored to obtain high-quality synthetic faces with rosacea. The rationale for the chosen parameter values and main findings are outlined below:
- Exp 1 and 2: Training from scratch in Exps 1 and 2 did not provide any advantage with the limited data, i.e., 300 input images. However, these experiments showed that the value had a significant impact in terms of image generation and convergence during the training. As shown in Figure 4, Exp 1 achieved the lowest KID at training step 2640, with = 6.5, whilst Exp 2 achieved the lowest KID at training step 720, with = 10. As shown in the Figure 5a,b, the distribution of rosacea artefacts in the generated images from Exp 1 are better compared to the images generated in Exp 2. Hence, it can be concluded that Exp 1 had the best KID and better-quality generated images when training from scratch; conversely, Exp 2 converged faster but generated lower quality images. A lower strength of performed better for training from scratch.
 Figure 4. Progress of KID for 10 experiments over the training periods outlined in Table 1.
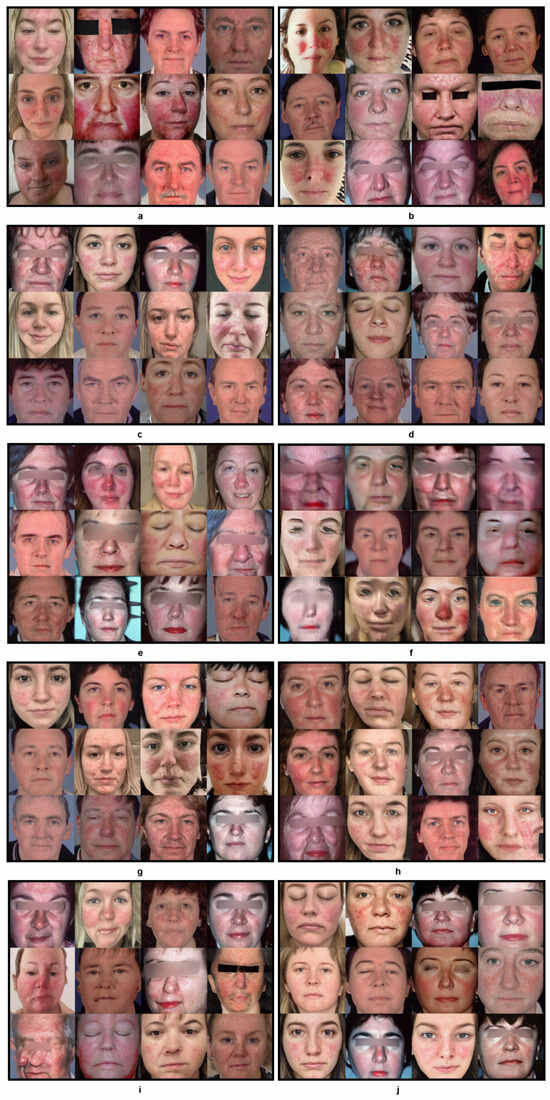 Figure 5. Generated faces from 10 experiments outlined in Table 1. This figure presents a visual representation of the synthetic faces generated across 10 different experiments as outlined in Table 1. Each sub-figure (a–j) corresponds to a unique combination of training setups, augmentation methods, freeze-D and regularization strengths detailed in the table. The images showcase the variation in quality and features of the generated faces. This figure provides a comprehensive comparison of how each methodology impacts the quality and realism of synthetic image generation.
 - Exp 3: In contrast, transfer learning from FFHQ [7] in Exp 3 performed approximately 33 times better with an improvement in training time/cost and nearly twice better at training step 120, with the lowest recorded KID value during the training with a = 6.5. As the FFHQ dataset is fundamentally a facial dataset, it was expected to have a wide range of facial features in the resulting generated images. In the Figure 5c, the generated images show a great level of improvement, although th image generation quality could be further improved by freezing the top layers of the discriminator to preserve the smaller features of the disease.
- Exp 4: In Exp 4, along with transfer learning from the FFHQ dataset, the freeze-discriminator (freeze-D) [61] technique was studied to improve the fine-grained details of rosacea in the synthetic faces. In this experiment, the top four layers of the Discriminator were frozen, which improved the result more quickly, compared to transfer learning without the freeze-D technique. The augmentation choice was kept unchanged from the previous experiment, i.e., pixel blitting and geometric transformations. The regularization weight was set to 6.5. Figure 4 represents the KID values obtained during the training process, in which the best value of KID = 3.5 was achieved at step 80. Hence, it is observed that the training process improved relatively more quickly when the top layers of the discriminator were frozen. As transfer learning with freeze-D presented better results, as in Figure 5d, this offered motivation to explore various arrangements of freeze-D.
- Exp 5: Furthermore, the freeze-D technique with transfer learning was applied by freezing 13, 10, and 17 layers of the discriminator. In Exp 5, the 13 top layers of the discriminator were frozen during training with the same settings for augmentations, i.e., pixel blitting, geometric transformation, and = 6.5. The outcome of this experiment was inferior compared to the previous experiment, based on the inconsistency in training, and the lowest KID (=3.3) achieved at the later stage of the training, at step 680. The generated images, as shown in Figure 5e, from this experiment were lower in quality, e.g., most of the facial features are deformed and blurred, with leaky background details. To improve this condition, further experiments were carried out with higher and lower strengths of , while keeping the other hyperparameters unchanged.
- Exp 6: Although some higher values of were tested while training from scratch in exp 2, they were not used with transfer learning, hence = 10 was tested in Exp 6. It can be observed from Figure 4 and Table 1 that it took longer to achieve a minimum KID at step 840. The lowest obtained KID in this experiment was the highest KID value recorded among the other experiments, proving the worst KID value recorded. The generated images in Figure 5f were highly distorted and unusable in quality. However, this demonstrated the significance of regularization strength . Regardless of the training set up, higher values of performed worse in terms of convergence and the quality of generated images. Hence, in the subsequent experiments, lower values of were explored.
- Exp 7: In Exp 7, = 3 was examined, while the other hyperparameters were kept unchanged from the previous Exp 6. As observed in Figure 4, KID dropped at the very beginning stage of training, i.e., step 80 and then became inconsistent. However, this was the second lowest KID value achieved among all the experiments, resulting in high-quality images generated at step 80, with a KID value of 3.1. The generated images shown in Figure 5g have fine-grained details of rosacea and disease patterns and resemble the real-life cases of rosacea.
- Exp 8: To exploit the performance with lower values of , Exp 8 was carried out with = 2. In this experiment, the lowest KID = 4.2 was recorded at training step 360. It can be observed from Figure 5h that the generated samples were deformed in the left bottom portion, with blurred edges. The distribution of the disease features was inadequate. It is observable that a low value of produced a strong sort of deformity, which was not encountered in the previous experiments.
- Exp 9 and 10: Furthermore, experiments Exps 9 and 10 were carried out by freezing 17 and 10 layers, respectively, with = 6.5, to observe changes due to freezing a layer of the discriminator. Exp 9 showed inconsistency throughout the training process, from the beginning. The minimum KID = 3.3 was obtained at training step 800. In Figure 5i, it is observed that the generated images tended to be blurred around the edges and the center. Some samples were negatively affected by the geometric augmentation.
- In Exp 10, sample images generated with the best value of KID = 2.5 were obtained at the training step no.160. Although Exp 10 obtained the lowest KID among all the experiments, the generated images were blurry at the edges and center, as depicted in Figure 5j. The details of rosacea are absent.
- The freeze-D technique with freezing 4, 10, 13, and 17 layers of discriminator was experimented; the results showed that freezing 10 layers helped achieve the lowest value of KID amongst the training setups. However, it was observed that freezing 10 layers led to too much smoothing, which did not help in preserving the details of the disease. Freezing 4, 13, and 17 layers of discriminator achieved comparatively better results in terms of the value of KID.
- Along with freezing the layers, we experimented with various strength of regularization. Adopting various values illustrated its significant impact on the training process, the metric (KID), and the generation of synthetic images.
- The impact of the value can be observed in both settings, such as training from scratch and in transfer learning. Exps 2 and 6 were carried out with a higher strength of , and they demonstrated the significance of the value very distinctly. A lower value of led to better results in training, given the other implementation choices remained unchanged.
- The choice of regularization weight/strength value depends on the input data. The heuristic formula in Equation (5) can choose a numerical value of as an initial guess, which calculates the value as 6.5. However, tweaking/adjusting this numerical value led to better results in generating synthetic images with fine-grained details and improved fidelity. It can be acknowledged that the choice of value is sensitive when images are in short supply. Lower values of performed better compared to the value obtained by applying the heuristic formulae. However, there is a risk in choosing very low values or very high values.
4.1. Truncation Trick
The Truncation trick was introduced by BigGAN [42]. The truncation trick acts as a boosting strategy for the quality of images. By applying the truncation trick, we could expand the range in the variety of images. The quality of these individual images was comparatively high, and the distribution of disease artefacts was precise. Transforming the images to latent space provided an opportunity to generate 1000 high-quality synthetic images at a time. This was possible with the truncation trick introduced in the BigGAN architecture.
The truncation trick is a sampling technique that aims at truncating the noise vector z by resampling the values to improve the individual sample quality. The truncation trick is regulated by a value called the ‘truncation threshold’ . The truncation threshold lies in a range between 0.5 and 1. As per [39,42], we used a truncation threshold of 0.7 to obtain the optimal results. Choosing a truncation value of 1 indicated that there was no truncation. Different truncation thresholds help in truncating the latent values so that they fall close to the mean. The smaller the truncation threshold, the better the samples will appear in terms of variety.
Although Exp 10 achieved the lowest value of KID, the images generated from this experiment were not useful, due to a few factors, such as
- A few images were not properly distributed and they were distorted and blurred, with leaked geometric augmentations;
- While exploiting the latent space, most of the samples generated from this experiment lacked variation in regards to common facial features, as well as rosacea features;
- As a result, out of the 1000 generated images, only about 30 were high-quality images.
On the other hand, Exp 7 achieved the second lowest value of KID, the images generated from this experiment were useful for a few reasons, such as:
- All 1000 samples generated (from step 80 with the best KID) were correctly distributed;
- The span of variation was greater than in Exp 10, meaning that there was more variety in facial features and rosacea features;
- There were no deformations/distortions in the facial and rosacea disease features;
- The samples were not highly smooth in the forehead or cheek regions;
- More distinctive facial and rosacea disease features were obtained compared to Exp 10;
- As a result, the 300 best high-quality images were selected for further analysis.
Figure 6 and Figure 7 show the images v through truncation from Exps 7 and 10, respectively. The 300 synthetic images selected from Exp 7 were used for further qualitative analysis, as discussed in Section 5. These 300 images were named as synthetic rosacea full faces (synth-rff-300) and are available at https://github.com/thinkercache/synth-rff-300 (accessed on 4 January 2024).

Figure 6.
Generated faces with the best KID value (3.1) in Exp 7 with a truncation = 0.7.

Figure 7.
Generated faces from the best KID value (2.5) in exp 10 with a truncation = 0.7.
5. Qualitative Evaluation of Generated Images by a Specialist Dermatologist and Non-Specialist Participants
Although the 300 best high-quality images with resolution 512 × 512 were selected from Exp 7, it was important to have them verified by dermatologists to validate the features and distribution (location/colour/nature) of the rosacea. However, inspecting all the 300 synthetic images would have been a time-consuming task. Hence, out of 300 images, about 50 images were randomly picked for the inspection by the expert dermatologists. The images were organized in a Google form. The dermatologists were requested to rate the images from a medical perspective regarding how well the artefacts on the generated faces represented rosacea, on a linear scale from 1 (not realistic rosacea) to 10 (very realistic rosacea). These ratings were represented by a mean opinion score (MOS). MOS is a measure used to evaluate the subjective quality of images. In our study, it reflected the perceived accuracy and realism of the synthetic images as judged by the dermatologists and non-specialist participants. A score above 60% indicated a high level of approval or realism of the images.
In total, three dermatologists participated in this study. The scatter plot in Figure 8 illustrates the average rating of the three dermatologists per image. The dots in this 3D plot represent the synthetic images. The darkest colours represent the images with higher ratings, followed by the lighter shades for the lower ratings.
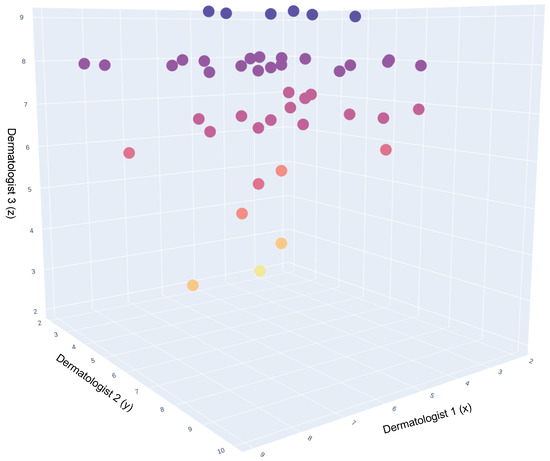
Figure 8.
A 3D representation of Dermatologists opinion on synthetic images. This 3D scatter plot visualizes the comparative opinions of three dermatologists, represented along the x, y, and z axes, regarding synthetic dermatological images. Each axis corresponds to the assessment scores from one dermatologist, providing a spatial representation of agreement and variance in their evaluations. The color coding of the data points indicates the consensus levels: purple for high consensus, red for moderate consensus, and yellow for divergent or outlier opinions. The density and distribution of points reflect the degree of alignment across the three dimensions of dermatological interpretation.
Figure 9 presents the mean opinion score for each image averaged over the three dermatologists, where 73% of the images had a mean opinion score of over 60%.
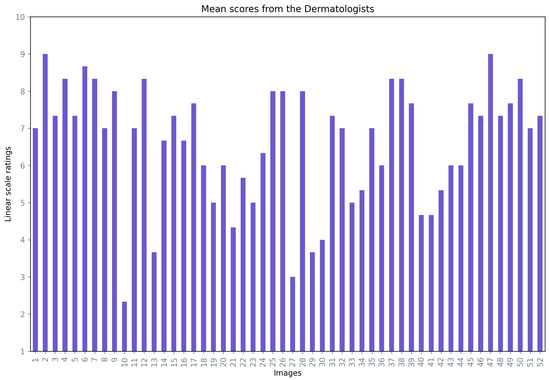
Figure 9.
Mean opinion scores from the dermatologists for the generated images.
Out of 73.07% of the images (with more than a 60% mean opinion score), 25% of the images were rated greater than a 80% mean opinion score, 32.7% images were rated greater than 70% to 79% mean opinion score, and 15.3% were rated greater than 60% to 69% mean opinion score values, as depicted in Figure 10.
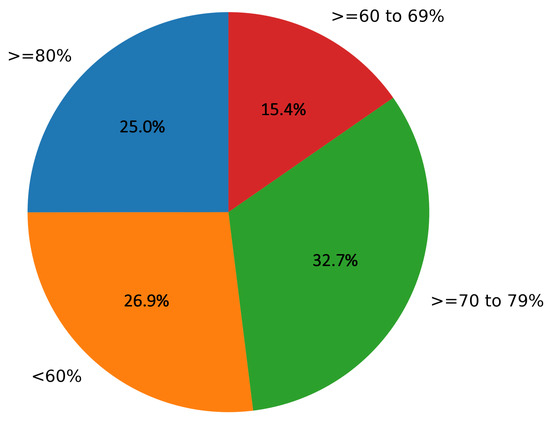
Figure 10.
Representation of mean opinion scores (in %) for the percentage of images in the study given by dermatologists.
To summarize, according to the dermatologists’ opinions (from a medical perspective), 73% of the images presented a realistic pattern of rosacea on the generated faces, and the additional comments provided by the dermatologists are listed in Table 2. Table 2 shows that the experts’ overall impression of the generated rosacea images was very positive. The remarks made by the experts demonstrate that developing synthetic images can help in overcoming the data-scarcity problem for rosacea and many other facial skin conditions in the medical imaging domain.
Table 2.
Dermatologist comments on the generated rosacea faces. This table presents a collection of feedback and insights from dermatologists regarding the synthetic Rosacea faces generated as part of this study. Each entry lists the comments provided by individual dermatologists, reflecting on the realism, potential utility, and overall impression of the generated facial images with Rosacea patterns. These comments are instrumental in understanding the clinical relevance and educational value of the synthetic images, as well as guiding future improvements and applications in dermatological training and diagnosis.
The amalgamation of methodologies for synthetic face generation, and the quantitative and qualitative data, show an optimistic direction for synthetic data generation for rare skin conditions and other diseases that involve medical imaging. This strategy will help deal with data scarcity problems in many disease domains and facilitate earlier and faster diagnosis.
The second part of the qualitative evaluation was based on non-specialist participant opinions. In this analysis, a total of 50 images were provided for analysis, in which 40 images were generated and 10 images were real. The intention behind including 10 real images was to analyze if non-specialist participants could see the difference between the real and fake images. The non-specialist participants were requested to rate the images in a range from 1 (not a realistic face) to 10 (a very realistic face). Figure 11 depicts the mean opinion score range for each image, where the generated and real images were labelled in different colours. Out of 50 images, 40 images received a mean score equal to or greater than 60%. Among the top 10 images with the highest mean score, five images (29, 4, 9, 33, 50) were real and five images (6, 3, 5, 1, 23) were generated.
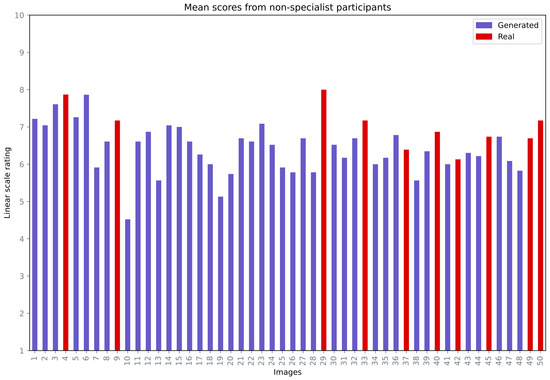
Figure 11.
Mean opinion scores from the non-specialist participants for miscellaneous images.
In summary, 73% of the images were rated above 60% by dermatologists and 80% by non-specialists, demonstrating a strong positive reception and validating the realism of the synthetic images generated in our study.
6. Limitations and Discussion
Quantitative evaluation of images generated using GAN models, particularly in medical imaging, is an open-ended problem. Thus, various quantitative and qualitative methods have been adapted and are still in the development stage [63]. Quantitative evaluations are often performed using various metrics such as inception score (IS), Fréchet inception distance (FID), kernel inception distance (KID), precision-recall, and perceptual path length. These metrics are proven to function adequately with certain types of popular datasets that are large in quantity. Although such methods are designed to assess the quality of images or evaluate the distribution of the generated images, they may not be a reliable measure for applications in the field of dermatology. These metrics fail to provide any information regarding the “quality” of the generated artifacts on the skin, which is vital in diagnosing skin conditions. In the field of dermatology, a minor change in the skin could be meaningful. The existing numerical methods are not capable of measuring the realism of the generated artifacts on the skin and whether they represent a skin condition or not.
As discussed in Section 3.3.2, this research utilized a limited dataset with 300 images to train a generative model. Following the state of the art studies, we deployed a quantitative evaluation pipeline using the KID metric to compare the generated images with the real ones. The best value recorded from this evaluation is presented in Table 1.
Although Exp 10 achieved the lowest value (the best) in quantitative evaluation using the metric KID and Exp 7 obtained the second lowest (second best) KID, the images in Exp 7 appeared more realistic than those in Exp 10. To explore this further, the FID metric was calculated, to cross-validate the results from the two experiments. The results are reported in Table 3. As shown in Table 3, the best KID and FID values were obtained from Exp 7 and Exp 10 at different stages of the training process. In Exp 7, the best value obtained for both metrics was at the training step 80; on the other hand, in Exp 10, the best value obtained by KID was at the training step 160 and the best value obtained by FID was at step 80. Therefore, it was challenging to measure the realism of the rosacea artifacts generated in the images based on these quantitative evaluations, specifically for Exp 10. Hence, the images obtained from both experiments needed visual scrutiny to check the fidelity of the rosacea.
Table 3.
The FID values are calculated and compared with the top two experiments, selected based on having the lowest KID values.
From visual scrutiny, the generated images from Exp 7 were evaluated as higher fidelity than the images obtained from Exp 10. As discussed in Section 4.1 and shown in Figure 7, the generated images from Exp 10 were blurred and lacked variation in rosacea features. As a result, the images generated from Exp 10 were not included in the further analysis.
As mentioned in Section 5, the images obtained from Exp 7 were verified by experts (dermatologists). Based on to the dermatologists’ opinions, 73% of the images received more than a 60% mean opinion score, and the dermatologist remarks are provided in Table 2. Based on the non-specialist participants’ opinions, 80% of the images received more than a 60% mean opinion score. In a nutshell, the StyleGAN2-ADA with the experimental fine-tuning described earlier in the paper produced high-quality and realistic results, as confirmed by experts and non-specialist participants.
Based on these quantitative and qualitative evaluations, it is conceivable that metrics such as KID and FID are not sufficient by themselves as evaluation criteria when working with a limited dataset of medical images. Both the quantitative and qualitative evaluations of the synthetic images demonstrated that, although evaluation metrics such as FID, IS, and KID are widely used, they have many limitations to be aware of while working with medical images. Along with quantitative evaluation, a qualitative assessment, such as using expert opinion, may well be requisite in the computer-aided medical diagnosis community.
7. Future Work
Given the importance of the hyperparameter , as discussed earlier, it would be desirable to design an adaptive regularization technique [64] for the weight matrix for experimentally testing StyleGAN2 architectures.Designing an adaptive value would not only help in generating high-fidelity synthetic images but could help achieve equilibrium at the early stages during the training with limited samples. Reaching the equilibrium point at earlier stages may help in reducing the training time and cost, without compromising the quality of the output.
Adding this adaptive technique for may also help in optimizing the model by introducing an automated early stopping point to the training process as it starts to overfit. This could save unnecessary time and cost while the training is still under progress, even after overfitting.
In future, generated images could be used to expand the dataset for classification of rosacea. As the fidelity of the generated images improves, they could be used for rosacea awareness, education, and advertisement purposes related to the disease. Along with rosacea, more facial diseases could be included for the same purposes.
As discussed in Section 6, popular metrics such as IS, FID, KID, perpetual path length, precision, and recall should not be considered the only metrics in the assessment pipeline of synthetic medical images. However, it is necessary to have a quantitative evaluation to navigate the results/outputs of GAN models; hence, it is essential to explore and improve the quantitative evaluation methods that may be deemed appropriate for the medical imaging domain. To achieve this, it is crucial to understand the nature of medical imaging with respect to imaging modality, fidelity, and how to retain domain-specific information in synthetic images.
In future, the potential of denoising diffusion probabilistic models (DPMMs) [65] could be explored, given their reputation for generating high-quality, realistic images. This characteristic might prove particularly advantageous in medical imaging for conditions like rosacea, where there is a scarcity of data. Although our current study concentrated on GANs and showcased their ability to create high-fidelity images from limited datasets, the exploration of DPMMs could provide a complementary or even superior approach. Their training stability and ability in capturing intricate patterns present an intriguing avenue for investigation.
Considering the scarcity of accessible data related to rosacea, the utilization of synthetic images emerges as a robust approach to augment the training of primary care-focused [66], deep learning-based systems (DLS) [67]. This method provides an innovative means of addressing data limitations, thus enhancing the capabilities of these sophisticated systems. Such advanced, deep learning-enabled systems have the potential to augment the decision-making process of physicians by providing corroborative consultations and highlighting areas of concern in clinical/medical images [68]. In future, the application of synthetic images, therefore, might serve as an effective tool in optimizing the diagnostic performance of these systems [6], warranting the need for extensive research on this promising intersection of artificial intelligence and dermatology.
As the quality of the generated synthetic images continues to advance, they could be repurposed beyond their initial intent, proving valuable for increasing rosacea awareness, educational initiatives, and promotional campaigns aimed at disease understanding. Moreover, this methodology could be extended to other facial diseases, thereby broadening its application in dermatological disease awareness and education.
Our methodology could be extended to other skin conditions sharing resemblances with rosacea, such as acne, seborrheic dermatitis, lupus, and psoriasis [9]. This applicability is particularly pertinent given the similar challenges of data scarcity in clinical visual datasets for these conditions. Our approach, leveraging StyleGAN2-ADA, might be adapted for such conditions, especially when high-quality full-face datasets are available. We also envision the potential for a class-conditional training approach with StyleGAN2-ADA, allowing for the generation of distinct classes of skin conditions, provided that the dataset includes labelled images. It is imperative to note, however, that the quality of input data plays a crucial role in the fidelity of the generated images. In our study, we utilized high-quality 512 × 512 images, in which 67 high-quality images were from the Irish dataset as discussed in Section 3.3.2, which significantly contributed to the detailed output of our synthetic images. Thus, for the application of our methods to other skin conditions, the presence of high-quality input data is a key factor. This consideration is critical in evaluating the generalizability of our results to other medical imaging tasks, as the quality of input data directly influences the effectiveness of synthetic image generation.
8. Conclusions
In the domain of computer-aided rosacea diagnosis, the scarcity of adequate rosacea images for comprehensive analysis and classification has long been overlooked, despite its prevalence. To address this challenge, this study stands as a pioneering effort, utilizing the capabilities of GANs to synthesize high-fidelity full-face rosacea images from a modest dataset of only 300 real images. This accomplishment is all the more remarkable given the inherent challenges associated with GANs, especially their convergence difficulties with small datasets. Our exploration into the theoretical nuances, particularly the transformative role of the cost function moderated by regularization, provides deep insights into achieving convergence in such challenging scenarios. We have demonstrated the effectiveness of using StyleGAN2-ADA to generate high-quality synthetic images of rosacea from a small dataset of only 300 real images. By controlling the regularization, we were able to achieve this result, which serves as foundational work for investigating the use of advanced generative models in synthetic data generation for medical imaging with limited data. The conducted experiments also revealed that granular details of the skin disease can be generated by working with hyperparameters such as regularization, applying a limited set of augmentation techniques such as ‘pixel blitting’ and ‘colour’ and the freeze-D technique with transfer learning. A qualitative analysis was conducted, in which expert dermatologists evaluated the generated images of rosacea, and the mean opinion score indicated that 73% of the generated images presented a realistic pattern of rosacea. Additionally, this study suggests that metrics such as KID and FID may have limitations in evaluating synthetic images generated from small datasets in the medical and clinical imaging field. The generated images were also evaluated by non-expert participants, which showed the synthetic rosacea faces looked realistic, as 80% of the images in the study achieved a mean opinion score of 60% or more.
Author Contributions
A.M.: Ideation, data gathering, experiments, quantitative and qualitative analysis, figures, first draft; A.S.: Supervision, partial data gathering, review, editing, conceptualisation in figures, structuring; M.B.: Supervision, Ideation of qualitative analysis, review, editing; H.J.: Supervision, project administration, ideation of quantitative and qualitative analysis, finalization. All authors have read and agreed to the published version of the manuscript.
Funding
This work was conducted with the financial support of the Science Foundation Ireland Centre for Research Training in Digitally-Enhanced Reality (d-real) under Grant No. 18/CRT/6224.
Data Availability Statement
The input data these experiments were obtained from three sources, as follows:
- SD-260 [60]: This dataset was benchmarked in the study published with the cited reference. The authors Sun et al. [60] have shared the data upon signing a ‘Datasets Request Form’. Hence it is recommended that the interested researchers can access the SD-260 dataset by requesting from the first author Xiaoxiao Sun, who kindly shared the dataset with us.
- Irish Dataset [58,59]: This dataset, used for our research study, was procured with permission from the Charles Institute of Dermatology, University College Dublin. Researchers interested in accessing this dataset can contact the Charles Institute of Dermatology, University college Dublin https://www.ucd.ie/charles/ (accessed on 4 January 2024).
- Images from Google Search results and teledermatology websites [14,15,16,17,18,19]: The datasets were obtained by performing search queries such as, ’rosacea subtype 1 ETR rosacea’ and ’rosacea subtype 2 PPR rosacea’ on Google, as well as looking under the ’rosacea’ disease section on cited teledermatology websites. Only images labelled as ETR and PPR types of rosacea were considered for this study. The data gathering and processing framework was discussed with the Data Protection Unit at Dublin City University and the process was aligned with data protection principles approved by the university.
To support further reproducibility of the work, the code is available: https://github.com/thinkercache/stylegan2-ada-pytorch (accessed on 4 January 2024).
- The Exp1-10 experiment configurations (.json) are added to the ‘/Config-Exp1-10’ folder on the https://github.com/thinkercache/stylegan2-ada-pytorch (accessed on 4 January 2024) repository.
- The qualitative evaluations by dermatologists and non-specialist participants are shared in the ‘/DermQualitative’ and ‘/NonspecQualitative’ folder in the https://github.com/thinkercache/stylegan2-ada-pytorch (accessed on 4 January 2024) repository. These folders contain both qualitative data (.csv) and code (.ipynb).
- The 300 synthetic rosacea dataset generated in this study is shared on GitHub repository: https://github.com/thinkercache/synth-rff-300 (accessed on 4 January 2024).
- All methods/experimental procedures were conducted in strict adherence to the ethical guidelines, regulations, and data protection policies of Dublin City University (DCU). Additionally, explicit authorisation was obtained for the SD-260 and Irish Dataset for the utilization of images in an academic research context.
- We confirm that the entirety of the data/images employed in this study were carefully anonymized in accordance with established privacy standards.
- We confirm that the human-like faces present in Figure 1, Figure 2, Figure 5, Figure 6, and Figure 7 are synthetic images, in which these human-like realistic looking faces were generated using generative adversarial network (GAN) algorithms and are hence not real. All the human-like faces in Figure 1, Figure 2, Figure 5, Figure 6, and Figure 7 do not exist in the real world.
- We confirm that the experimental protocols were approved by Dublin City University (DCU).
- We confirm that informed consent was obtained from all subjects and/or their legal guardian(s).
- We confirm that informed consent was obtained from all subjects and/or their legal guardian(s) for publication of identifying information/images in an online open-access publication (for those images that are not publicly available).
Conflicts of Interest
The authors declare no conflict of interest. The funders had no role in the design of the study; in the collection, analyses, or interpretation of data; in the writing of the manuscript; or in the decision to publish the results.
References
- Szegedy, C.; Vanhoucke, V.; Ioffe, S.; Shlens, J.; Wojna, Z. Rethinking the inception architecture for computer vision. In Proceedings of the IEEE Conference on Computer Vision and Pattern Recognition, Las Vegas, NV, USA, 27–30 June 2016; pp. 2818–2826. [Google Scholar]
- Esteva, A.; Kuprel, B.; Novoa, R.A.; Ko, J.; Swetter, S.M.; Blau, H.M.; Thrun, S. Dermatologist-level classification of skin cancer with deep neural networks. Nature 2017, 542, 115–118. [Google Scholar] [CrossRef] [PubMed]
- Pala, P.; Bergler-Czop, B.S.; Gwiżdż, J. Teledermatology: Idea, benefits and risks of modern age—A systematic review based on melanoma. Adv. Dermatol. Allergol. Epy Dermatol. I Alergol. 2020, 37, 159–167. [Google Scholar]
- Najafabadi, M.M.; Villanustre, F.; Khoshgoftaar, T.M.; Seliya, N.; Wald, R.; Muharemagic, E. Deep learning applications and challenges in big data analytics. J. Big Data 2015, 2, 1–21. [Google Scholar]
- Goodfellow, I.; Pouget-Abadie, J.; Mirza, M.; Xu, B.; Warde-Farley, D.; Ozair, S.; Courville, A.; Bengio, Y. Generative adversarial networks. Commun. ACM 2020, 63, 139–144. [Google Scholar] [CrossRef]
- Savage, N. Synthetic data could be better than real data. Nature 2023. [Google Scholar] [CrossRef]
- Karras, T.; Laine, S.; Aila, T. A style-based generator architecture for generative adversarial networks. In Proceedings of the IEEE/CVF Conference on Computer Vision and Pattern Recognition, Long Beach, CA, USA, 15–20 June 2019; pp. 4401–4410. [Google Scholar]
- Del Rosso, J.Q.; Gallo, R.L.; Kircik, L.; Thiboutot, D.; Baldwin, H.E.; Cohen, D. Why is rosacea considered to be an inflammatory disorder? The primary role, clinical relevance, and therapeutic correlations of abnormal innate immune response in rosacea-prone skin. J. Drugs Dermatol. 2012, 11, 694–700. [Google Scholar]
- Powell, F. Rosacea: Diagnosis and Management; CRC Press: Boca Raton, FL, USA, 2008. [Google Scholar]
- Powell, F.C. Rosacea. N. Engl. J. Med. 2005, 352, 793–803. [Google Scholar] [CrossRef]
- Steinhoff, M.; Schauber, J.; Leyden, J.J. New insights into rosacea pathophysiology: A review of recent findings. J. Am. Acad. Dermatol. 2013, 69, S15–S26. [Google Scholar] [CrossRef]
- Johnston, S.; Krasuska, M.; Millings, A.; Lavda, A.; Thompson, A. Experiences of rosacea and its treatment: An interpretative phenomenological analysis. Br. J. Dermatol. 2018, 178, 154–160. [Google Scholar] [CrossRef]
- Mohanty, A.; Sutherland, A.; Bezbradica, M.; Javidnia, H. Skin disease analysis with limited data in particular Rosacea: A review and recommended framework. IEEE Access 2022, 10, 39045–39068. [Google Scholar] [CrossRef]
- Brazil, D.A. Dermatology Atlas Brazil. Available online: https://www.atlasdermatologico.com.br/ (accessed on 4 January 2024).
- An Atlas of Clinical Dermatology. Available online: https://danderm.dk/atlas/index.html (accessed on 4 January 2024).
- DermIS. DermIS. Available online: https://www.dermis.net/dermisroot/en/home/index.htm (accessed on 4 January 2024).
- Society, N.Z.D. DermNetNZ. Available online: https://dermnetnz.org/ (accessed on 4 January 2024).
- Dermatoweb.net. Dermato Web Spain. Available online: http://dermatoweb.net (accessed on 4 January 2024).
- Verros, C.D. Hellenic Dermatological Atlas. Available online: http://www.hellenicdermatlas.com/en/ (accessed on 4 January 2024).
- Karras, T.; Aittala, M.; Hellsten, J.; Laine, S.; Lehtinen, J.; Aila, T. Training generative adversarial networks with limited data. Adv. Neural Inf. Process. Syst. 2020, 33, 12104–12114. [Google Scholar]
- Thomsen, K.; Christensen, A.L.; Iversen, L.; Lomholt, H.B.; Winther, O. Deep learning for diagnostic binary classification of multiple-lesion skin diseases. Front. Med. 2020, 7, 574329. [Google Scholar] [CrossRef]
- Zhao, Z.; Wu, C.M.; Zhang, S.; He, F.; Liu, F.; Wang, B.; Huang, Y.; Shi, W.; Jian, D.; Xie, H.; et al. A novel convolutional neural network for the diagnosis and classification of rosacea: Usability study. JMIR Med. Inform. 2021, 9, e23415. [Google Scholar] [PubMed]
- Zhu, C.Y.; Wang, Y.K.; Chen, H.P.; Gao, K.L.; Shu, C.; Wang, J.C.; Yan, L.F.; Yang, Y.G.; Xie, F.Y.; Liu, J. A deep learning based framework for diagnosing multiple skin diseases in a clinical environment. Front. Med. 2021, 8, 626369. [Google Scholar] [CrossRef]
- Binol, H.; Plotner, A.; Sopkovich, J.; Kaffenberger, B.; Niazi, M.K.K.; Gurcan, M.N. Ros-NET: A deep convolutional neural network for automatic identification of rosacea lesions. Skin Res. Technol. 2020, 26, 413–421. [Google Scholar] [PubMed]
- Xie, B.; He, X.; Zhao, S.; Li, Y.; Su, J.; Zhao, X.; Kuang, Y.; Wang, Y.; Chen, X. XiangyaDerm: A clinical image dataset of asian race for skin disease aided diagnosis. In Large-Scale Annotation of Biomedical Data and Expert Label Synthesis and Hardware Aware Learning for Medical Imaging and Computer Assisted Intervention; Springer: Berlin/Heidelberg, Germany, 2019; pp. 22–31. [Google Scholar]
- Simonyan, K.; Zisserman, A. Very deep convolutional networks for large-scale image recognition. arXiv 2014, arXiv:1409.1556. [Google Scholar]
- Baur, C.; Albarqouni, S.; Navab, N. MelanoGANs: High resolution skin lesion synthesis with GANs. arXiv 2018, arXiv:1804.04338. [Google Scholar]
- Bissoto, A.; Perez, F.; Valle, E.; Avila, S. Skin lesion synthesis with generative adversarial networks. In OR 2.0 Context-Aware Operating Theaters, Computer Assisted Robotic Endoscopy, Clinical Image-Based Procedures, and Skin Image Analysis; Springer: Berlin/Heidelberg, Germany, 2018; pp. 294–302. [Google Scholar]
- Pollastri, F.; Bolelli, F.; Paredes, R.; Grana, C. Augmenting data with GANs to segment melanoma skin lesions. Multimed. Tools Appl. 2020, 79, 15575–15592. [Google Scholar]
- Ghorbani, A.; Natarajan, V.; Coz, D.; Liu, Y. Dermgan: Synthetic generation of clinical skin images with pathology. In Proceedings of the Machine Learning for Health Workshop, PMLR, Virtual, 11 December 2020; pp. 155–170. [Google Scholar]
- Fossen-Romsaas, S.; Storm-Johannessen, A.; Lundervold, A.S. Synthesizing Skin Lesion Images Using CycleGANs—A Case Study. HVL Open er Vitenarkivet til Høgskulen på Vestlandet. 2020. Available online: https://hdl.handle.net/11250/2722685 (accessed on 4 January 2024).
- Bissoto, A.; Valle, E.; Avila, S. Gan-based data augmentation and anonymization for skin-lesion analysis: A critical review. In Proceedings of the IEEE/CVF Conference on Computer Vision and Pattern Recognition, Nashville, TN, USA, 20–25 June 2021; pp. 1847–1856. [Google Scholar]
- Carrasco Limeros, S.; Majchrowska, S.; Zoubi, M.K.; Rosén, A.; Suvilehto, J.; Sjöblom, L.; Kjellberg, M. Assessing GAN-Based Generative Modeling on Skin Lesions Images. In Proceedings of the Machine Intelligence and Digital Interaction Conference, Virtual, 12–15 December 2022; Springer Nature: Cham, Switzerland, 2022; pp. 93–102. [Google Scholar]
- Cho, S.I.; Navarrete-Dechent, C.; Daneshjou, R.; Cho, H.S.; Chang, S.E.; Kim, S.H.; Na, J.I.; Han, S.S. Generation of a melanoma and nevus data set from unstandardized clinical photographs on the internet. JAMA Dermatol. 2023, 159, 1223–1231. [Google Scholar] [CrossRef]
- Radford, A.; Metz, L.; Chintala, S. Unsupervised representation learning with deep convolutional generative adversarial networks. arXiv 2015, arXiv:1511.06434. [Google Scholar]
- Karras, T.; Aila, T.; Laine, S.; Lehtinen, J. Progressive growing of gans for improved quality, stability, and variation. arXiv 2017, arXiv:1710.10196. [Google Scholar]
- Wang, T.C.; Liu, M.Y.; Zhu, J.Y.; Tao, A.; Kautz, J.; Catanzaro, B. High-resolution image synthesis and semantic manipulation with conditional gans. In Proceedings of the IEEE Conference on Computer Vision and Pattern Recognition, Salt Lake City, UT, USA, 18–23 June 2018; pp. 8798–8807. [Google Scholar]
- Heusel, M.; Ramsauer, H.; Unterthiner, T.; Nessler, B.; Hochreiter, S. Gans trained by a two time-scale update rule converge to a local nash equilibrium. arXiv 2017, arXiv:1706.08500. [Google Scholar]
- Karras, T.; Laine, S.; Aittala, M.; Hellsten, J.; Lehtinen, J.; Aila, T. Analyzing and improving the image quality of stylegan. In Proceedings of the IEEE/CVF Conference on Computer Vision and Pattern Recognition, Seattle, WA, USA, 13–19 June 2020; pp. 8110–8119. [Google Scholar]
- Yu, F.; Seff, A.; Zhang, Y.; Song, S.; Funkhouser, T.; Xiao, J. Lsun: Construction of a large-scale image dataset using deep learning with humans in the loop. arXiv 2015, arXiv:1506.03365. [Google Scholar]
- Kynkäänniemi, T.; Karras, T.; Laine, S.; Lehtinen, J.; Aila, T. Improved precision and recall metric for assessing generative models. arXiv 2019, arXiv:1904.06991. [Google Scholar]
- Brock, A.; Donahue, J.; Simonyan, K. Large scale GAN training for high fidelity natural image synthesis. arXiv 2018, arXiv:1809.11096. [Google Scholar]
- Lucic, M.; Kurach, K.; Michalski, M.; Gelly, S.; Bousquet, O. Are gans created equal? a large-scale study. arXiv 2018, arXiv:1711.10337. [Google Scholar]
- Russakovsky, O.; Deng, J.; Su, H.; Krause, J.; Satheesh, S.; Ma, S.; Huang, Z.; Karpathy, A.; Khosla, A.; Bernstein, M.; et al. Imagenet large scale visual recognition challenge. Int. J. Comput. Vis. 2015, 115, 211–252. [Google Scholar]
- Salimans, T.; Goodfellow, I.; Zaremba, W.; Cheung, V.; Radford, A.; Chen, X. Improved techniques for training gans. arXiv 2016, arXiv:1606.03498v1. [Google Scholar]
- Karras, T.; Aittala, M.; Hellsten, J.; Laine, S.; Lehtinen, J.; Aila, T. MetFaces Dataset. Available online: https://github.com/NVlabs/metfaces-dataset (accessed on 4 January 2024).
- Aksac, A.; Demetrick, D.J.; Ozyer, T.; Alhajj, R. BreCaHAD: A dataset for breast cancer histopathological annotation and diagnosis. BMC Res. Notes 2019, 12, 82. [Google Scholar] [CrossRef]
- Krizhevsky, A.; Hinton, G. Learning Multiple Layers of Features from Tiny Images. Master’s Thesis, University of Toronto, Toronto, QC, Canada, 2009. Available online: https://www.cs.toronto.edu/~kriz/ (accessed on 4 January 2024).
- Gui, J.; Sun, Z.; Wen, Y.; Tao, D.; Ye, J. A review on generative adversarial networks: Algorithms, theory, and applications. IEEE Trans. Knowl. Data Eng. 2021, 35, 3313–3332. [Google Scholar] [CrossRef]
- Zhao, Z.; Zhang, Z.; Chen, T.; Singh, S.; Zhang, H. Image augmentations for gan training. arXiv 2020, arXiv:2006.02595. [Google Scholar]
- Zhao, Z.; Singh, S.; Lee, H.; Zhang, Z.; Odena, A.; Zhang, H. Improved consistency regularization for gans. In Proceedings of the AAAI Conference on Artificial Intelligence, Online, 2–9 February 2021; Volume 35, pp. 11033–11041. [Google Scholar]
- Bora, A.; Price, E.; Dimakis, A.G. AmbientGAN: Generative models from lossy measurements. In Proceedings of the International Conference on Learning Representations, Vancouver, BC, Canada, 30 April–3 May 2018; pp. 1–22. [Google Scholar]
- Roth, K.; Lucchi, A.; Nowozin, S.; Hofmann, T. Stabilizing training of generative adversarial networks through regularization. arXiv 2017, arXiv:1705.09367. [Google Scholar]
- Fedus, W.; Rosca, M.; Lakshminarayanan, B.; Dai, A.M.; Mohamed, S.; Goodfellow, I. Many paths to equilibrium: GANs do not need to decrease a divergence at every step. arXiv 2017, arXiv:1710.08446. [Google Scholar]
- Holt, C.A.; Roth, A.E. The Nash equilibrium: A perspective. Proc. Natl. Acad. Sci. USA 2004, 101, 3999–4002. [Google Scholar]
- Mescheder, L.; Geiger, A.; Nowozin, S. Which training methods for GANs do actually converge? In Proceedings of the International Conference on Machine Learning, PMLR, Stockholm, Sweden, 10–15 July 2018; pp. 3481–3490. [Google Scholar]
- Mescheder, L.; Nowozin, S.; Geiger, A. The numerics of gans. arXiv 2017, arXiv:1705.10461. [Google Scholar]
- Powell, F. Powell Lab., UCD Charles Institute of Dermatology, University College Dublin. Available online: https://www.ucd.ie/charles/research/researchgroups/thepowelllab/ (accessed on 4 January 2024).
- UCD Charles Instute of Dermatology. Charles Institure of Dermatology, University College Dublin. Available online: https://www.ucd.ie/charles/ (accessed on 4 January 2024).
- Sun, X.; Yang, J.; Sun, M.; Wang, K. A benchmark for automatic visual classification of clinical skin disease images. In Proceedings of the European Conference on Computer Vision, Amsterdam, The Netherlands, 11–14 October 2016; Springer: Berlin/Heidelberg, Germany, 2016; pp. 206–222. [Google Scholar]
- Mo, S.; Cho, M.; Shin, J. Freeze the discriminator: A simple baseline for fine-tuning gans. arXiv 2020, arXiv:2002.10964. [Google Scholar]
- Bińkowski, M.; Sutherland, D.J.; Arbel, M.; Gretton, A. Demystifying mmd gans. arXiv 2018, arXiv:1801.01401. [Google Scholar]
- Borji, A. Pros and cons of GAN evaluation measures: New developments. Comput. Vis. Image Underst. 2022, 215, 103329. [Google Scholar] [CrossRef]
- Zhao, H.; Tsai, Y.H.H.; Salakhutdinov, R.R.; Gordon, G.J. Learning neural networks with adaptive regularization. arXiv 2019, arXiv:1907.06288. [Google Scholar]
- Ho, J.; Jain, A.; Abbeel, P. Denoising diffusion probabilistic models. Adv. Neural Inf. Process. Syst. 2020, 33, 6840–6851. [Google Scholar]
- Escalé-Besa, A.; Yélamos, O.; Vidal-Alaball, J.; Fuster-Casanovas, A.; Miró Catalina, Q.; Börve, A.; Ander-Egg Aguilar, R.; Fustà-Novell, X.; Cubiró, X.; Rafat, M.E.; et al. Exploring the potential of artificial intelligence in improving skin lesion diagnosis in primary care. Sci. Rep. 2023, 13, 4293. [Google Scholar] [CrossRef] [PubMed]
- Liu, Y.; Jain, A.; Eng, C.; Way, D.H.; Lee, K.; Bui, P.; Kanada, K.; de Oliveira Marinho, G.; Gallegos, J.; Gabriele, S.; et al. A deep learning system for differential diagnosis of skin diseases. Nat. Med. 2020, 26, 900–908. [Google Scholar] [PubMed]
- Esteva, A.; Robicquet, A.; Ramsundar, B.; Kuleshov, V.; DePristo, M.; Chou, K.; Cui, C.; Corrado, G.; Thrun, S.; Dean, J. A guide to deep learning in healthcare. Nat. Med. 2019, 25, 24–29. [Google Scholar] [CrossRef] [PubMed]
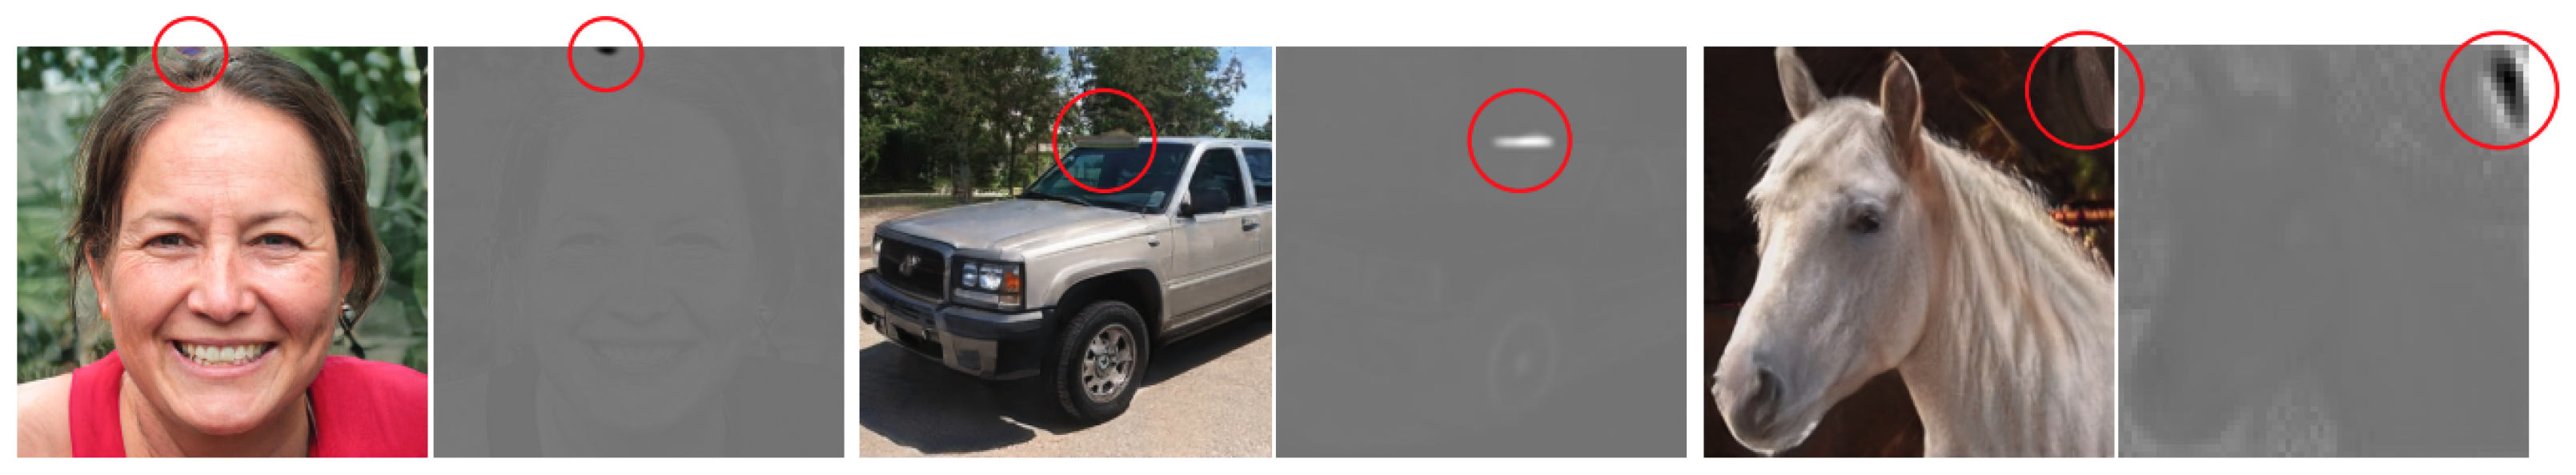
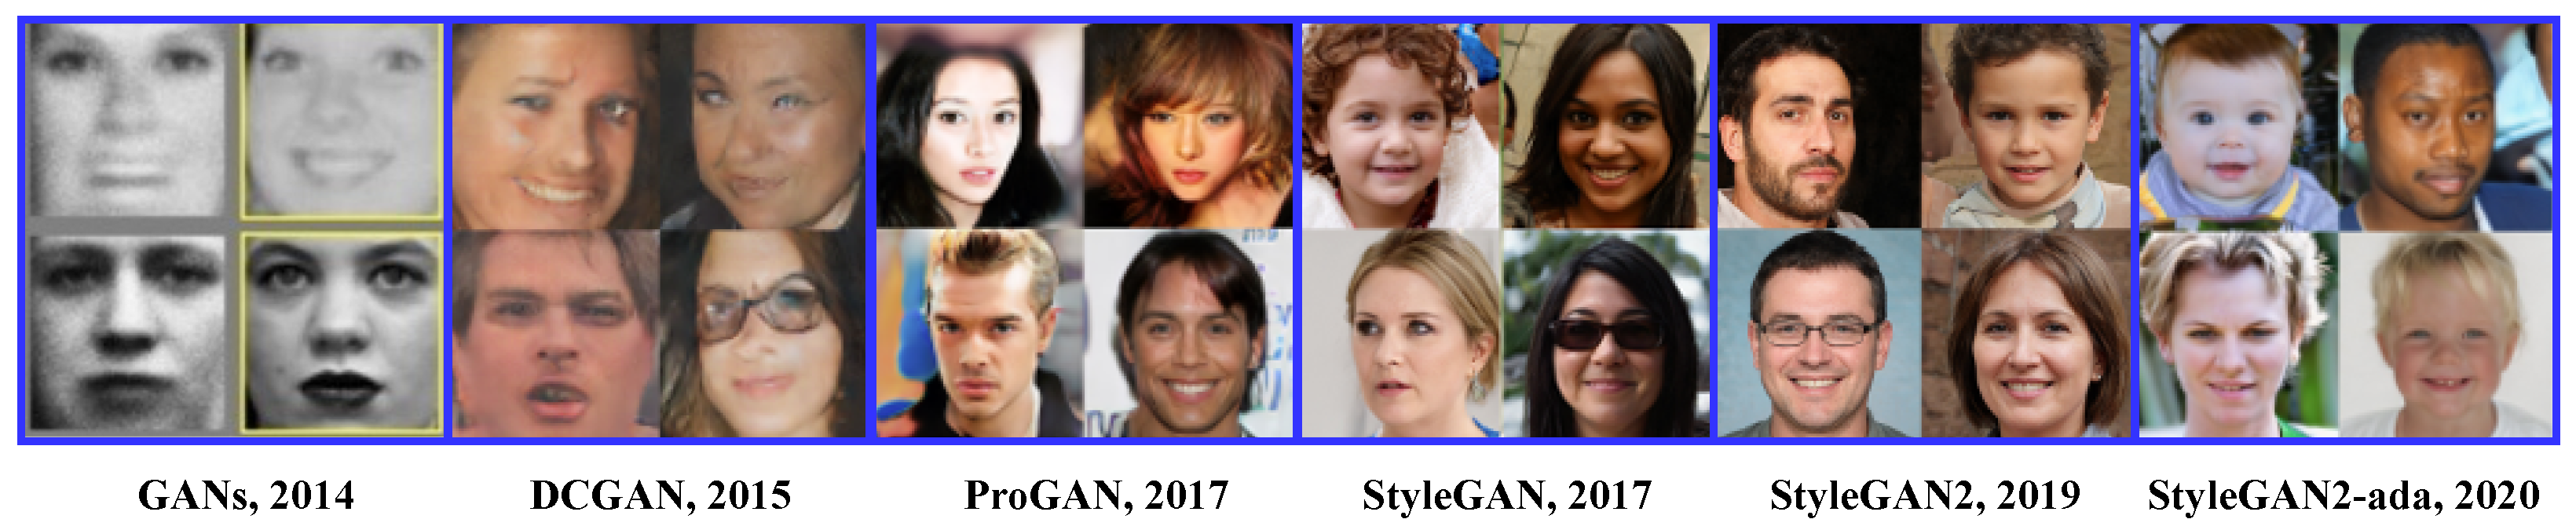
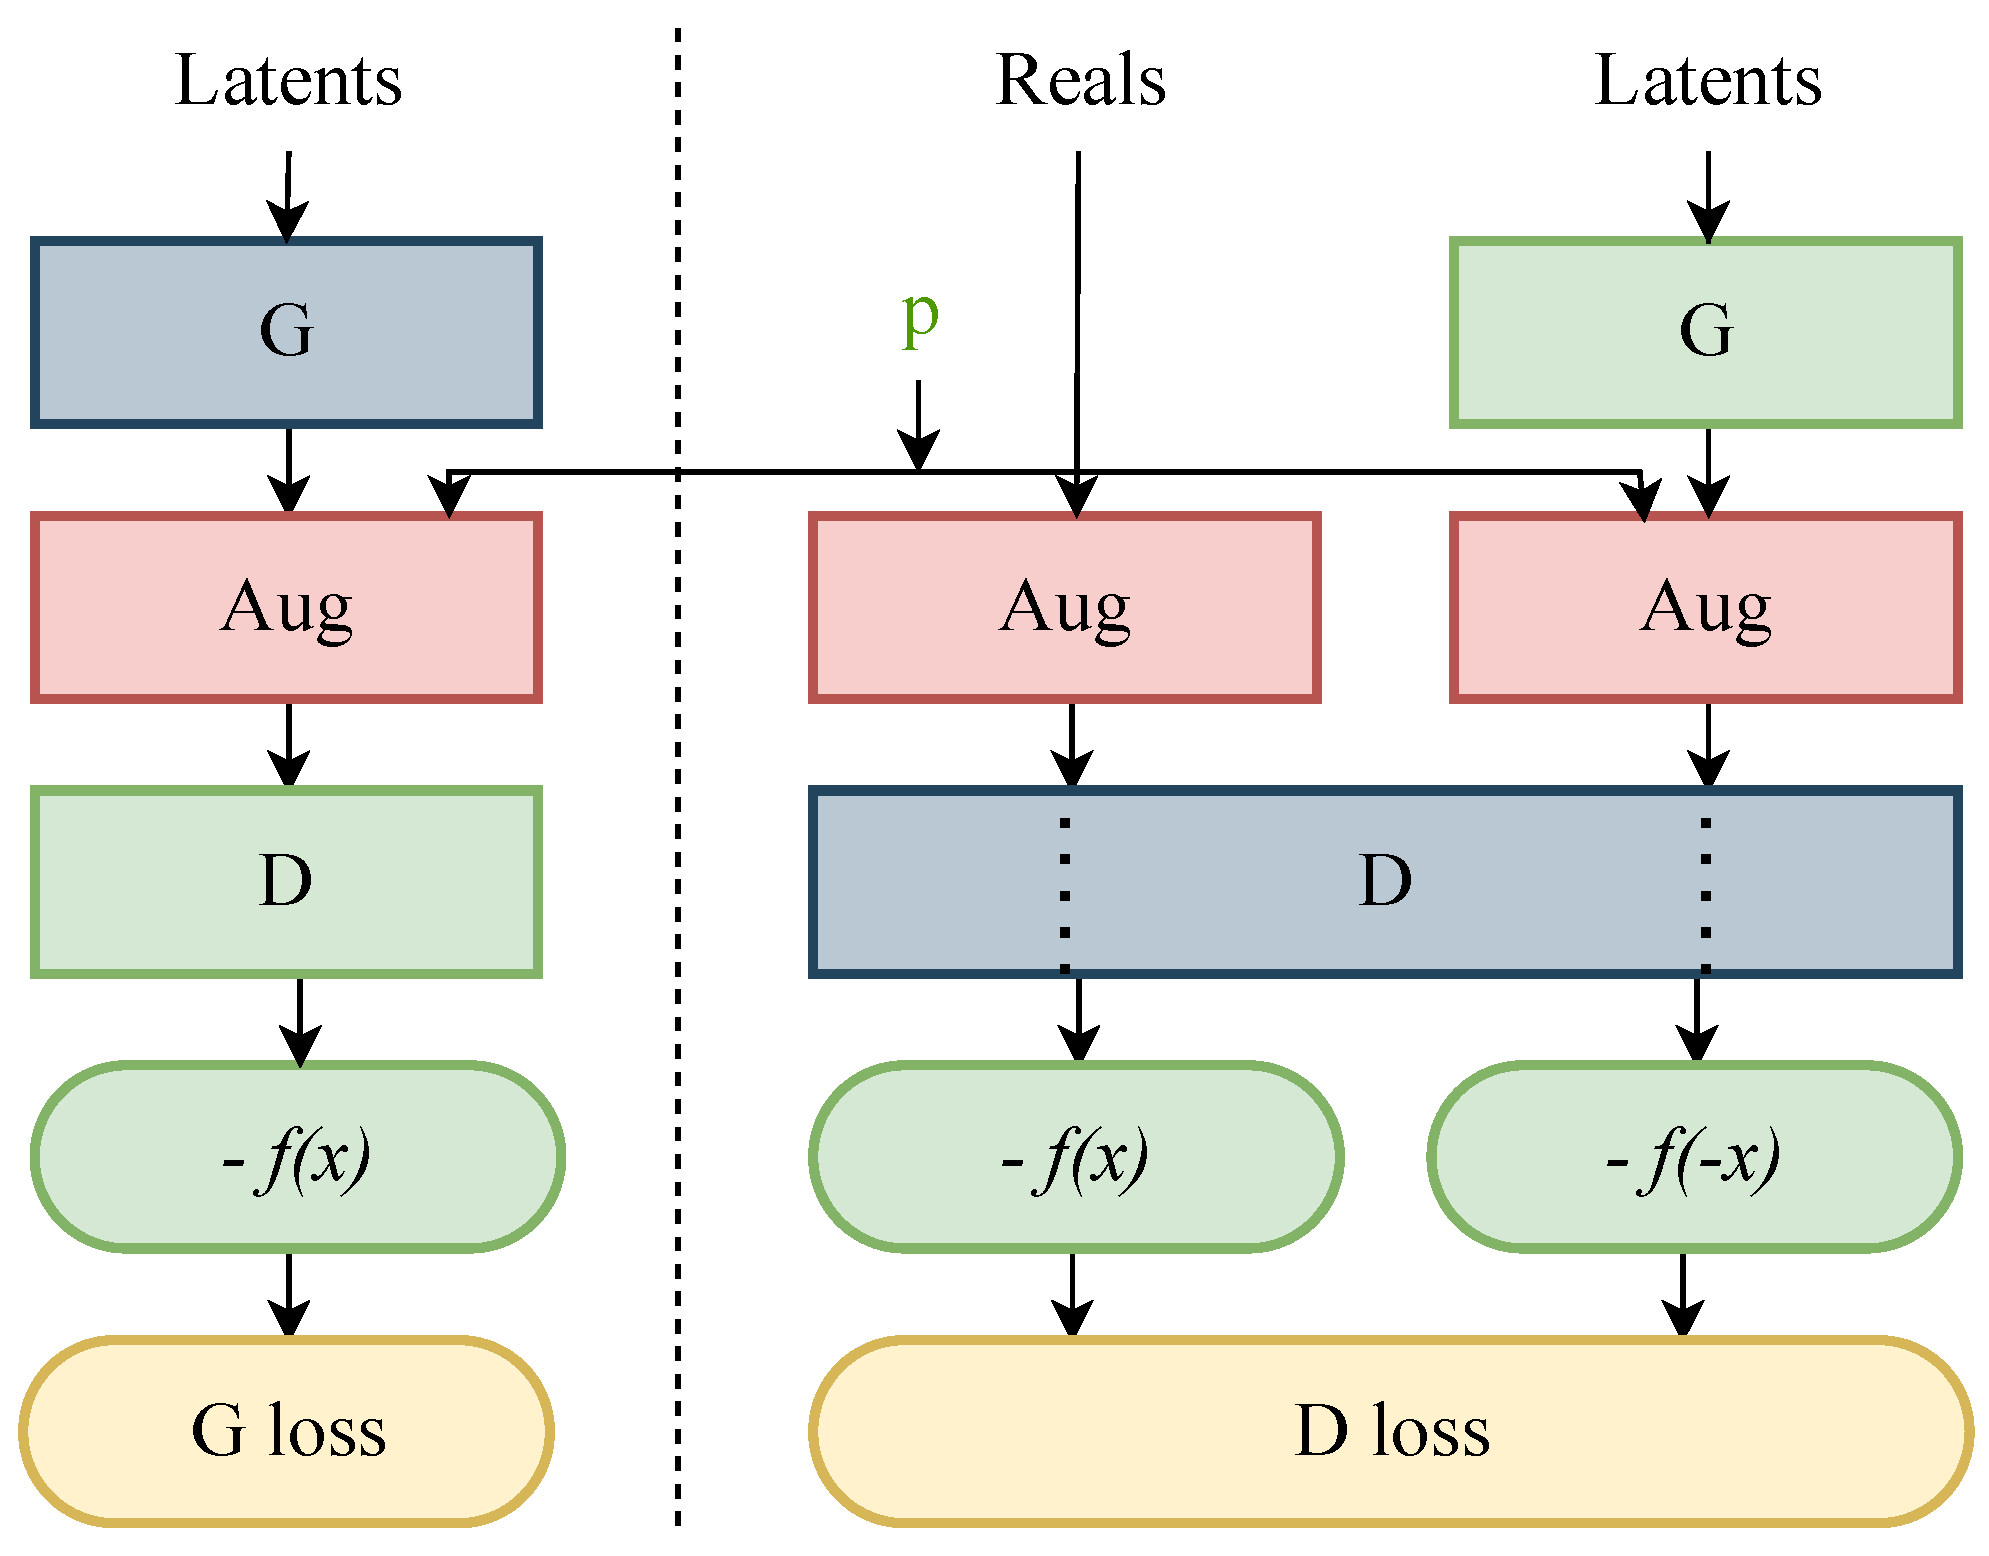
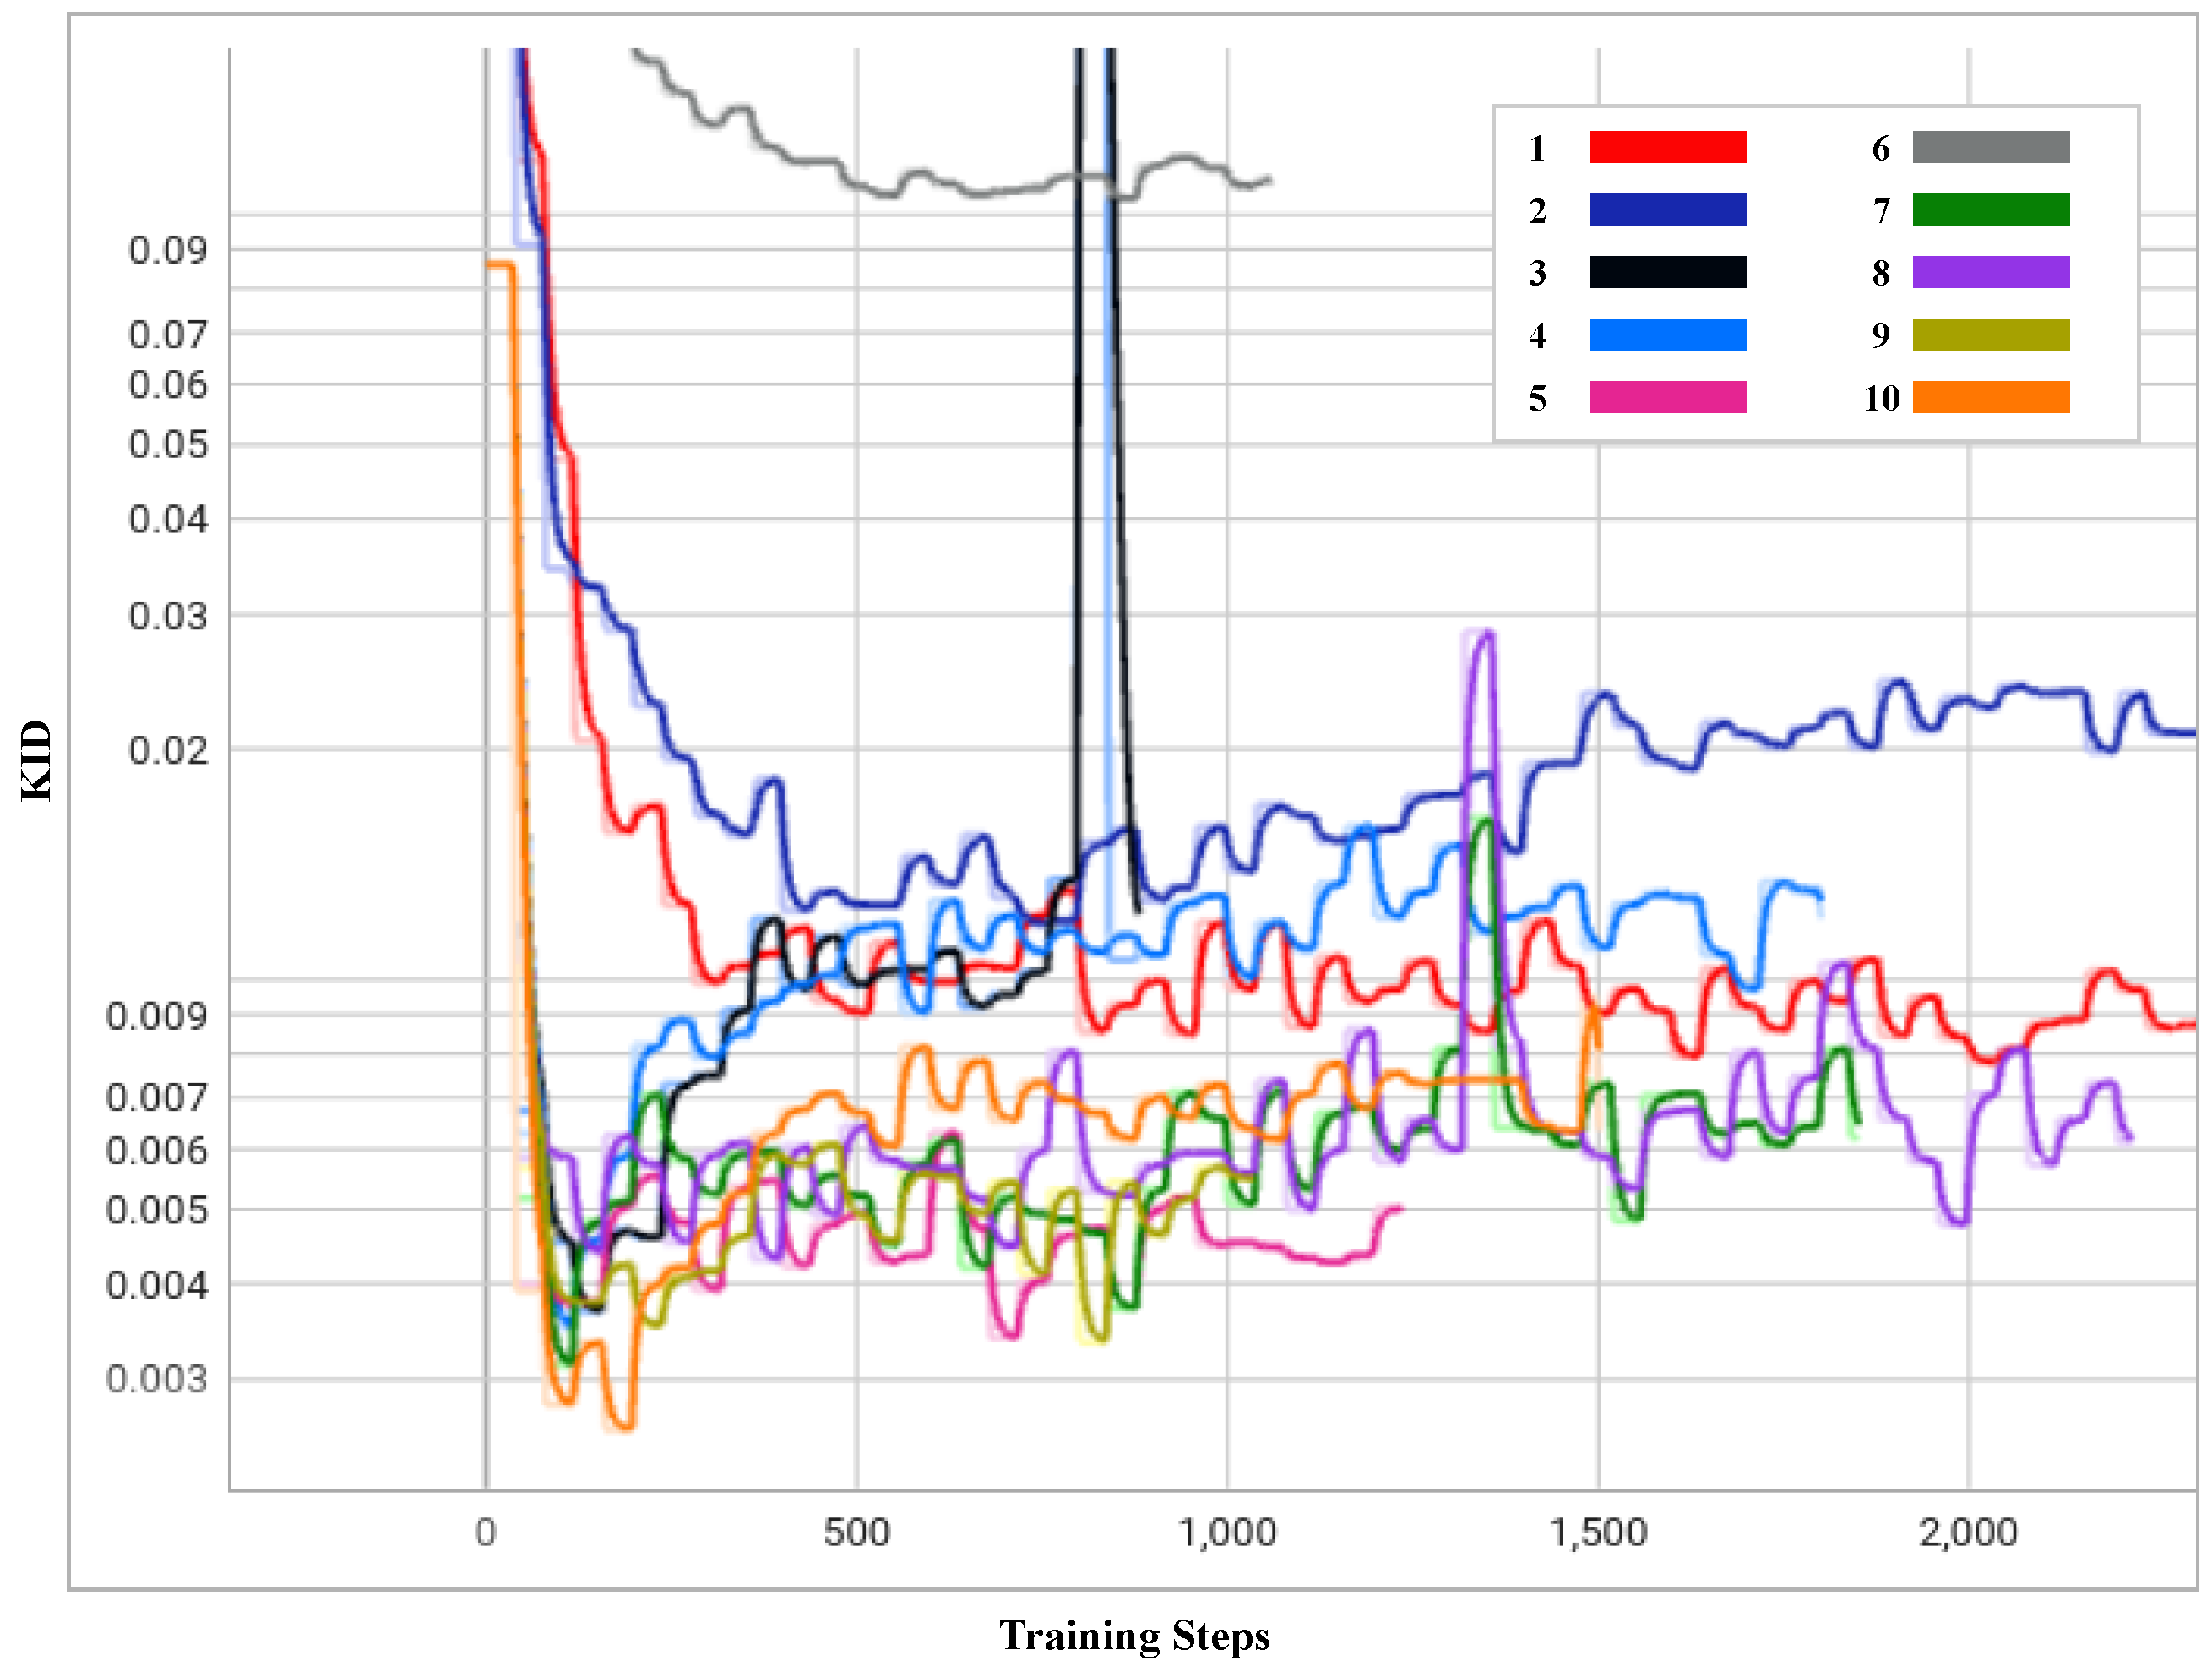

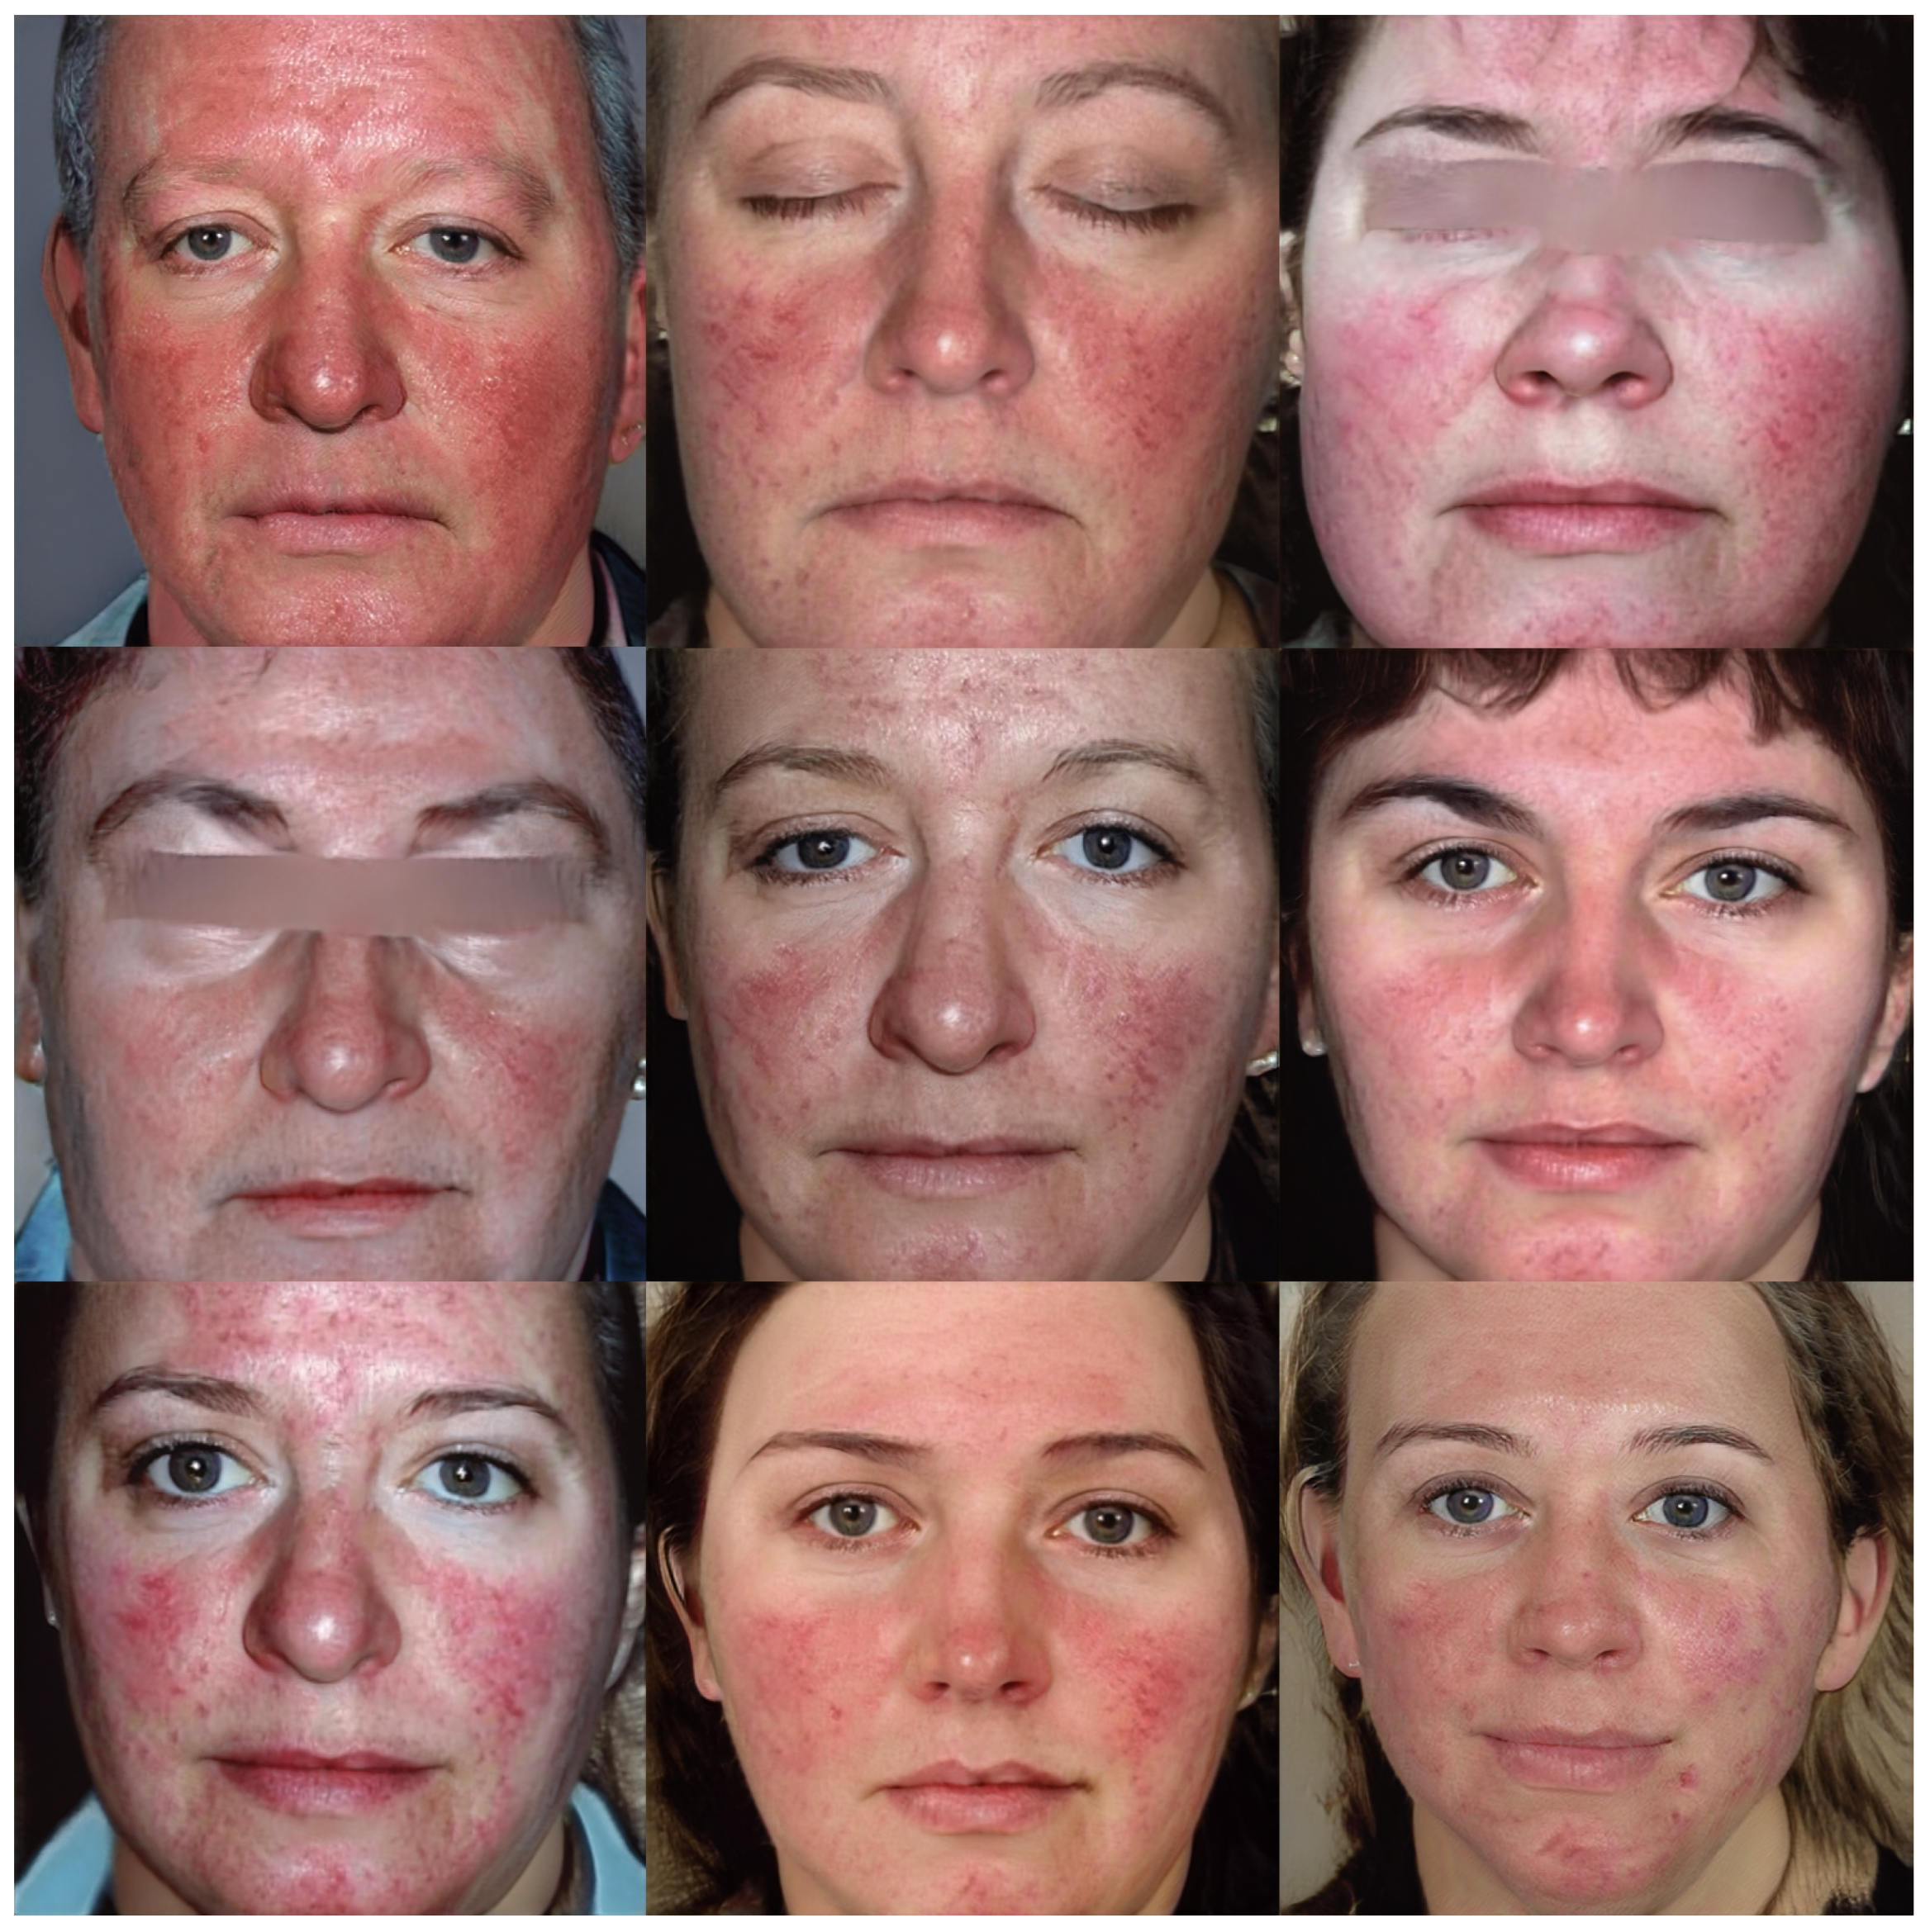
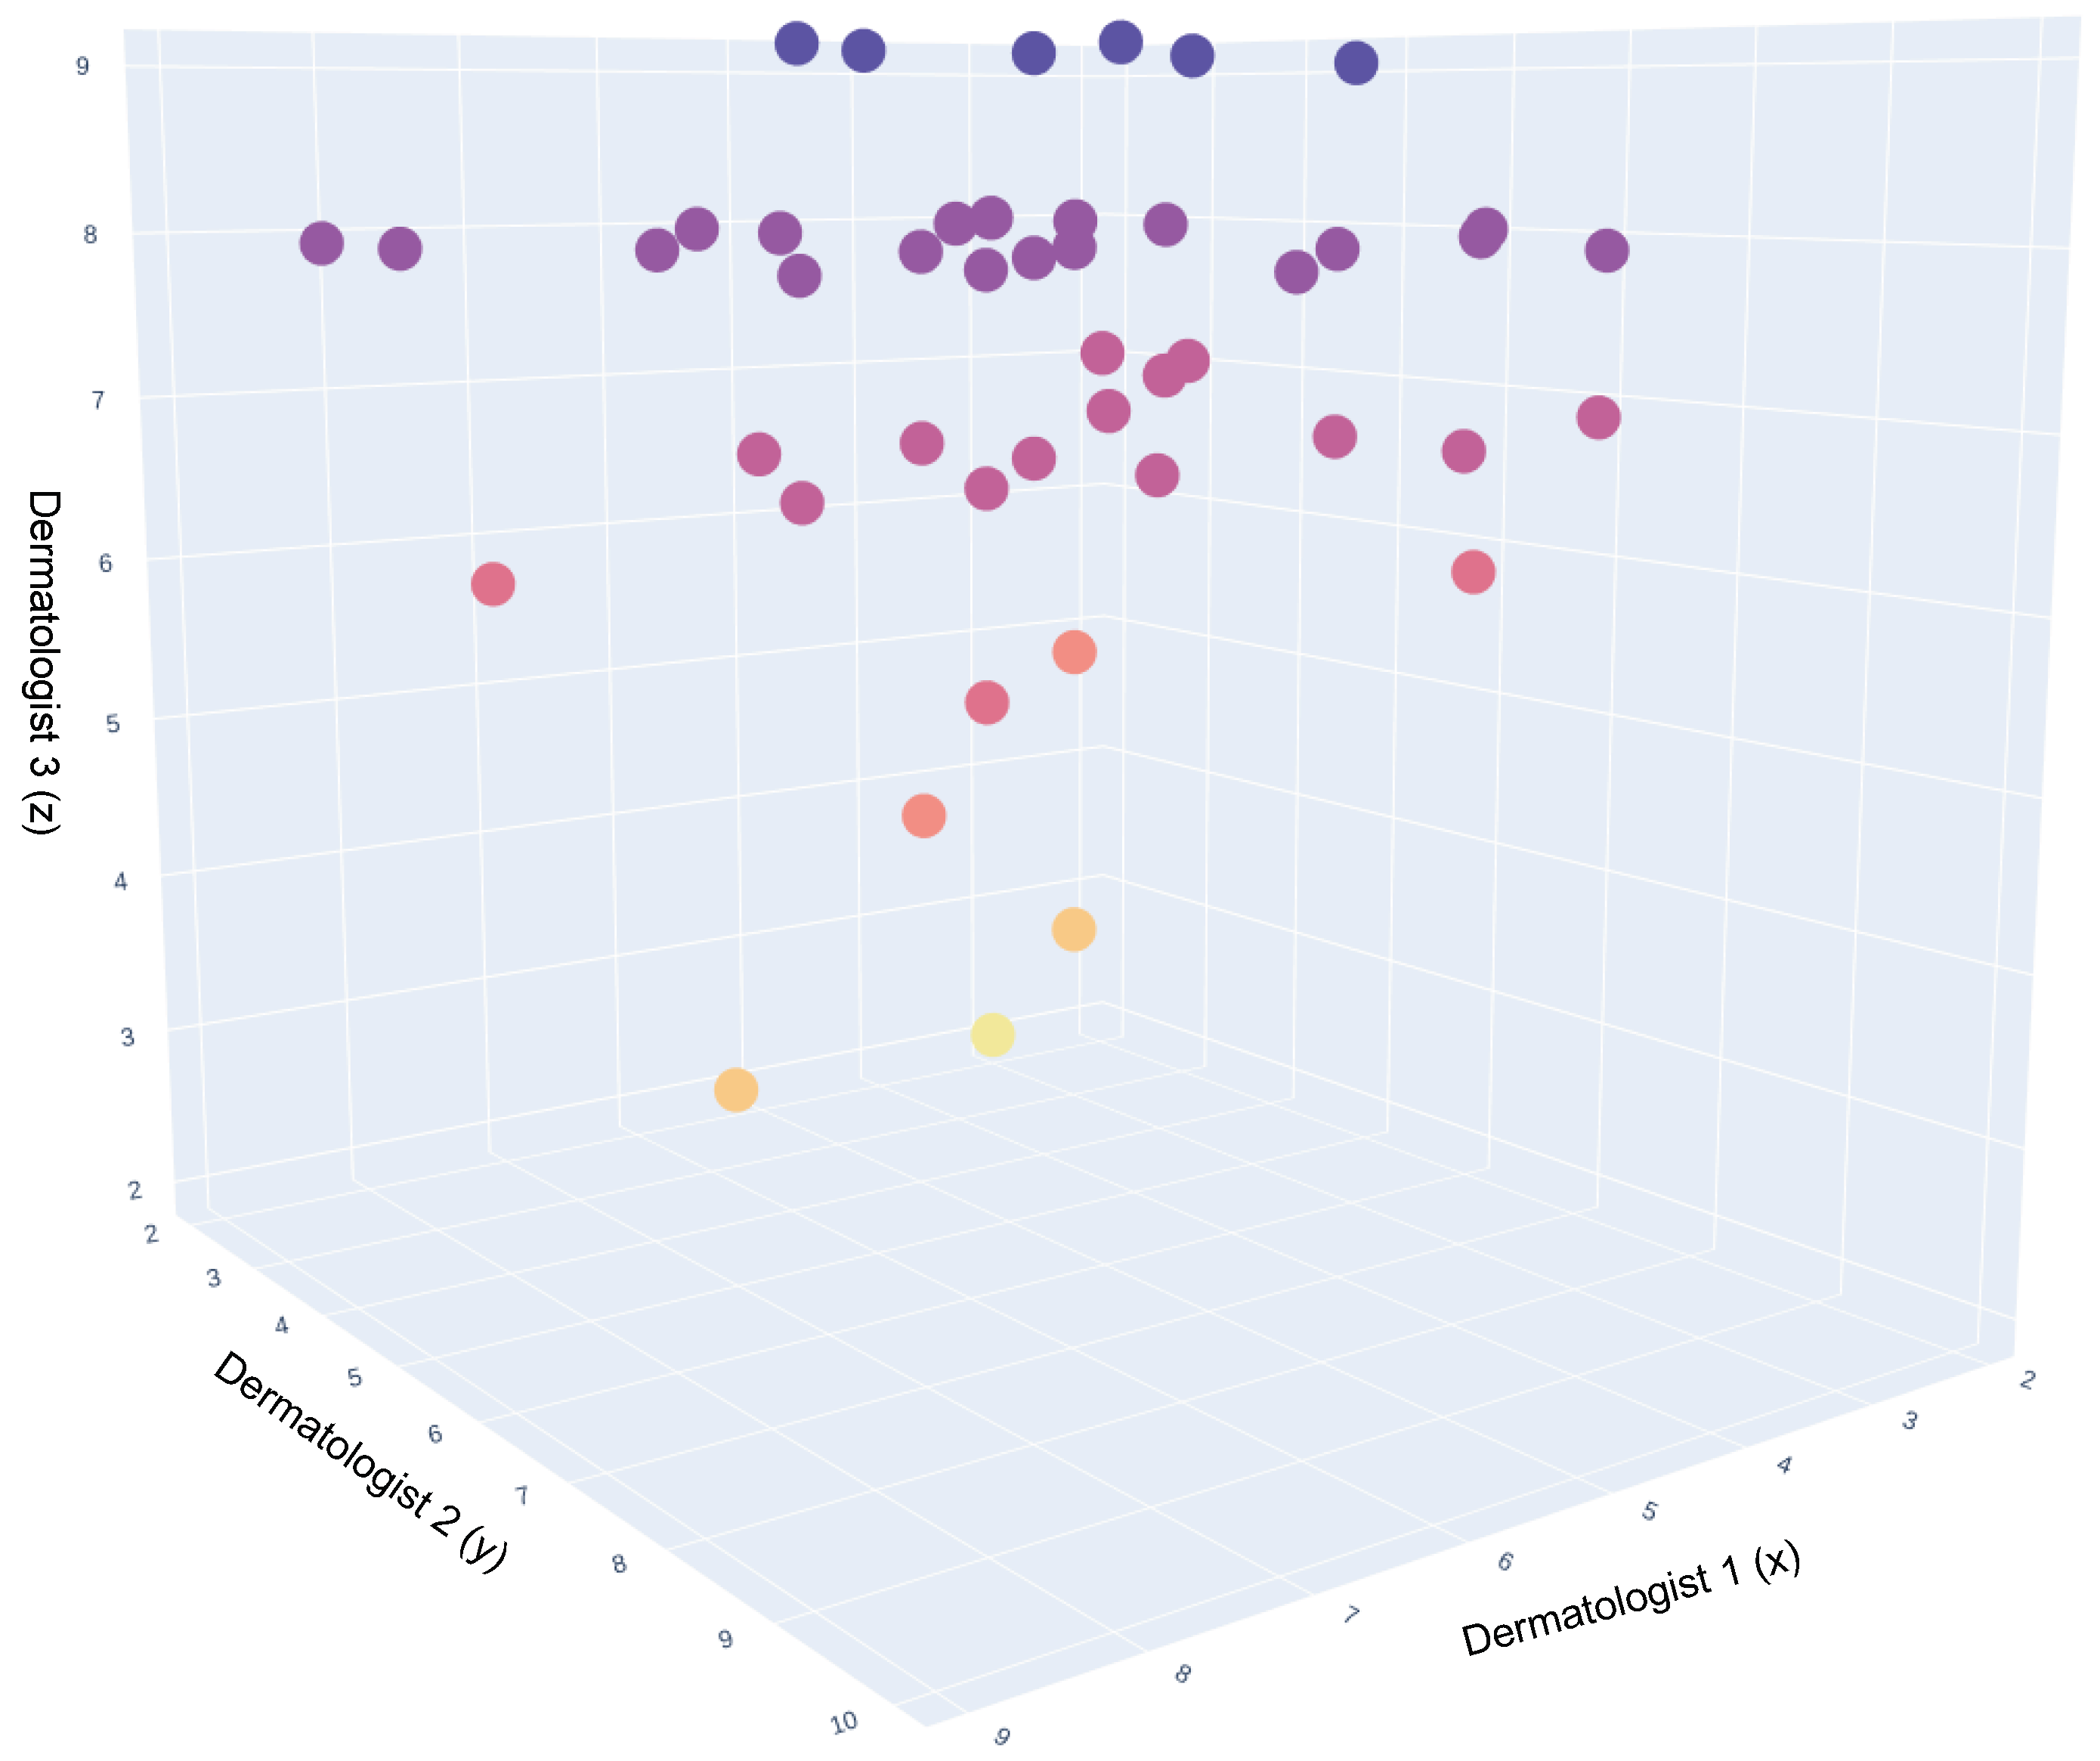
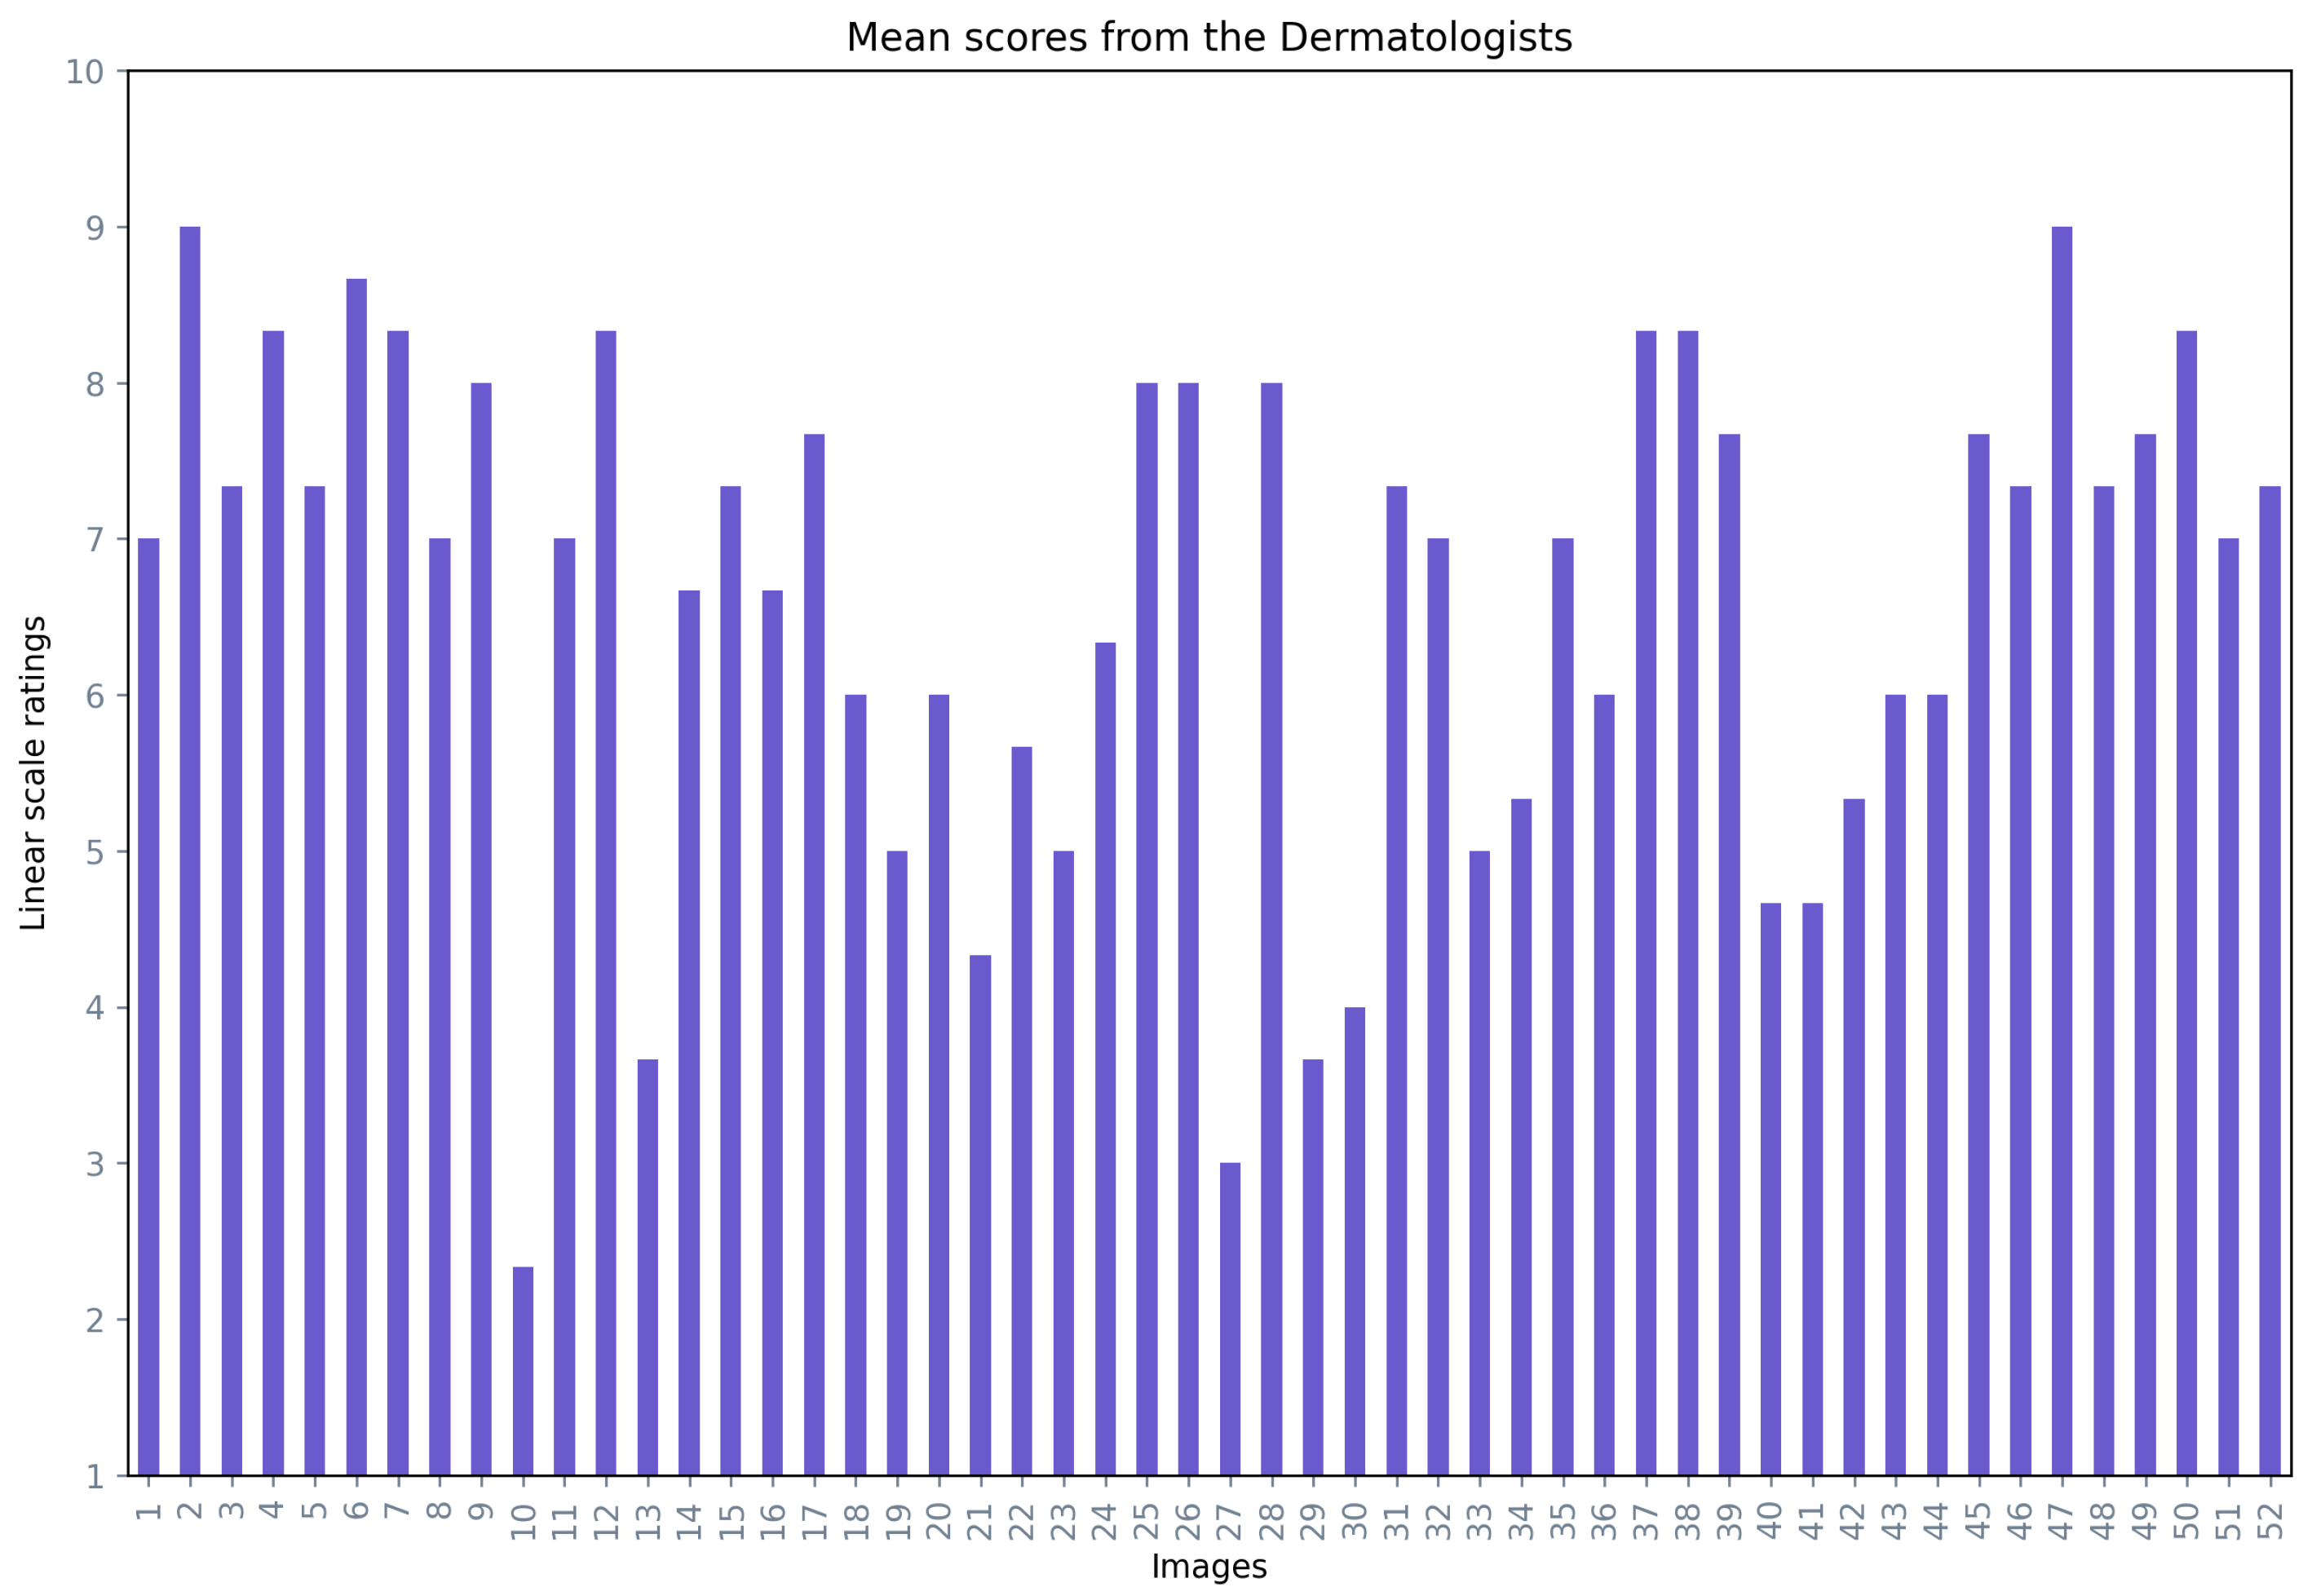


Disclaimer/Publisher’s Note: The statements, opinions and data contained in all publications are solely those of the individual author(s) and contributor(s) and not of MDPI and/or the editor(s). MDPI and/or the editor(s) disclaim responsibility for any injury to people or property resulting from any ideas, methods, instructions or products referred to in the content. |
© 2024 by the authors. Licensee MDPI, Basel, Switzerland. This article is an open access article distributed under the terms and conditions of the Creative Commons Attribution (CC BY) license (https://creativecommons.org/licenses/by/4.0/).