1. Introduction
The design and manufacturing processes of an antenna require, as a crucial step, its characterization. Indeed, it is a very challenging task since the characteristics of the antenna (frequency, electric dimension, far-field angular coverage, environmental conditions, etc.) and the intended application determine the choice of the measurement technique to be used that guarantees the greatest accuracy [
1]. The pros and cons of far-field versus near-field test ranges are well known to the antenna measurement community. The far-field test ranges are usually employed when dealing with antennas working at low frequencies, and only the far-field (FF) pattern in the principal planes is required. Near-field (NF) test setups are instead used when dealing with antennas working at higher frequencies, and complete FF pattern evaluations and polarisation measurements are required. Note that, unlike NF test setups, the FF test range is usually an outdoor setup and has the disadvantage that the weather conditions and surroundings (buildings, hills, objects, electromagnetic interference from other wireless networks) can impair the accuracy of the measurements. Nevertheless, the use of the NF test setups requires a greater number of measurements than the FF ones, since the collected measurements have to be properly post-processed through a NF/FF transformation to obtain the FF pattern in any desired cut plane. The choice of the NF test setup to be used is always a trade-off between the type of antenna, the measurement requests, and the involved analytical and mechanical complexities. Accordingly, the planar NF test setup is usually chosen to characterise high-directivity antennas under test (AUTs); the cylindrical NF test setup is well-suited for AUTs mainly radiating in an angular zone centred on the horizontal plane; the spherical NF test setup is particularly recommended for AUTs without preferential radiation directions. Obviously, depending on the NF test setup adopted to characterise the antenna under test (AUT), the NF/FF transformation employed to evaluate the FF pattern can be planar, cylindrical, or spherical [
1,
2,
3,
4,
5,
6,
7,
8]. It must be stressed that the spherical NF test setup shows the greatest mechanical complexity, and the related NF/FF transformation is analytically the most complex. In any case, it can be adopted to characterise any kind of antennas, allowing a FF characterization over the whole FF sphere without any truncation error, and, accordingly, can be considered the purest and most complete NF antenna measurement solution. This is the reason why, over the years, it has attracted the attention of the antenna measurements community (see [
9,
10,
11,
12,
13,
14,
15,
16,
17,
18,
19,
20,
21,
22,
23,
24,
25,
26,
27,
28,
29,
30,
31,
32] as a non-exhaustive list of references). In particular, many efforts have been devoted to developing NF/FF transformations with spherical scan using sampling techniques more efficient from a data reduction viewpoint than the classical NF/FF transformation developed by Hansen in [
15]. As a matter of fact, this last makes use of a spherical sampling grid, in which the number of parallels and that of the samples along each parallel are related, according to “the minimum sphere rule,” to the radius of the minimum sphere containing the AUT. Obviously, the larger the AUT size, the greater the number of measurements and, as a consequence, the longer the acquisition time. The theoretical results concerning the non-redundant sampling representations of the radiated or scattered electromagnetic (EM) fields [
33] have been exploited to develop NF/FF transformations [
16,
26,
27,
28], which make use of a smaller number of measurement points as compared to that utilised by classical Hansen’s technique [
15]. These techniques have proven to be effective from a numerical and experimental standpoint without impairing the accuracy of the FF reconstruction process. This has been made possible since, according to [
33], it is possible to adopt an effective non-redundant sampling representation of the voltage, which makes use of a minimum set of NF samples, whose number depends on the convex surface chosen to model the considered AUT. These voltage samples are then interpolated by an “ad hoc” two-dimensional optimal sampling interpolation (OSI) formula to reconstruct the voltage values that the measuring probe would have collected at the sampling points of the classical spherical grid, thus allowing one to get the FF pattern via Hansen’s NF/FF transformation technique. The choice of the modelling surface is crucial for obtaining a sampling representation that is really non-redundant and substantially depends on the given AUT, since the choice criterion is that the modelling surface is chosen such that it adheres as much as possible to its actual geometry. Thus, the modelling surface has been chosen in [
16,
26,
27] coincident with that of an oblate spheroid [
16,
27] or that obtained by two circular bowls sharing the apertures and with eventually different lateral bendings (double bowl modelling) [
26] to characterise a quasi-planar AUT, while in [
16,
26,
27] a prolate spheroidal surface [
16,
27] or that bounding a cylinder terminated by two hemispherical caps (rounded cylinder) [
26] has been adopted for a long AUT.
A very adaptable surface, bounding a central cylindrical body ended by two circular bowls with the same apertures and different bases, has been recently proposed [
34] to characterise 3-D modular AUTs. As a matter of fact, it is able to best shape the geometry of such a kind of antenna, as well as any volumetric AUTs, by properly setting the height and the radius of the central body and the radii of the lateral bendings, thus minimising the volumetric redundancy, as well as the amount of the required measurements to be collected, as compared to a spherical modelling of the source. Note that such a surface has four degrees of freedom in the choice of the geometrical parameters and contains the surfaces bounding a rounded cylinder, a double bowl, and a sphere as particular cases.
The characterization of large and heavy AUTs in spherical NF setups requires the use of mechanically stable supports in order to ensure high repeatability of the measurements. In such a case, the size and weight of the considered AUT do not allow one to satisfy such a requirement. This occurs when testing one or more antennas mounted on a large platform or integrated with the body of a car or aircraft, and the interest is not just to test the single antennas but the whole structure (antenna plus platform/vehicle) in order to assess its capability to build up the wireless link with the network infrastructure (terrestrial or satellite network) for which it is intended in its operating conditions. To meet such a goal, the considered radiating structure can be characterised through a hemispherical NF setup, wherein such a structure is placed on a turning metallic ground, providing the required well-defined measurement environment to ensure a high degree of repeatability, and the NF measurements are collected by the measuring probe, guided along a circular arc or mounted on a rotating gantry, over the upper hemisphere. Obviously, the NF data at the points of the spherical sampling grid required by Hansen’s NF/FF transformation technique falling over the lower hemisphere must be set to zero, thus impairing the accuracy of FF reconstructions, which will be affected by a severe truncation error. This issue can be overcome, as proposed in [
35,
36], by applying the principle of image [
37] in the presence of an infinitely perfectly electric conducting (PEC) ground plane for synthesising the lacking NF data over the lower hemisphere. Such a suggestion has been followed in [
38,
39] to develop non-redundant NF/FF transformations with a hemispherical scan for long AUTs.
The aim of this paper is to develop, according to the sampling strategy proposed in [
38,
39], a non-redundant NF/FF transformation with a hemispherical scan suitable for characterising volumetric AUTs whose encumbrance has one or two predominant dimensions as compared to the other one(s). Such a transformation technique makes use of the principle of image [
37] to account for the PEC ground plane, which is supposed to be of infinite extent, and employs the adaptable surface developed in [
34] to model the AUT and its image. It is possible to properly develop an efficient sampling representation over a sphere, wherein the sampling points lying on the upper hemisphere are the measurement points and the points belonging to the lower hemisphere are those at which the NF data have to be synthesised. A 2-D OSI algorithm, which allows the accurate reconstruction of the NF data needed by Hansen’s NF/FF transformation technique, is also developed.
The paper is organised as follows: In
Section 1, the interests and motivations for developing a non-redundant NF/FF transformation from NF data collected in the presence of a PEC ground plane and using very flexible antenna modelling to fit volumetric AUTs are stressed. In
Section 2, an effective sampling representation of the voltage acquired by the probe over the scanning hemisphere is developed by properly applying the non-redundant representations of EM fields [
33], by exploiting the principle of image [
37] to account for the infinite PEC ground plane and by assuming the AUT and its image as contained in the adaptable surface developed in [
34]. A two-dimensional OSI formula allowing one to accurately reconstruct the probe voltage at any point on the scanning sphere from a non-redundant number of its samples collected over the upper hemisphere is also developed in the same section. Numerical results assessing the accuracy of the developed OSI representation and of the corresponding NF/FF transformation are reported in
Section 3. At last,
Section 4 collects the conclusions.
2. Sampling Representation over the Upper Hemisphere
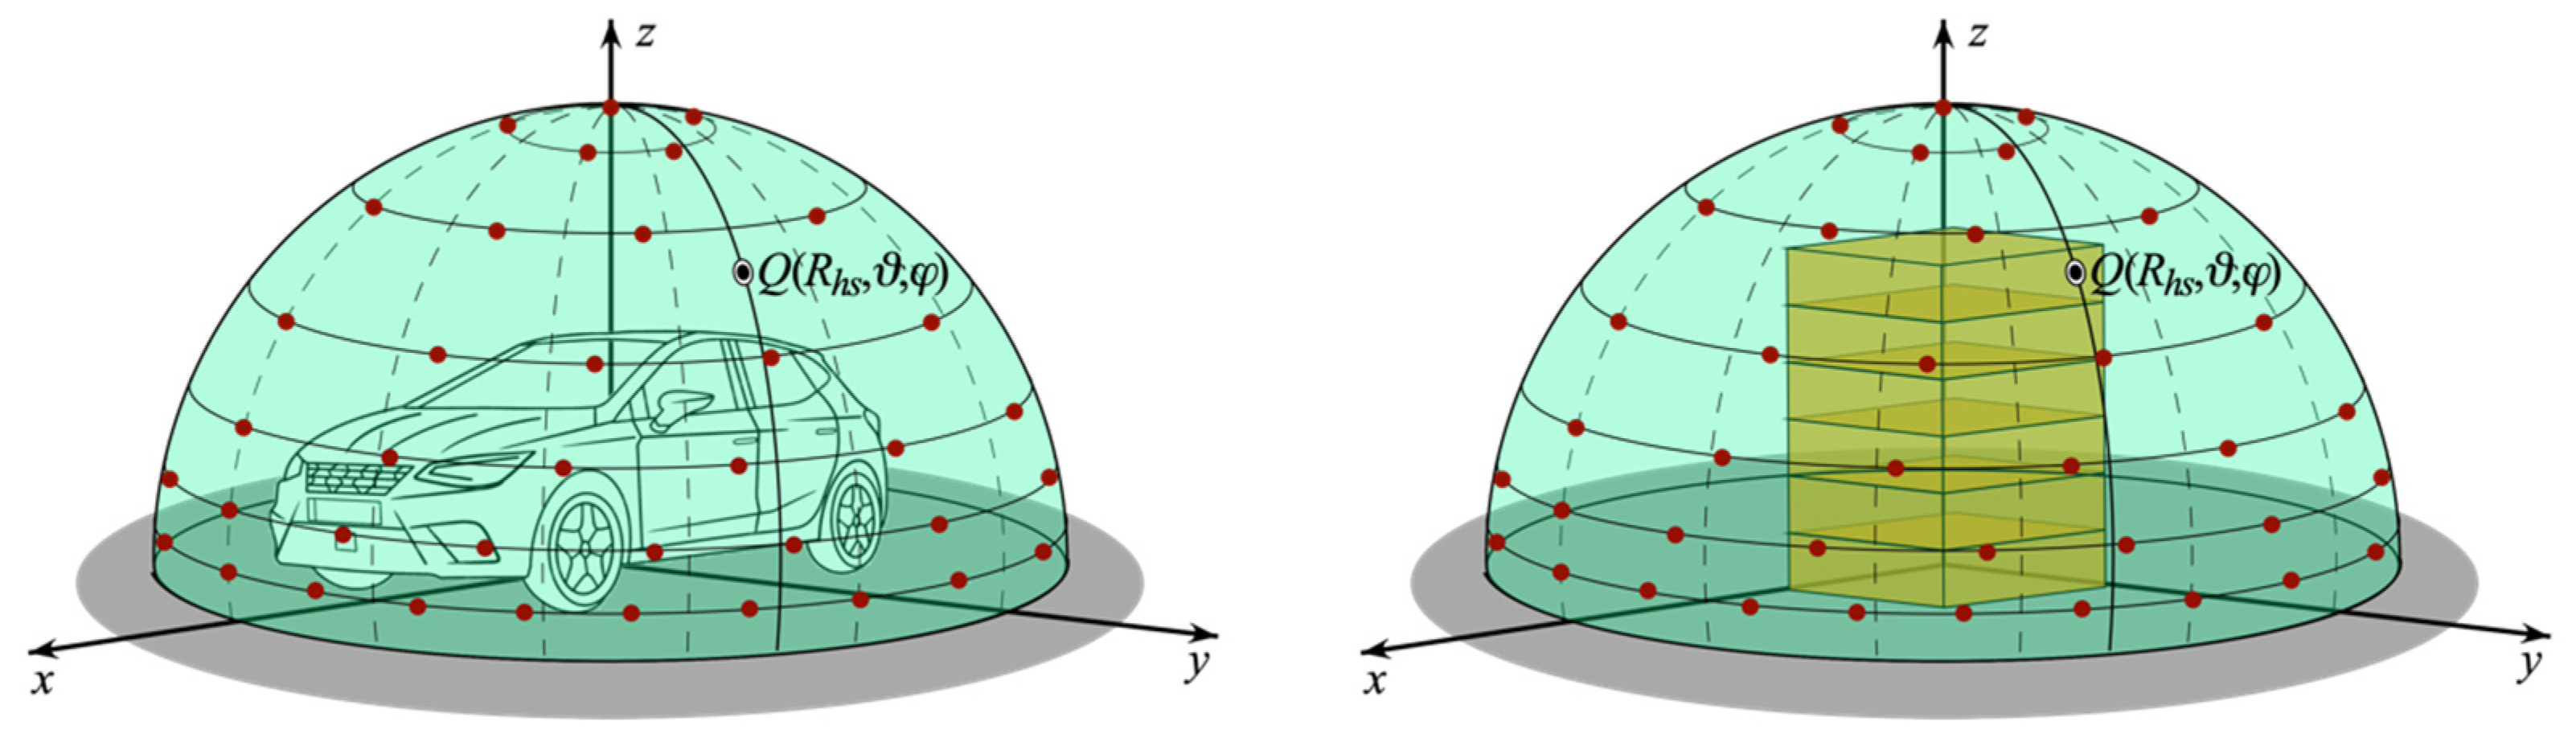
Let us characterise a large and heavy AUT through a spherical NF setup. The scanning is realised by combining the azimuthal movement of a metallic turntable, which can be conveniently modelled as a PEC plane with infinite extension, with the elevation motion of a small first-order measurement probe, guided along a circular arc or mounted on a rotating gantry. Accordingly, the considered probe, which possesses the same bandwidth as the AUT one [
40], collects the NF measurements over the upper hemisphere of radius
in presence of an infinite PEC ground plane (
Figure 1 and
Figure 2). Let us introduce a spherical coordinate system (
) having its origin
O on the infinite PEC ground and coincident with the centre of the spherical measurement system to denote any observation point
Q. Moreover, let us suppose that the considered AUT is
away from the ground plane.
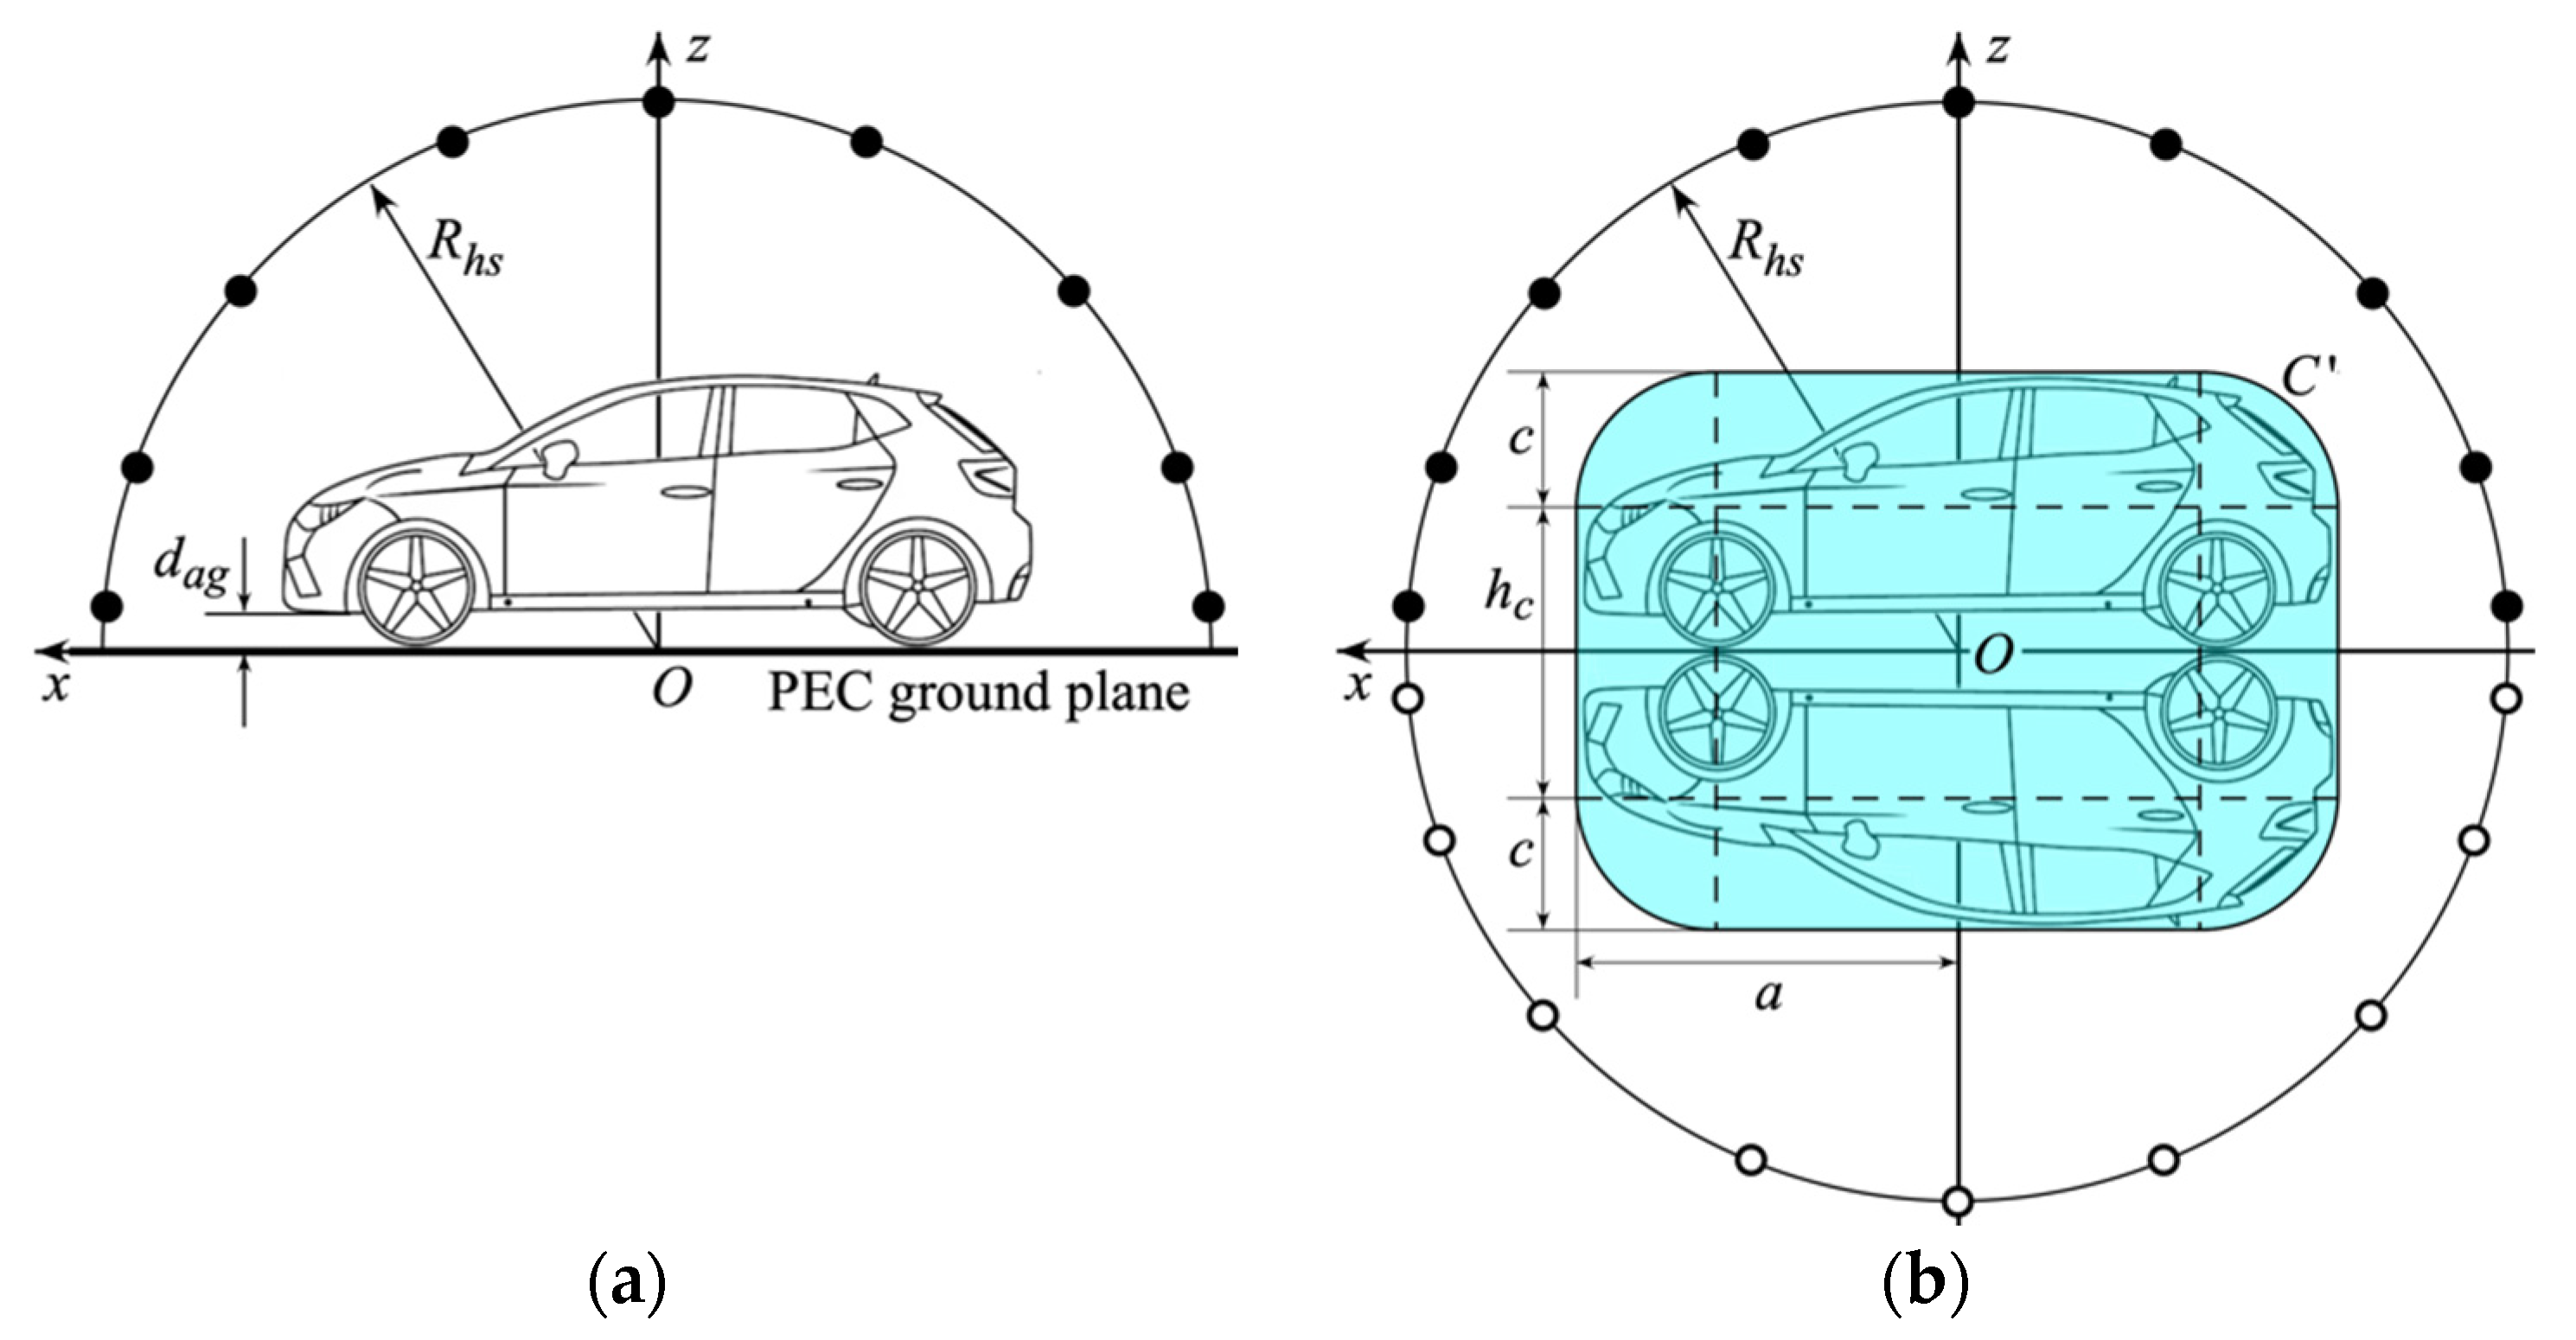
The non-redundant sampling representation over the scanning hemisphere is developed by reformulating the problem according to the principle of image [
37], which provides a convenient way to study a radiating structure in the presence of an infinite PEC ground plane. As a matter of fact, it enables us to consider, instead of the original problem (
Figure 2a), an equivalent one (
Figure 2b), wherein the infinite PEC ground plane is substituted by the image of the AUT above it. The AUT image is below the ground plane at the same distance as the AUT is above it, in order that the boundary condition of the equivalent problem is equal to the PEC boundary condition of the original problem. Accordingly, the AUT and its image can be considered together in the equivalent problem as a single combined AUT.
To fulfil the requirements of the non-redundant representations of EM fields [
33], (i) the combined AUT (the considered AUT plus its image) has to be modelled by a convex surface,
, which fits as much as possible its actual geometry; (ii) each meridian and parallel describing the spherical observation surface must be represented in terms of a convenient parameter
τ; and (iii) a suitable phase factor
has to be determined in order to introduce the so-called “reduced voltage”
with
,
denoting the voltage at the terminals of the probe in two of its orientations (in the second one, the probe is rotated by 90° around its axis). Such a reduced voltage is particularly convenient since, despite the mere voltage, it exhibits the features of a bandlimited function [
33]. Indeed, it is only quasi-bandlimited, but it can be shown [
33] that a very small error is made if
is approximated by a rigorously bandlimited function. To this end, its bandwidth
is increased by a factor
, named excess bandwidth factor, which is able to control the aliasing error [
33]. A
-factor slightly greater than unity is enough when considering AUTs of large size, as those here considered.
The combined AUT of the equivalent problem can be considered a volumetric antenna, whose encumbrance has one or two predominant dimensions as compared to the other one(s), depending on the shape of the original antenna and its distance from the PEC ground. In order to choose the modelling surface
able to best fit the real geometry of the combined AUT, whatever its encumbrance, the very adaptable surface proposed in [
34] can be conveniently employed. Due to the geometry of the equivalent problem, the here adopted one bounds a central cylindrical body of radius
a and height
, which ends into two circular bowls with same aperture radii
a and lateral bending radii
c (see
Figure 2b). These parameters can be properly set to minimise the volumetric redundancy, and accordingly, the number of required samples. Note that, by setting
and
c =
a, the adaptable surface
reduces to the spherical one; by choosing
,
becomes the surface bounding a double bowl; and by setting
c =
a, the surface
reduces to that bounding a rounded cylinder.
Now, having properly modelled the combined AUT, each of the curves (meridian and parallel) of the observation surface has to be described according to the non-redundant representations framework [
33] by choosing the bandwidth
and determining the optimal parameter
τ and phase function
γ.
In the case of a meridian, the bandwidth is chosen to be equal to
where
is the length of the curve
C′, obtained by intersecting the meridian plane passing through
Q with
and equal to
, and λ the wavelength. Then, the optimal parameter
τ and phase function γ are [
33,
34]:
where
and
are the distances from
Q to tangency points
on
C′ and
the corresponding curvilinear abscissae. Note that relations (3) and (4) depend on the position of
Q when moving from 0 to
, since the distances
and the corresponding curvilinear abscissae
change accordingly. Five cases occur in such a case, whose details can be found in [
34].
In the case of a parallel, it can be easily shown [
33,
34] that
γ is constant and that the optimal parameter
τ to be used to represent it is the azimuthal parameter
. The corresponding bandwidth is:
where
are the maximum and minimum distances from the considered parallel to the circumference of
at
z′,
, and
ρ′(
z′) represents the equation of
in cylindrical coordinates. It can be easily proved [
34] that the wanted maximum is in the zone of the surface
lying on the same side of the considered parallel with regard to its maximum transverse circumference. Such a maximum is reached at
if
. If
, it is sought as the value of the angular coordinate
α such that
for which
.
The use of the above non-redundant parameters allows one to determine the arrangement of the sampling points over the whole observation sphere, since they have been derived by considering the equivalent problem. Anyhow, only the NF sampling points belonging to the upper hemisphere can be reached in practice due to the presence of the infinite PEC ground plane. As will be shown later, the OSI algorithm also requires knowledge of those samples falling in the lower hemisphere; otherwise, they have to be set to zero, thus determining a severe truncation error in the reconstruction of the NF data required by Hansen’s NF/FF transformation. Again, the application of the image principle offers the possibility of overcoming this issue. As a matter of fact, these missing samples, which should have been acquired by the probe and rotated probe, can be synthesised from the corresponding ones collected on the upper hemisphere by applying the following “mirroring rule”:
which has been properly developed for the first-order probe adopted here.
It must be stressed that, to make possible the mirroring of the collected voltage samples according to (7), the sample arrangement must be symmetrically distributed with respect to the plane z = 0 and must not contain the equator as sampling parallel due to the presence in that plane of the infinite PEC ground plane.
The NF samples directly acquired on the upper hemisphere and those mirrored via (7) are efficiently interpolated to obtain the NF data needed by Hansen’s NF/FF transformation. To this end, the following two-dimensional OSI algorithm [
33,
34] is conveniently employed. It exploits two properly matched OSI expansions, one allowing the interpolation along the meridians and the other along the parallels. Both expansions use few samples nearest to the given output point. To reconstruct the voltage at a point
Q of Hansen’s spherical grid, the algorithm works as follows: It considers the meridian passing through
Q(
) and uses the following OSI expansion along the parallels [
33]
to reconstruct the 2
p intermediate samples at the intersection points (
) of the meridian at
with the involved sampling parallels.
In (8),
are the involved 2
q non-redundant voltage samples directly measured or synthesised on each of 2
p parallels over the spherical observation surface with steps
where
is the number of the parallels (poles included), symmetrically distributed with respect to the plane
z = 0, with
and necessarily odd to avoid the equator as a sampling parallel,
is the number of the samples on each of them,
and
is the floor function. Moreover,
is the index of the sample nearest to each point intersecting the meridian at
φ,
,
,
an oversampling factor needed to control the truncation error [
33], and
being the Tschebyscheff polynomial of degree . Note that, in using expansion (8), there is no need to extract the phase factor since it is constant along each involved parallel.
The 2
p intermediate samples are then interpolated via the following OSI expansion along the meridians [
33,
34]
to finally get the value of the voltage
V at
Q. In (13),
is the index of the sample closest to
Q,
,
, and the other symbols have the same or analogous meanings as in (8), save for
which is the Dirichlet function tailored for an even number of samples, needed to account for the symmetric distribution of the parallels with respect to the plane
z = 0.
3. Numerical Results
In this section, some representative results numerically assessing the feasability of the proposed spherical NF/FF transformation for characterising volumetric AUTs in the presence of an infinitely perfectly conducting ground plane are presented. In order to show the capability of the proposed AUT modelling to reduce volumetric redundancy and, as a consequence, the number of required NF samples, two different kinds of antennas have been considered. The former (Case A) is a volumetric AUT whose geometry is characterised by two predominant dimensions as, f.i., a parallelepiped having its width (W) and length (L) greater than the height (H), while the latter (Case B) is a volumetric AUT having a predominant dimension as, f.i., a parallelepiped for which H > W, L.
The AUT of Case A has been properly arranged to simulate an automotive body. To this end, a rectangular parallelepiped surmounted by a rectangle has been considered. The parallelepiped, whose geometric centre lies on the z-axis of the adopted () reference system, has width = 14 λ, length = 35 λ, and height = 6 λ and is located at 2 λ from the PEC ground plane. The rectangle is 4.5 λ above the parallelepiped and is 14 λ wide and 25 λ long. A planar array of elementary Huygens sources, spaced by λ/2 and polarized along the z-axis, is located on each of the faces of the parallelepiped at y = 17.5 λ and y = −17.5 λ. Moreover, the rectangle surmounting the parallelepiped is covered by another planar array of Huygens sources spaced by λ/2 and polarized along the y-axis. An open-ended WR430 rectangular waveguide, operating at 2.45 GHz, scans a hemisphere of radius = 30 λ. To account for the presence of the infinite ground plane and properly develop the non-redundant representation over the entire sphere, the proposed technique exploits the principle of image, according to which the voltage at any sampling point is due to the contributions from the AUT and its image. To properly simulate the NF samples, the image of the AUT has been obtained by mirroring each electric and magnetic dipole, realising an elementary Huygens source of the AUT. Then, the obtained combined AUT has been modelled by an adaptable surface having parameters a = 18.85 λ, = 16 λ, and c = 4.5 λ. Moreover, rule (7) has been used to synthesise the NF samples, which should have been measured by the probe and rotated probe on the lower hemisphere. The non-redundant sampling representation has been obtained by adopting = = 1.10.
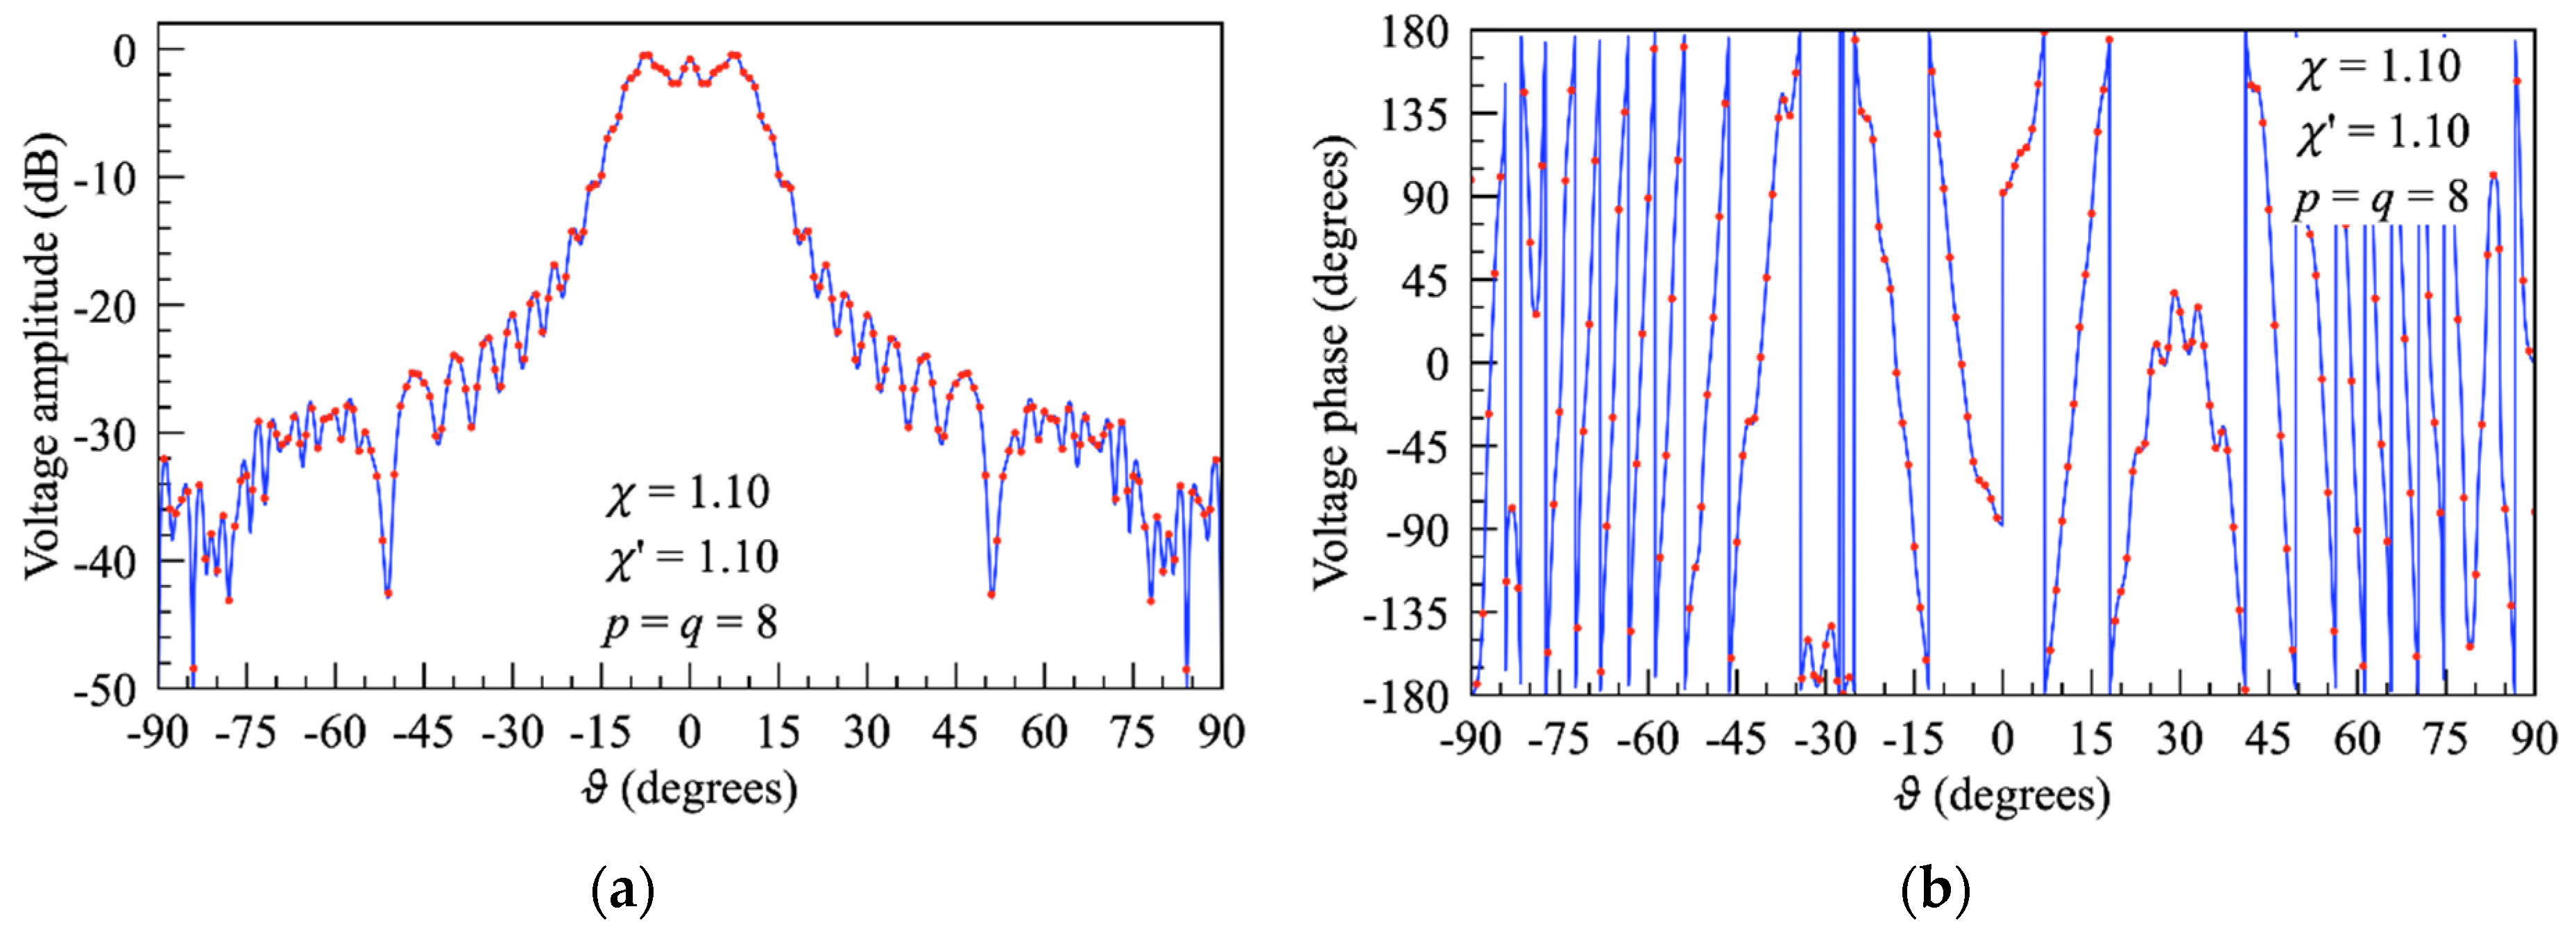
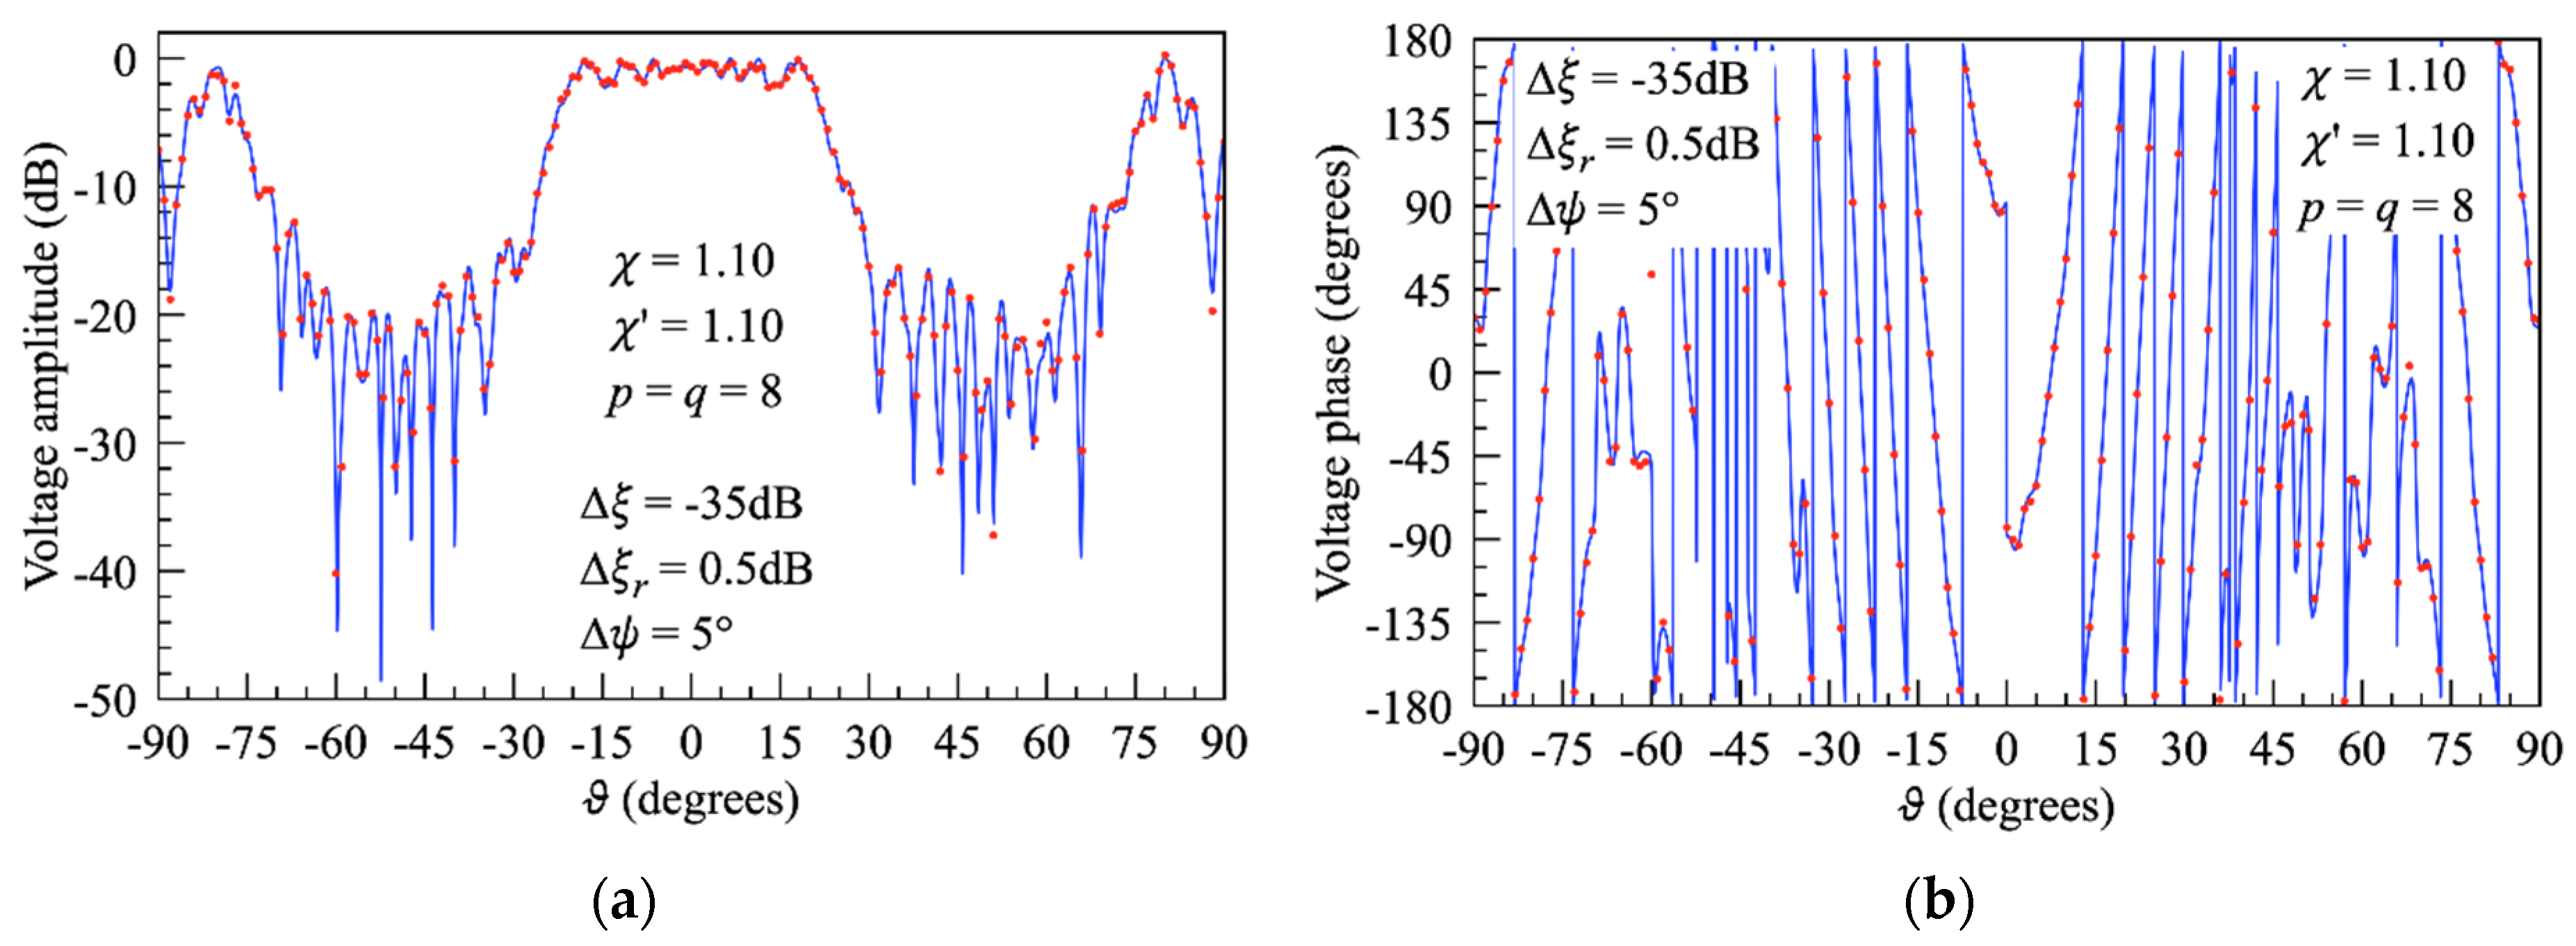
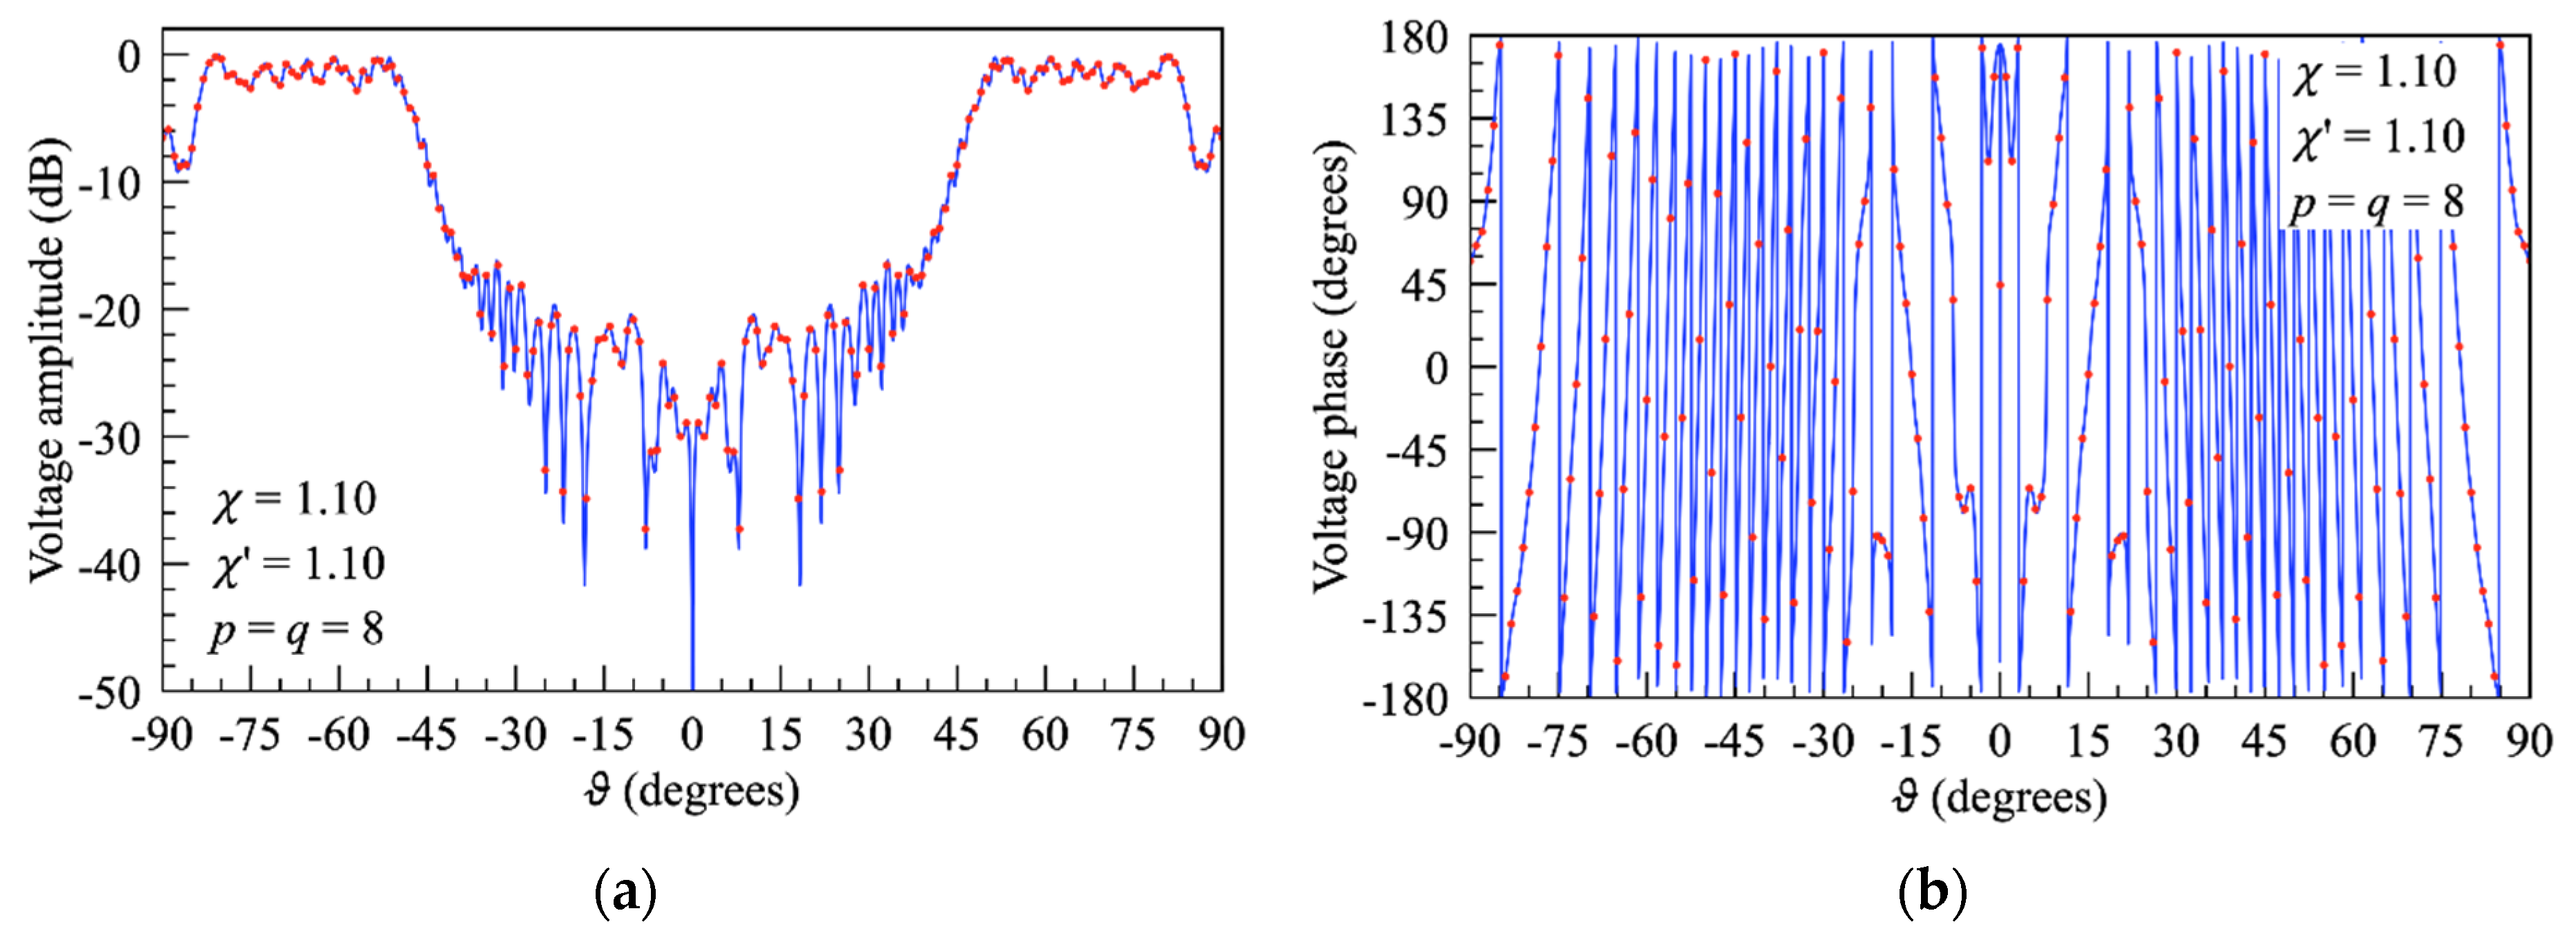
To test the precision of the proposed sampling strategy and of OSI algorithms (8) and (13) from a qualitative standpoint,
Figure 3 and
Figure 4 show the comparisons of the exact and reconstructed normalised amplitudes and phases of the voltages
and
on the meridians at
= 0° and
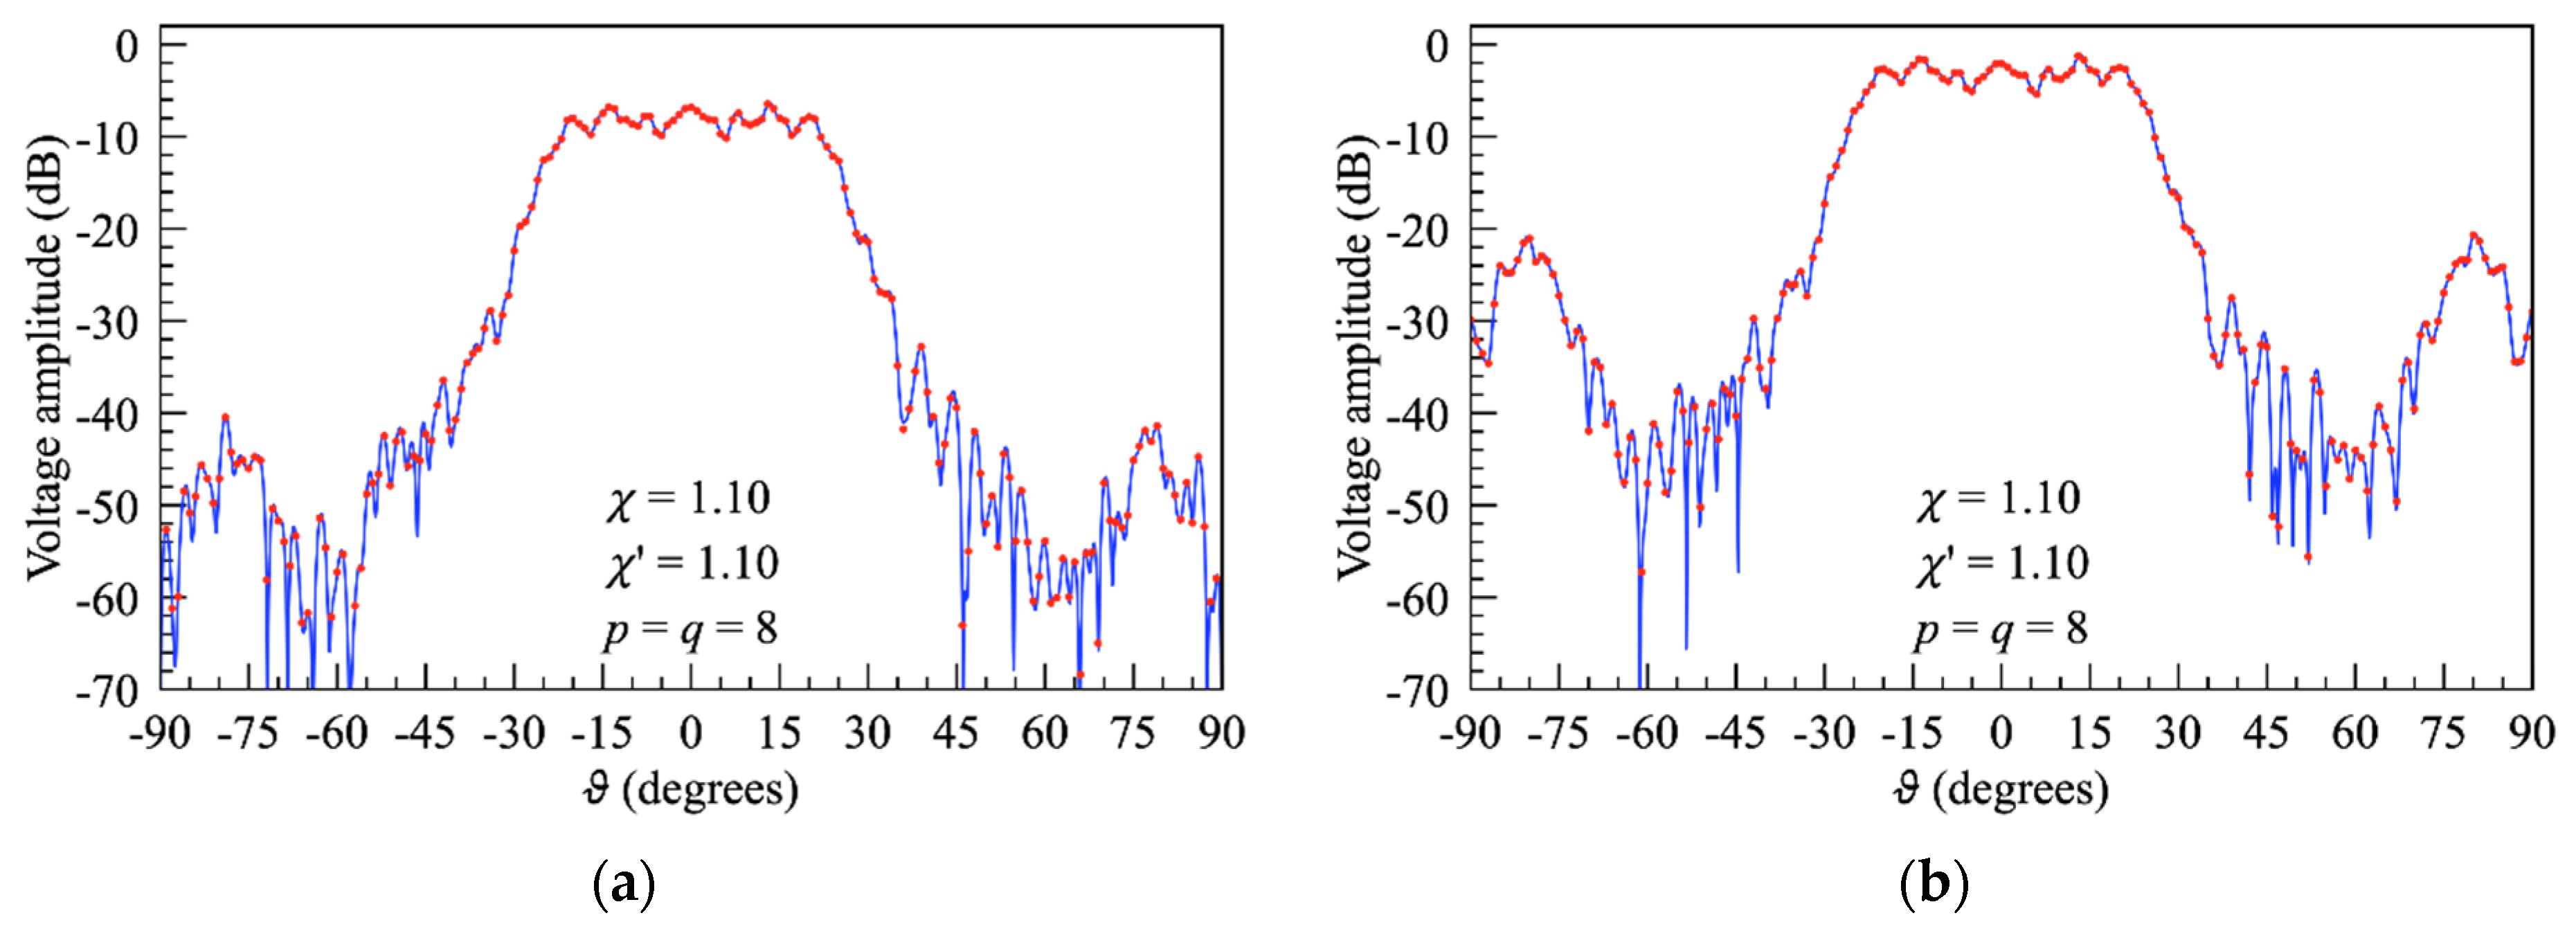
= 90°. As can be seen, the recovered patterns over the upper hemisphere are in very good agreement with the exact ones and do not suffer from any truncation errors. For the sake of completeness, the recoveries of the amplitudes of
and
relevant to the meridian at
= 60° are also reported in
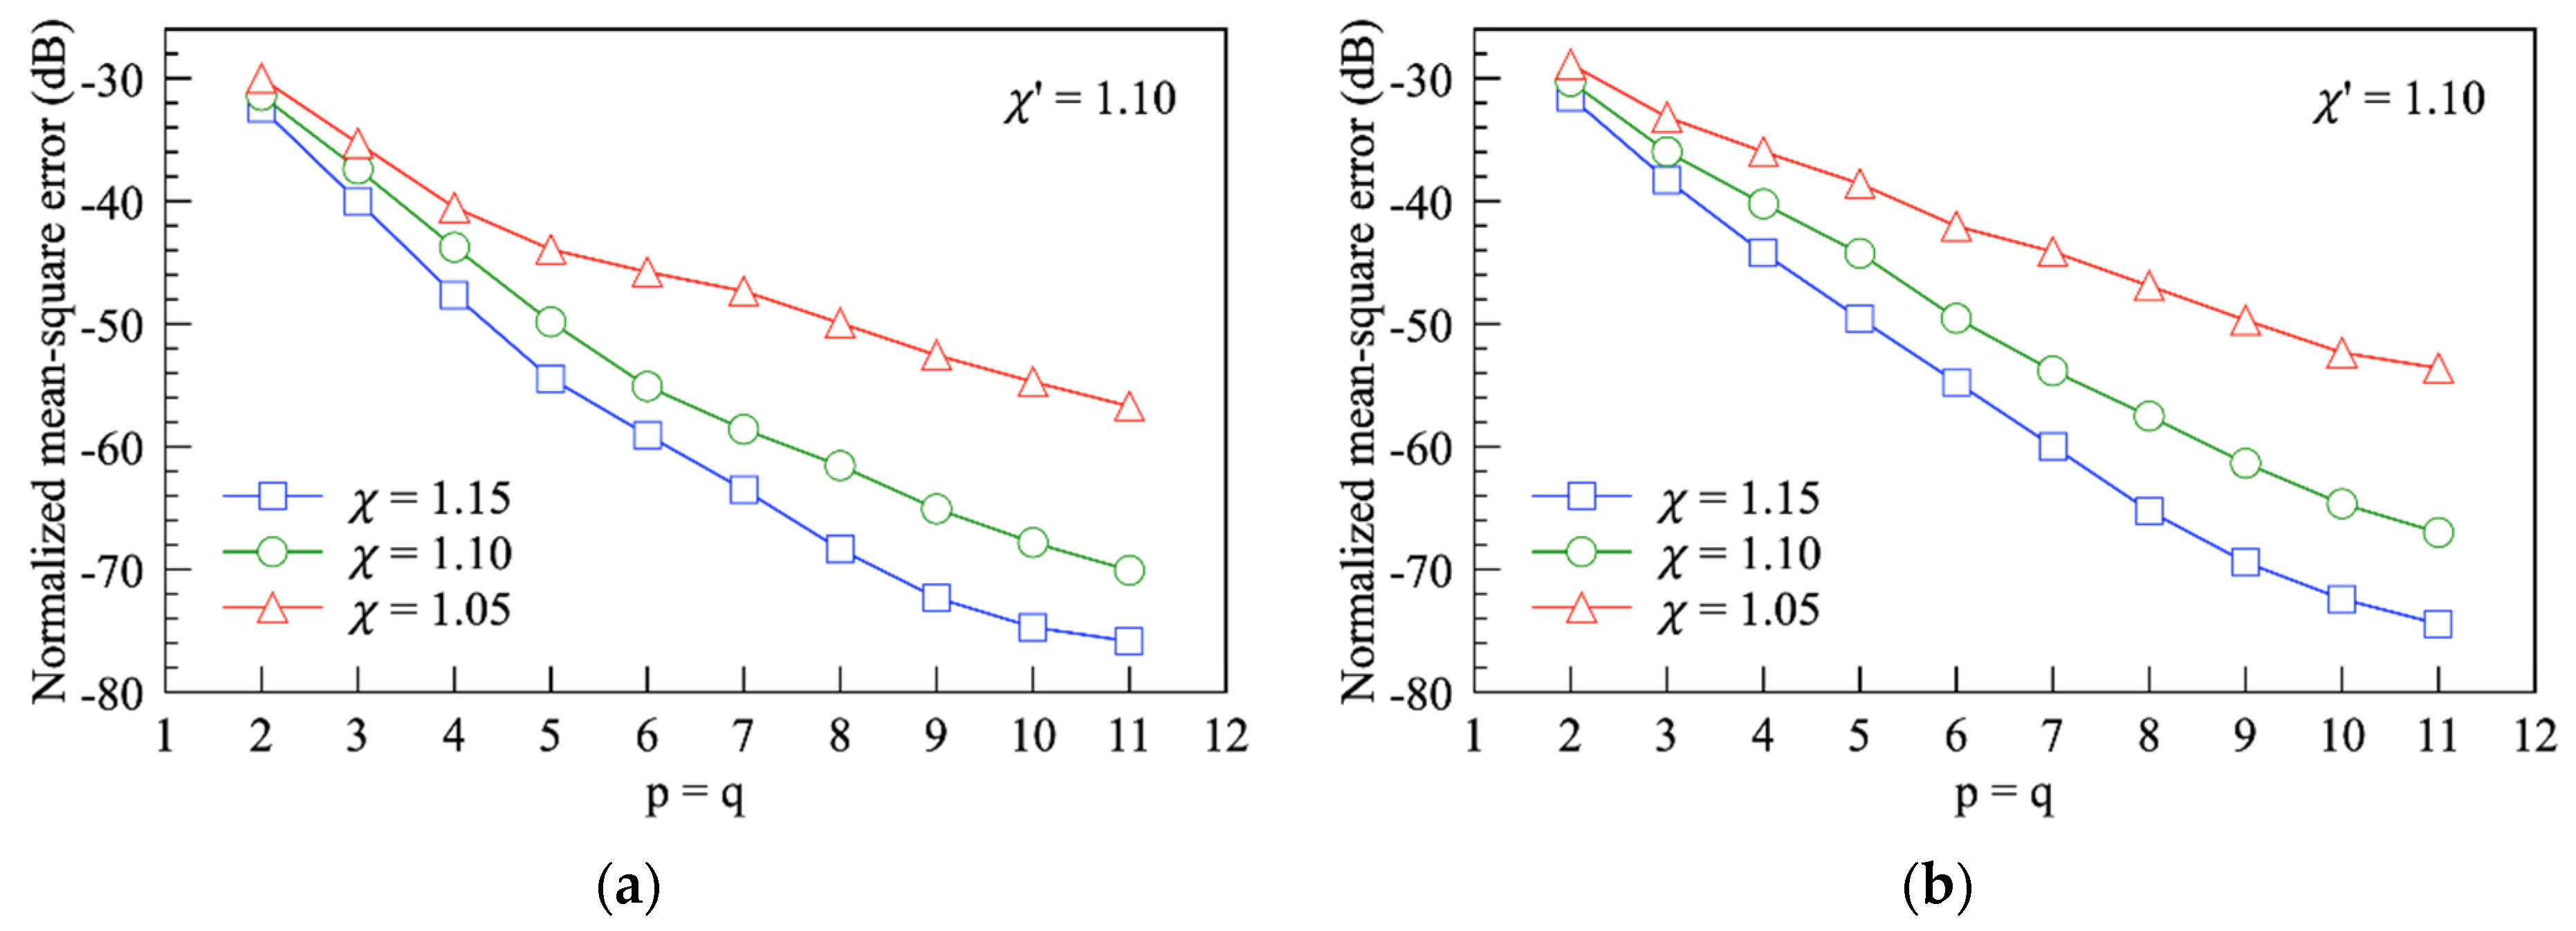
Figure 5. The effectiveness of the OSI algorithm is confirmed by the normalised mean-square reconstruction errors. Such errors have been obtained by comparing the exact and recovered values of
and
on a dense grid of the scanning hemisphere and normalizing them to the maximum voltage value over it. As shown in
Figure 6, these errors, computed for
,
, and
p,
q ranging from 2 to 11, decrease as
,
p, and
q increase. This provides a tool for properly choosing the sampling/OSI parameters for a given reconstruction error. Note that a very low reconstruction error of about −60 dB occurs for the adopted sampling/OSI parameters
=
= 1.10 and
p =
q = 8. Such an error can be considered negligible if compared with the measurement one. Moreover, to investigate the algorithm stability, the NF samples have been simulated as corrupted with random errors. In particular, a background noise (having an amplitude bound to
and an arbitrary phase) and an uncertainty of
in amplitude and
in phase have been added to each exact NF sample over the upper hemisphere.
Figure 7 shows the reconstructions of amplitude and phase on the meridian at
= 90° obtained from these error-affected samples, which assess the algorithm’s stability even in a real measurement environment.
At last, OSI algorithms (8) and (13) have been adopted for recovering the NF data required to perform Hansen’s NF/FF transformation technique [
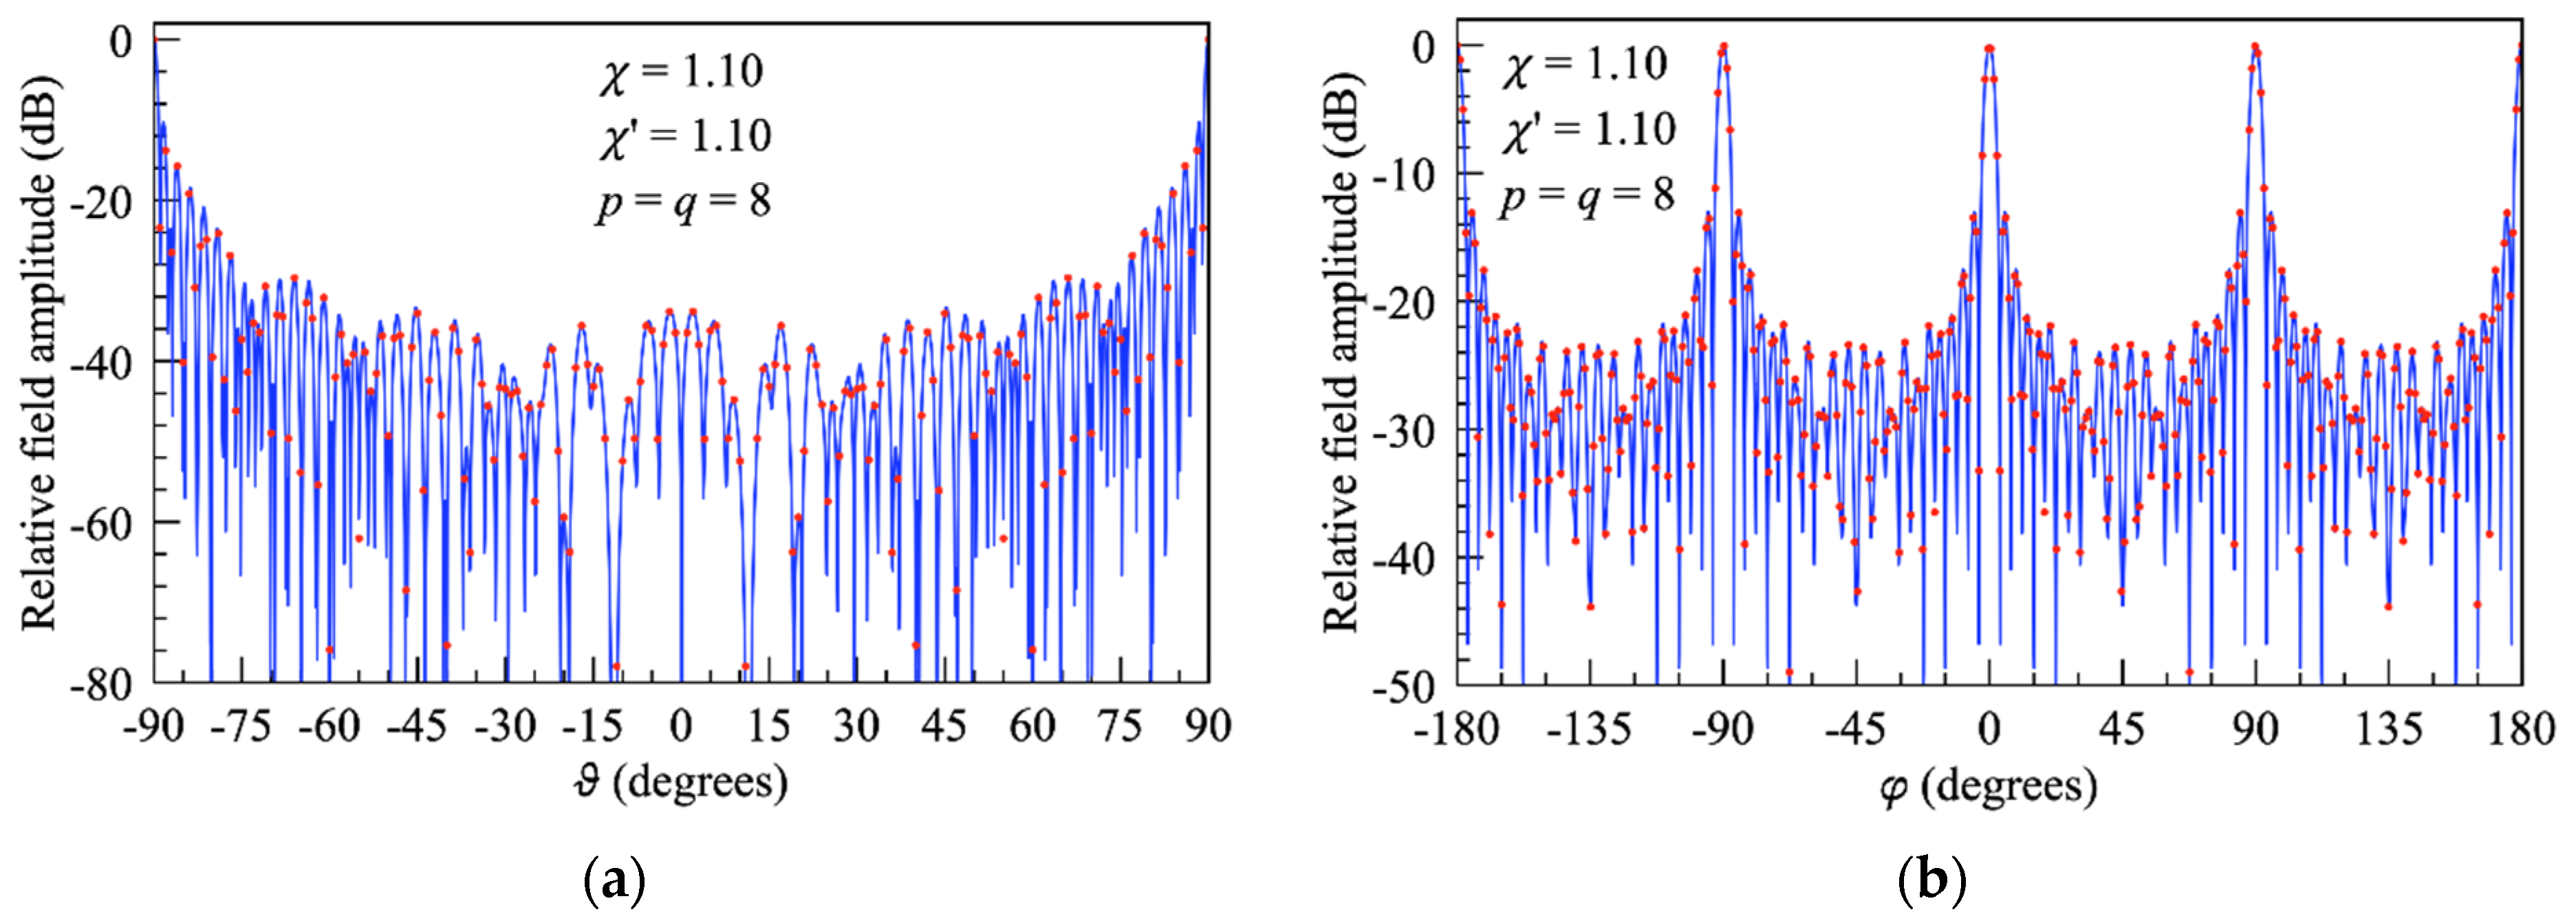
15] from those collected and synthesised according to rule (7) at the points of the upper and lower hemispheres, respectively, set by the developed sampling strategy.
Figure 8 shows the comparisons between the recovered FF patterns in the cut planes at
= 0°, 60°, and 90° and the corresponding exact ones over the upper hemisphere. As can be seen, the exact and recovered FF patterns agree very well, thus proving the efficiency of the devised NF/FF transformation with hemispherical scanning in the presence of an infinite PEC ground plane for volumetric AUT exhibiting two predominant dimensions.
The AUT of Case B has been properly arranged to simulate an antenna having a predominant dimension. To this end, a rectangular parallelepiped, with dimensions equal to = and having its centre on the z-axis of the used () reference system, has been considered. It is placed 2 λ away from the PEC ground plane, and its lateral faces are covered by planar arrays of elementary Huygens sources, spaced by λ/2 and polarized along the z-axis. To simulate the combined AUT, the image of such an antenna with respect to the xy plane has been obtained as described in the previous example. Then, the combined AUT has been considered enclosed in the adaptable surface with parameters a = 10.6 λ, = 50 λ, and c = 2.5 λ. The non-redundant sampling representation on the entire sphere has been obtained by adopting = = 1.10. The NF samples at the corresponding sampling points have been simulated as acquired (or synthesised according rule (7)) on a sphere of radius = 35 λ.
To qualitatively appreciate the effectiveness of OSI algorithms (8) and (13), the reconstruction of the voltage
on the meridian at
= 90° is shown in
Figure 9. As can be seen, the reconstruction over the upper hemisphere is very accurate. The same accuracy is also experienced for the voltage reconstructions relevant to other meridians. These reconstructions are not shown here to save space. In any case, the accuracy of the devised strategy and of the related OSI algorithm can be appreciated by the normalised mean-square reconstruction errors relevant to the voltage
, computed for
,
,
p, and
q ranging from 2 to 11 and reported in
Figure 10a. As can be seen, very low reconstruction errors (about −55 dB) occur for the chosen sampling/OSI parameters. Moreover, the voltage reconstruction in
Figure 10b relevant to the meridian at
= 90° and obtained from NF samples affected by random errors, as in a real measurement, assesses the robustness of the adopted OSI algorithm. The background noise and the uncertainty on each NF sample are the same as in the previous case.
The overall effectiveness is confirmed by the FF reconstruction. The ones reported here refer to cut planes at
= 90° and
ϑ = 90°. As can be seen, very good agreements also occur in this case. Note that the FF reconstruction at
ϑ = 90° (see
Figure 11b) is particularly significant, since this result can never be obtained using Hansen’s NF/FF transformation [
15] modified to account for the presence of an infinite PEC ground plane without impairing the reconstruction with a severe truncation error.
It is interesting to compare the number of NF samples collected over the upper hemisphere with that required by Hansen’s NF/FF transformation [
15] in the presence of an infinite PEC ground plane. This last number is about one-half of that which would be required when the probe can be driven along the whole scan sphere. These comparisons are shown in
Table 1 for both reported examples.
As can be noted, in both the cases, the numbers of NF samples required by the devised sampling strategy are smaller than those needed by Hansen’s NF/FF transformation [
15] in the presence of an infinite PEC ground plane, and this reduction reflects in a significant reduction in measurement time. Note that the devised approach also offers the possibility of recovering the NF data of the classical spherical lattice lying on the equator, otherwise zeroed when executing Hansen’s NF/FF transformation [
15].


