1. Introduction
Global warming goals make it necessary to change our energetic consumption habits by using renewable energy resources, which can gradually displace the sources of fossil generation [
1,
2,
3]. Nowadays, in the electrical sector, energy production with fossil fuels (coal, diesel, or natural gas) is the common denominator in most countries around the world [
4,
5]. However, with the constant reduction in the production costs of photovoltaic (PV) modules, wind generators, and non-conventional generators based on renewable energy sources, it is possible to transform the energetic matrix by using renewables with competitive prices in comparison with conventional sources [
6,
7].
Electrical distribution networks are not unaffected by the penetration of distributed energy resources, which is due to the fact that these grids cover rural and urban areas with potential renewable energy usage [
8,
9]. In addition, distribution feeders with a radial structure are typically designed to provide power from 3 to 10 MVA in medium-voltage applications, which makes these grids important candidates for integrating renewable energy mainly from PV technology and energy storage systems [
10,
11]. These sources can help with reducing greenhouse gas emissions and energy losses, improving voltage profiles, and also receiving regulatory incentives from some governments mainly in developing countries [
12,
13]. However, the integration of PV sources in electrical distribution networks is not an easy task, since distribution grids are nonlinear, complex systems from the mathematical point of view [
14]. According to the literature review, the optimal location and sizing of PV sources is formulated as a MINLP. This implies that it is not possible to ensure that the global optimum is found via exact optimization methods in polynomial times [
15]. To determine the optimal location and sizing of PV sources, it is important to give greater consideration to economic objective functions than to technical ones (energy losses or voltage improvements), since, from the point of view of the electricity service, the integration of new devices to electrical networks must be economically feasible for the duration of the project [
16]. Some of the analyzed works are presented below.
Ref. [
14] implements multi-objective optimization with the modification of the Jaya Algorithm to determine the optimal location and sizing of PV sources considering the voltage profile improvement and the power loss reductions. The numerical results are validated in the IEEE 33-bus system, but no economic analysis is provided by the authors. Ref. [
16] present the version of the Chu and Beasley Genetic Algorithm (CBGA) as a solution strategy for localization and sizing of PV sources in distribution grids. The authors consider the minimization of the total annual operative costs, which corresponds to the combination of the energy purchase costs in the substation with the investment and maintenance costs of the PV generation units. The numerical results demonstrate the effectiveness of the proposed CBGA in comparison with the MINLP solvers available in the GAMS software. Ref. [
17] propose an improvement of the solution reached by the CBGA with the application of the Newton Metaheuristic (NMA). The quantitative results obtained in the IEEE 34-bus and IEEE 85-bus grids demonstrate the advantage of this algorithm at placing and sizing PV generation units in distribution grids. Additional optimization methods applied to the studied problem are: Particle Swarm Optimization [
18], Cortex Search Algorithm [
19], Wind Driven Optimizer [
20], and heuristic-based methods [
21,
22], among others. The main characteristic of these approaches is that they locate PV sources based on technical objective functions such as voltage stability and energy losses, which makes the validation of the economical feasibility of these approaches a difficult matter. A complete review regarding objective functions, optimization techniques, and methodologies for PV potential assessment can be consulted in [
23].
With respect to the analysis of the literature review, the contributions of this work are: (i) hybridizing the recently developed Arithmetic Optimization Algorithm in [
24] with the Vortex Search Algorithm in order to obtain a powerful Modified Arithmetic Optimization Algorithm (MAOA) combinatorial optimization technique, whose main advantage is that it combines the advantages of the four arithmetic operations with Gaussian distributions to explore vast regions of the solution space at the beginning of the optimization process, as well as to exploit promissory regions at the end of the iterative process; and (ii) the numerical comparison with statistical information of metaheuristic optimizers such as the Newton–Metaheuristic Algorithm, the Chu and Beasley Genetic Algorithm, the AOA, and the MINLP solvers available in the GAMS software. These comparisons help to demonstrate that, for the IEEE 34-bus network, MAOA finds the best optimal solution with the lowest standard deviation among the comparative methods.
It is important to mention that, after reviewing the state of the art regarding the optimal location of PV generation units, a need to propose new optimization algorithms with excellent numerical performance to address this optimization problem was evidenced, as there are no reports that ensure that the global optimum is found for this problem. This is mainly caused by the non-linearities and non-convexities of the solution space, which make it necessary to conduct more studies in this research area. In addition, the proposed hybrid algorithm corresponds to a new contribution in the area of combinatorial optimization that can be used for different MINLP problems in science and engineering.
This work is organized and presented in six sections including introduction:
Section 2 describe the complete MINLP formulation;
Section 3 describes the implemented methodology, which corresponds to the improvement of the Arithmetic Optimization Algorithm with an new exploration-exploitation phase based on hyper-ellipses with variable radius generated with Gaussian distribution centered on the current best solution;
Section 4 describes the main characteristics of the IEEE 34-bus grid, including its grid topology and its line and demand parameters, as well as the parametrization of the objective function and the demand and solar curves employed in the numerical validations;
Section 5 shows the complete numerical validations of the proposed MAOAs, as well as comparisons with recently reported metaheuristic optimizers and exact MINLP solvers;
Section 6 presents the conclusions and future work.
2. Mathematical Optimization Model
The optimal location and sizing of PV sources in electrical distribution networks can be represented as a MINLP model, where the continuous variables are related to electrical quantities, i.e., currents, voltages and powers, while the integer part is associated with the location of the PV sources [
17,
25]. The objective function represents to the minimization of the investment and maintenance costs of the PV units, together with the energy purchase costs in the substation terminals (note that all of these costs are annualized for a period of time of 20 years and presented using the net present value). This function is defined in Equation (
1), where
is defined as
.
,
,
,
,
T,
,
,
,
,
,
,
,
,
,
and
are described in detail in [
17].
The complete set of constraints include reactive and active power equilibrium, voltage regulation bounds, device capabilities, and the number of PV units available. The implemented constraints are described in Equations (
4)–(
11), where
,
,
,
,
,
,
,
,
,
,
,
,
,
,
,
and
are described in detail in [
17].
The optimization model described in Equations (
1)–(
11) have the following interpretation: Equation (
1) represents the objective function, is the summation of the annual energy purchasing costs in the substation bus defined in Equation (
2) with the annual investment and maintenance costs of the installed PV generation units defined in Equation (
3). The active and reactive power equilibrium are defined in Equations (
4) and (
5). These equations represent the high challenge in the optimization problemsince they are nonlinear non-convex. Inequality box-type constraints (
6)–(
8) represent the active and reactive power bounds in the substation bus and the possibility of generating active power in a particular node
if the binary variable
is activated, respectively. Box-type constraint (
9) defines the admissible voltage magnitudes, and the inequality constraint of Equation (
10) limits themaximumnumber of PV units available for installation. Equation (
11) presents the binary logic of the decision variable
.
To solve the MINLP model in Equations (
1)–(
11) in the current literature, the predominant alternative corresponds to the usage of embedded combinatorial optimization methods due to the large dimensions of the solution spaces in these MINLP models [
26,
27]. These methods allow dealing with the nonlinearities and non-convexities of the model via sequential programming [
14]. In this line, this research proposes the application of a modification of the Arithmetic Optimization Algorithm to solve the problem regarding the optimal siting and sizing of PV units in distribution grids.
3. Solution Methodology
A master-slave solution methodology is herein proposed. In the master stage, the recently developed AOA proposed in [
24] is modified by introducing a Gaussian distribution to explore and exploit the solution space. The master algorithm is entrusted with determining the nodes where the PV sources will be installed along with their optimal sizes, which implies that, in this stage, the integer part of the MINLP model is solved. In the slave stage, a power flow formulation for distribution grids is used. The power flow solution is entrusted with determining the value of the component of the objective function
, i.e., the annual energy purchase costs in the substation bus. In addition, with the power flow solution, the voltage regulation constraint for each node for each period of time is also verified.
The complete description of the master and slave optimization stages is presented below. Note that we will start with the slave stage, since this is fundamental during the exploration and exploitation phases of the AOA and its modified version.
3.1. Slave Stage: Power Flow Solution
The main challenge in distribution systems optimization when considering the complete electrical network corresponds to the solution of the power equilibrium constraints (see Equations (
4) and (
5), respectively) since they are nonlinear and non-convex and require numerical methods to be solved [
28]. The main advantage of using metaheuristic optimizers to solve MINLP models is that the whole model is solved sequentially, i.e., when all the binary variables (location of the PV sources) and their sizes are solved, then the power flow equations can be easily solved through any power flow approach [
14]. Here, we adopt the successive approximation power flow method for AC distribution grids originally proposed in [
28], which is applicable to radial and meshed distribution networks without any modification to its recursive formula. The general recursive power flow formula for the successive approximation method is defined in Equation (
12), where
m,
,
,
,
,
,
and
are described in detail in [
29]:
The main characteristic of the recursive power flow formula of Equation (
12) is that its convergence to the power flow solution can be guaranteed through the application of the Banach fixed-point theorem [
30]. To determine whether the power flow Equation (
12) has converged, the difference between the voltage magnitudes for two consecutive iterations is used, where
, is a tolerance value and is assigned according to [
28].
After the load flow, the active power generated in the slack node is calculated through Equation (
14).
With the solution of
(Equation (
14)) we determine the first component of the objective function, i.e.,
. The second component of the objective function, i.e.,
is obtained through the solution vector of the master stage (PV source sizes). In metaheuristic optimization techniques, the exploration and exploitation of the solution space is performed by a fitness function [
31]. fitness function implemented in this work contains two penalty factors for the voltage regulation constraint, as well as an additional penalty factor with respect to the positive definition of active power generation at the slack source. fitness function is presented in Equation (
15).
When active power generation and voltage regulation are outside the operating limits, the positive penalty factors , , and are enabled, these factors are adjusted in .
3.2. Master Stage: Arithmetic Optimization Algorithm
The AOA is a recently developed optimization algorithm that explores and exploits the solution space by using the distribution of the main four arithmetic operations, namely multiplication, division, subtraction, and addition [
14]. The AOA can be defined as a population-based optimizer that makes the initial population evolve through the solution space. The initial population takes the form of Equation (
16).
where
is the value of variable
j for the
ith individual in the population, with
being the number of variables and
the number of individuals.
The main feature of the proposed solution strategy is that it works with a integer-continuous codification, where the continuous part defines the optimal size and the integer part defines the optimal localization of PV sources. In the studied problem,
is equal to
. Each row
i in the initial population (i.e.,
) takes the following form:
where the first
positions correspond to the integer part of the codification and the positions from
to
.
To explore the solution space, the AOA implements an Math Optimizer Accelerated (i.e., MOA) function, which depends on its maximum and minimum values,
and
, as well as on the current iteration counter
t and the maximum number of iterations
.
Note that the variable factor in Equation (
18) will be used in the exploration and exploitation phases of the AOA by using a random number
, which will be compared to
at each iteration. Each one of the exploration and exploitation iteration phases will be presented below.
3.2.1. Exploration Phase
The AOA uses the properties of the division and multiplication arithmetic operators to generate the position of the
ith individual using the evolution rule defined in Equation (
19).
where
is a variable in function of the number of iterations and has the following structure:
Here,
is a sensitive factor that help improving the exploration accuracy, which is fixed as 0.2 based on the experiments made by [
24]. Note that
is a factor that avoids divisions by zero, but it is small enough and can be selected as equal to the
used in the power flow convergence test. In addition,
is a random number with normal distribution between 0 and 1,
is a control parameter set as 0.5 based on the recommendations of [
24].
3.2.2. Exploitation Phase
The AOA uses the advantages of the subtraction and addition operators, since these produce small variations around the current solution
. The rule in this exploitation stage is defined by Equation (
21).
Evolution rules in Equation (
21) show that new individuals obtain their new values by adding or subtracting positions (it depends on the value of the random number
, which is assigned between 0 and 1 with normal distribution). These are considered to be soft variations around the current position, which means an exploitation of the solution space in heuristics.
It is worth highlighting that each new individual generated in the exploration and exploitation phases must be reviewed to ensure that each new position is between its maximum and minimum bounds (i.e., and ). In addition, the first positions in the new solution vector are rounded to near integer, since these correspond to the nodes where the PV sources will be installed, i.e., these must always be integer values.
3.2.3. Implementation of the AOA
The implementation of the AOA described in the previous subsection can be made via Algorithm 1.
| Algorithm 1: Classical AOA proposed in [24]. |
![Electronics 11 01680 i001]() |
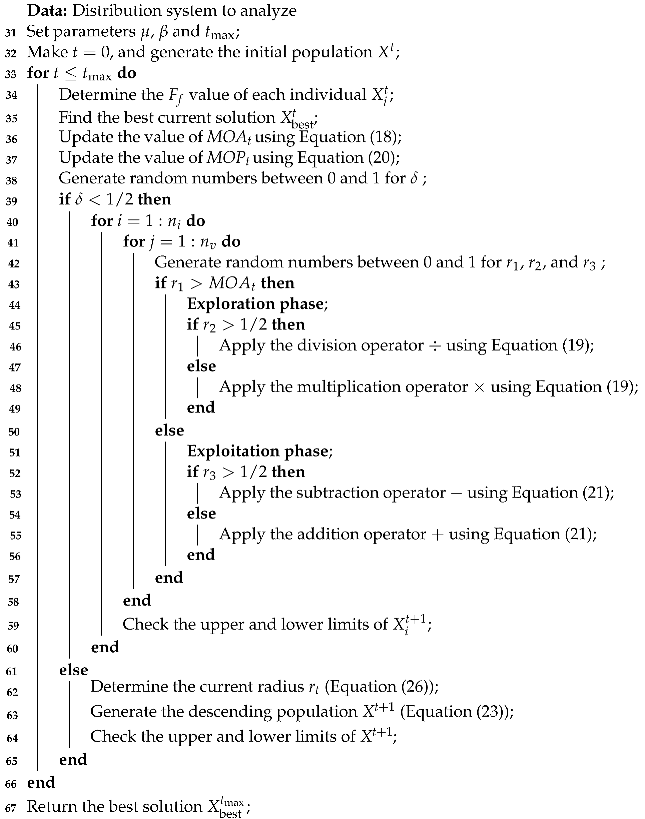
3.3. Improving the Exploration and Exploitation of the Solution Space
To improve the exploration and exploitation stages of the original AOA, we propose a modified version of this algorithm based on the evolution strategy used for the Vortex Search Algorithm [
32], which is based on non-concentric hyper-ellipses around the best current solution
. Let us define the center of the hyper-ellipse in the iteration
t as
, then, via a Gaussian distribution, it is possible to generate a set of solution candidates that are uniformly distributed across with the solution space. The candidate solutions are obtained by Equation (
23).
where:
If
has equal values in its diagonal (i.e., the same variance) and if the non-diagonal components are zero, then the Gaussian distribution will generate hyper-ellipses around the solution space. Considering these characteristics, it is possible to easily calculate
through Equation (
24).
where:
To calculate the initial standard deviation, Equation (
26) can be used:
where
is the maximum radius of the solution space (i.e.,
) [
32]. To take the advantage of the
factor in iteration
t, we define the decreasing radius of the hyper-ellipse as presented in Equation (
26).
which means that the radius of the hyper-ellipse is reduced at a linear rate.
Here, it is important to mention that the descending population
, generated with Equation (
23), must be reviewed to ensure that the upper and lower bounds of the decision variables are observed by each individual
. In addition, the first
positions are rounded to the near integer in order to ensure the discrete nature of the codification vector (Equation (
17)). Algorithm 2, summarizes the proposed optimization approach.
| Algorithm 2: Improved AOA based on hyper-ellipses with variable radius. |
![Electronics 11 01680 i002]() |
5. Numerical Validations
To demonstrate the efficiency of the MAOA, this research employed four comparative methods, three of them based on metaheuristics, namely the Chu and Beasley Genetic Algorithm (AGCB) [
16], the Newton–Metaheuristic Algorithm (NMA) [
17], the Arithmetic Optimization Algorithm (AOA) [
24], and the BONMIN solver in the GAMS software. The implementation of the metaheuristic optimizers was carried out in MATLAB using our own scripts. Regarding the software, the Matlab R2021b version was used in Microsoft Windows 10 64 bits version, hardware-wise we worked on an Intel(R) Core(TM) i7–7700HQ CPU 2.80 GHz computer with 24 GB of RAM.
To analyze the performance of the implemented metaheuristic optimization strategies, a population size of 10 individuals, 1000 iterations and 100 repetitions of each algorithm were used. The solutions reached by each optimization method are presented in
Table 3.
Table 3 reveal four important things: (i) the best solution for the IEEE 34-bus grid is reached by the MAOA, which reaches an objective function value of US
$/year 3,354,511.86, thus implying an improvement of US
$ 164.30 per year of operation in comparison with the solution of the NMA reported in [
17]; (ii) With respect to the benchmark case, the reduction reached by the MAOA is about 26.8896%, followed by the NMA with 26.8860%, while the worst approach corresponds to the BONMIN solver in GAMS, with a reduction of 26.8733% (these values confirm that all the compared methodologies can derive in improvements in the annual grid performance higher than 27.85% with respect to the benchmark case); (iii) when the AOA and the proposed modification are compared, it is observed that there is a difference of about US
$/year 523.59 in favor of the MAOA, which demonstrates that the exploration and exploitation improvements based on variable hyper-ellipses around the current solution
allow for a better numerical performance in the AOA; and (iv), regarding the nodes where the PV sources are located, the MAOA identified nodes 11, 23 and 27, a similar set of nodes of the CBGA, where node 25 replaces node 27. Furthermore, the solutions reported by the other methods are close to this set of nodes, which implies that the studied problem has multiple near-optimal solutions with small variations in the final objective function value. This situation clearly makes finding the global optimum difficult, and additional studies should be conducted in this research area.
To show that, after the 100 consecutive evaluations, the proposed MAOA has a b+etter numerical performance,
Figure 3 depicts the average reduction found by each one of the metaheuristic algorithms in all runs.
The reduction percentages in
Figure 3 clearly show that, on average, the MAOA is the best optimization algorithm to address this problem, given that each one of the 100 solutions implies a reduction between 26.8079 and 26.8896%, only followed by the CBGA until solution 99, with a range between 26.8091 and 26.8853%. Note that the NMA and the AOA are located in the third and fourth places, with ranges between 26.6671 and 26.8860% and 26.7627 and 26.8782%, respectively. To confirm these results,
Table 4 reports the minimum, mean, maximum, standard deviation, and processing times for each algorithm.
Table 4 reveals three important things regarding the proposed MAOA: (i) this is the only algorithm with a standard deviation lower than US
$ 700 per year of operation after 100 consecutive runs, which means that all the solutions obtained by this algorithm are contained in a small ball around the mean value; (ii) the proposed MAOA is the only metaheuristic method with mean and maximum values lower than US
$/year 3,600,000; and (iii), regarding the processing times, all the metaheuristics find the optimal solution with processing times of less than 30 s, with the CBGA being the fastest and the AOA the slowest. However, for planning, purposes all of the algorithms can be considered to be efficient in terms of computational effort.
6. Conclusions and Future Work
The optimal location and sizing of PV generation units in distribution networks was analyzed in this work with an improved version of the Arithmetic Optimization Algorithm called MAOA. This algorithm was enhanced with the inclusion of an exploration and exploitation stages based on hyper-ellipses with variable radius, which were uniformly distributed using a Gaussian distribution with respect to the current best solution if the value of the parameter was lower than 50%. The numerical results demonstrate that the MAOA finds the best optimal solution reported in the current literature for the IEEE 34-bus grid when compared to the BONMIN solver in GAMS and metaheuristic methods such as CBGA, NMA, and the original version of the AOA. The reduction percentage reached by the MAOA was 26.8896% with respect to the benchmark case, which was only followed by the NMA, with a value of 26.8860%. This implies that the MAOA found an additional reduction of US$ 164.30 per year of operation in comparison with the NMA.
The statistical analysis confirmed the excellent numerical performance of the proposed MAOA, given that it had a standard deviation lower than US$/year 700, with average and maximum values lower than 3.6 million dollars per year of operation, which makes it the only algorithm among metaheuristics that yields these values.
Finally, the following future works are identified: (i) apply MAOA to the problem regarding optimal reactive power compensation in distribution grids using fixed-step capacitors and distribution static compensators; (ii) reformulating the studied MI-SOCP model into a mixed-integer conic model that can guarantee that the global optimum is found via interior-point and branch and bound methods; and (iii) to include in the proposed MINLP model the effect of different days along the year for countries where seasons have important effects on the solar PV energy production.


