1. Introduction
The world is currently in the midst of a climate crisis, with global powers working toward mitigating climate change by limiting the average temperature increase by 1.5 °C by 2030 [
1,
2]. With the signing of the Paris Accord in 2015, many countries have committed to this pledge. In particular, the UK government published the “Ten Point Plan”, a pathway toward a green industrial revolution, in 2020 [
3]. Point 4, “accelerating the shift to zero-emission vehicles”, details the ban on the sale of new petrol and diesel cars and vans by 2030. Electric vehicles (EVs) are currently the most popular zero-emission vehicle [
4] propulsion type, due to their low carbon emissions when powered by renewable sources and their potential for vehicle-to-grid (V2G) applications [
5]. However, there are several foreseeable challenges that need to be addressed as EV uptake rises [
6,
7,
8], one being their refueling or charging [
9] and preventing overloading of the grid [
10]. With a current vehicle stock of 31,695,988 [
11] vehicles in the UK, a number that is set to increase yearly, once it becomes predominately EV, there is a concern with how the grid will cope with the additional demand [
12] placed upon it, both for at-home fast charging and charging station usage. It is expected that between 6 GW to 18 GW [
13] of additional power is going to be needed to power the vehicles, and so the UK must be mindful of increasing the production capacity but also developing charging stations that are optimized for grid independence. There are currently 8380 forecourts in the UK, and their eventual conversion to electric forecourts forecasts a substantial load on the grid, so proper management and mitigation of their impact is vital [
14]. Improving their grid independence makes them self-sufficient and present a minimized impact upon the grid, reducing the risk that millions of additional EVs are going to have upon it. One such method to improve the grid independence is the integration of solar [
15,
16] and storage [
17] in the EV charging station (EVCS), creating a photovoltaic-powered electric vehicle charging station (PVEVCS). Solar photovoltaic (PV) systems are used to supply and offset the demand of the EVCS. The storage then improves the forecourt’s energy utilization by storing excess electricity during periods of low demand and then discharging it when the grid is experiencing a high level of demand. These methods, when employed together, reduce the amount of energy imported during critical periods and, as such, the EVCS’s impact on the grid.
Forecasting charging load demands and developing charging profiles for EVCS are vital steps in their development process [
18]. Regarding PVEVCS, Minh et al. conducted technical economic analysis on a theoretical station in Vietnam. They found that when the cost of energy (COE) was larger than the feed-in tariff (FIT), further capital needed to be mobilized to have a sustainable system [
19]. A feasibility study on a PVEVCS was conducted in Shenzhen City, China [
20], which found that the net present cost of an EVCS with a demand of 4500 kWh was USD 3,579,236, whereas the COE of the PVEVCS was USD 0.098/kWh, making it economically feasible. The station also had pollutant reduction potentials of 99.7% and above for CO
2, SO
2, and NO. Other work by Ul-Haq et al. modeled a PVEVCS with V2G using SIMULINK and found that a PV-powered charging station is a promising method for managing the substantial load EVs will present in the future [
21]. A PV array on a university campus in Dhaka, Bangladesh was used as a power source for charging two electric buses [
22]. Chowdhury et al. found that only 21% of the production was needed, and the rest could be exported, making it feasible. It was also noted that an energy storage system would maximize the power flow from PV to EV. They also found that it reduced CO
2 emissions by 52,944 kg/year, as their energy mix was predominately thermal, being fueled by coal and natural gas. Another PVEVCS was designed and simulated in Romania using hybrid optimization by genetic algorithms to optimize the PV system’s configuration in [
23]. Savio et al. also developed a PVEVCS as a microgrid in India and modeled 11 energy management strategies using MATLAB and Simulink [
10]. Following the integration of a battery energy storage system (BESS), Nishimwe et al. proposed an optimization framework to maximize the profit from a PVEVCS with a BESS [
24]. The simulation found that when the EVCS load was similar to the PV output, the BESS was not needed, thus providing useful information to factor into real-world PVEVCS design decisions. Robinson et al. continued with these developing business models for PVEVCS to simplify investment for large entities in the US [
25], while Liu et al. evaluated the effectiveness of a commercialized PVEVCS [
26]. Using actual statistical data, the paper evaluated a theoretical PVEVCS in China. It was found that PVEVCSs have the potential to produce satisfactory environmental and economic benefits while reducing the impact and dependence on the grid. Since more PVEVCSs with storage have been developed worldwide, Liu et al. proposed a portfolio optimization model with a sustainability perspective and then verified this using a case study of 10 feasible projects in South China [
27]. The existing literature indicates that PVEVCSs are a commercially feasible and effective measure to both manage EV load and reduce CO
2 emissions.
Research has also been conducted in modeling and developing the EV load profiles of EVCSs. Schuabe et al. used empirical data of three EV fleets in southwest Germany to simulate EV load profiles to develop a simulation model for allowing realistic representations of EV demand [
28]. Shepero et al. completed a review in 2018 on PV EV charging, finding that more variation was needed in modeling to include EV’s various modes of charging, like at-home and destination charging [
29]. However, by considering the entire city of San Francisco, USA, Ko et al. revealed associations between population density, vehicle travel, and on-site PV potential for reducing greenhouse gas emissions. Moving on, Godde et al. used a Gaussian mixture to model the charging probability of EVs, and Bae et al. used a spatial and temporal model to characterize the demand [
30,
31]. A stochastic model was also used to simulate the EV load profiles by Soares et al., due to the inherent uncertainties [
32]. Similarly, Farkas et al. stochastically modeled EV charging at charging stations and traffic queue theory, finding that the station parameters did not seriously affect the system parameters, but the charging time did [
33]. Further work has been completed on simulating EV fast-charging station usage and the power requirements by Bryden et al. This work differs, as they used a petrol vehicle’s driving data from the northwest United States and considered at-home and destination charging to develop a daily profile of the frequency of fast charges [
34]. Brady et al. also used GPS data but from EVs collected in Waterloo, Canada [
35]. The authors again used a stochastic simulation methodology to simulate daily driving schedules and, as such, their charging profiles. Dixon et al. used a Monte Carlo-based method to simulate the likely demand of EVCSs in the UK [
36]. The paper found similar results, as did all of them, in the daily EV load profile patterns.
Typically, the focus of the literature is on the power management method, optimizing the PV system configuration, the economic feasibility of a PVEVCS, or simulating the EVCS’s demand. This paper uniquely provides focused insight into how solar PV and storage integration reduces the grid dependence of an EVCS, building upon the existing literature and providing new information and insight. The analysis is compounded by using four different charging scenarios from the UK, America, and Canada with a variety of methodologies, either via simulation or from real-life datasets. This paper also proposes further methods to improve the grid independence of the EVCS based on the results of the simulation, whereas other work only provides the results of the simulation.
This paper consists of four sections.
Section 2 details the design of the PVEVCS and its components. It also details the four charging profiles that have been used in the simulations and the novel metrics used to analyze the EVCS variations.
Section 3 contains the results and discussion of the simulation results and meaningful conclusions of the analysis, together with proposed methods to further reduce grid dependence, before closing with the conclusion in
Section 4.
2. Materials and Methods
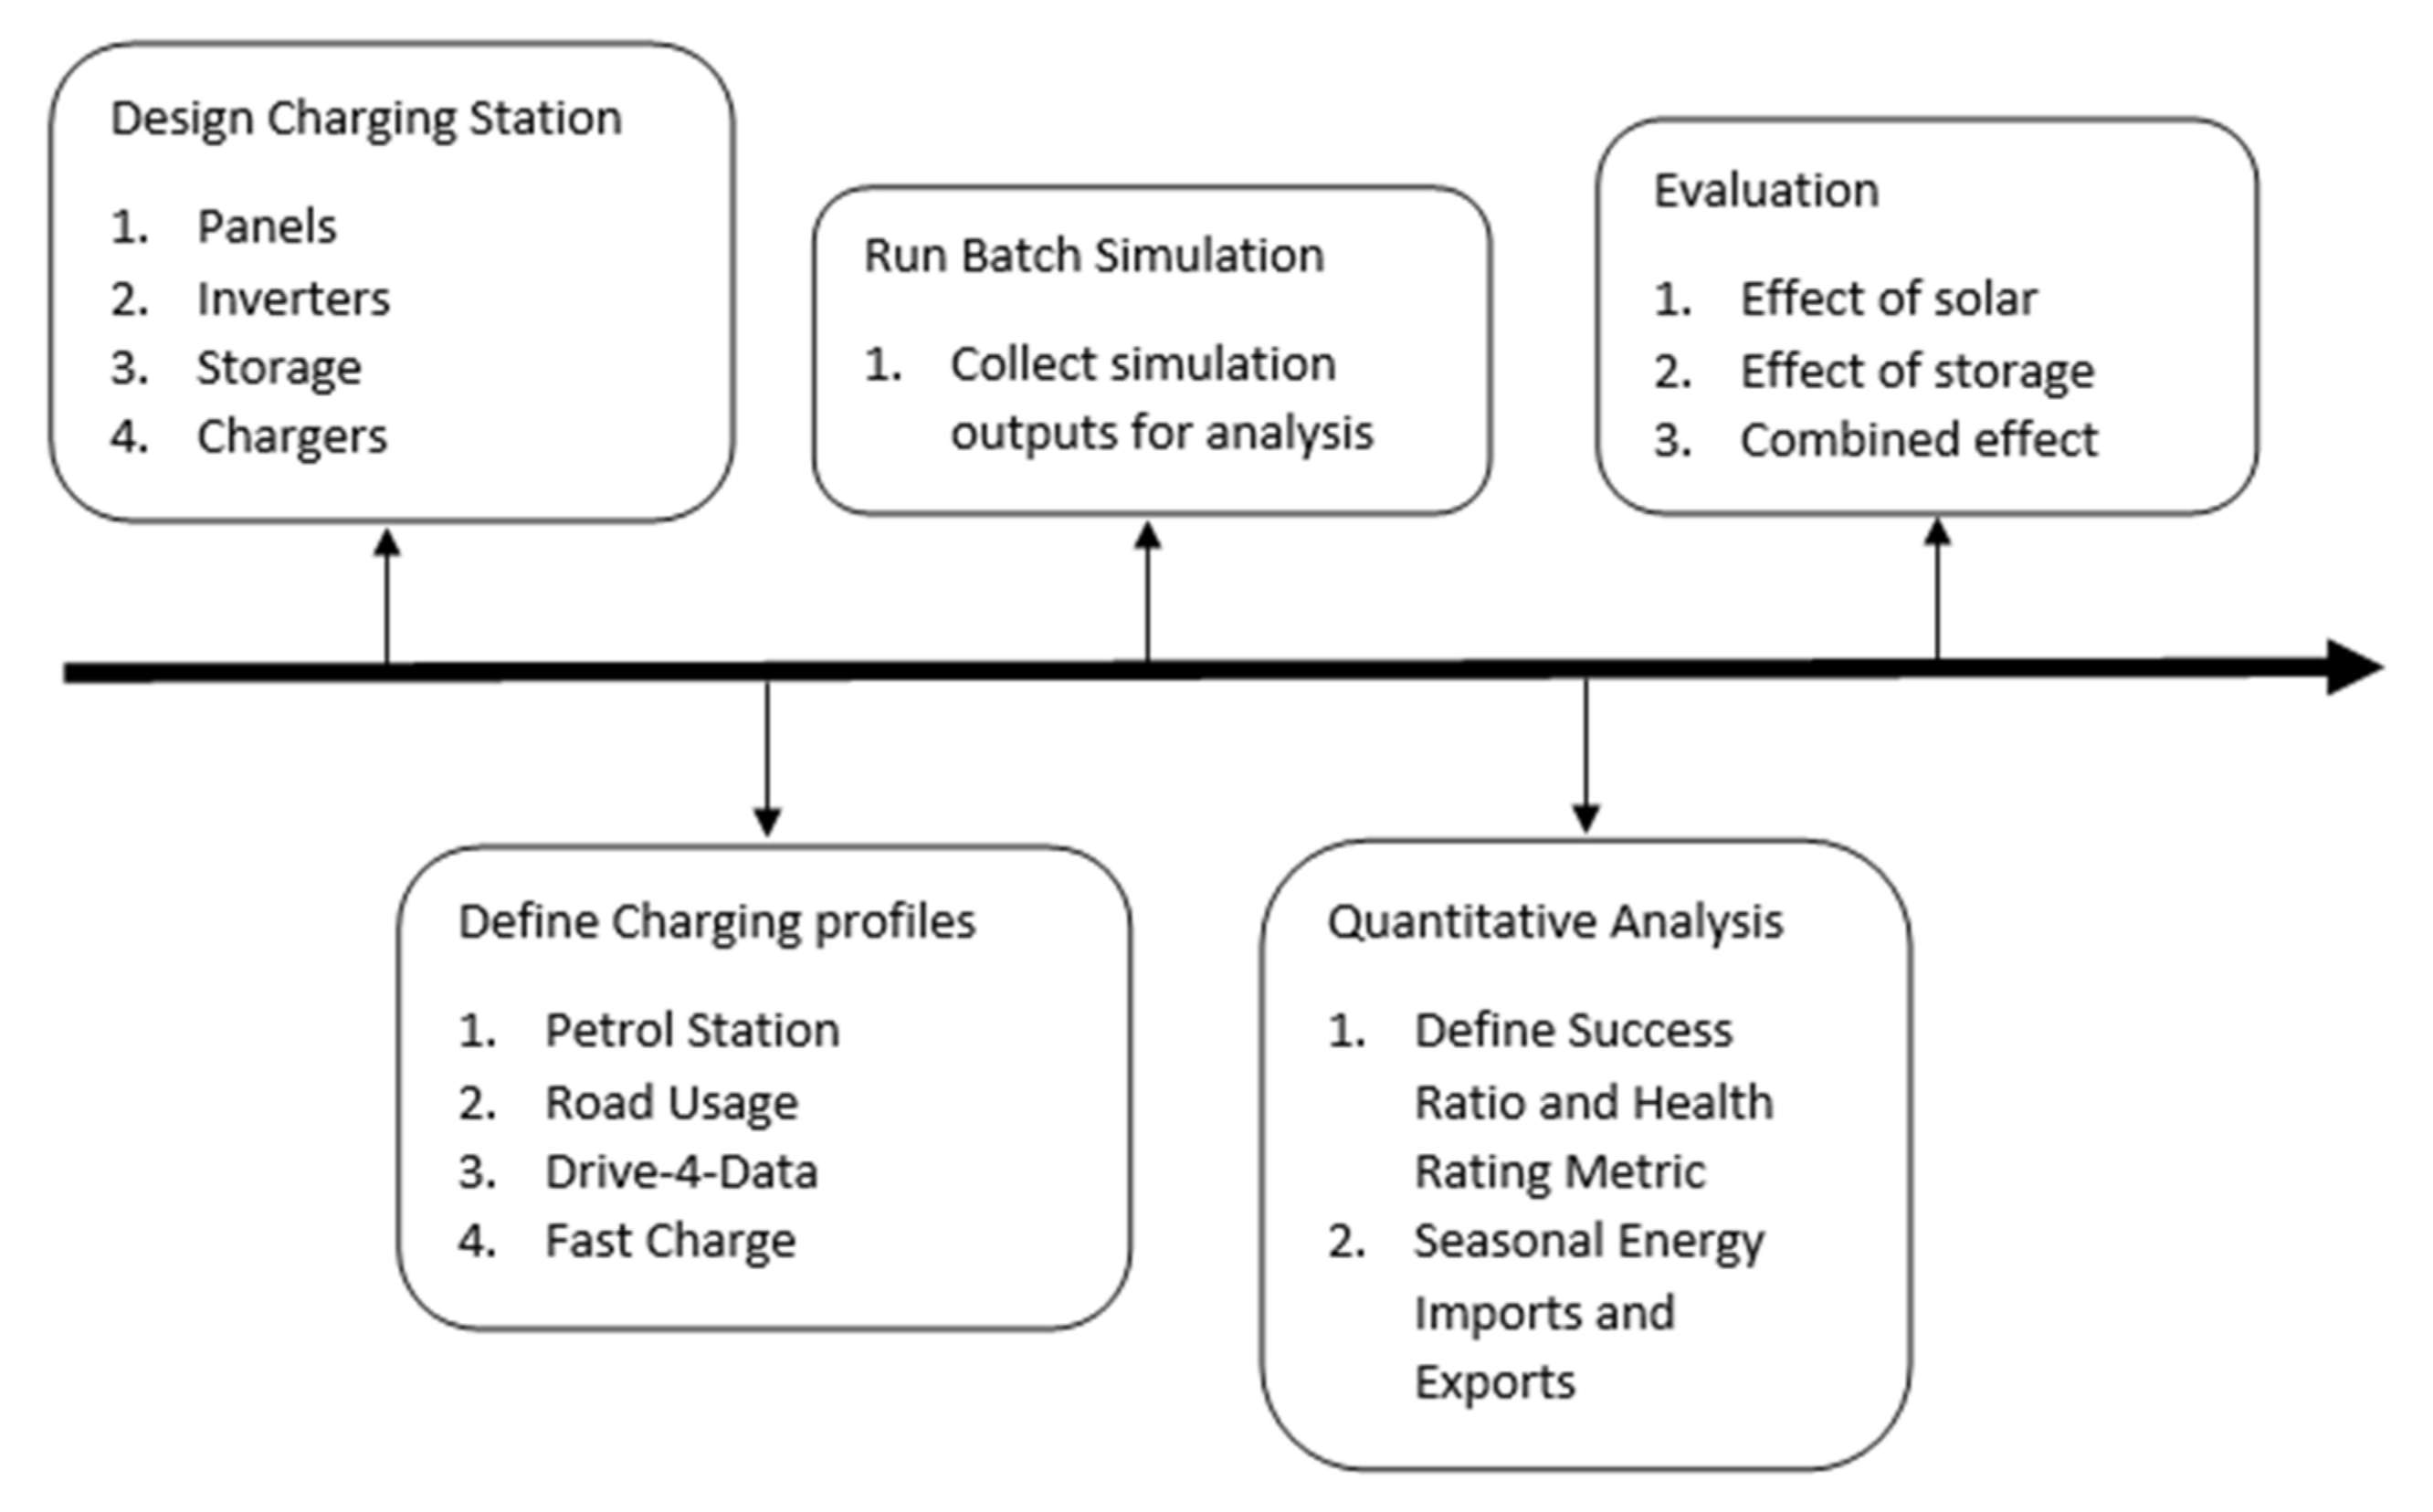
To investigate how solar and storage affect a charging station’s grid independence, first, a PV array was developed using MATLAB software. Then, using publicly available data and scholarly articles, four charging profiles were developed that characterized the demand placed upon the charging stations in four different scenarios. Using MATLAB, the different PVEVCS configurations were assessed against each of the charging profiles as a batch simulation, whose results were then evaluated using MATLAB. This allowed for analysis of the effect that the integration of solar and storage had on an EVCS’s grid independence in a variety of different charging scenarios.
Figure 1 shows the main phases: design the charging station, define the charging profiles, batch simulation, and analysis methods, which are explained below.
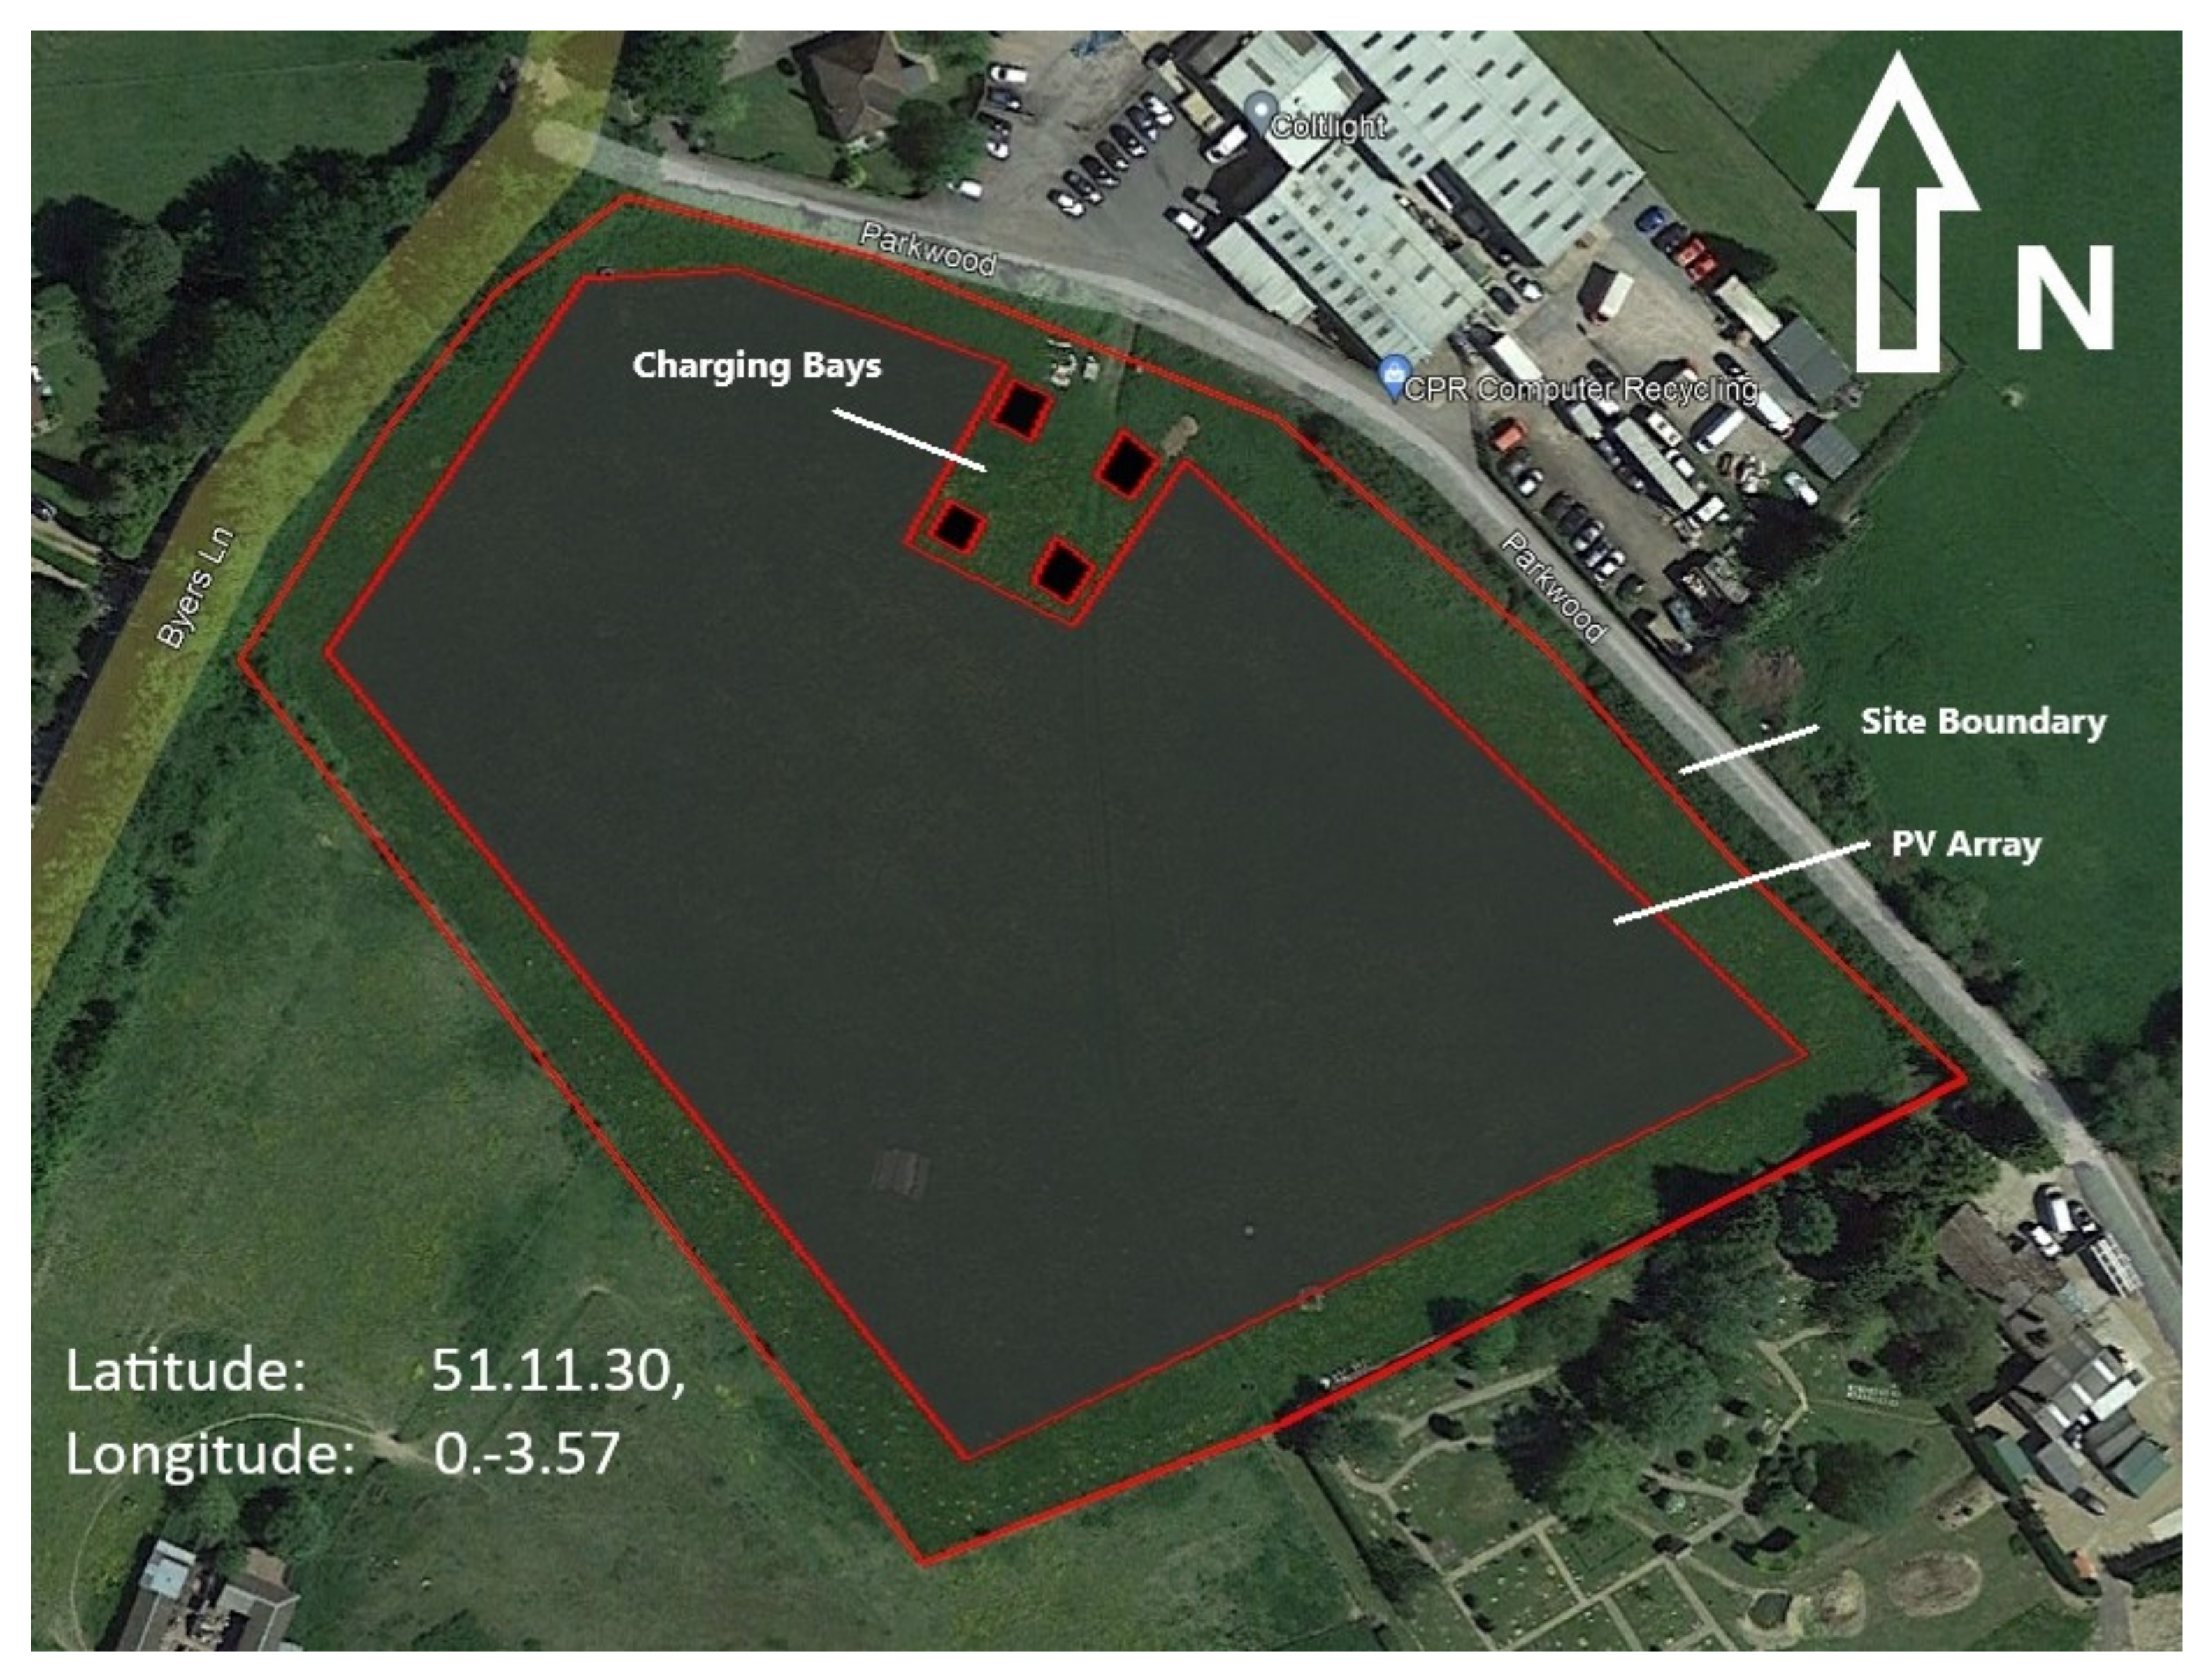
Table 1 details the important information relative to the site. There was negligible horizon shading minimizing the losses, making it an ideal location for a solar farm. It also had immediate road access, as can be seen in
Figure 2, making it suitable for a charging station and allowing access for construction and maintenance.
A multi-criteria decision-making methodology was used to select all components [
37]. They all had to meet the following criteria: being produced within the last 5 years and by a reputable manufacturer. Due to the constraints on this project, these criteria ensured that the components selected were high-quality and reliable, since conducting a manufacturing site inspection was not possible. The NeoSun NS-410M-144 panels with 23.2% efficiency were selected [
38]. They were set at a tilt angle of 38° to optimize yield and an azimuth of 0° [
39]. The Huawei SUN2000-105KTL-H1 string inverter was selected [
40]. The solar array used 22 inverters in the string in total, with a P
nom of 1.24, minimizing clipping while optimizing for performance all year round [
41]. Lithium-ion batteries were chosen, as they are used in EVs and are widely employed [
42]. The LG Chem rack JH4 SR19 4P 296Ah was selected, as it provided a continuous high-power supply over periods longer than 3 h. The batteries were connected in series to increase the capacity [
43]. LG Chem was selected as they are prominent within the industry, investing in the R&D of Li-ion and have experience with many utility-scale storage projects across the globe.
The use of 22-kW chargers, however, was omitted due to size constraints at the site, and as it was assumed all EVs arriving were fast charging, slow chargers were not needed. Therefore, one Tesla supercharger (350 kW) and three additional fast chargers (250 kW) were selected for the charging station. This provided a total output of 1100 kW for charging at any one time or an average of 275 kW. The weighted average of EV energy efficiency of the most popular EVs in 2021 was 4.15 miles/kWh, meaning a charger on average provided 1141 miles of charge per hour. Furthermore, all four chargers provided 4566 miles of charge an hour, or 109,599 miles a day, at max capacity.
Table 2 and
Table 3 include all the relevant important information concerning the PVEVCS, such as the results and components of the system.
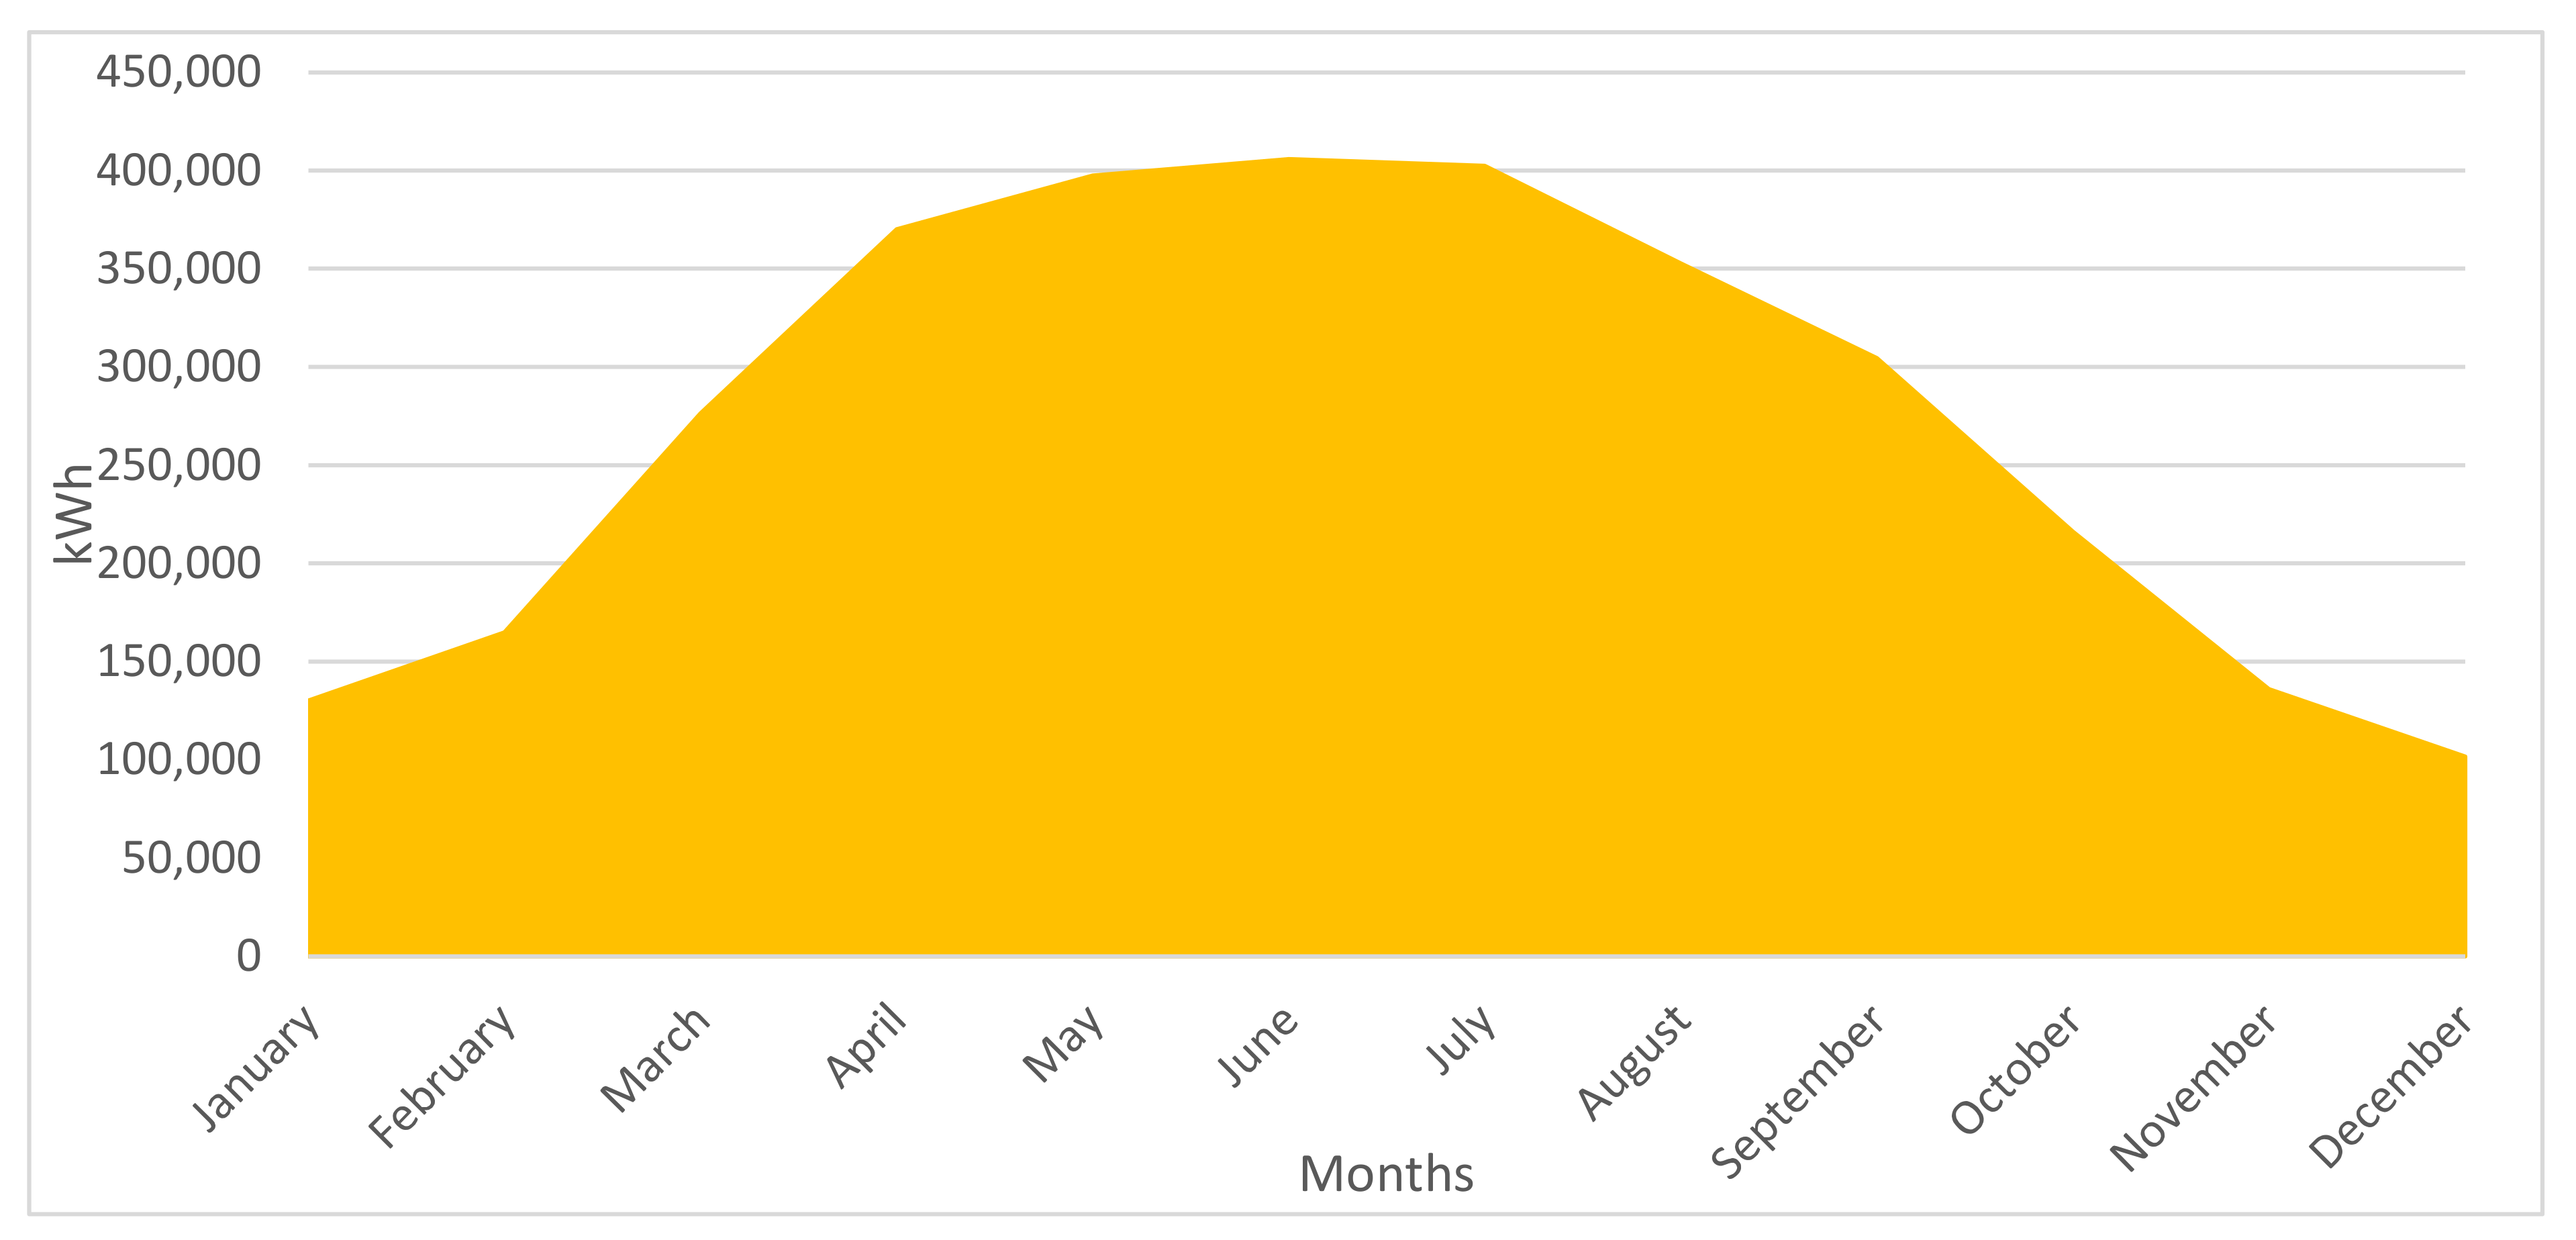
Figure 3 shows the annual PV production, which was typical for an array in the southeast part of the UK, with peak production during July and the least production in December.
2.1. Charging Profile Selection and Development
This article utilized four charging profiles for the simulation that were either selected from well-established scholarly articles or derived from real-time datasets. They were the petrol station charging profile, road usage charging profile, Drive-4-Data charging profile, and the fast-charge charging profile.
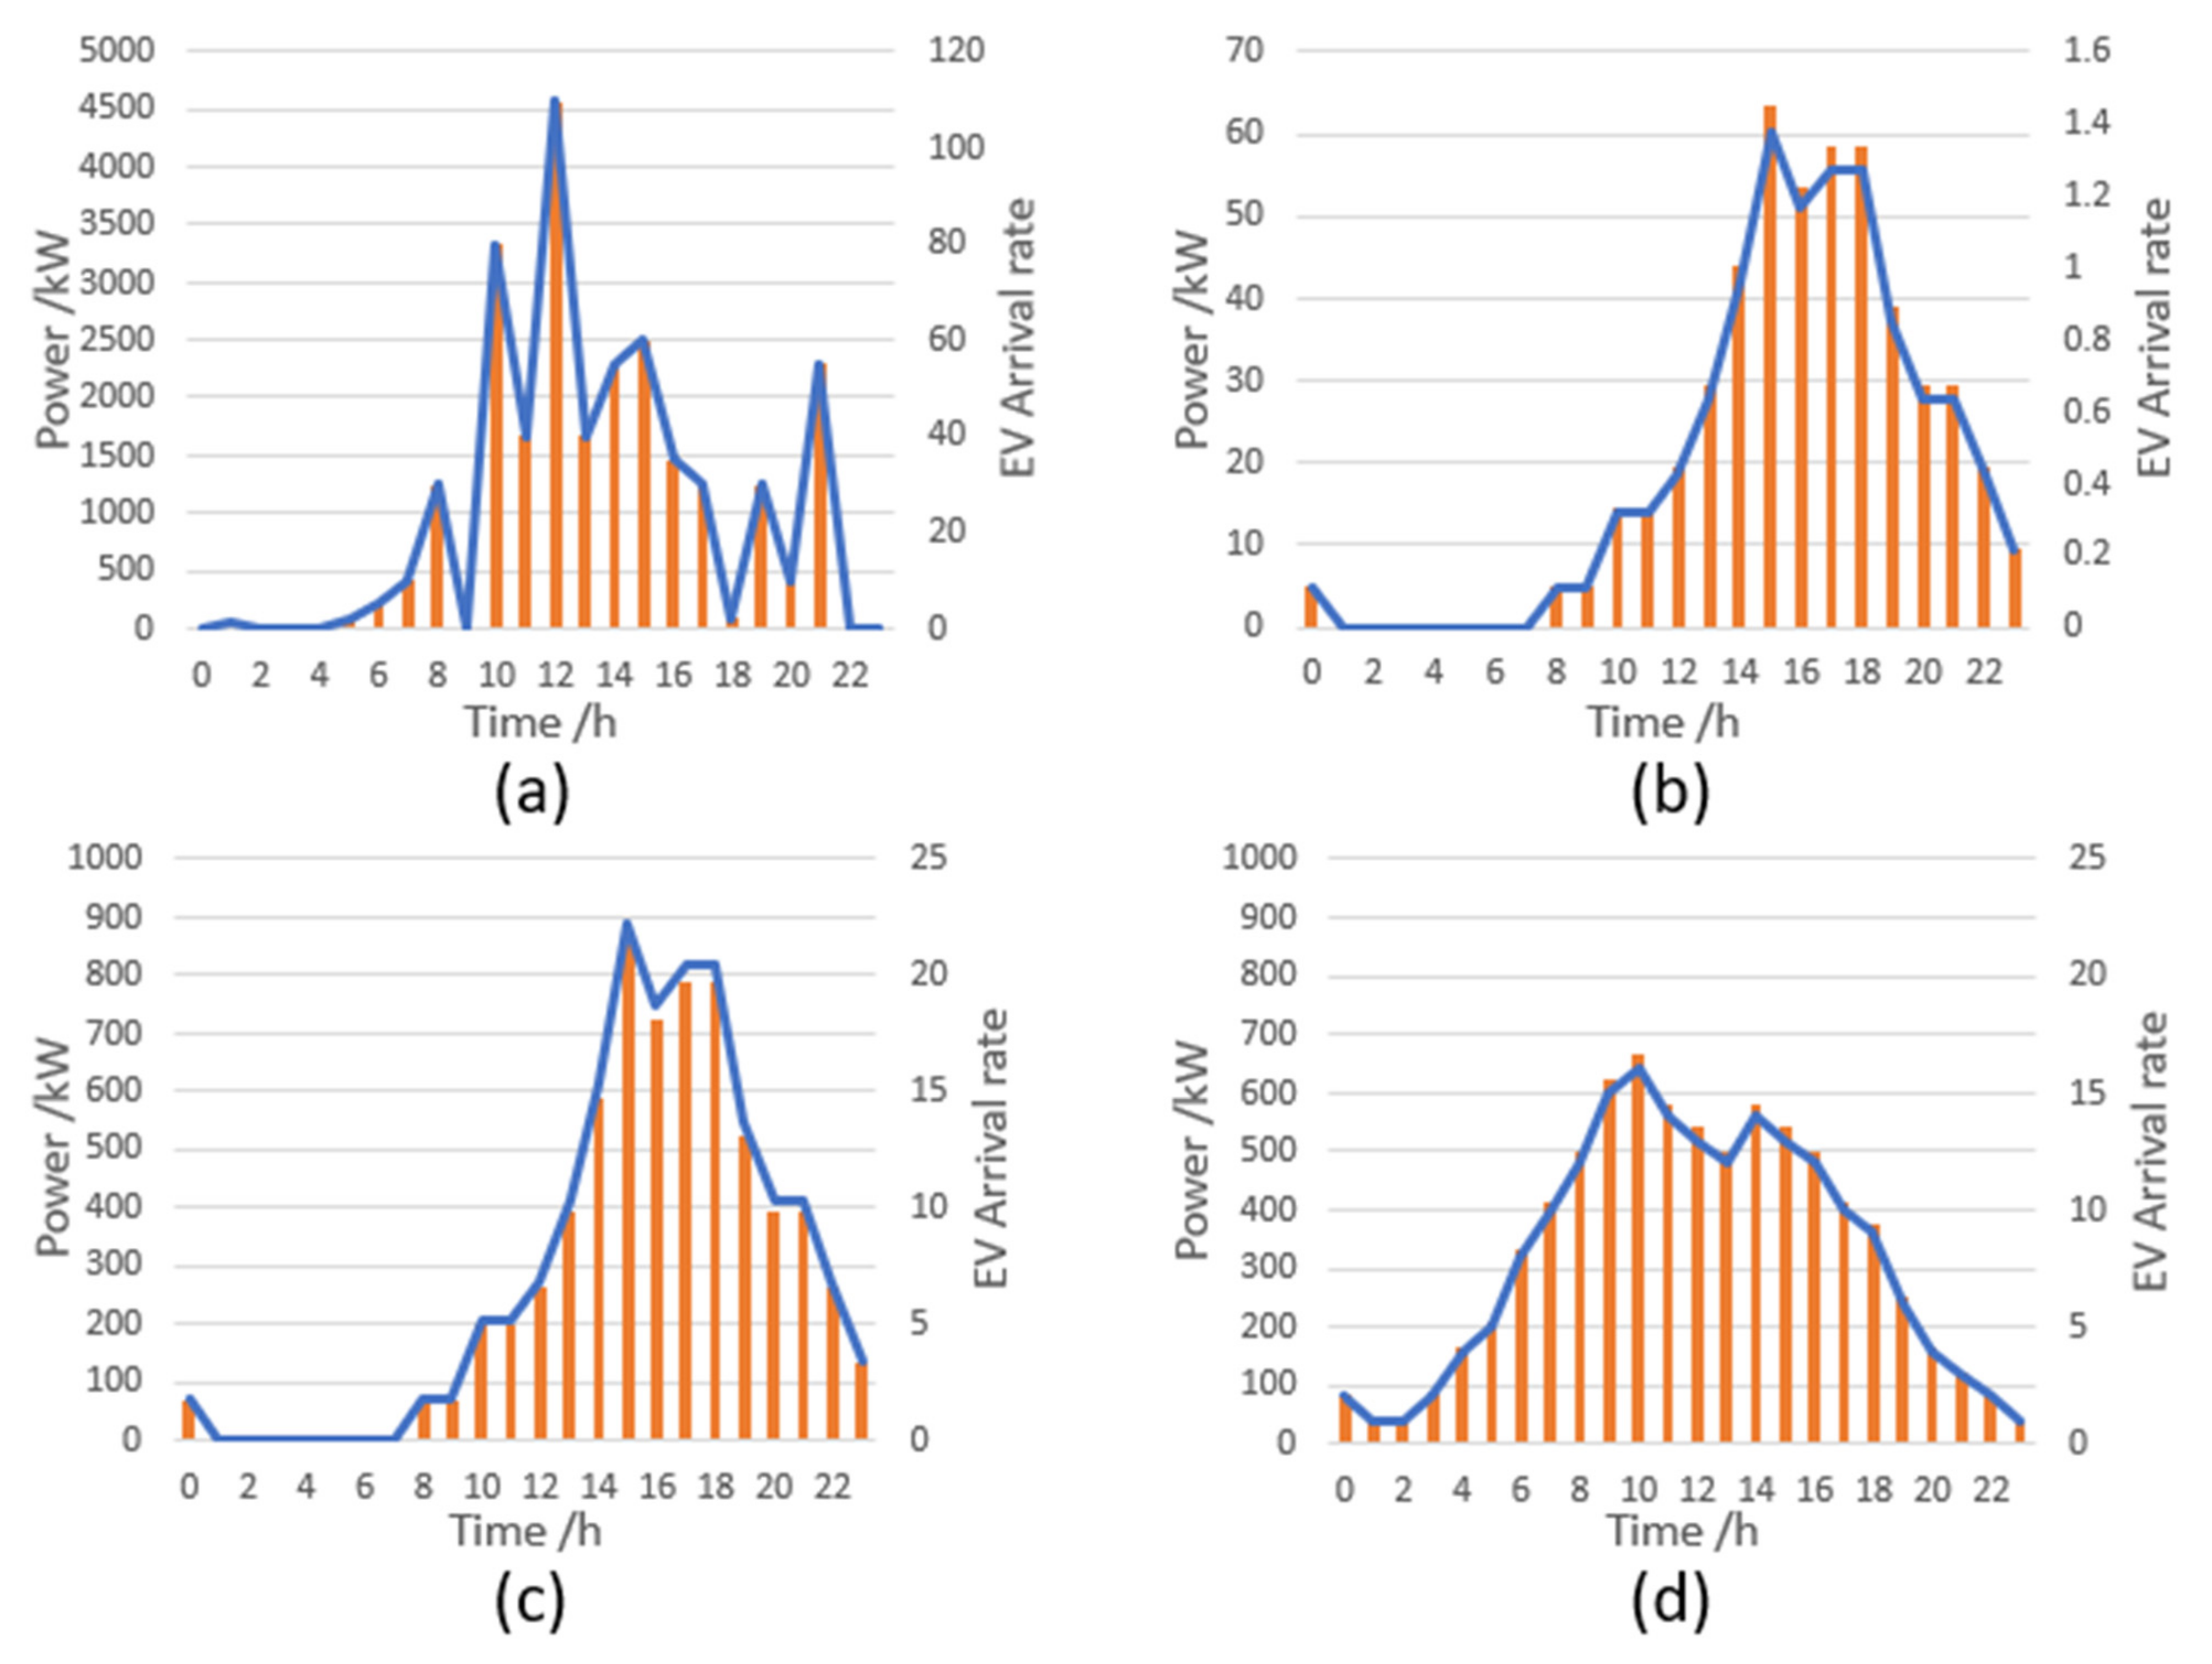
Figure 4 displays all four charging profiles, while
Table 4 lists all the essential details. The petrol station charging profile provided an understanding of how a charging station survived when it experienced the same level of demand as a petrol station. This illuminates what would happen if the petrol stations were replaced by EVCSs at a one-to-one ratio. The road usage charging profile was developed using the site’s local road’s trip counts. The results of this analysis provide insight into whether the PVEVCS is sufficient to satisfy local demand. The Drive-4-Data charging profile was from Waterloo, Canada and was developed using GPS data of actual EVs and their driving behaviors. Using actual EV driving behaviors improved the accuracy of the simulation results, as it factored in current EV driving behaviors like range anxiety. Finally, the fast-charge charging profile was from the US and was the only dataset that factored in at-home and at-work charging. It also factored in long journey times, which are crucial aspects of the usability of EVs, therefore making it a strong dataset to apply in the simulation. All charging profiles were selected due to their variety of methodologies and locations.
Petrol station data was used from [
36], who used the Google Maps “Popular Times” feature that collected positional data from smartphone users to estimate the average popularity of a petrol station in Edinburgh, UK on a Saturday. The data underwent a state sampling simulation deriving the arrival rate and a time-sequential simulation to characterize the demand on a forecourt.
The fast-charge charging profile data were from [
34], who employed GPS data that recorded long journeys of ICE vehicles. This paper assumed long journeys were split into two segments, where the driver fast-charged their EV and rested in between. It was assumed that for extended stops (>5 h), the car was at-home or destination charging. By this method, the number of fast charges as a function of the driving ranges could be estimated. By the same method as the road usage charging profile, it was possible to estimate the total number of EVs in the southeast. It was possible to use the average number of vehicles per household (1.41) [
44] and the total number of households in the southeast (3,801,000) [
45] and multiply them together to offer the total number of vehicles in the southeast. By converting the fast charges per million vehicles to the fast charges per vehicle and then multiplying it by the total number of EVs, this would offer an estimated EV arrival rate per hour in the southeast.
The road usage charging profile dataset was derived from the road usage statistics of the main roads within a 10-mile radius of the charging station as an estimate for the local demand for EV charging. The roads were the M25, M23, A22, and A264. The data are publicly available from the Department for Transport Road Traffic Statistics website [
46]. This data only shows the number of vehicles by class and not by propulsion type. Therefore, a method to determine the number of EVs was derived. First, there were 193,992 EVs out of the 31,695,988 licensed vehicles in the UK, meaning EVs represented 0.61% of the total vehicle stock in the UK [
11]. This number was then assumed to be the national EV penetration rate which, when multiplied by the number of vehicles counted, estimated the number of EVs traveling on the local roads. After finding the daily total number of EVs, it was multiplied by the fast charge per million EVs daily variation (which was divided by 1 million to convert it to per EV) from Bryden et al. to define the daily variation in demand [
34].
The Drive-4-Data charging profile used data from an article from the Department of Electrical and Computer Engineering at the University of Waterloo in Canada [
47]. Hefez et al. investigated the optimal design of an electric vehicle charging station considering various energy resources. The load experienced by the charging station was obtained from Drive-4-Data, a publicly available real-world dataset of EVs maintained in Waterloo, Canada. The NHTS 2009 data for light-duty vehicles were used to further distribute the PEV charging demand over the day by assuming the EVs had the same pattern for arrival as petrol stations.
Once the system and charging profiles were defined, multiple simulations were conducted for each variation of the system, assessing their performance against each of the charging profiles. For each iteration, the energy supplied to the user (Euser), energy generated by the array (Eavail), energy imported from the grid (Eimp), and energy exported to the grid (Eexp) were collected, where applicable, in CSV format to allow for further analysis using Excel. For the non-grid connected system’s simulation, there were no values for Eimp and Eexp, and so only Euser and Eavail were recorded.
2.2. Novel Metrics Method
To analyze the performance of the systems, multiple novel metrics were defined. These were the success ratio, health rating for the grid-connected systems (GSCs), and the energy difference and success rate for the non-grid-connected systems. The novel metrics were defined as within the context of this project, they provided a clear perspective on the system’s grid independence. Similar methods were used by Brenna et al. [
48] to analyze the performance of proposed systems.
The success ratio for the non-grid-connected system was calculated with Equation (1):
where
Eavail is the total energy available from the sun and
Euser is the total energy supplied to the PVEVCS. A value close to 1 meant that the system generated sufficient energy to power the charging station. A value of 0 indicated that the system needed to import the majority of its energy to satisfy the load from the charging station. The success rate for the non-grid-connected system was calculated with Equation (2):
A value closer to 100% indicates the system can satisfy demand as experienced by the charging station and vice versa when closer to 0%. Therefore, the larger the success rate, the more effective the system is.
The success ratio for the GCS was calculated with Equation (3):
where
Eimp is the energy imported from the grid. This follows the same logic as the non-grid-connected system success ratio. The heath rating was calculated with Equation (4):
where
Eexp is the energy exported to the grid. If the heath rating is negative, this indicates an overall energy deficit generated by the PVEVCS and vice versa should it be positive. The magnitude demonstrates the scale of the effect.
3. Results
The results of the simulation are displayed, analyzed, and discussed here. A non-grid-connected system and three grid-connected systems with 0 MWh, 0.5 MWh, and 1 MWh of storage were analyzed. This provided insight into grid connection and how adding capacity affected the station using each charging profile.
3.1. Non-Grid-Connected System
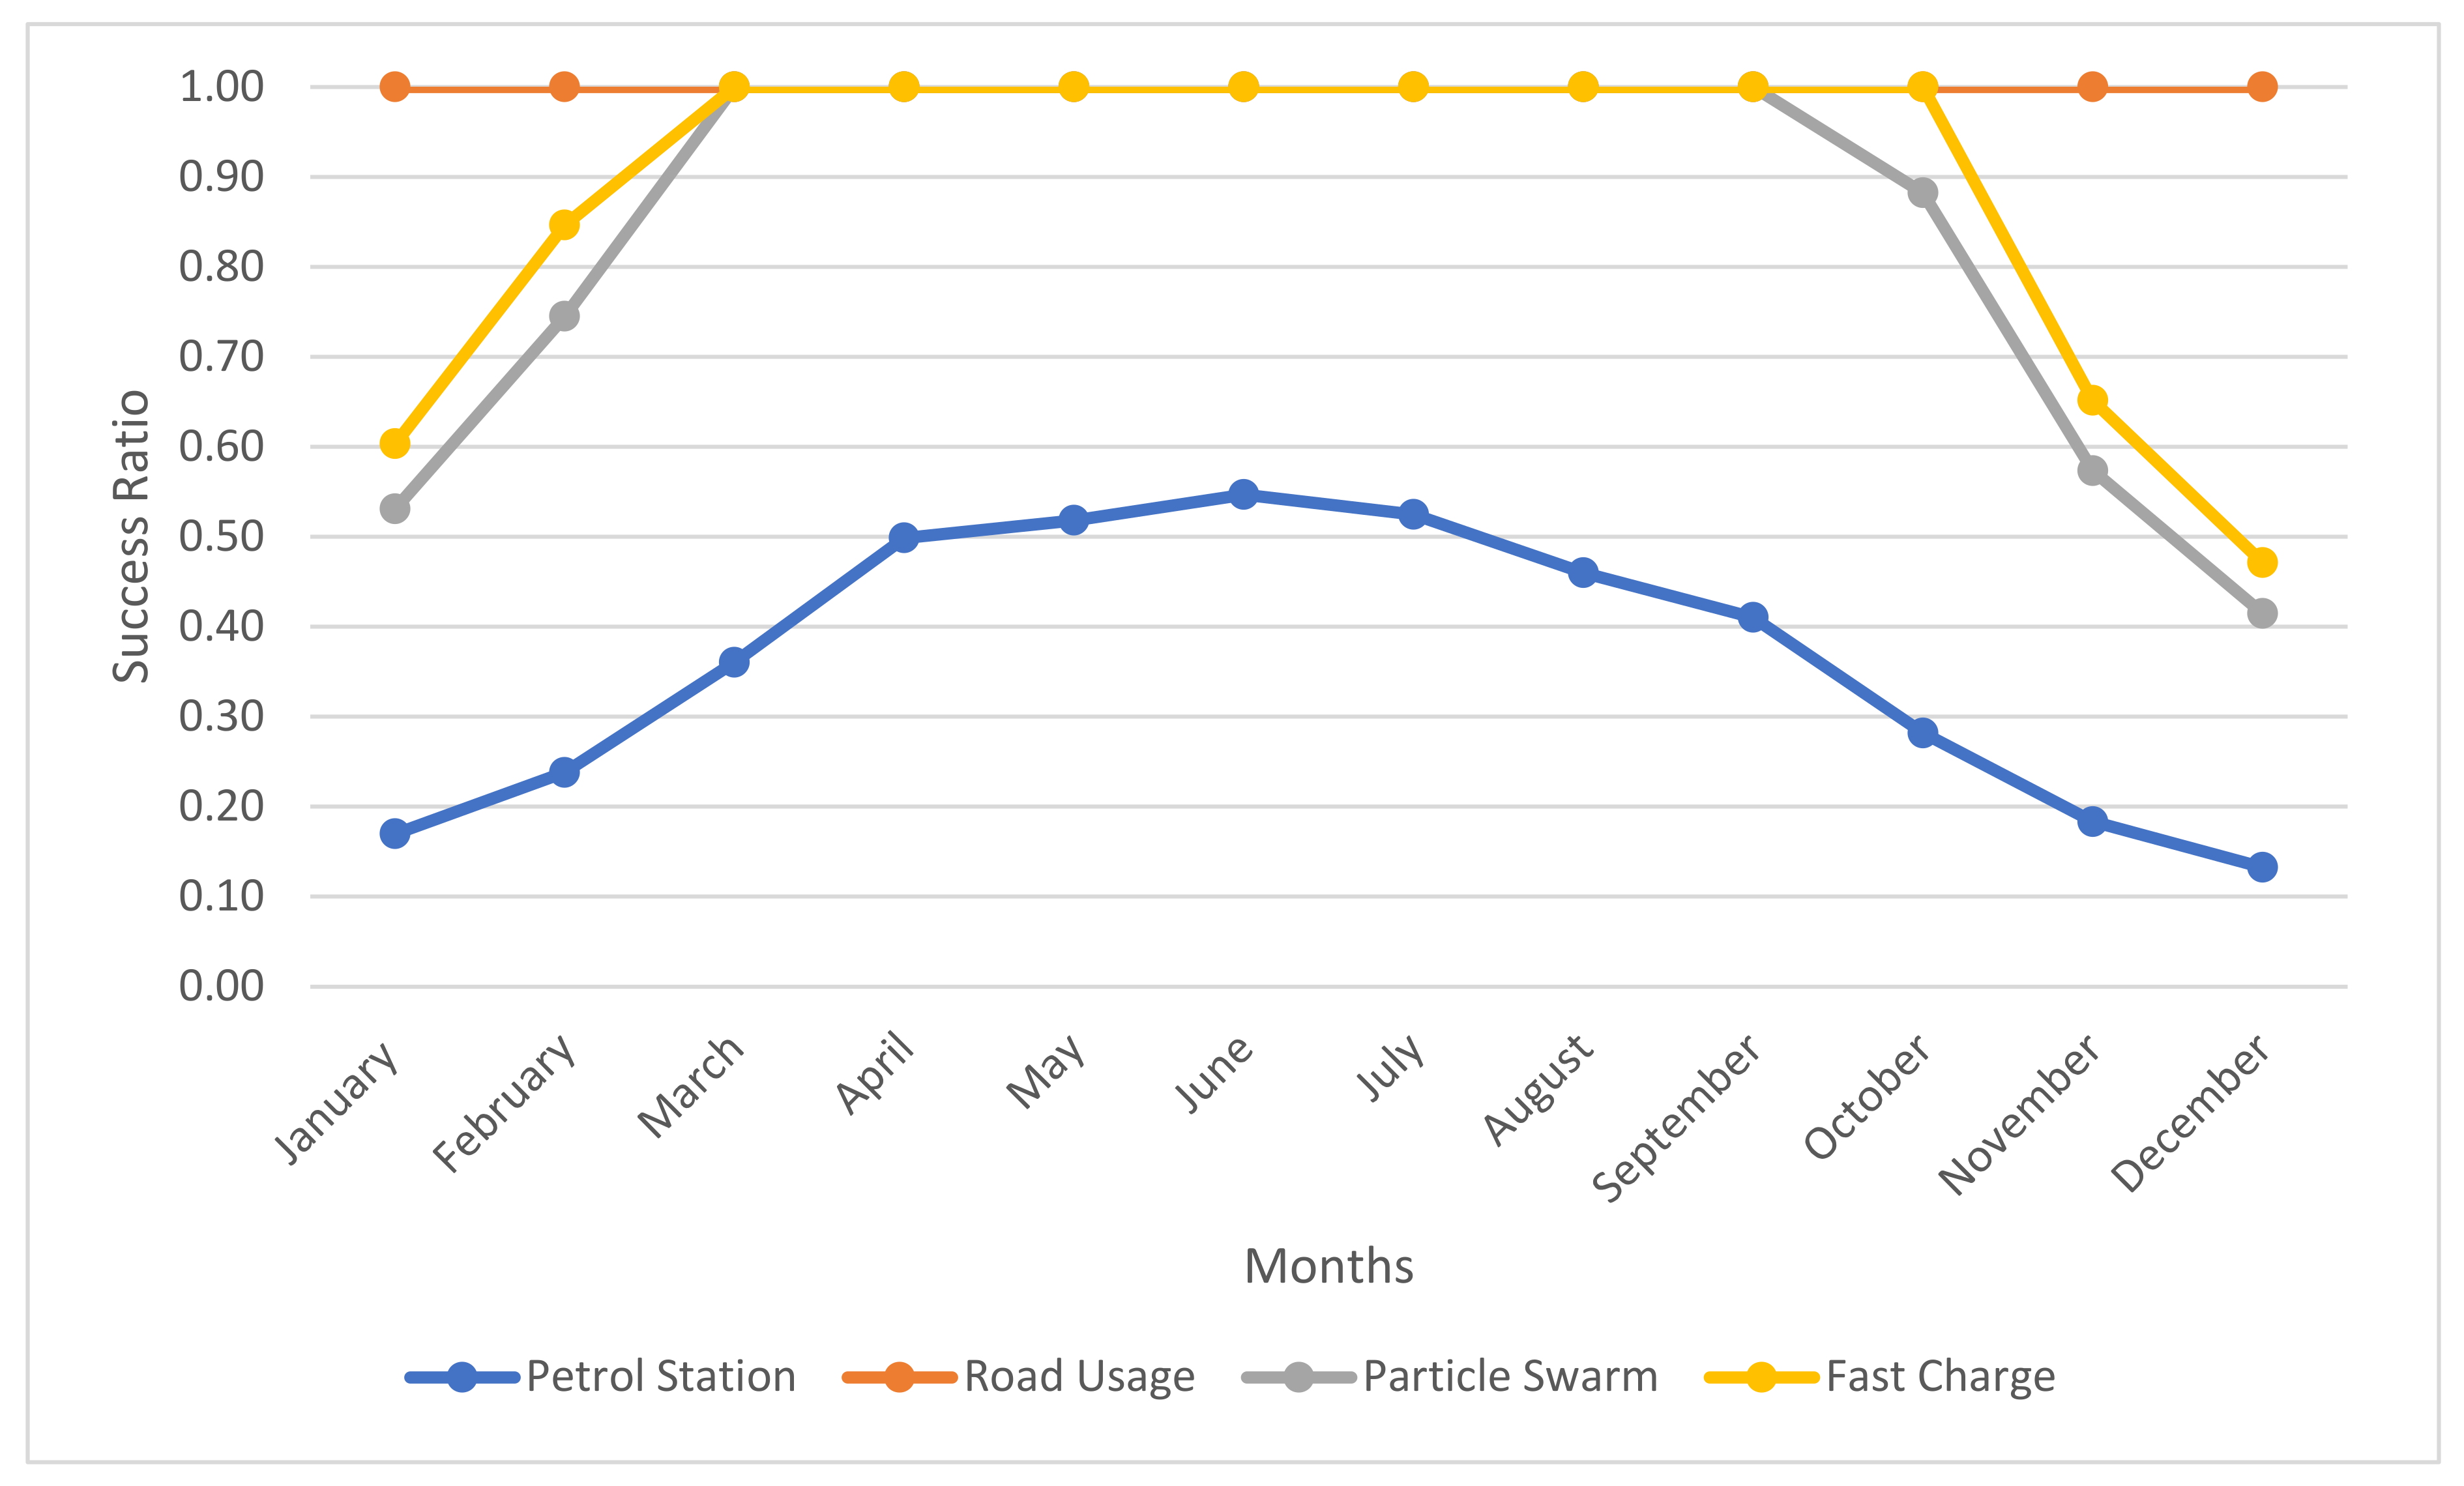
Figure 5 displays the success ratio of the non-grid-connected system, which had a direct connection with the PV array. The graph indicates that from March to October, for three out of four charging profiles, the system produced enough energy to offset the demand. Outside of these months, however, all of them except the road usage charging profile did not generate enough energy, resulting in the station shutting down due to a lack of supply. For the petrol station charging profile, in January, the system was unable to produce enough energy to satisfy the demand, as shown by its 0.17 rating. In order for the PVEVCS to satisfy demand all year round, including in January, the nominal power of the array would need to increase by 588%, meaning a PV plant with a nominal power of approximately 17 MW would always generate enough power to satisfy demand.
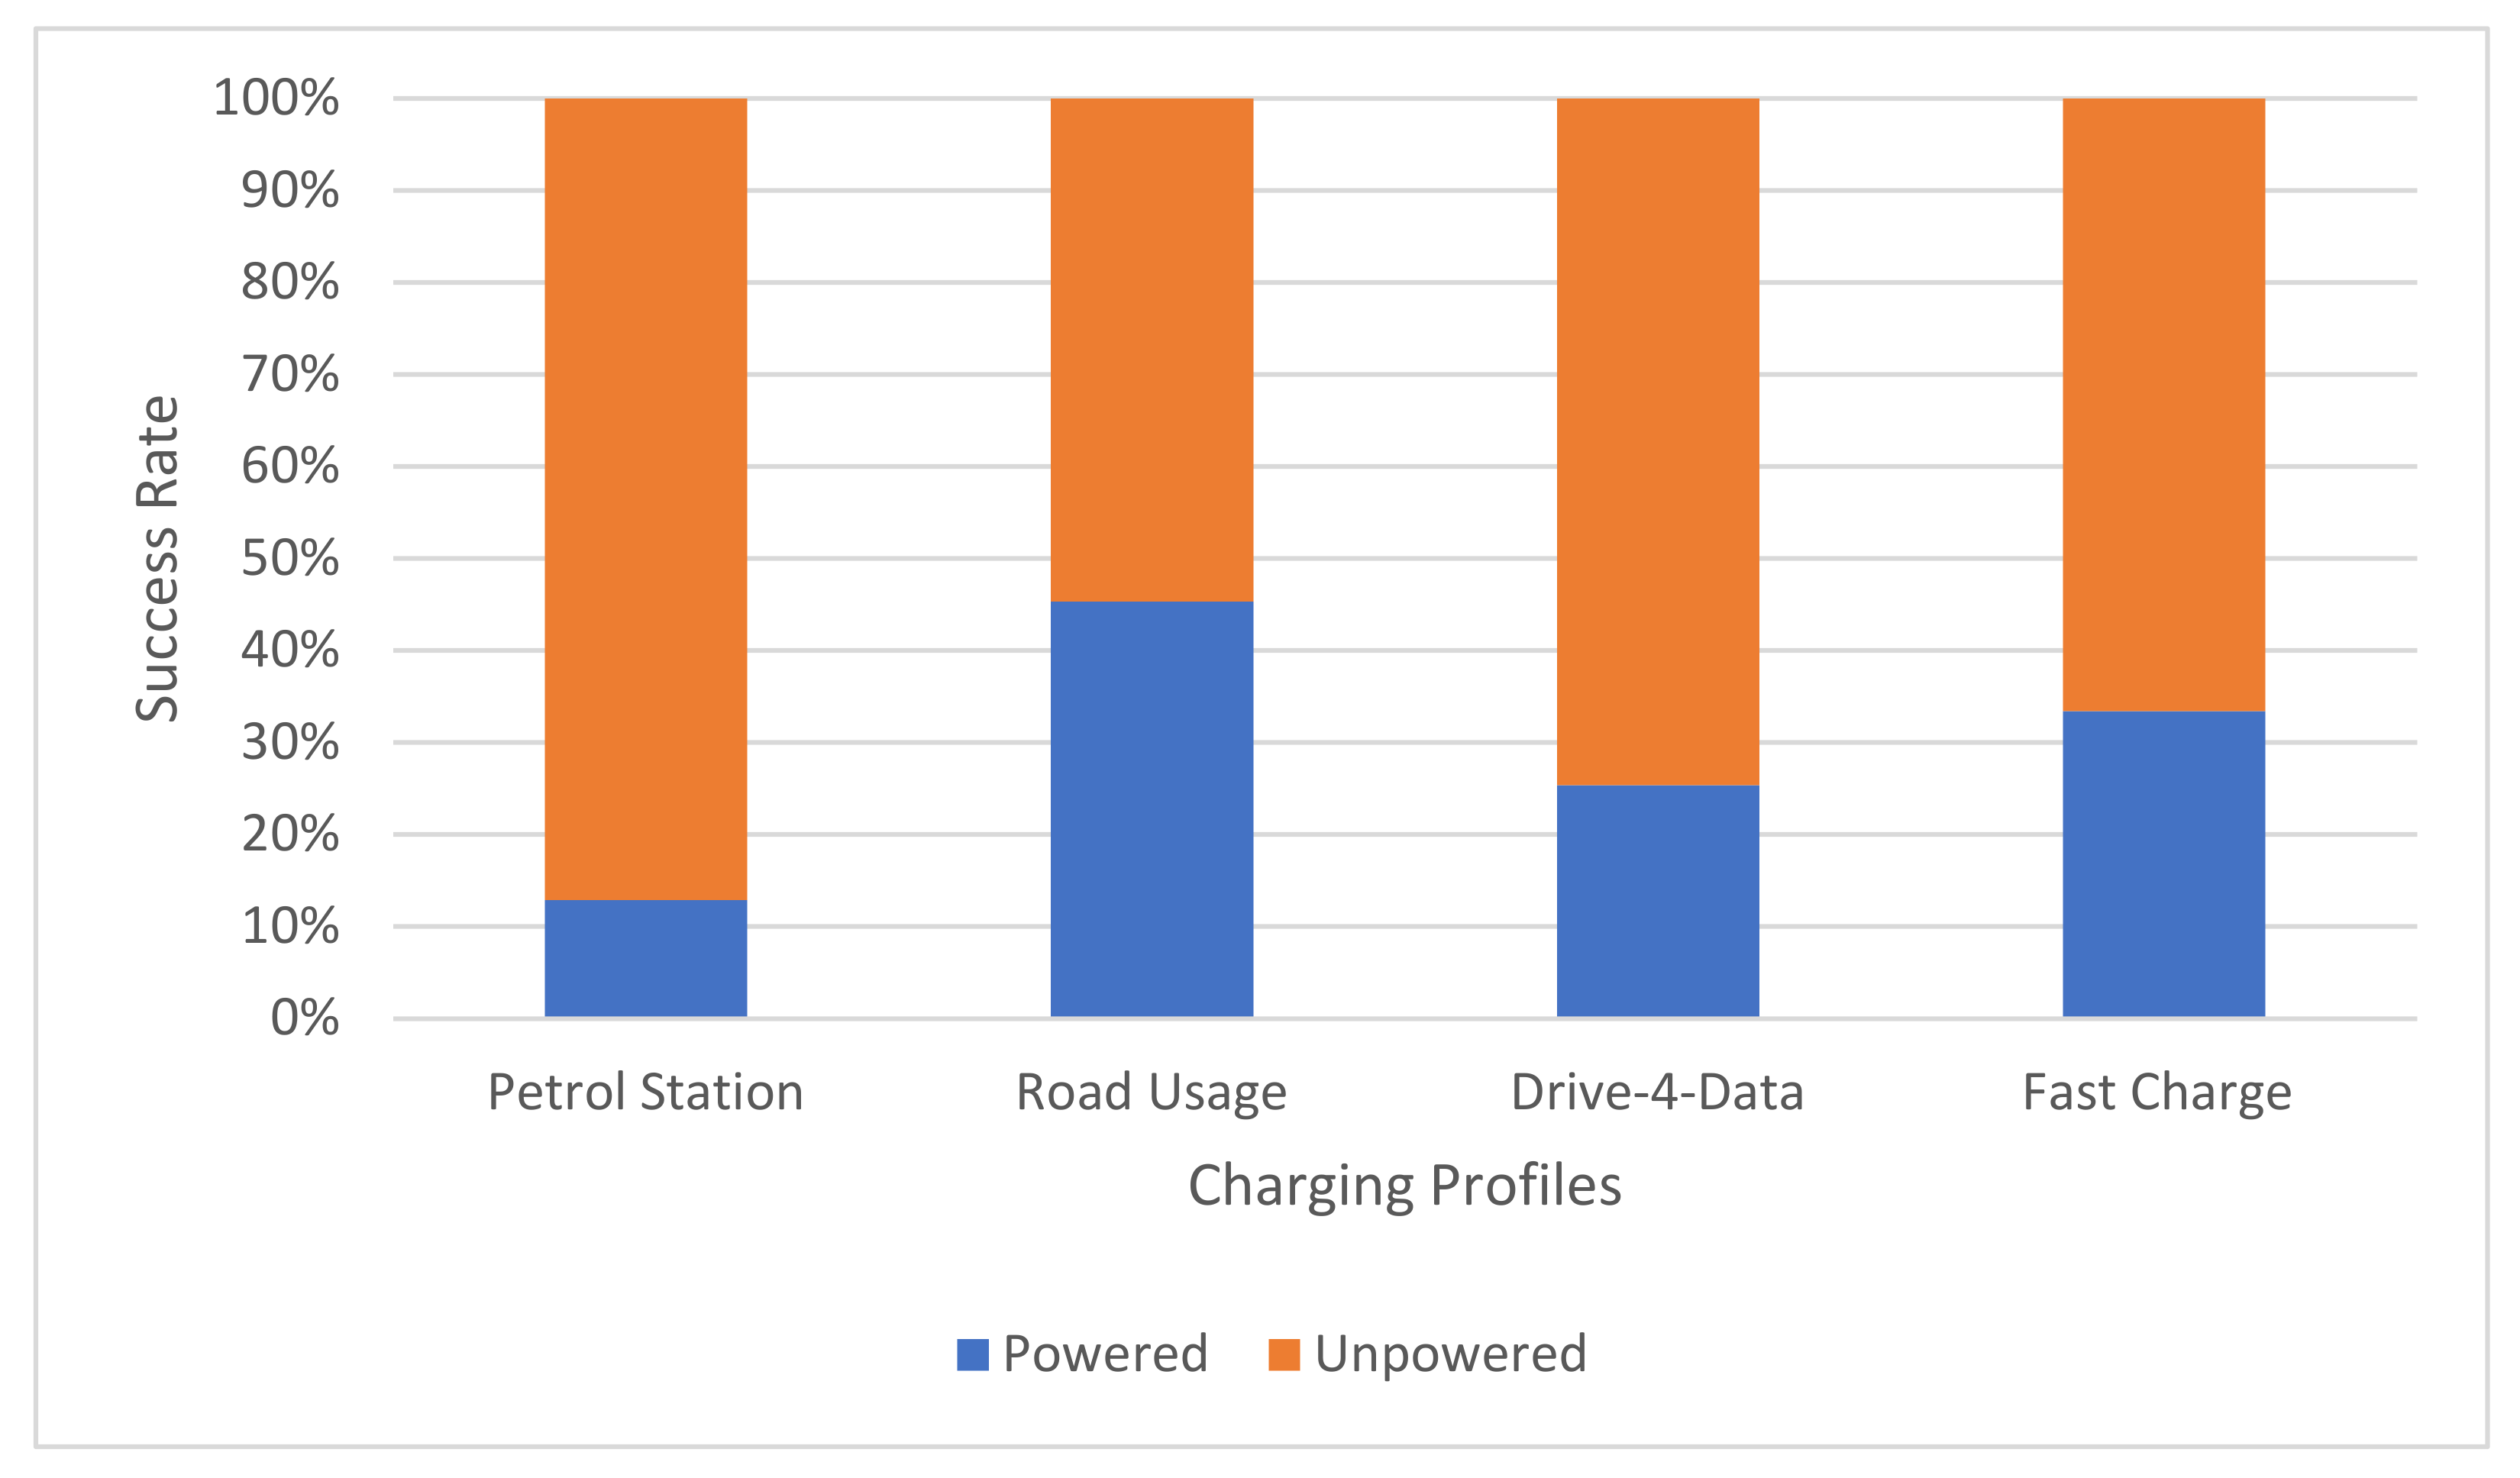
Figure 6 shows that in the petrol station charging profile, it was only able to meet demand 12% of the time throughout the year, which indicates that 88% of the time, vehicles were unable to charge. The road usage charging profile was able to supply electricity only 45% of the time, and for the Drive-4-Data charging profile and fast-charge charging profile, this was 25% and 33%, respectively. Even though the system produced sufficient energy to offset demand in the road usage charging profile, Drive-4-Data charging profile, and fast-charge charging profile, the system only supplied the demand less than half of the time. This shows that the array did not meet demand as and when it was needed, requiring other methods to be employed to better utilize the energy. This demonstrates that a grid connection is necessary for a PVEVCS to function.
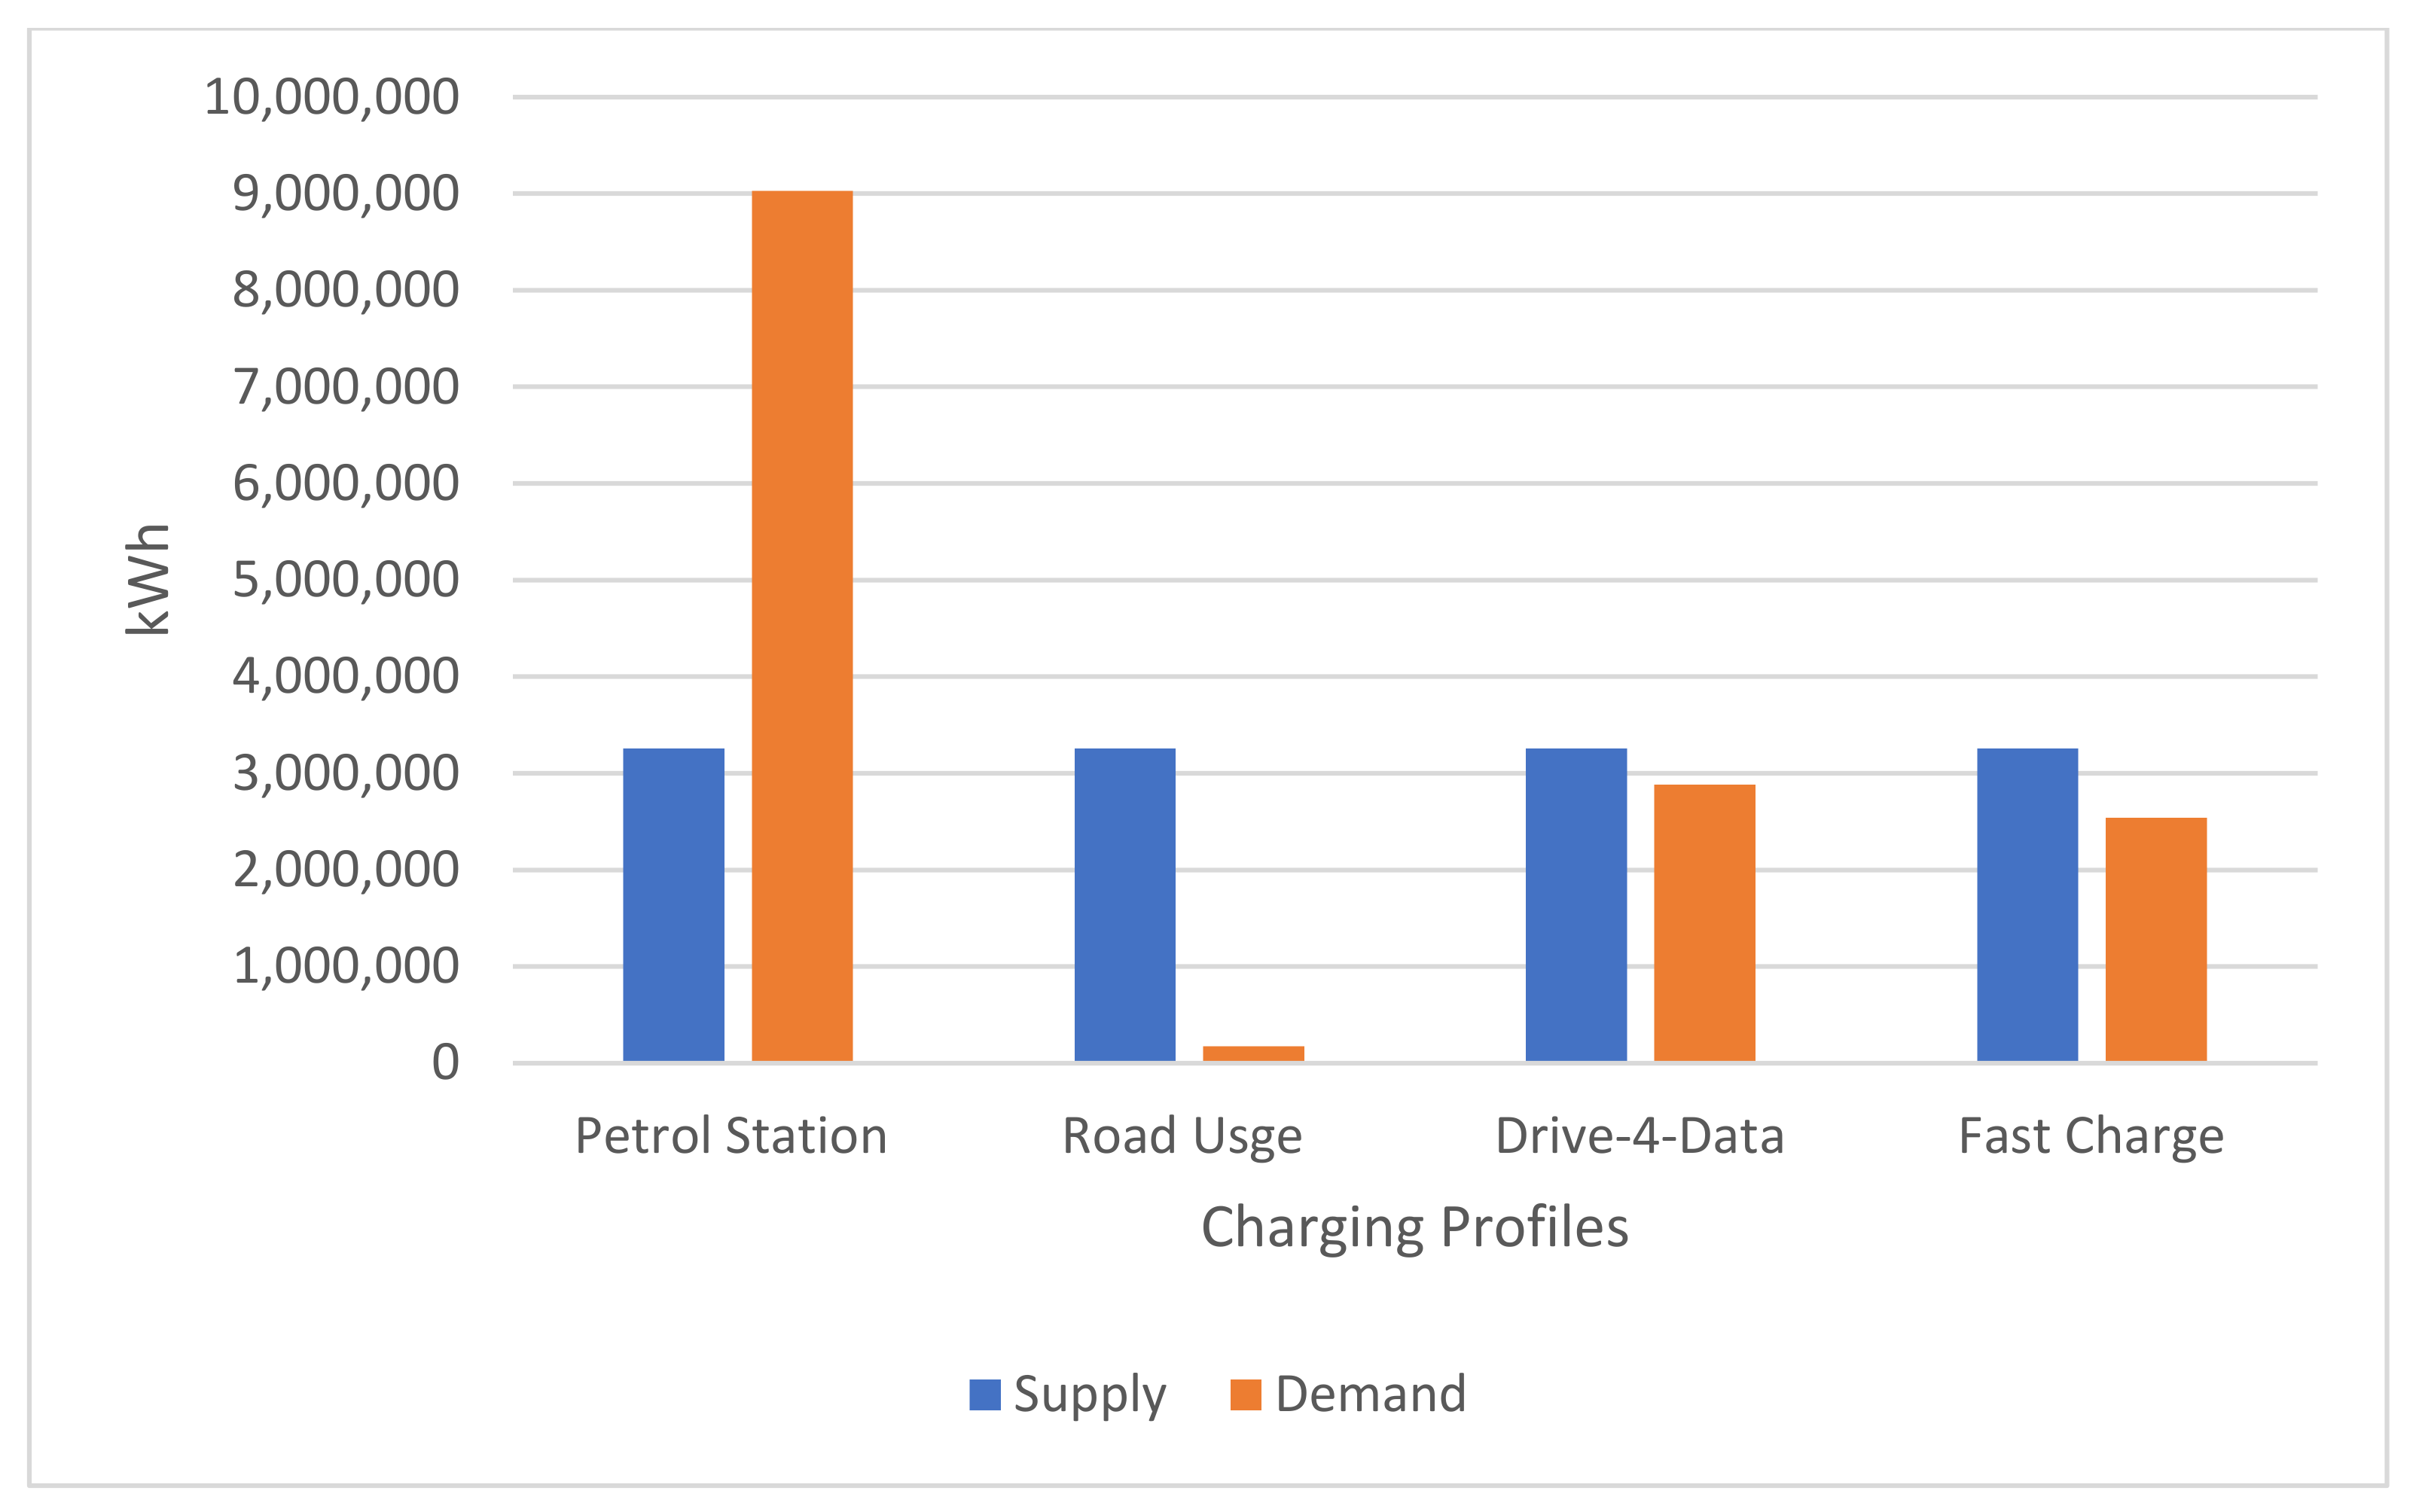
Figure 7 shows the difference between the power demand and supply of the non-grid-connected system with no storage. There were substantial differences between the energy supplied and the energy demand in the petrol station charging profile, indicating the system was not generating enough energy. The road usage charging profile was the only one with a substantial difference between supply and demand. Drive-4-Data and fast charge’s demand were also less than the supply, indicating the PV array was sufficient, but an increase in nominal power would have benefits.
3.2. Grid-Connected System with No Storage
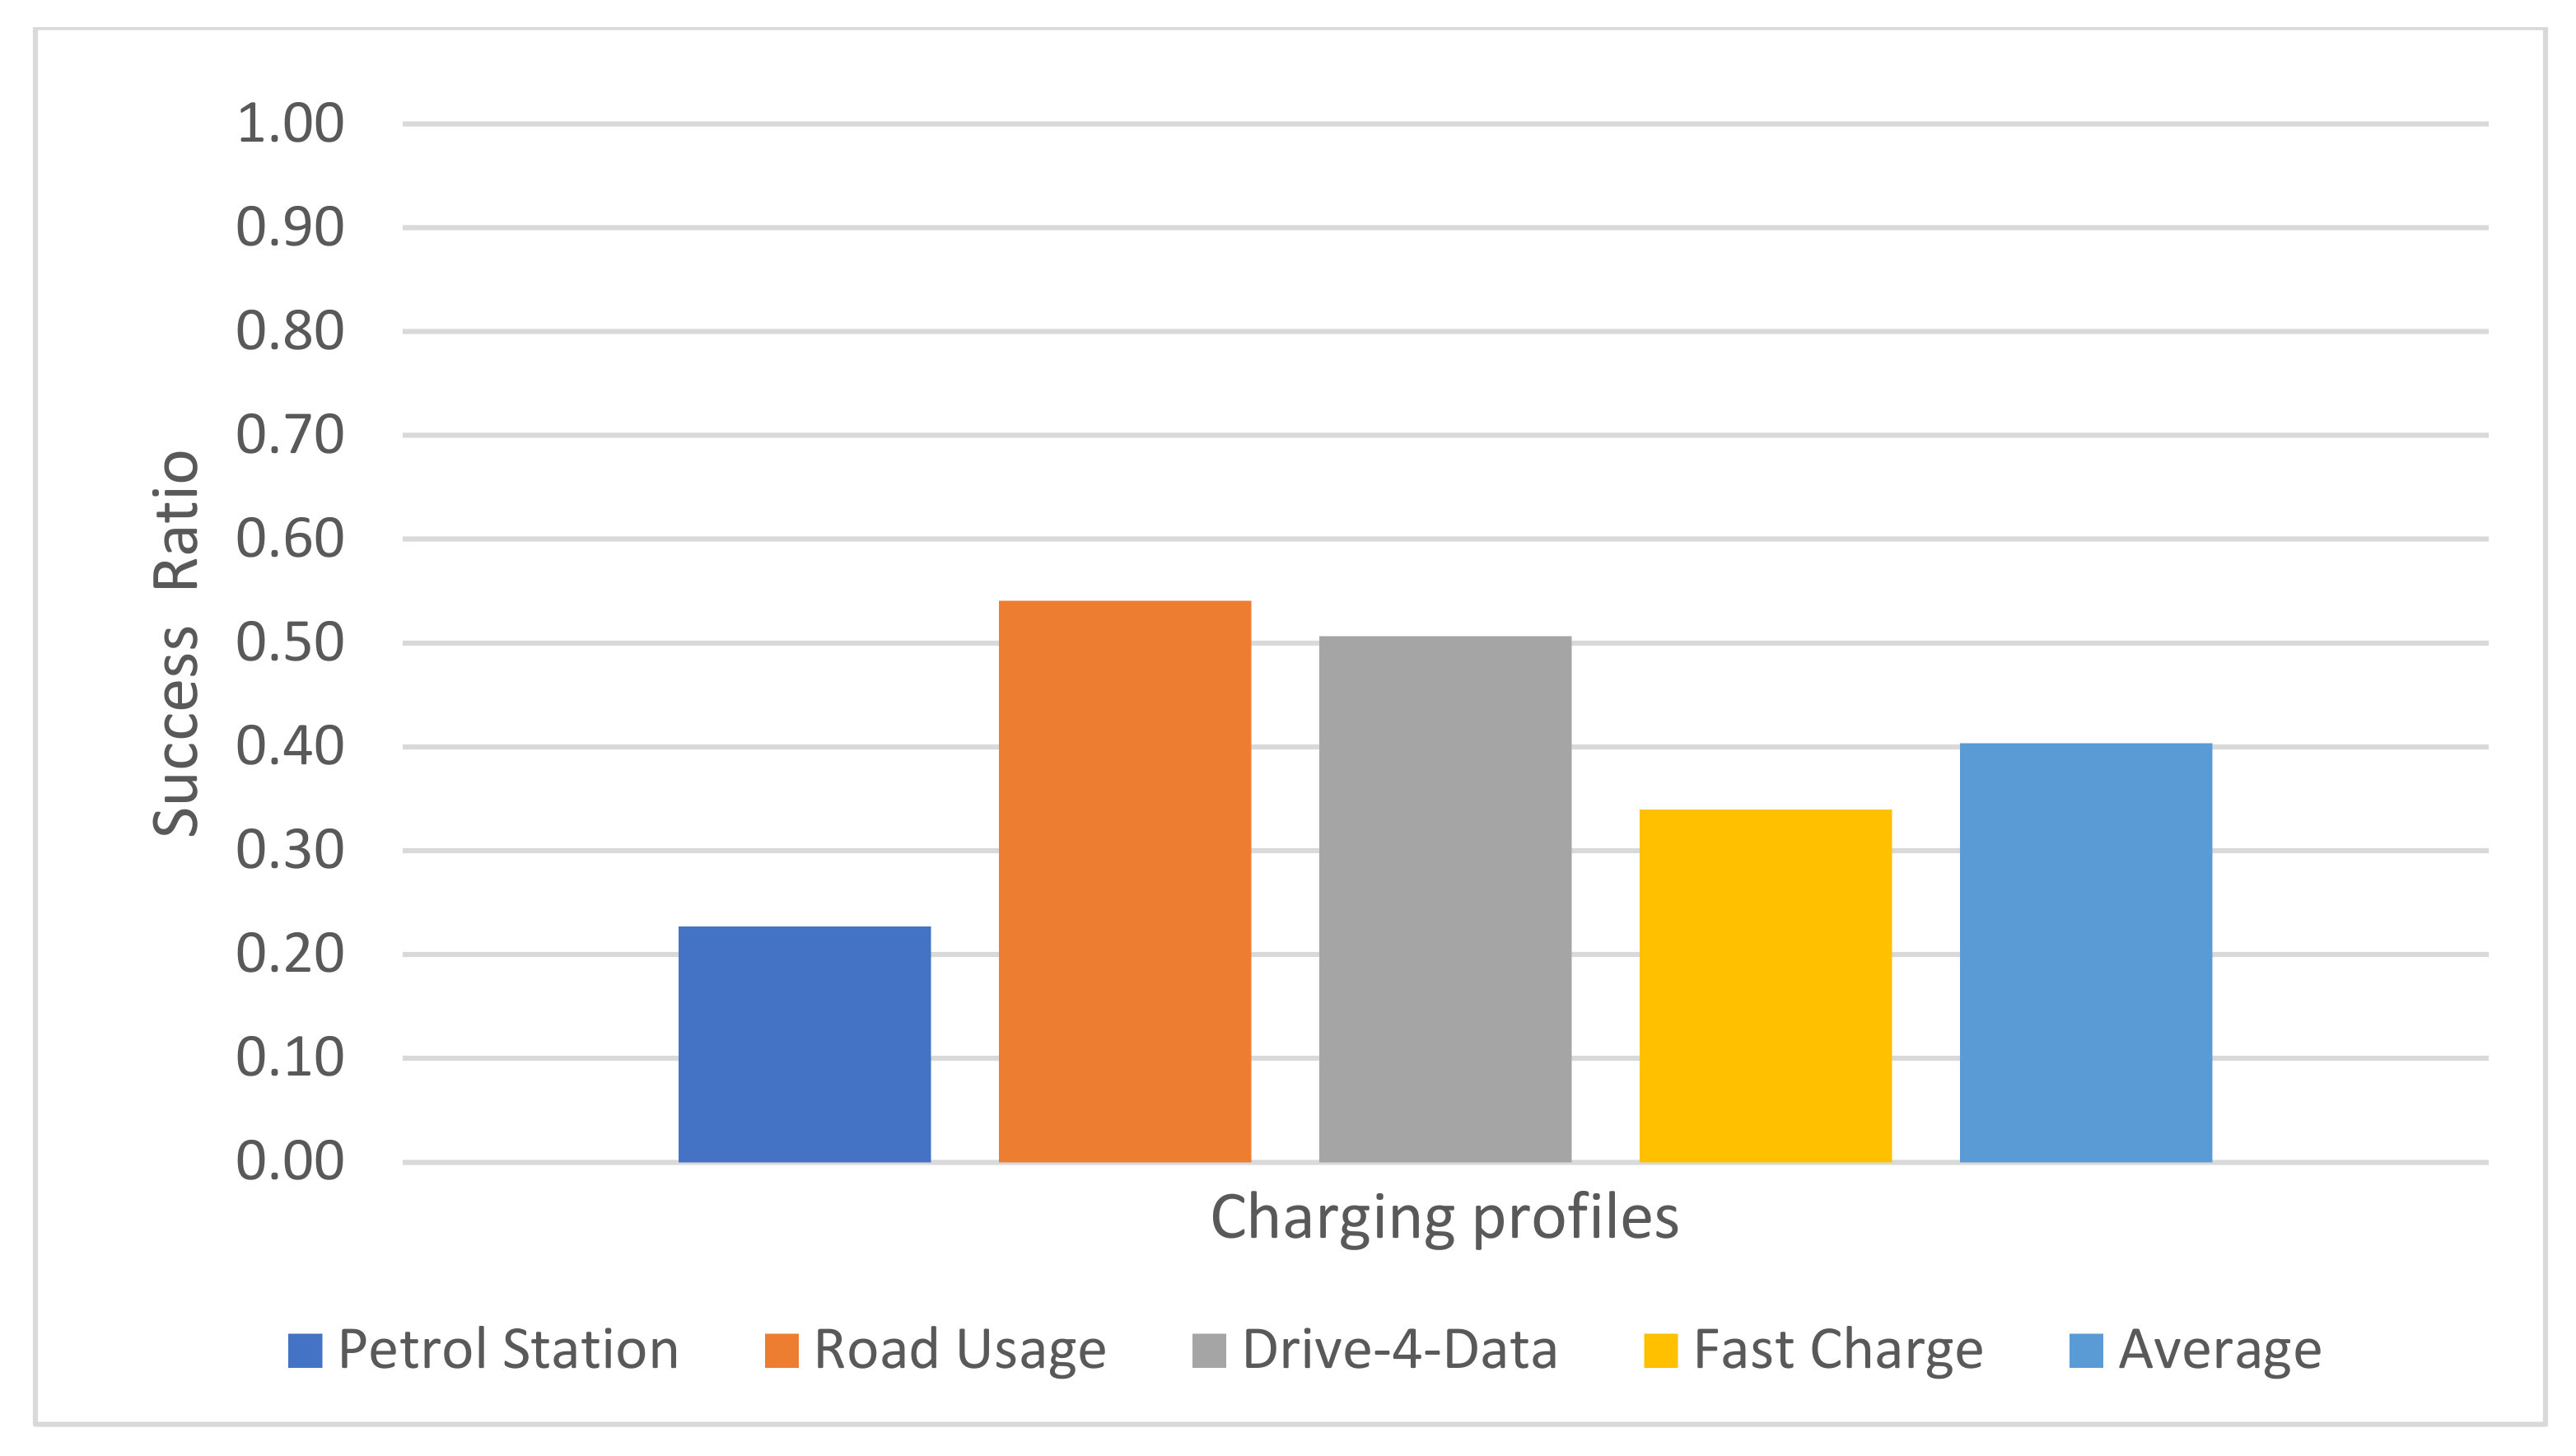
Figure 8 shows that the petrol station charging profile had the lowest success ratio (SR). This was due to the magnitude of the demand that was placed upon the system.
Table 4 shows that the petrol station charging profile represented a yearly load of 9.03 GWh/yr, whereas the system only produced 3.26 GWh/yr, which was 36% of the petrol station charging profile’s demand. Therefore, an SR of 23% was expected. This also indicates that the EVCS was importing 5.77 GWh/yr, representing a substantial impact on the grid. The road usage charging profile had the highest SR value, indicating that it was able to supply itself 54% of the time without importing energy while being above the average across the charging profiles. However, considering that the road usage charging profile defined a daily arrival rate of 11 cars, and considering the overall production of the system, the SR would be expected to be higher. This was due to cars arriving once the sun had set, and so the PVEVCS was forced to import energy to meet demand. This suggests that there is a limit on how much integrating solar affects the EVCS’s grid independence. This indicates that other measures such as on-site storage would be an effective measure to reduce the proportion of imported energy once the sun has set. The Drive-4-Data charging profile had a 51% success ratio, indicating again that the system was able to cope with the demand placed upon it while the sun was shining, while outside of these hours, energy had to be imported. Furthermore, since there was a 3% difference between the Drive-4-Data charging profile and road usage charging profile SR ratings, this again points toward there being a limit to how much solar integration affects grid independence. The fast-charge charging profile performed worse than the Drive-4-Data charging profile, despite having a lower arrival rate by 17% of 167 cars. This was due to the fast-charge charging profile having the majority of its vehicles arriving in the evening between 4:00 p.m. and 7:00 p.m., typically when the sun was setting. Overall, this suggests that the SR of a system is dependent heavily on when the cars arrive and, therefore, the pattern of the EV load profile. This suggests that an EV load profile pattern similar to the PV output maximizes the SR and, as such, the system’s grid independence.
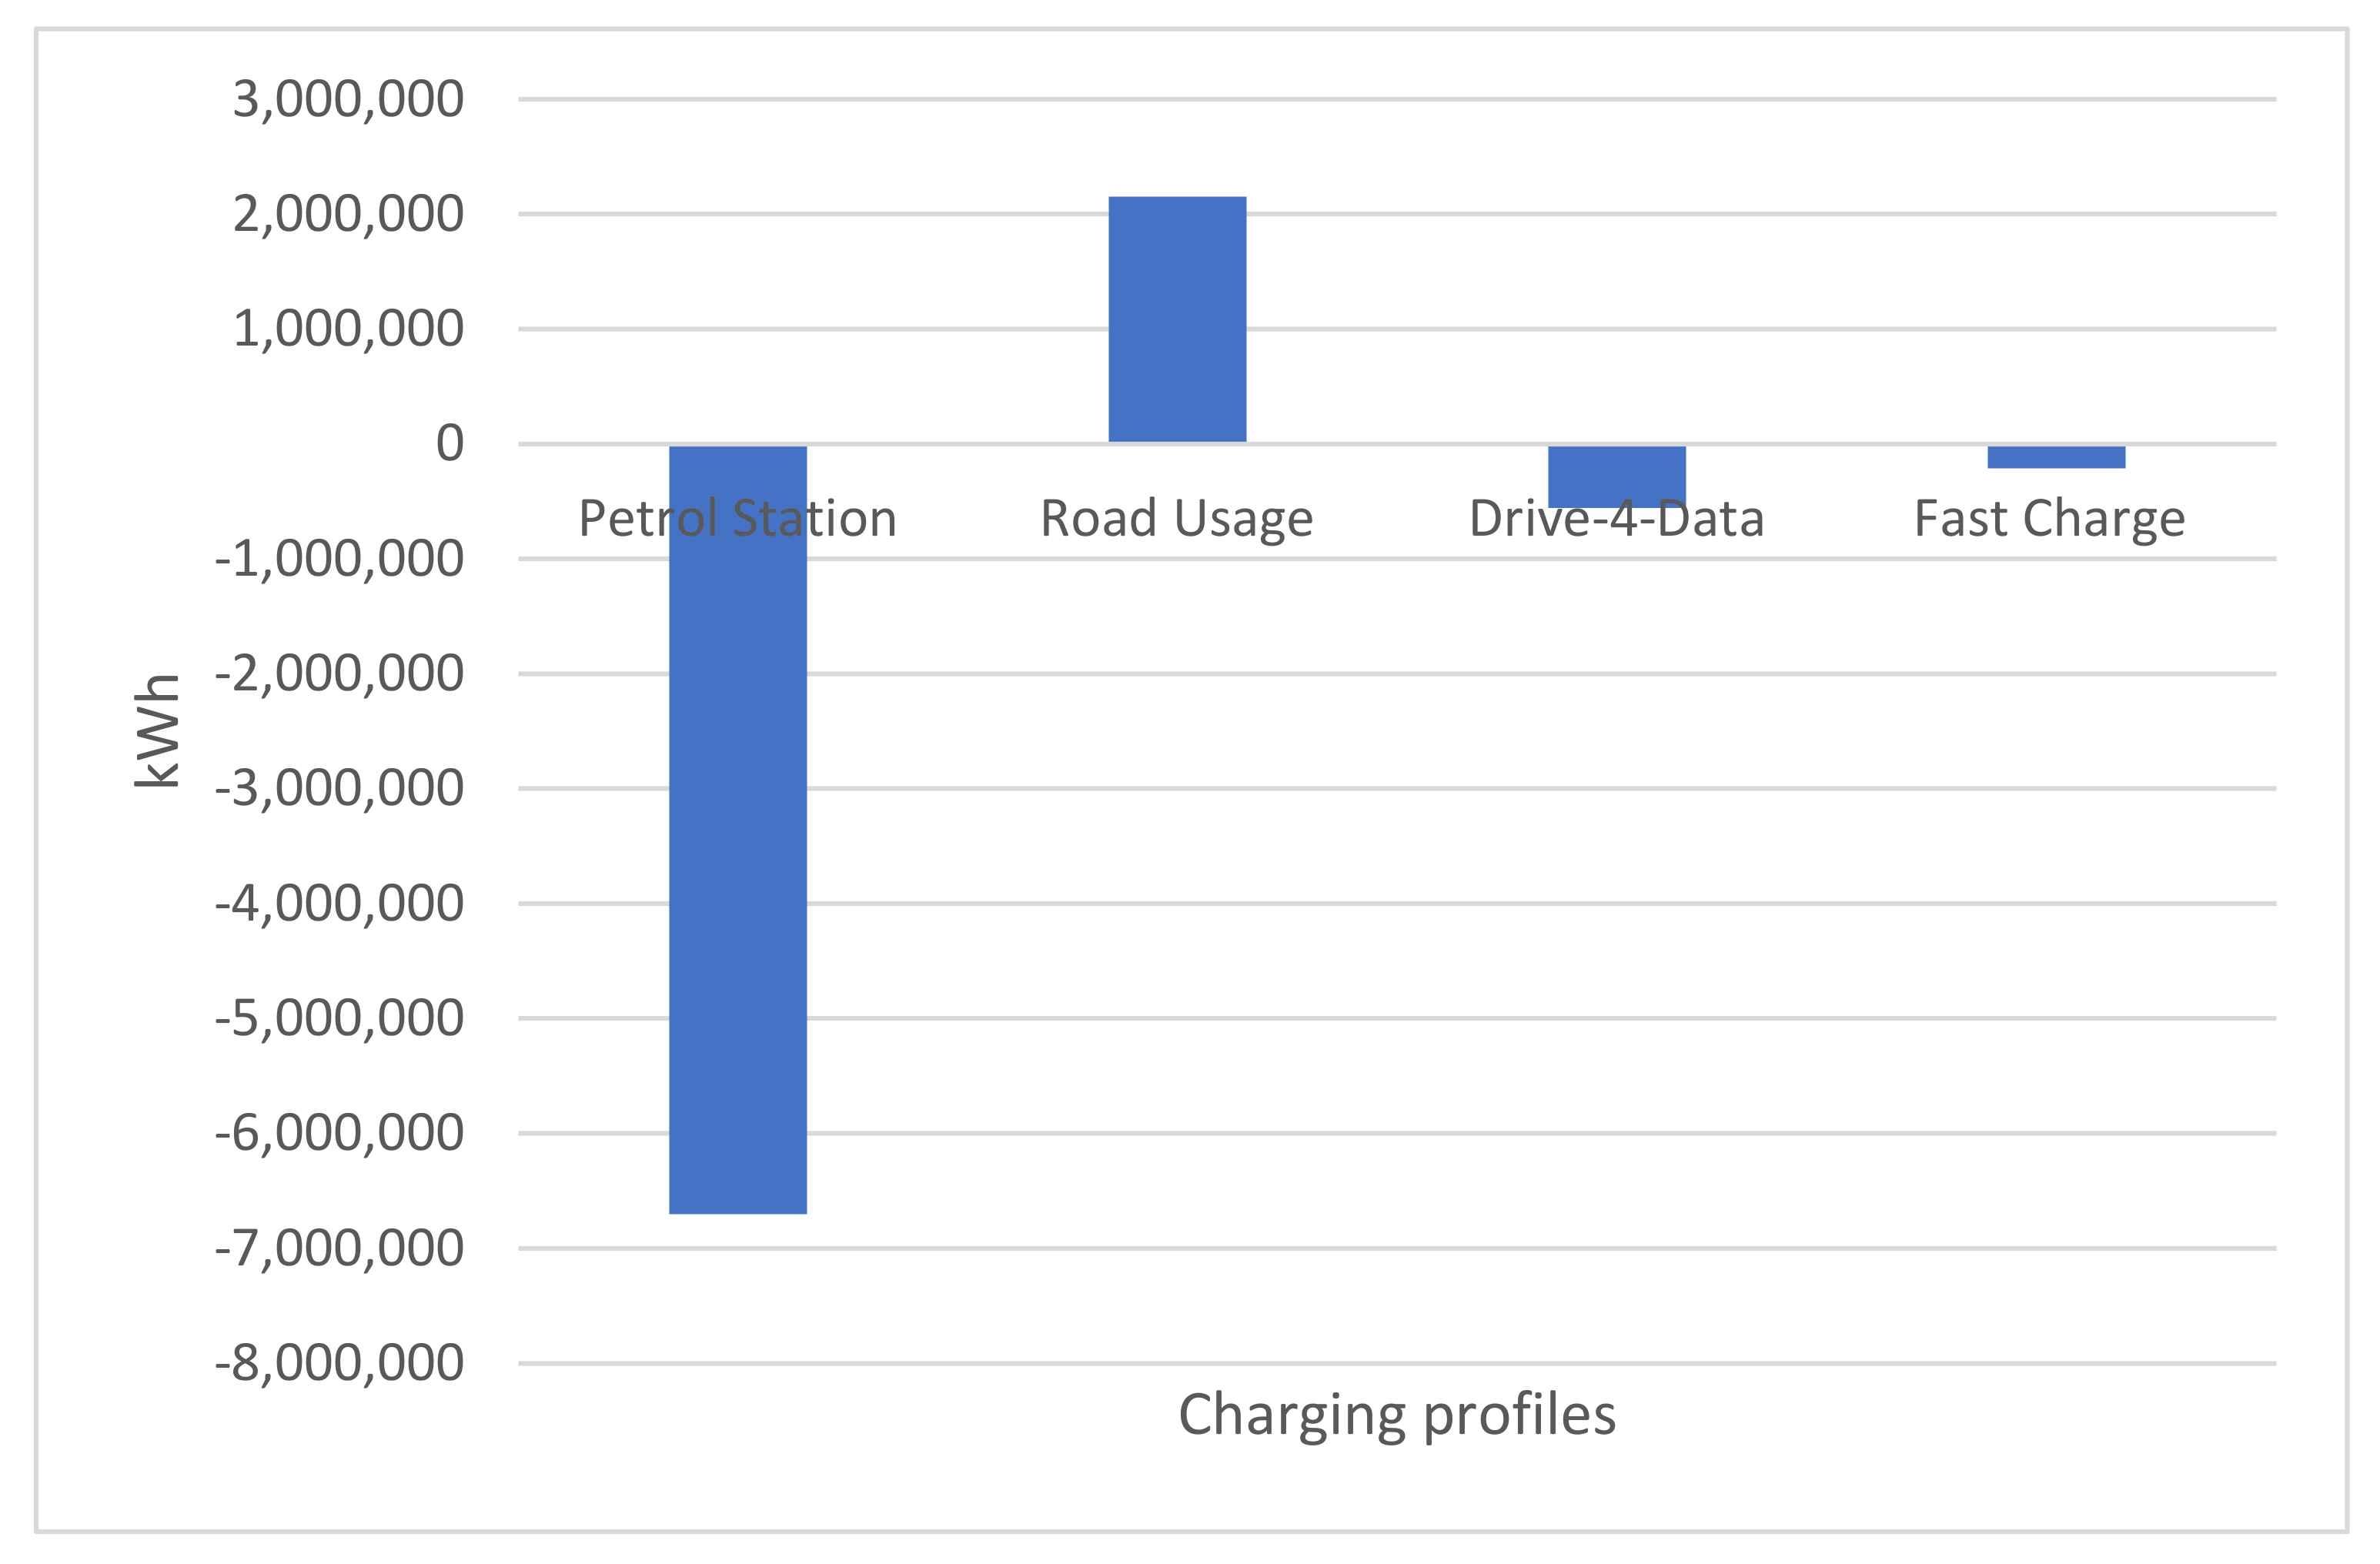
Figure 9 displays the health rating of the grid-connected system with no storage. The petrol station charging profile represented a large negative value of −6.7 GWh, indicating a significant energy deficit caused by the PVEVCS. This, combined with the low SR in
Figure 8, suggests that the PV array was not sufficient to match demand. Therefore, the size of the array must be increased to account for the energy needed. The road usage charging profile had a high health rating of 2.15 GWh, indicating a large energy surplus that offset the energy imports. However, considering the system’s 53% success ratio rating and its health rating together, improving the management of its surplus energy could further increase its success ratio. The Drive-4-Data charging profile and fast-charge charging profile both had low negative health ratings of −0.559 GWh and −0.213 GWh, respectively. This indicates a small impact on the grid as a result of it importing more energy to meet demand than it exported.
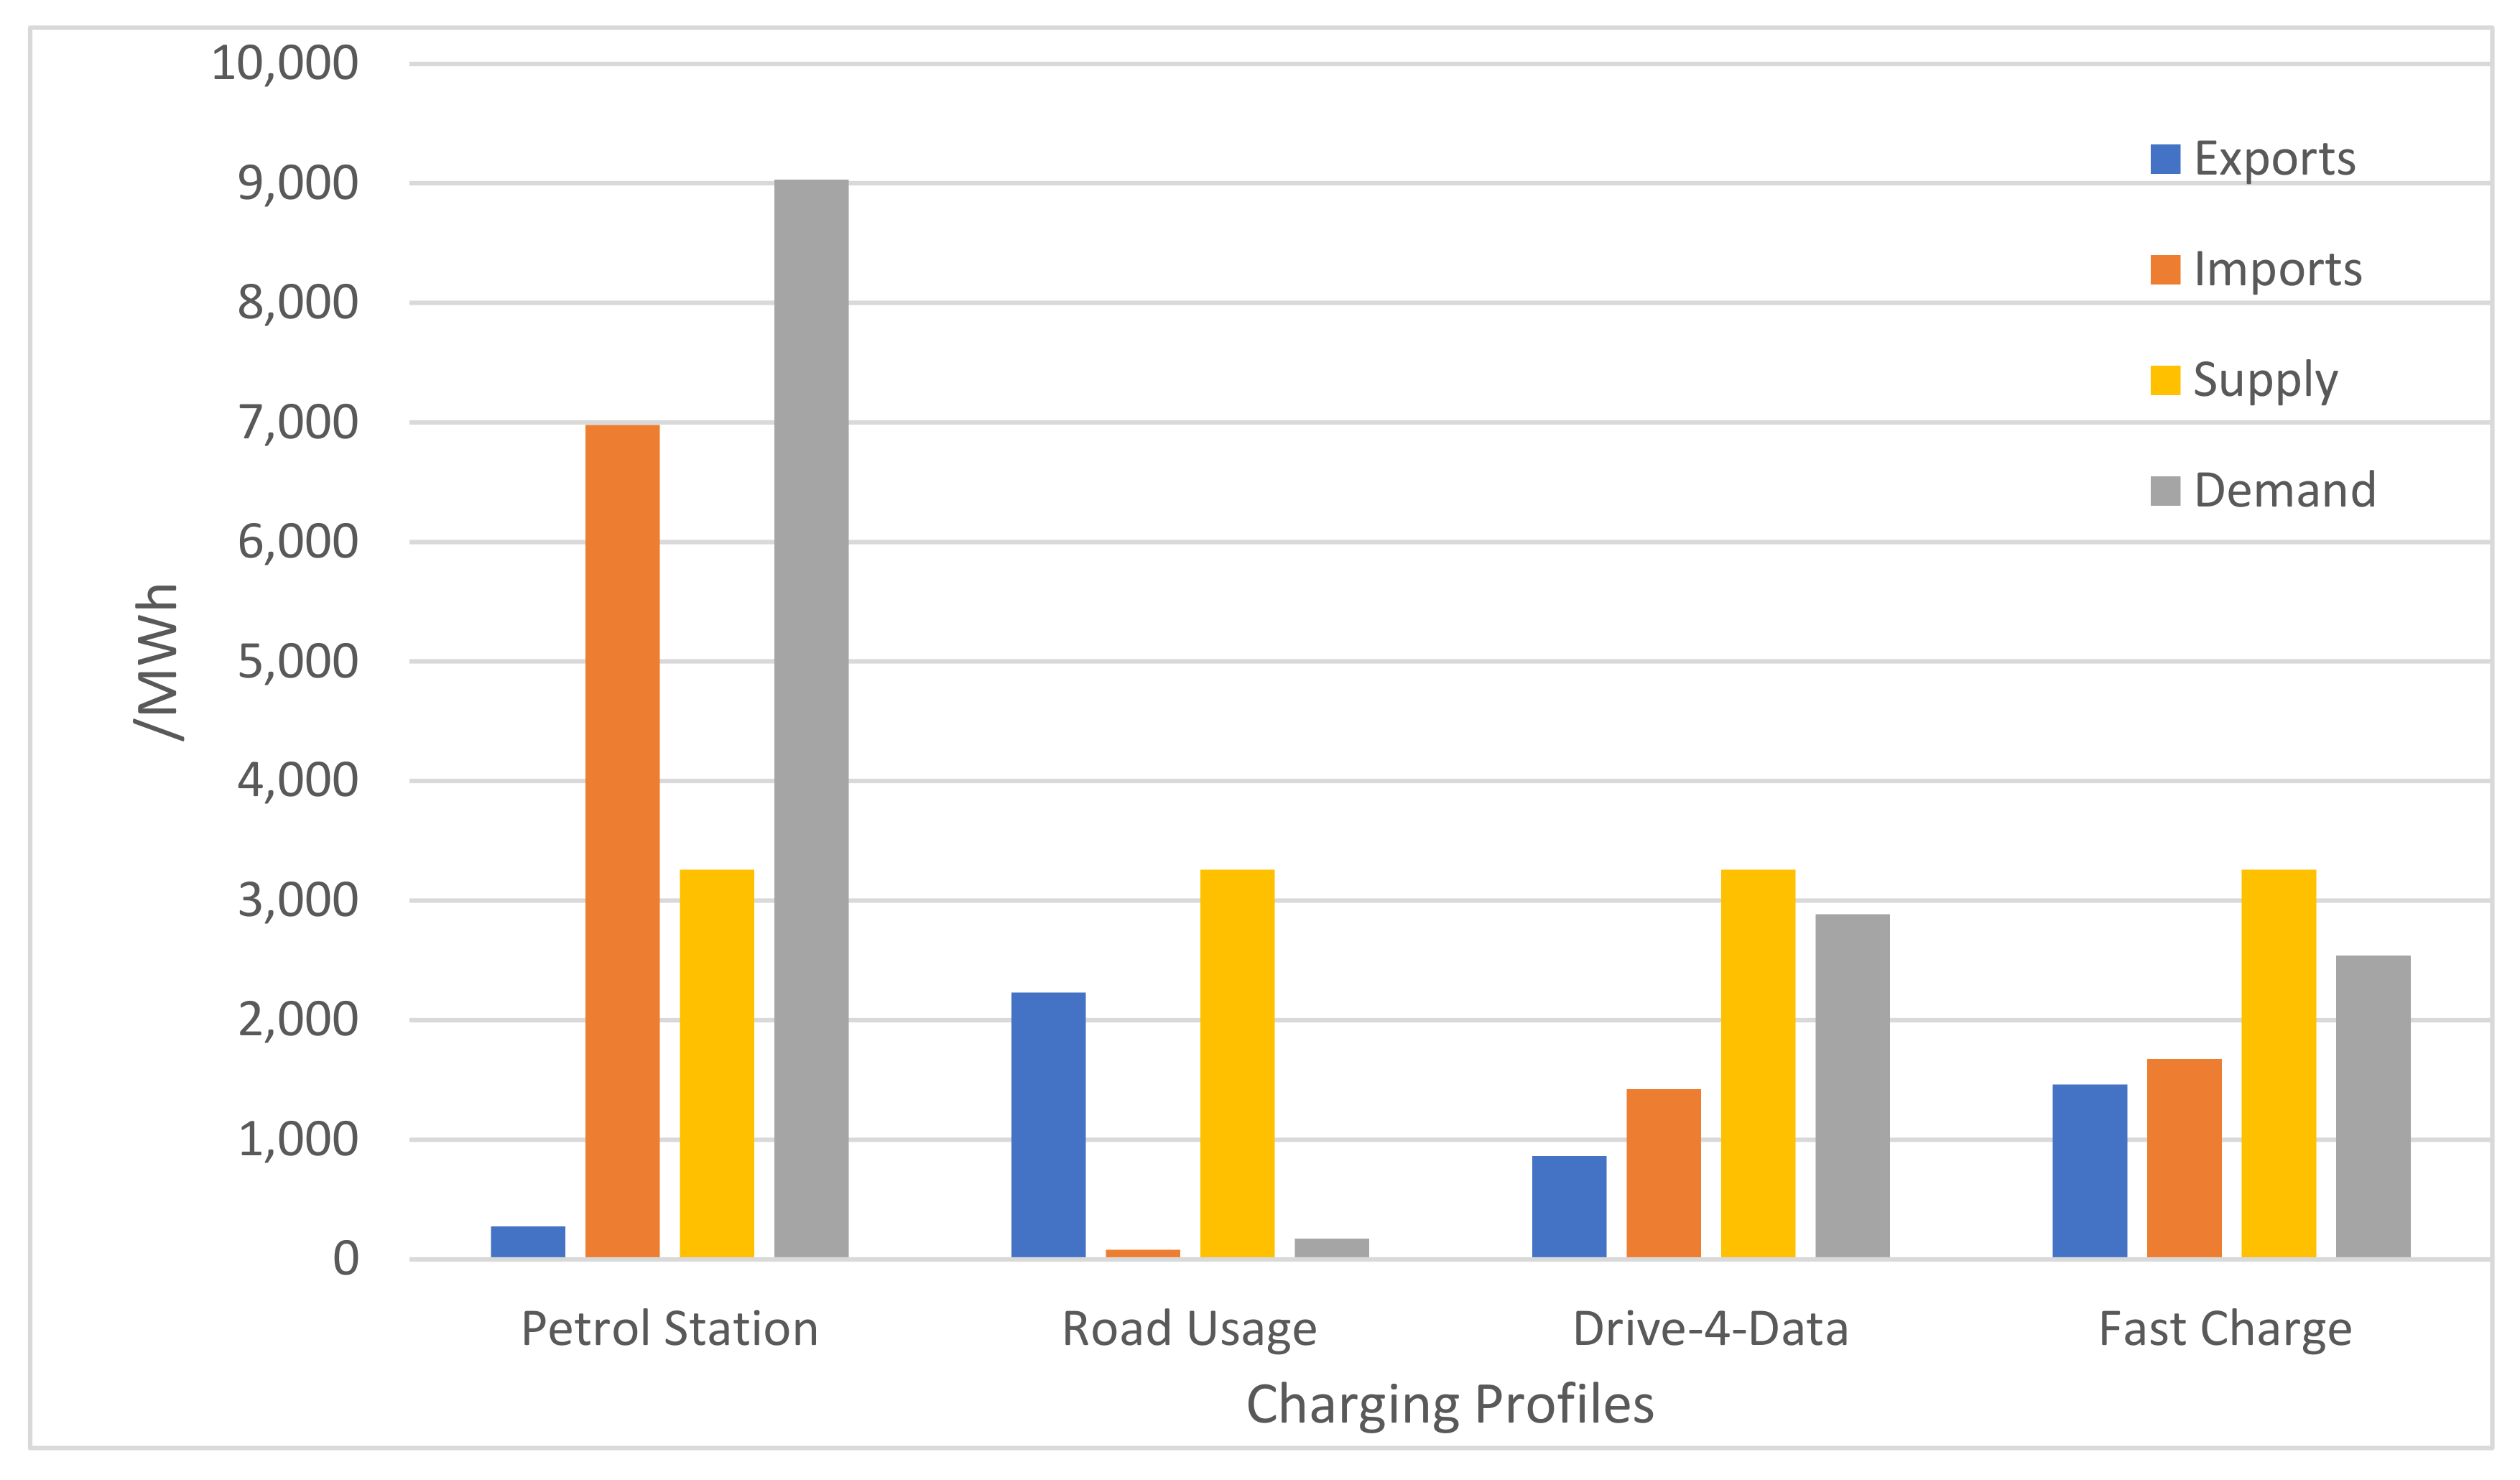
Figure 10 shows that the petrol station charging profile demanded a substantial amount of energy. Since the supply was 36% of the demand, the system had to import the remainder which, in turn, possessed a large negative health rating. The road usage charging profile exported a large amount of surplus energy to the grid, whereas the Drive-4-Data charging profile and fast-charge charging profile had similar levels, although the Drive-4-Data charging profile did import nearly twice the amount it exported. The systems in the Drive-4-Data charging profile and fast-charge charging profile both exported significant amounts of electricity to the grid, reducing their impact and acting as prosumers to the grid.
3.3. Grid-Connected Systems with 0 MWh, 0.5 MWh, and 1 MWh
In
Figure 11, for both the petrol station charging profile and Drive-4-Data charging profile, the addition of storage had no effect. For the petrol station charging profile, this was because the production was approximately one third of the annual demand. Therefore, the addition of 1 MWh of storage was ineffective, as the true issue was a lack of supply. For the Drive-4-Data charging profile, however, since a large proportion of the arrivals were during periods of low production, the batteries had a limited opportunity to charge and were therefore ineffective. A solution to this would be to introduce alternative BESS power management strategies. The road usage charging profile improved but plateaued as the storage increased. This reinforces the concept of a limit being in place for how grid-independent solar integration can aid the charging station, since solar power is entirely dependent on solar radiation, which is low in the winter and uncontrollable. The fast-charge charging profile had a significant improvement of 12% through the addition of storage, although the scale of improvement reduced as the storage increased, reinforcing the concept of a limit as discussed with the road usage charging profile. The fast-charge charging profile improved the most, since the majority of vehicle arrivals were during the evening hours. The low demand in the morning allowed excess electricity generated during days of good sun coverage to be stored and then used during peak demand between 3:00 p.m. and 6:00 p.m. This ultimately reduced the quantity of energy imported by the EVCS, further reducing its grid dependence. It also reduced the impact of the grid during peak demand, helping manage local grid loading. This indicates that if a charging station’s demand is characterized to have a peak during the evening, a BESS is an effective method to reduce the PVEVCS’s impact on the grid when there is good sun coverage.
Figure 12 demonstrates that the introduction of storage had a negligible effect on the health rating, and the energy imports and exports of the systems remained largely the same. This suggests that storage is not always an effective method to employ in order to utilize generated electricity more efficiently. This is dependent on the array’s production and the charging station’s demand. Only in the fast-charge charging profile was there a reduction in energy imports. This was due to the pattern of vehicle arrival being during the morning and increasing as the day continued. The low demand and high PV output in the morning allowed excess energy to be stored by the batteries and then used later on, reducing the energy imported and exported. Overall, this reduced the PVEVCS’s impact on the grid.
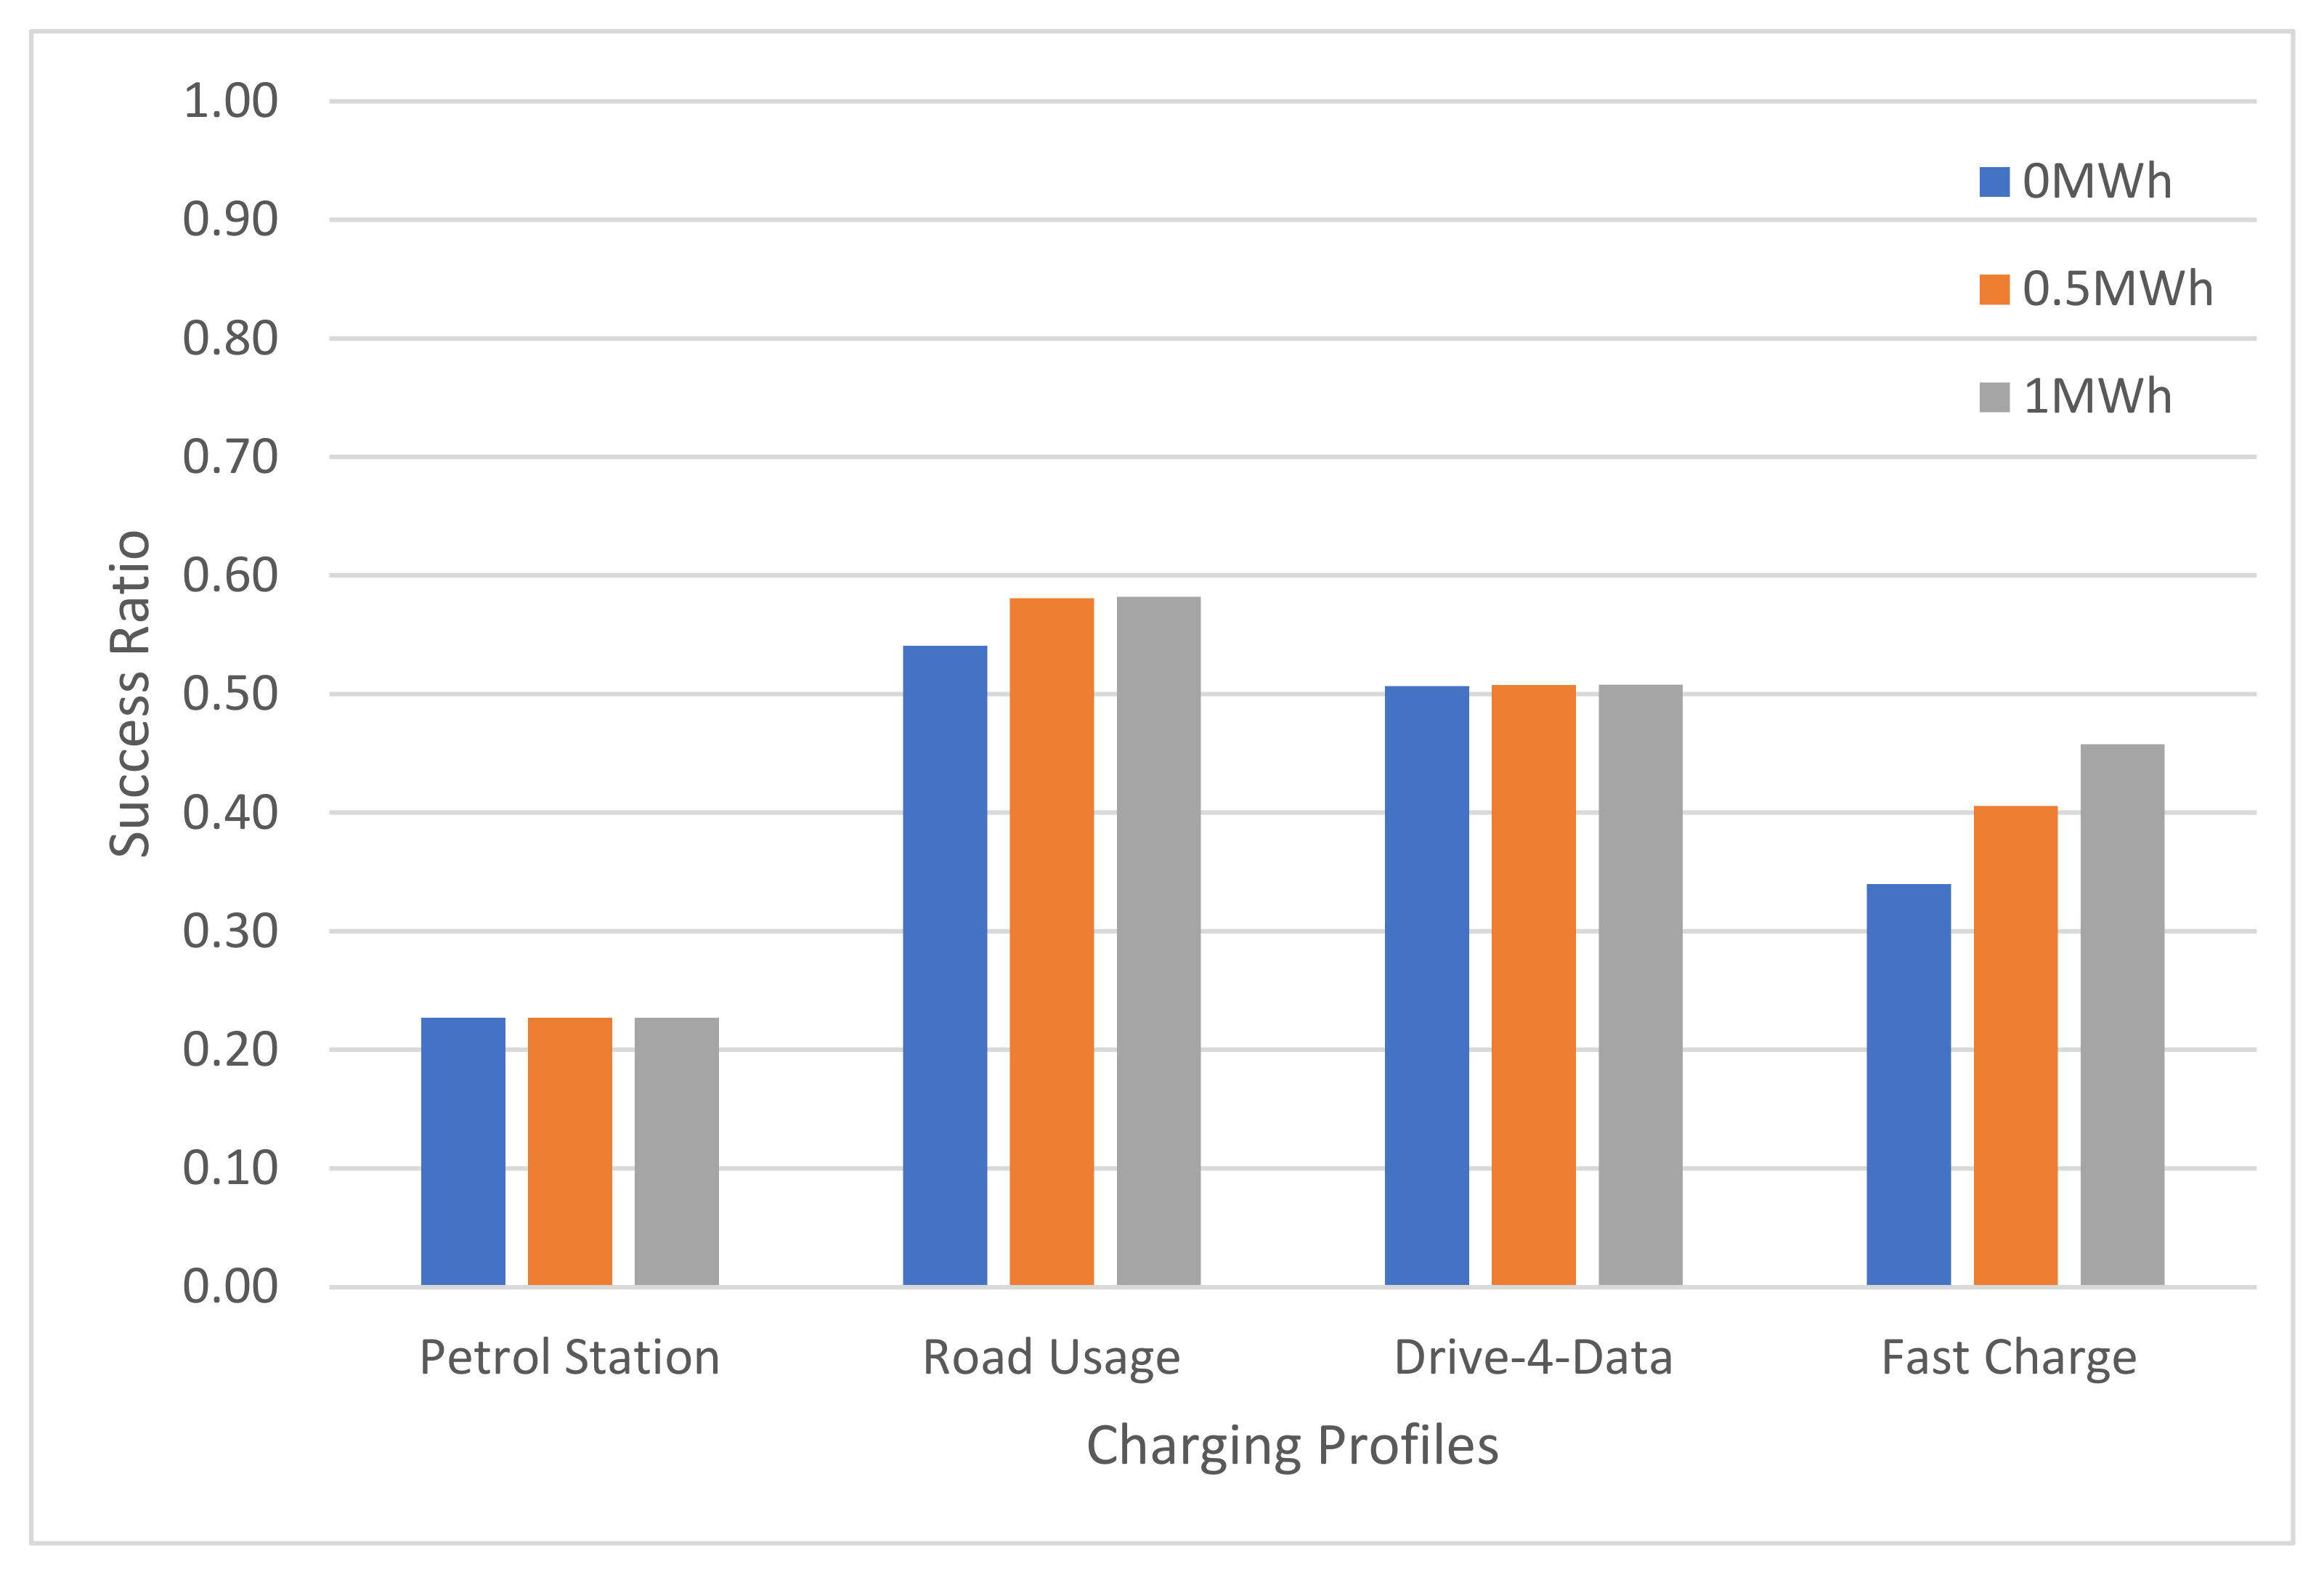
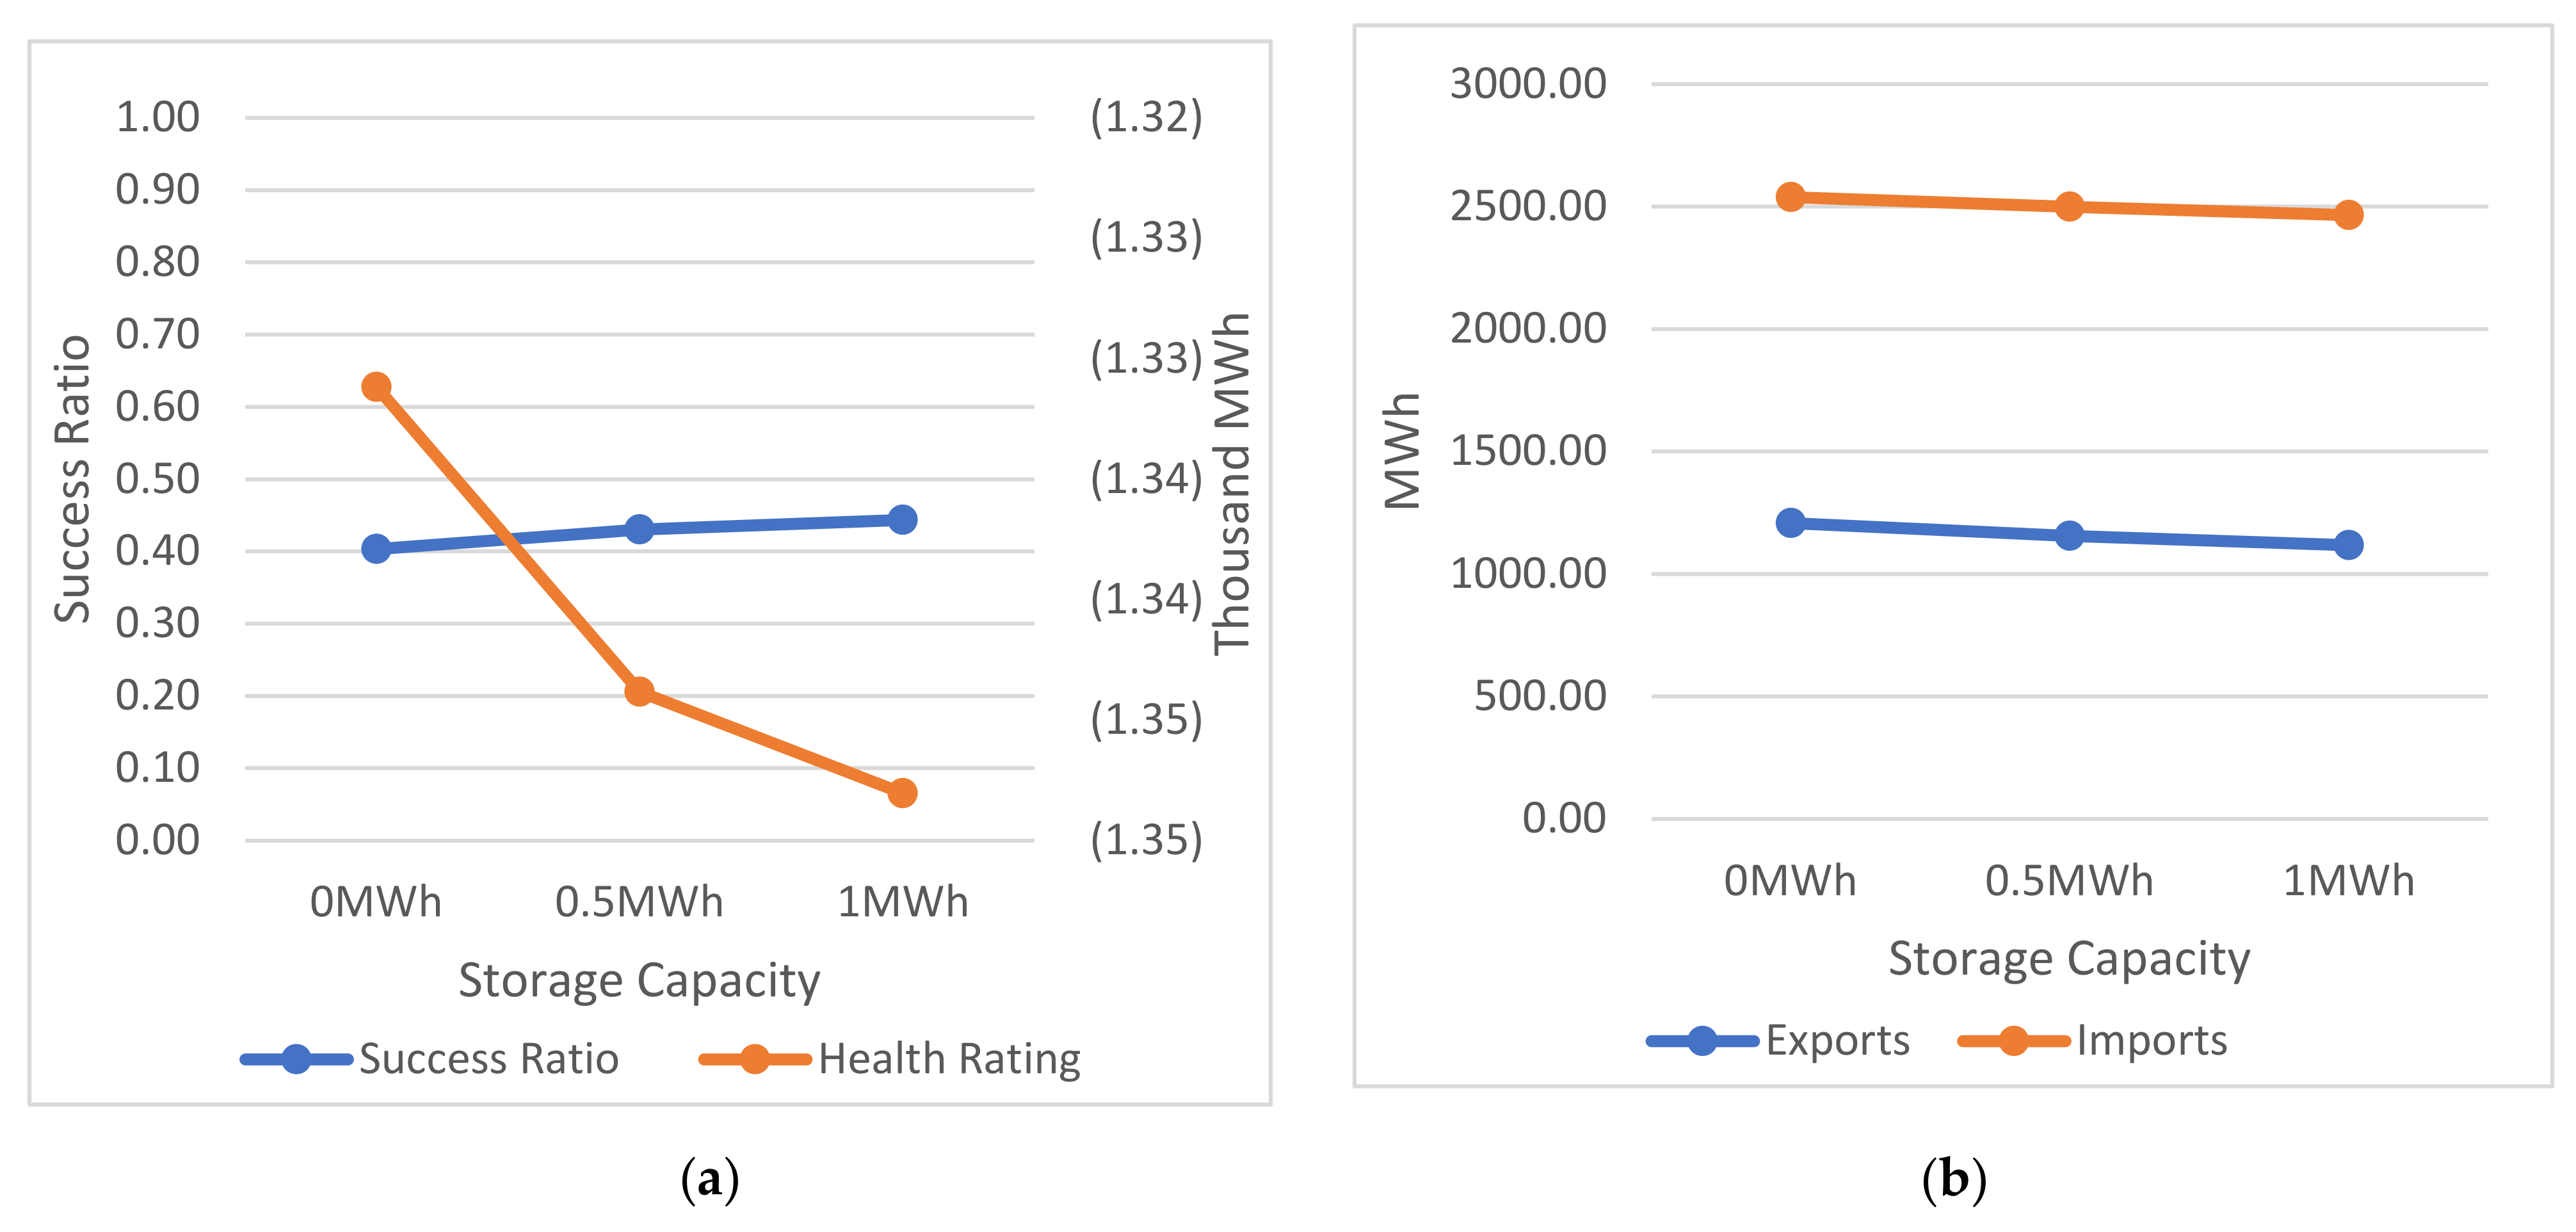
In
Figure 13a, the success ratio of the grid-connected system increased but experiences a tapering effect, indicating that integration of storage improved the PVEVCS’s grid independence but with a limited effect. This shows, however, that adding 1 MWh of storage improved the success ratio by 10% on average across all four charging profiles. It also reduced the health rating, suggesting that the increase in storage increased the overall energy deficit of the system, although the decrease was only 1%, so there was a small trade-off for the increase in grid independence.
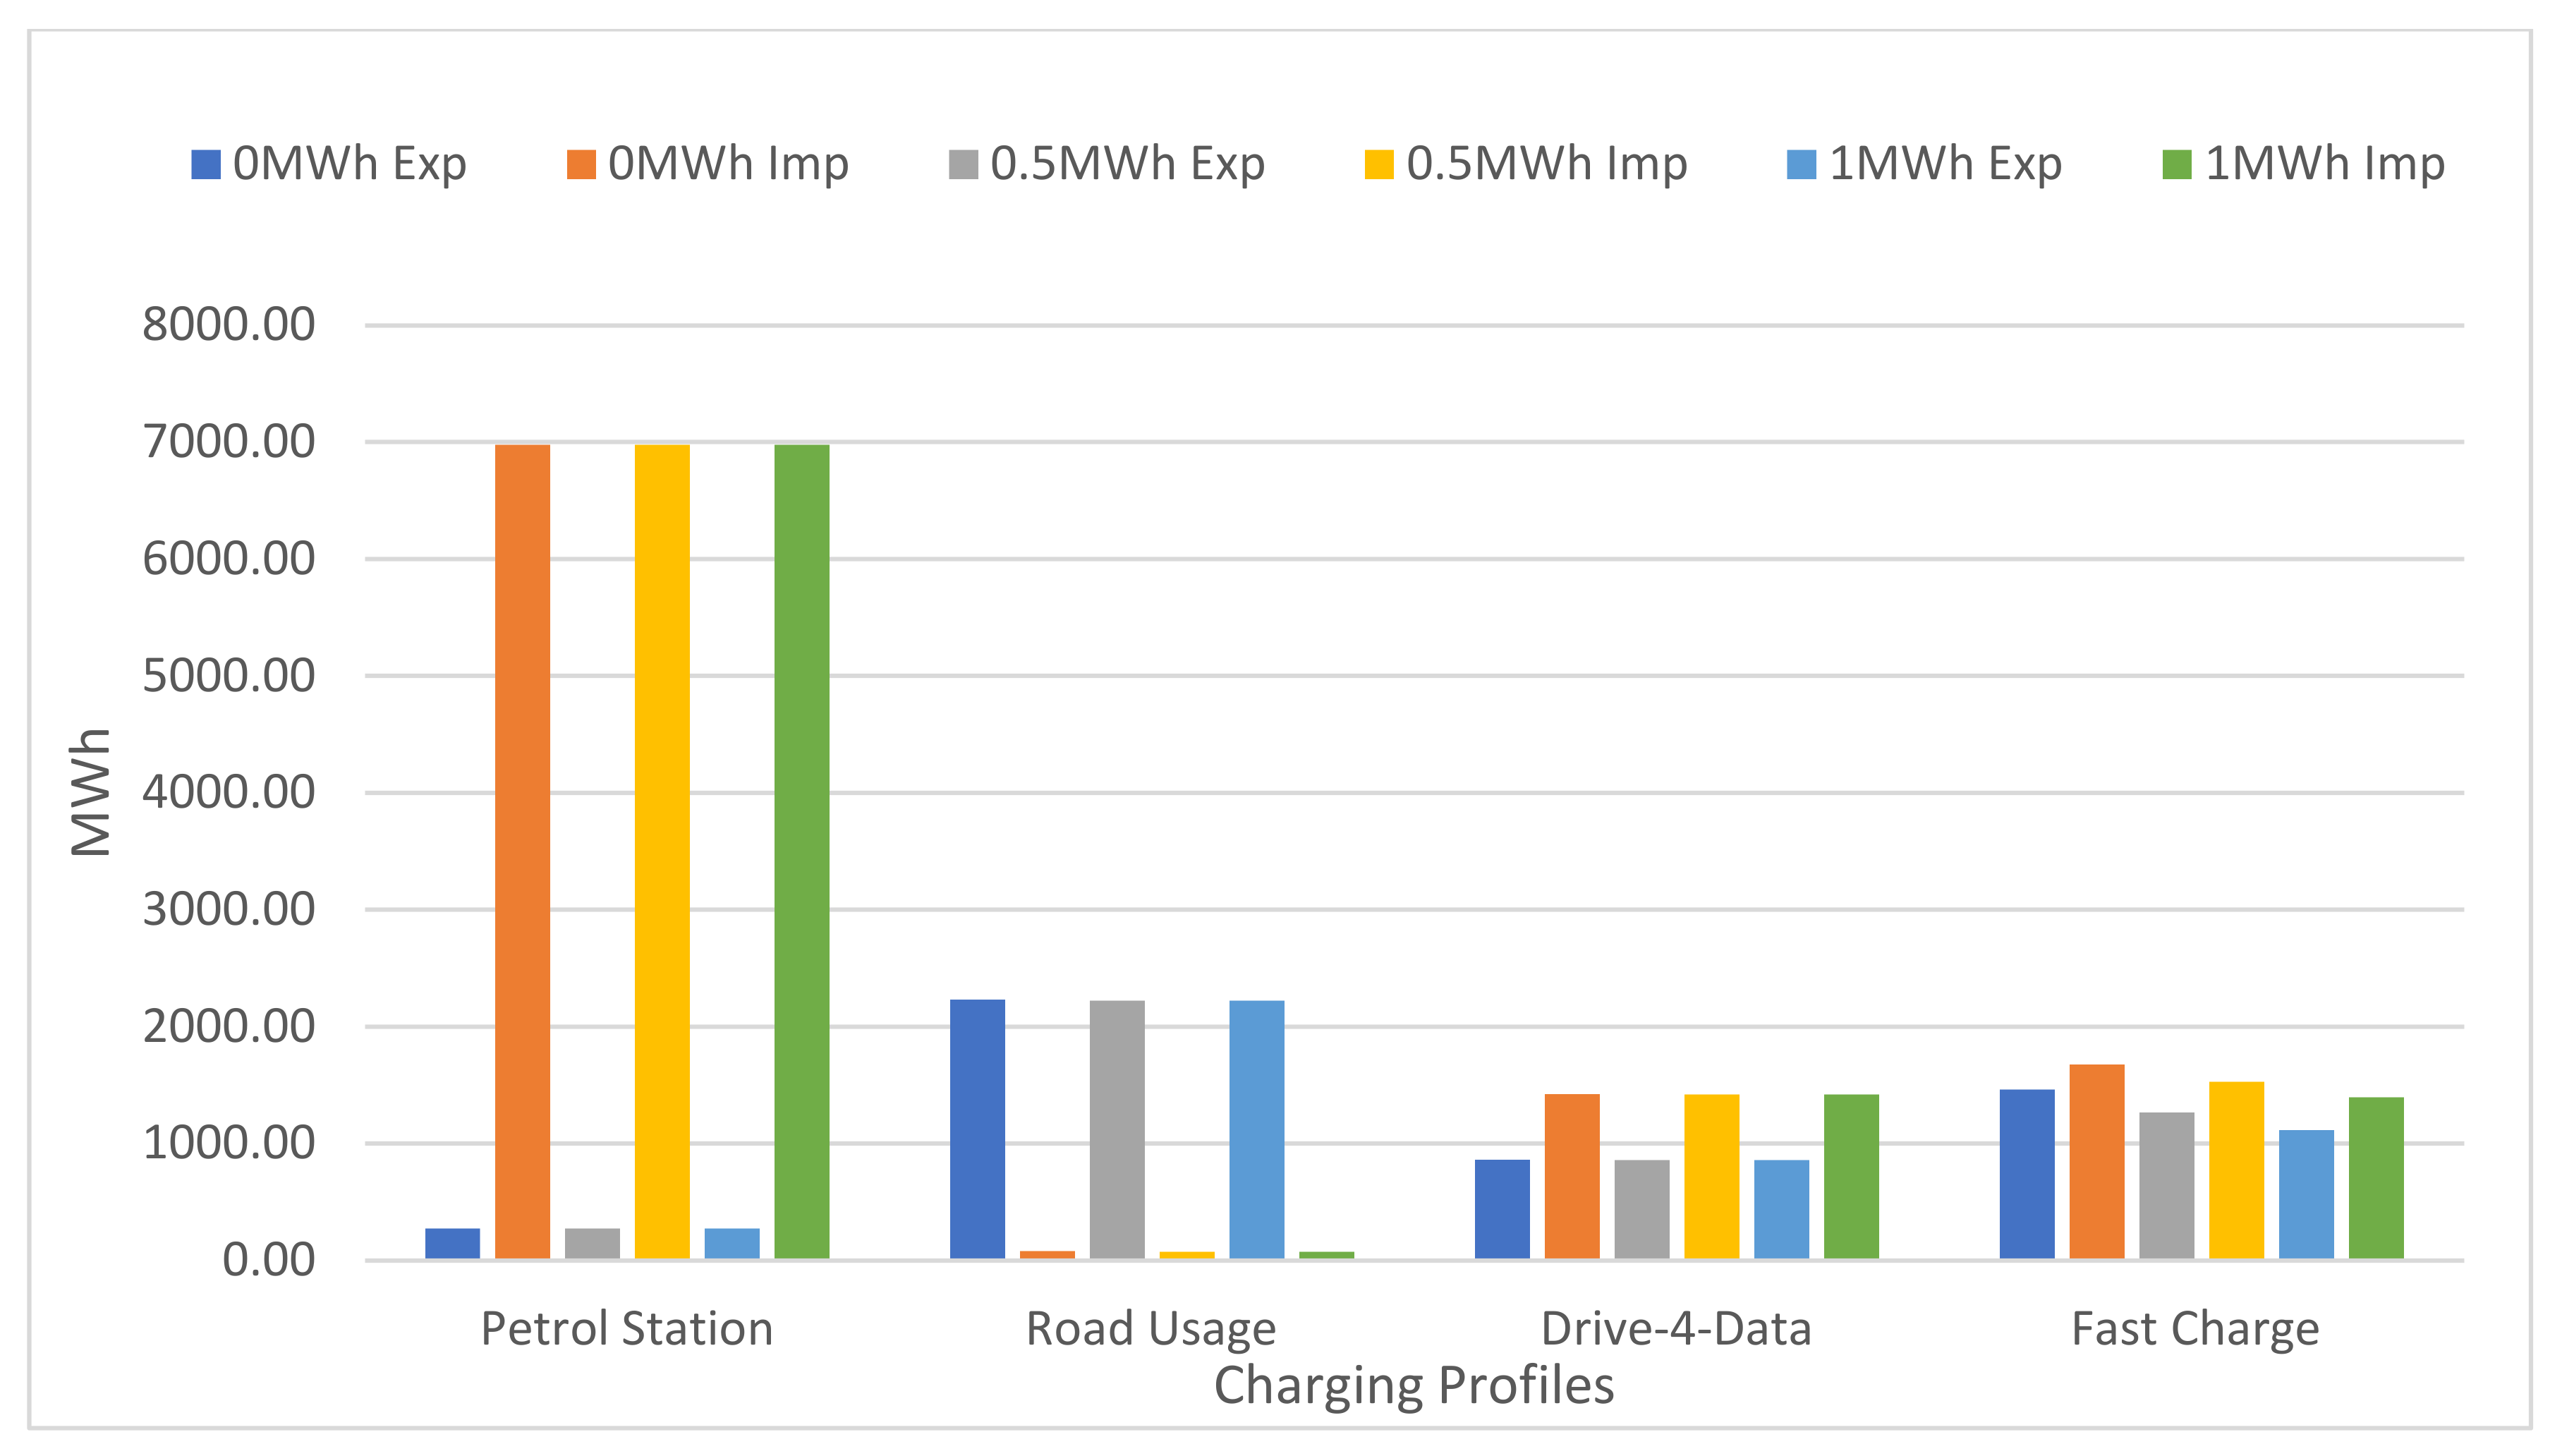
Figure 13b shows that increasing the BESS capacity reduced the quantity of energy imported and exported. This was because the energy that would be exported was stored in the BESS and then used at a later date when production did not meet demand, therefore reducing the energy imports. One can see that on average, however, the introduction of 1 MWh of storage had a small impact, suggesting a greater increase in BESS capacity is needed an increase in the nominal power of the PV array. Overall, the data show that the integration of solar and storage improved the grid independence of the PVEVCS, albeit with a limited effect. This was due to solar power’s dependence on the weather and sun coverage. Therefore, if the EV load profile presented a similar pattern to the PV output, then the integration of solar and storage was an effective method for reducing the EVCS’s dependence on the grid. Dissimilar patterns suggest it will be less effective and that alternative methods should be used to provide a direct power source to the EVCS.
3.4. Further Method Proposed to Improve the Grid-Connected System
Concerning grid independence, based on the results, there are several methods that will improve the grid-connected system’s grid independence and overall performance. Some measures, such as new BESS power management strategies, can better utilize excess electricity to reduce the system’s dependence on the grid.
3.4.1. Increasing the Nominal Power Rating of the PV Array
Figure 5 shows that the PV production did not offset the demand from the EVCS. A method to improve this involves increasing the nominal power of the PV array by installing more modules. If there are site constraints, constructing an additional array to offset the energy imports of the EVCS is effective, or similarly, a sleeved PPA can be employed. Although this does offset more energy, the EVCS still impacts the local grid. Therefore, using modules with higher peak power or bifacial modules may be more effective. Further forecasting would be needed to evaluate its cost-effectiveness factoring capital expenditure and future electricity market prices.
The additional production from the larger array provides another revenue stream and better prepares the EVCS as EV uptake increases. Increasing the capacity is only effective at offsetting the energy imported from the grid. It only reduces the impact during peak grid demand when the load and PV output have a similar pattern. When this is not the case, other methods are necessary.
3.4.2. Increasing the BESS Capacity
In
Figure 11, the success ratio increases with the storage capacity, indicating storage improved the grid independence of the system. The fast-charge charging profile experienced the most improvement, as during the morning, there was low demand, allowing the batteries to charge for later during peak periods. Therefore, it follows that if the storage is increased further, the PVEVCS’s grid independence will also increase. Since the BESS is dependent entirely on the solar output of the array, it also has a limited effect on grid independence during days with low solar irradiation. When considering the other charging profiles such as the petrol station charging profile and Drive-4-Data charging profile, there was no improvement. This indicates that the effectiveness of integrating a solar storage system is heavily dependent on the demand profile of the EVCS.
The fast-charge charging profile had the greatest improvement in its success ratio, indicating that it benefited most from the addition of storage.
Figure 14a,b demonstrates why demand was low during peak power production at 12:00 p.m., enabling it to export and store the excess electricity. As production reduced, the sun dropped, and the demand increased, the stored energy was discharged to meet the demand. At 7:00 p.m., the energy imported matched the load, indicating that the BESS was depleted as there was no power being supplied via the array, and there was no other power source. This and the quantity of exported energy in the morning suggest that increasing the capacity of the BESS would enable the PVEVCS to use that stored electricity past 7:00 p.m., improving its grid independence and reducing its impact on the grid, most significantly during peak grid demand.
Figure 14b also indicates that with an increased capacity, excess electricity can be better utilized during periods of low demand even during the winter, since at 3:00 p.m., energy was still being exported, which could instead be stored within the BESS for later use.
In
Figure 15a,b, the high demand during the morning and late-night hours resulted in the system importing much of its energy throughout the day.
Figure 15a shows that by 5:00 p.m., the stored energy on average had been depleted, and again the system had to import electricity to make up the difference.
Figure 15b illustrates that by 12:00 p.m., the system was importing energy to meet the demand. This suggests increasing the capacity for the Drive-4-Data charging profile will have a negligible effect. Further emphasizing this,
Figure 15a,b shows no change in its performance even with 1 MWh of storage, alluding to other methods being necessary to reduce the EVCS’s dependence on the grid.
3.4.3. Employing Alternative BESS Power Management Methods
Employing alternative BESS power management methods could improve the BESS’s effectiveness. As demonstrated by
Figure 15a,b, when the demand was high and there was little or no PV production, the BESS had little to no chance to charge and store energy. Therefore, by charging the BESS during periods of low demand and low cost and discharging between 8:00 a.m. and 7:00 p.m. at high demand, the impact on the grid was reduced, as the PVEVCS required less or no imported energy to meet demand. The system imports similar quantities of energy during the night as it would during the day, thus minimizing its impact during peak grid demand. It is also in less demand and cheaper, presenting a minimal impact on the grid. Financial forecasting would be necessary to identify whether the cost of implementing the power management method is cheaper than importing the energy during peak grid demand. However, if the goal is to minimize dependence on the grid, then it is effective.
Another method is to use trend-based prediction modeling to predict periods of high demand for the PVEVCS and for the grid to discharge during these periods in order to reduce the cost and grid strain. The limitations here are that a large dataset of real-world usage statistics of the PVEVCS has to be recorded first after construction of the PVEVCS.
3.5. Limitations
The EV penetration rate was calculated assuming an even distribution across the UK. However, this may vary due to the variation of total charging points by region. An improved method would be to estimate the number of EVs using the total number of charging points and their usage. This would improve the accuracy of the charging profiles and, as such, the results of the simulation.
The EV battery capacity is the weighted average of the top three most popular newly licensed vehicles in the UK in 2021. However, since the arrival of new vehicles to the charging station has uncertainties and fluctuations, selecting the battery capacity of a new vehicle arrival randomly from a weighted list of newly licensed EV’s capacities accounts for it.
The SoC of each vehicle was fixed at 20% on arrival and 90% on departure. Having the SoC follow a Gaussian or stochastic distribution would improve the accuracy of the simulation.
The length of stay is currently a function of the battery capacity, SoC, and charger output. Hence, once a car is charged to 90%, another instantly begins charging, which is impossible. By having the time after charging follow either a Gaussian or stochastic distribution limited between two set lengths of time, the accuracy is improved.
Having access to a UK EV driving dataset would allow the PVEVCS to be assessed using data from the actual users of the charging station. It would improve the realism of the simulation relative to EV charging in the UK, thus providing valuable insight.
The current resolution of the simulation is limited to hourly steps. Increasing the resolution to 5-min steps would increase the resolution by a factor of 12 and allow for more detailed daily and hourly analysis. This affords a better understanding of the PVEVCS’s performance seasonally during the morning, afternoon, evening, and night, where the conditions are different.
All four charging profiles are currently averaged over the year to account for seasonal modulation. However, since the production is not, modulating the charging profiles improves the accuracy of the results, as it factors in seasonal variation. Several factors such as driving behaviour, trip count, and distance alter throughout the year, which affects the results.
Previous studies have considered at-home and destination charging in characterizing the demand of an EVCS. This study only accounts for this by using the fast-charge charging profile, while the other three charging profiles only consider a singular location. Selecting or developing further charging profiles that do factor in the multiple modes of charging would increase the accuracy of the simulation.


