The objective of this part is to validate the methods and to sort redundant and discriminant parameters in order to apply as few methods as possible, but also those most adapted to the company’s expertise.
3.2.1. Rheological Analysis
The flow profile of emulsions under stress allows us to see how the product flows when it is spread over the skin [
26].
Figure 2 shows the flow curve of three products, corresponding to the extreme and the middle products for the apparent viscosity at 0.01 s
−1. All of the products exhibit a classical shear thinning behaviour and could therefore be fitted by the Herschel Bulkley model (Equation (1) with σs the yield stress, K the consistency index, and n the behavior index [
25].
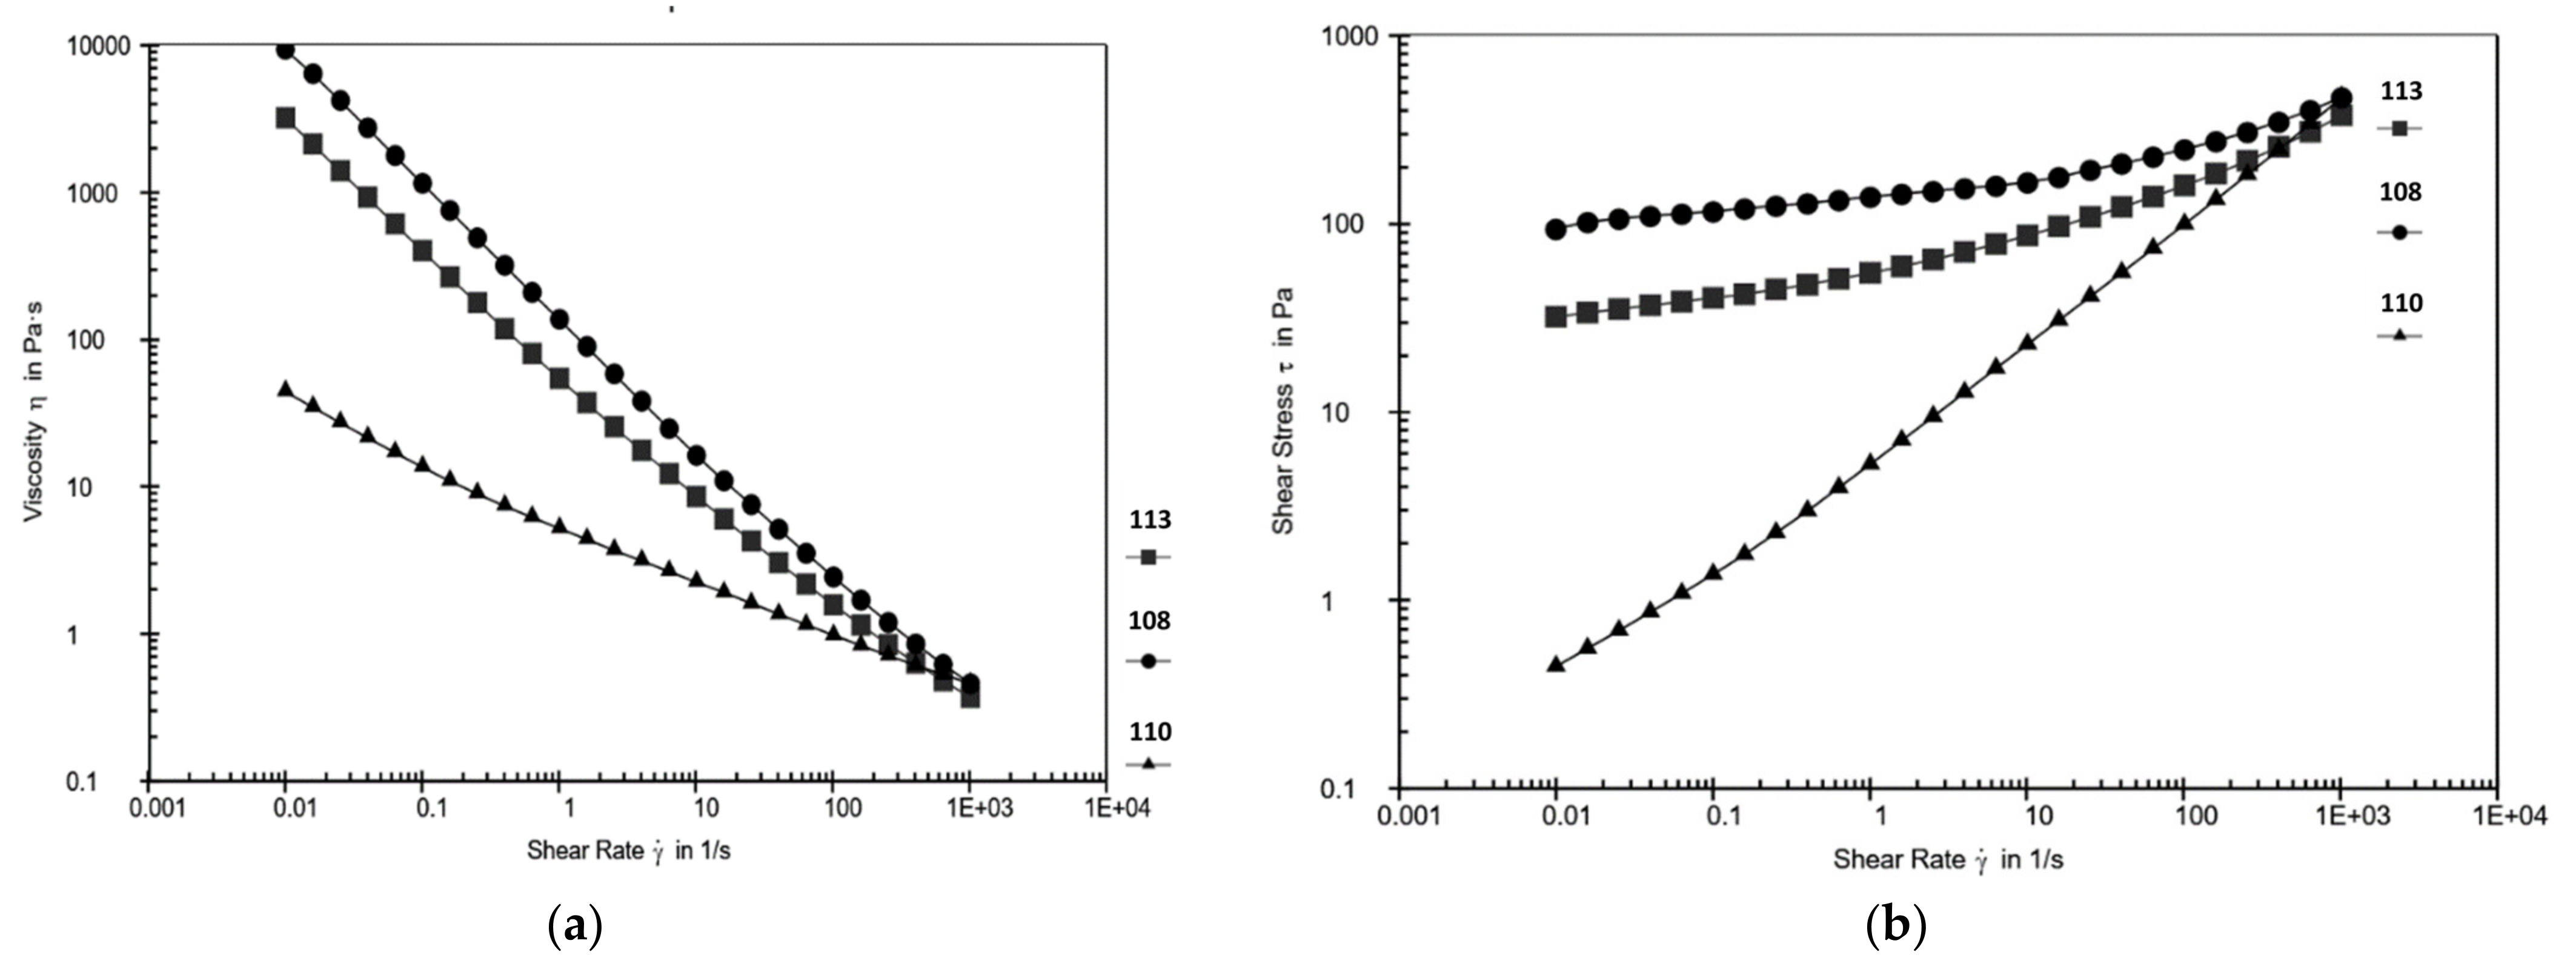
Figure 2.
Viscosity (a) and flow (b) curves of three products representing the extreme 0 (109 and 107) and the middle (103) of measurement.
Figure 2.
Viscosity (a) and flow (b) curves of three products representing the extreme 0 (109 and 107) and the middle (103) of measurement.
Equation (1) Herschel Bulkley model
Each flow curve is perfectly overlapped with the Herschel Bulkley model (not shown in the graph).
The flow behaviour of the 13 emulsions was analysed and the results are presented in
Table 4.
For all the samples, apparent viscosity was between 55 Pa·s and 7349 Pa·s, and most of them had a yield stress. Product 109 is just a shear-thinning product, without yield stress, but the Hershel Bulkley model was performed because of the R2 level. The viscosity index (n) was lower than 1 for all the products, indicating shear-thinning behaviour.
Indeed, the more the shear rate increased, the greater the decrease in viscosity for each emulsion, in accordance with the value of n [
27]. Regarding the yield stress, values ranged from 9.80 Pa for product 105 to 99.12 Pa for product 107. Almost all the products are significantly different, with a
p-value less than 0.05 (
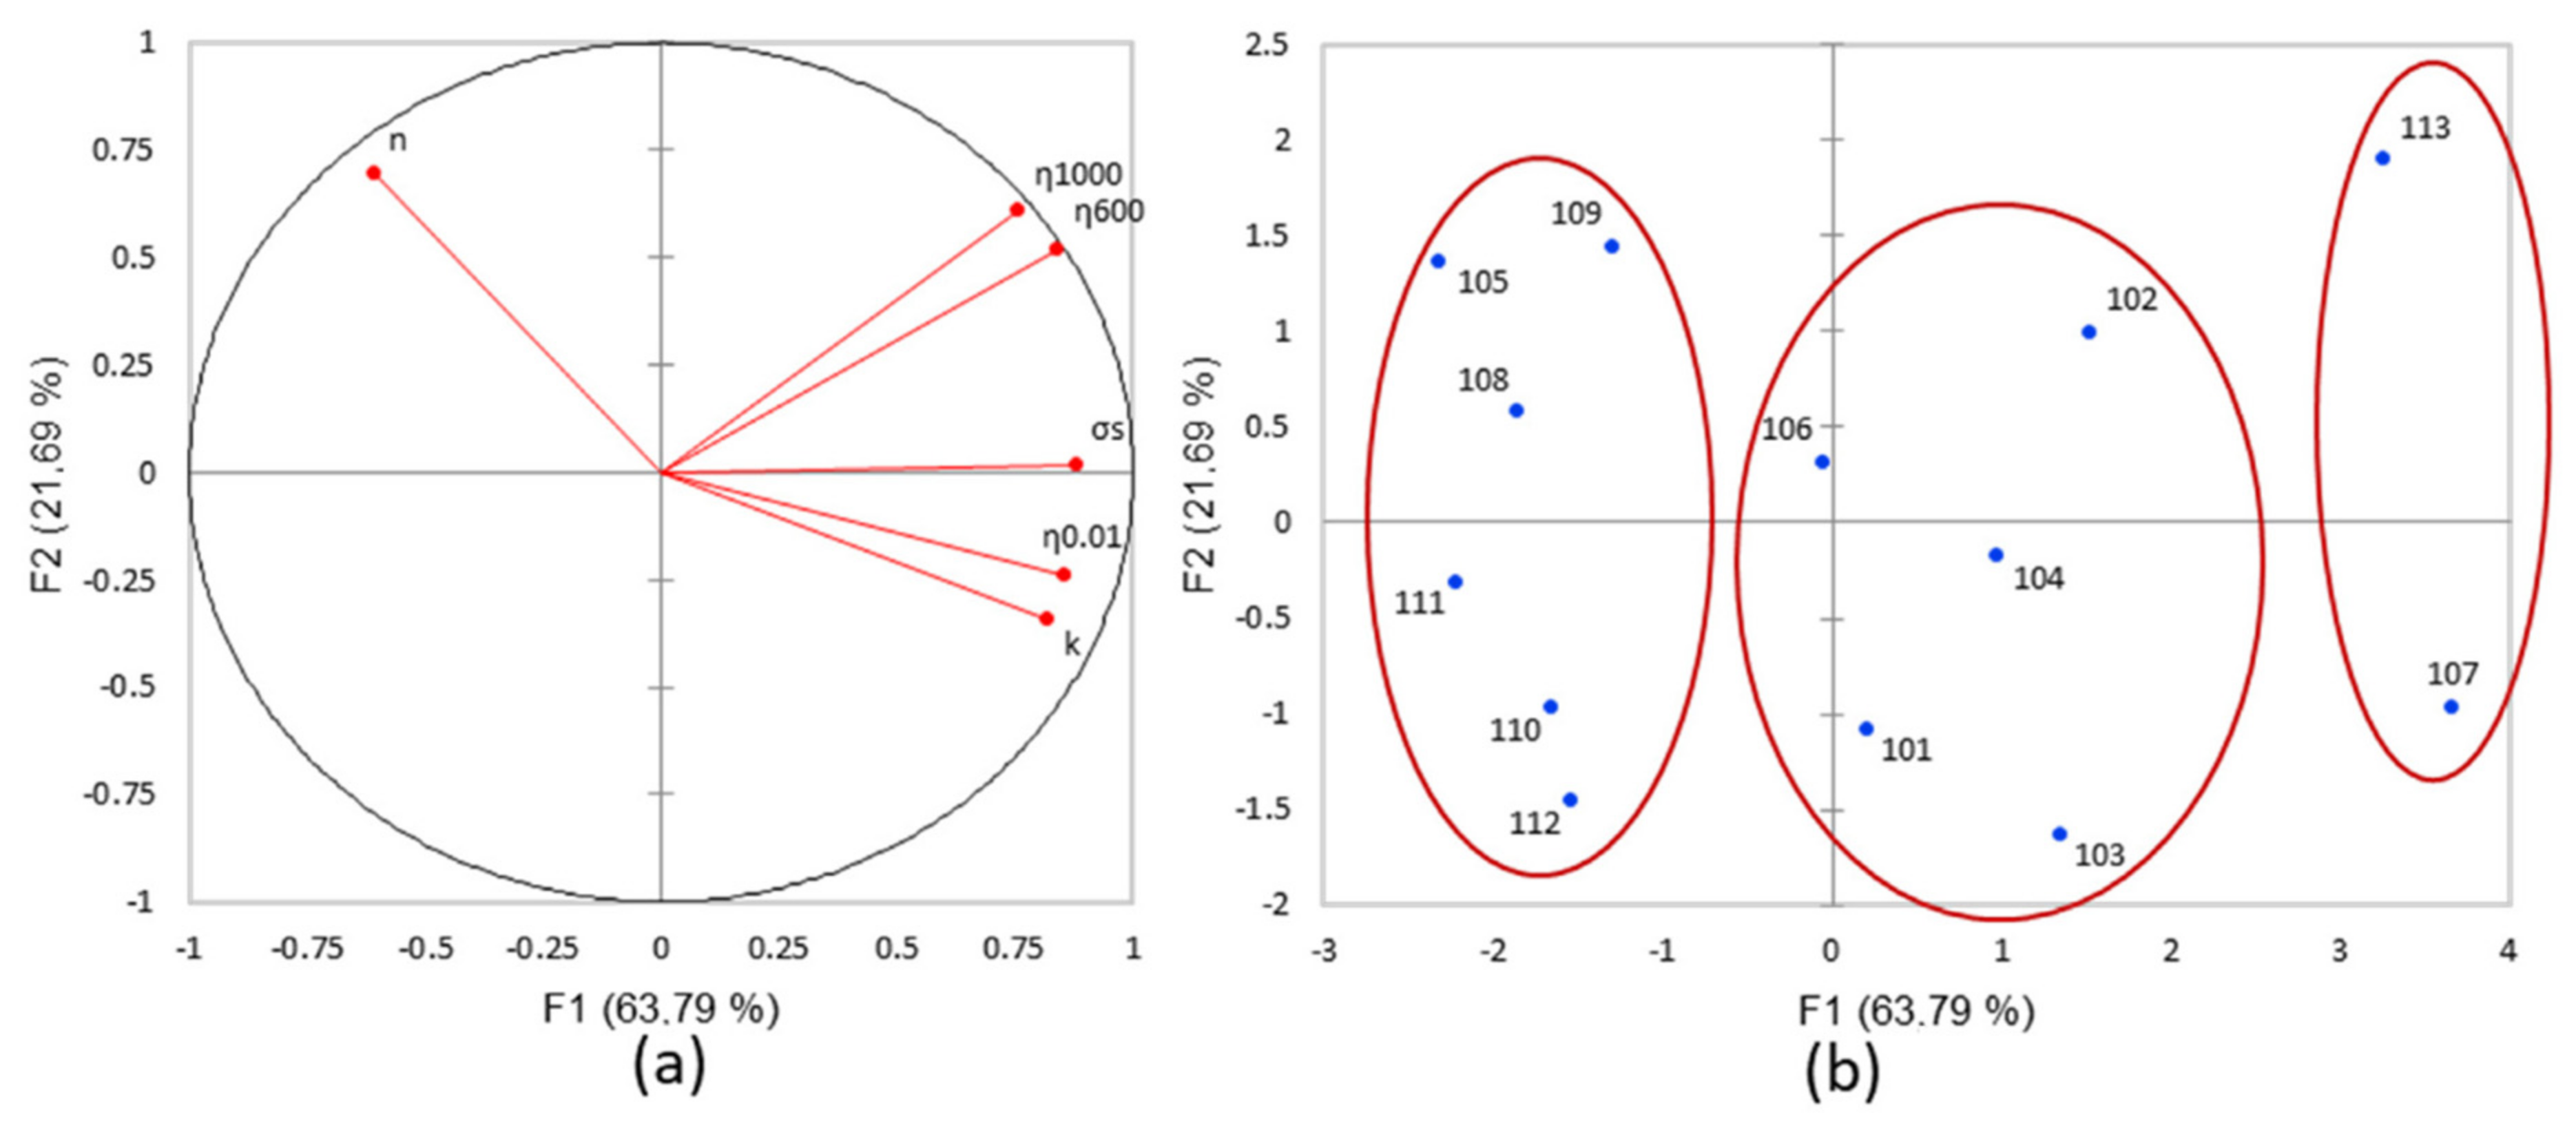
Table 4). A principal component analysis (PCA) was thus carried out on the emulsion dataset, with the 13 products representing individuals and the 6 rheological parameters as variables (
Figure 3). The total variables accounted for 85.48% of the total variance (63.79% and 21.69% respectively).
The loading plot of the rheological parameters and flow properties showed that the vectors of variables were well presented (
Figure 3a). PC1 is positively represented by the apparent viscosity at 0.01 s
−1 and yield stress, while PC2 is positively represented by n and negatively by K. The products in the positive PC1 axis presented high viscosity, while the negative PC1 axis presented the product with a low viscosity (
Figure 3b). Product 103 had the lowest negative value on PC2 due to its weak consistency index. Products 105, 108, 109, 110, 111, and 112 belong to the first cluster, with a lower value of yield stress. The second cluster is comprised of 101, 102, 103, 104, and 106 with intermediate yield stress, while the third cluster is comprised of 107 and 113 with the highest yield stress. These two products showed that viscosity could differ but present a similar yield stress (89 and 99) Pa. The viscosity is the resistance to flow, and the behaviour of the products showed different viscosities caused by the ingredients (nature and concentration) that played a role in the flow [
28]. All of the products were well discriminated with the shear flow test. Finally, the analysis of the data by the PCA makes it possible to validate this method, (
Table 5) and to observe the redundant parameters and to select the most relevant one because all of the square cosines (cos
2) of the parameter are significant. As the parameters η (1000) and η (600) are strongly correlated, and the parameter K is also strongly correlated with η (0.01), one of them can be selected. Each parameter has a projection angle on the two axes of the circle. The value of the cos
2 of the angle makes it possible to know its representativeness; it must at least be greater than the inertia of the axis, and the higher the cos
2, the more relevant it is. Among the six parameters collected in this test and according to the percentage of observation, two of them are not selected, such as η (1000), the value of the cos
2 is greater on the PC1 (0.700 for 63.7%) with a higher percentage than PC2 (0.369 for 21.6%) and K.
Oscillatory strain tests determined the viscoelastic behavior of the samples in the range of non-destructive strain to obtain the linear viscoelastic region (LVR) and the strength of the network of the product [
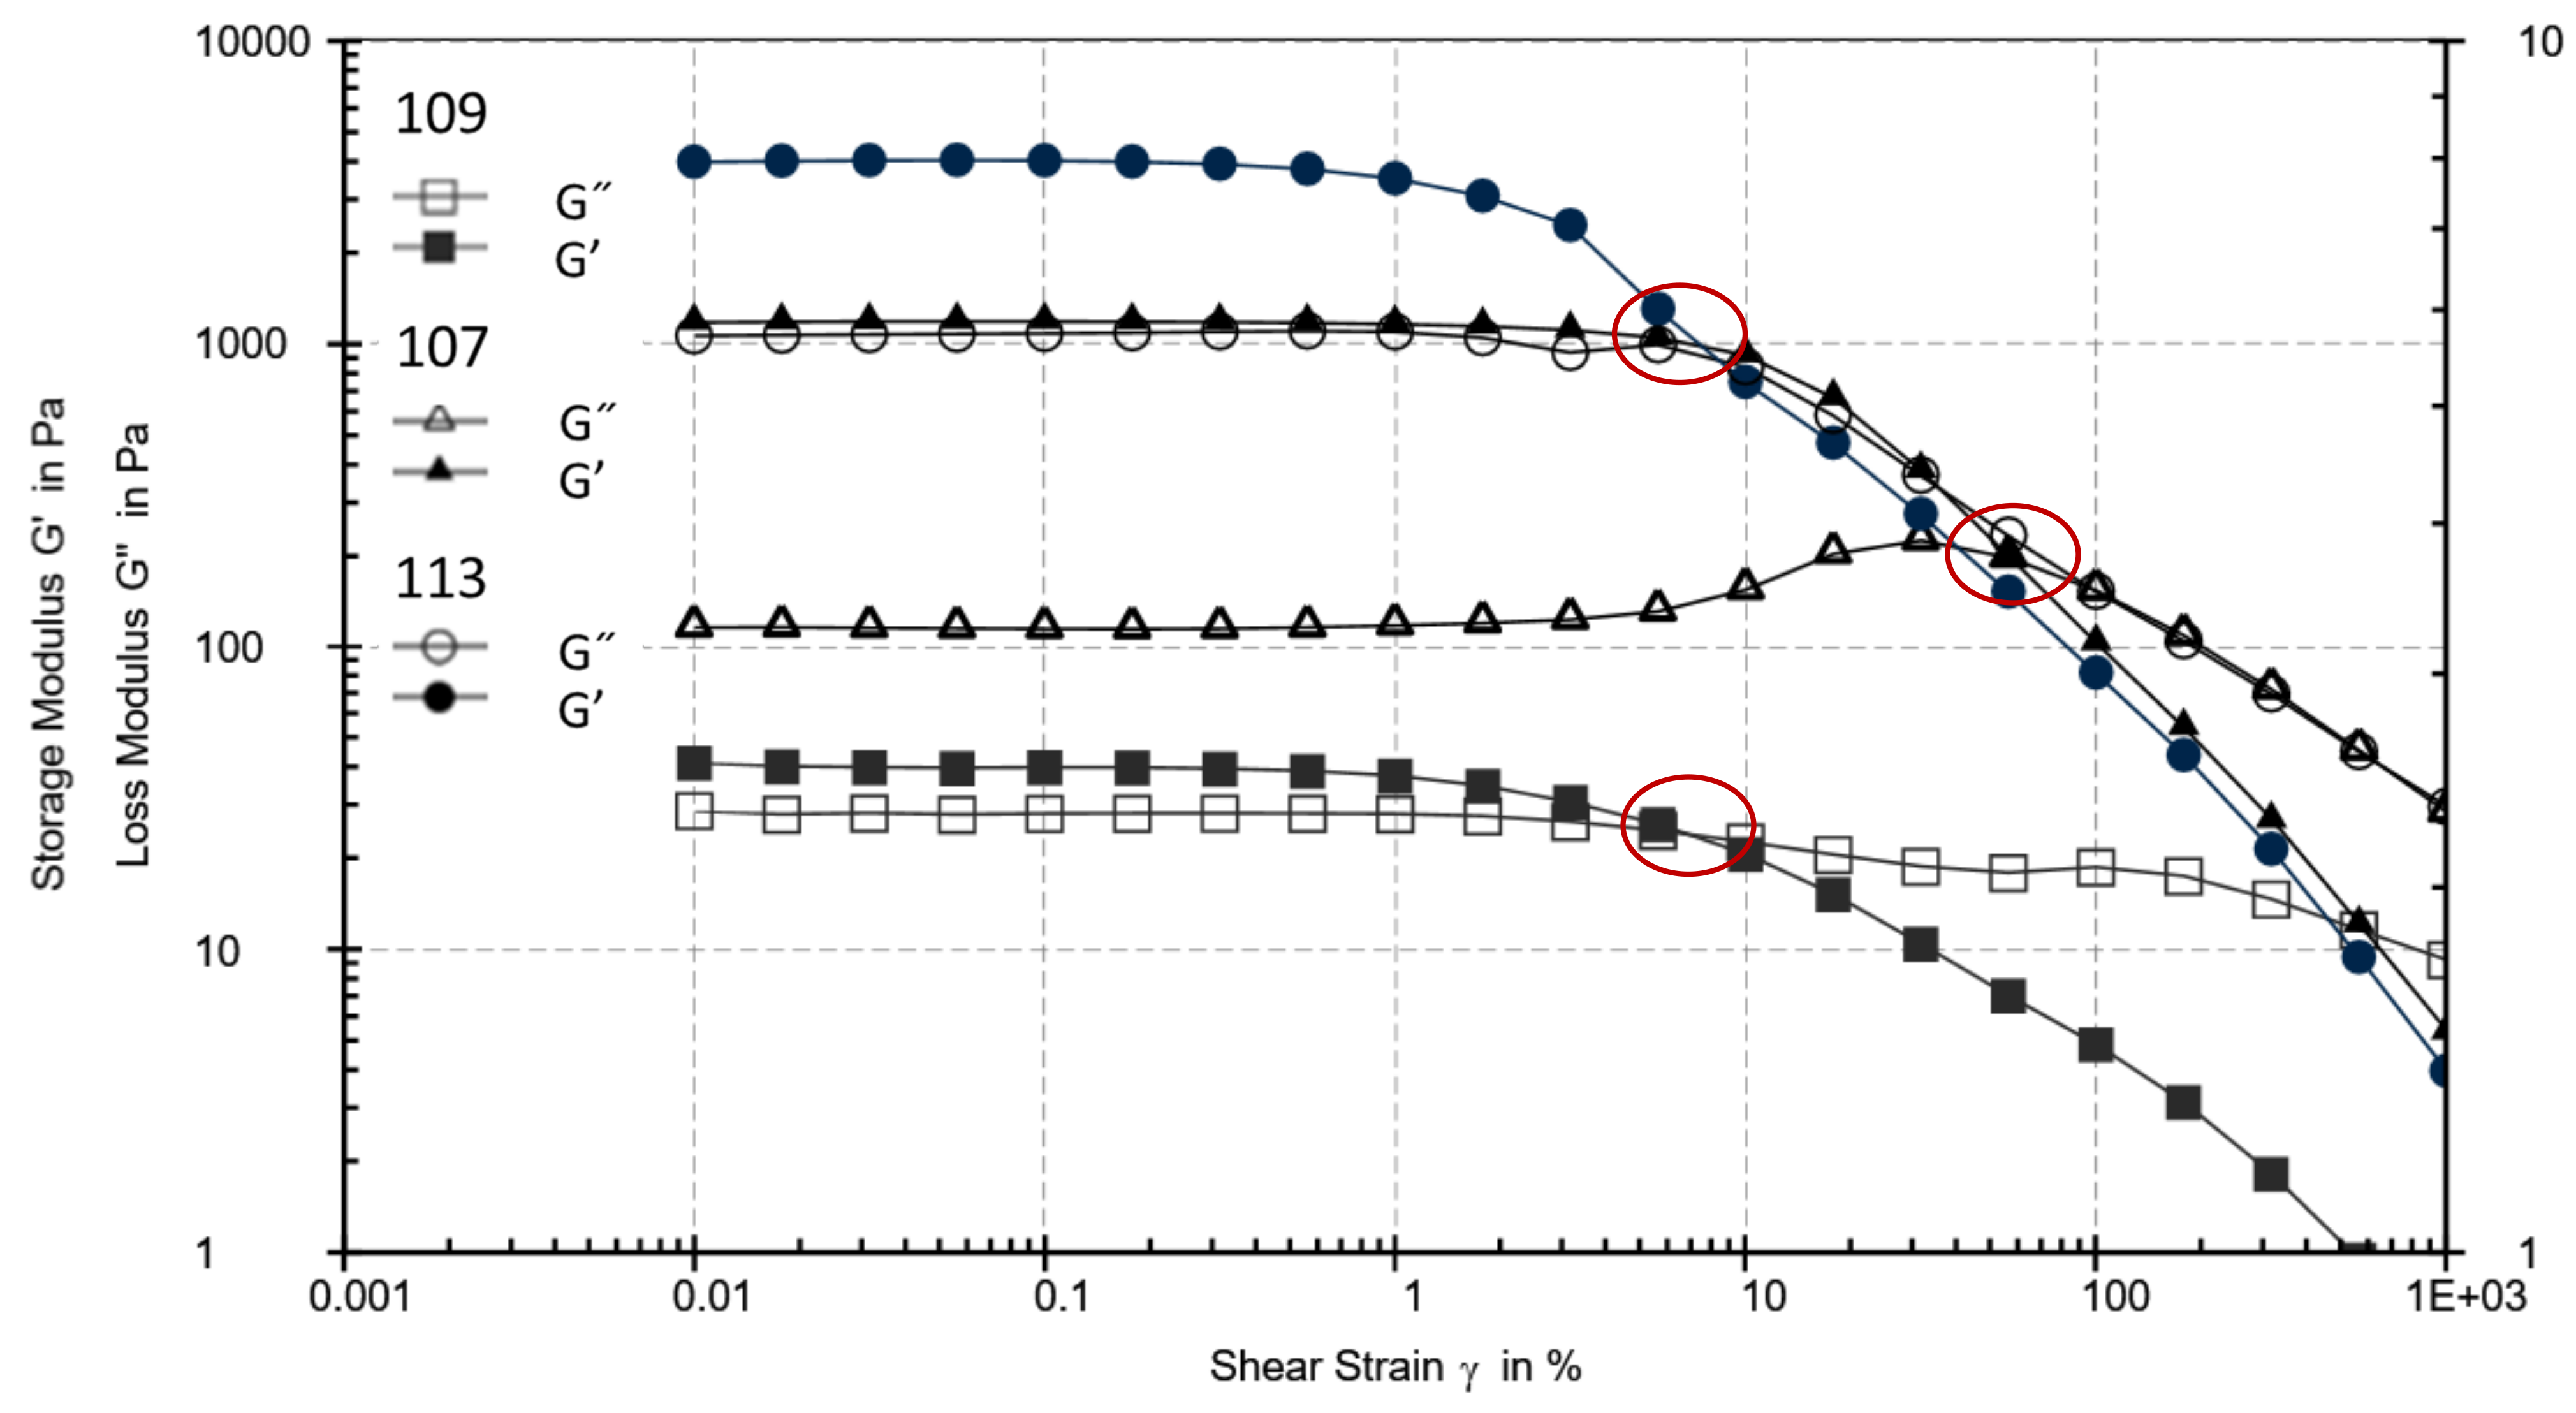
29]. Like the flow test, the curve of the three extreme and middle products are shown in
Figure 4.
Table 6 presents the test results. All the products have a value of G′ > G″ and presented predominant elastic behavior in the LVR.
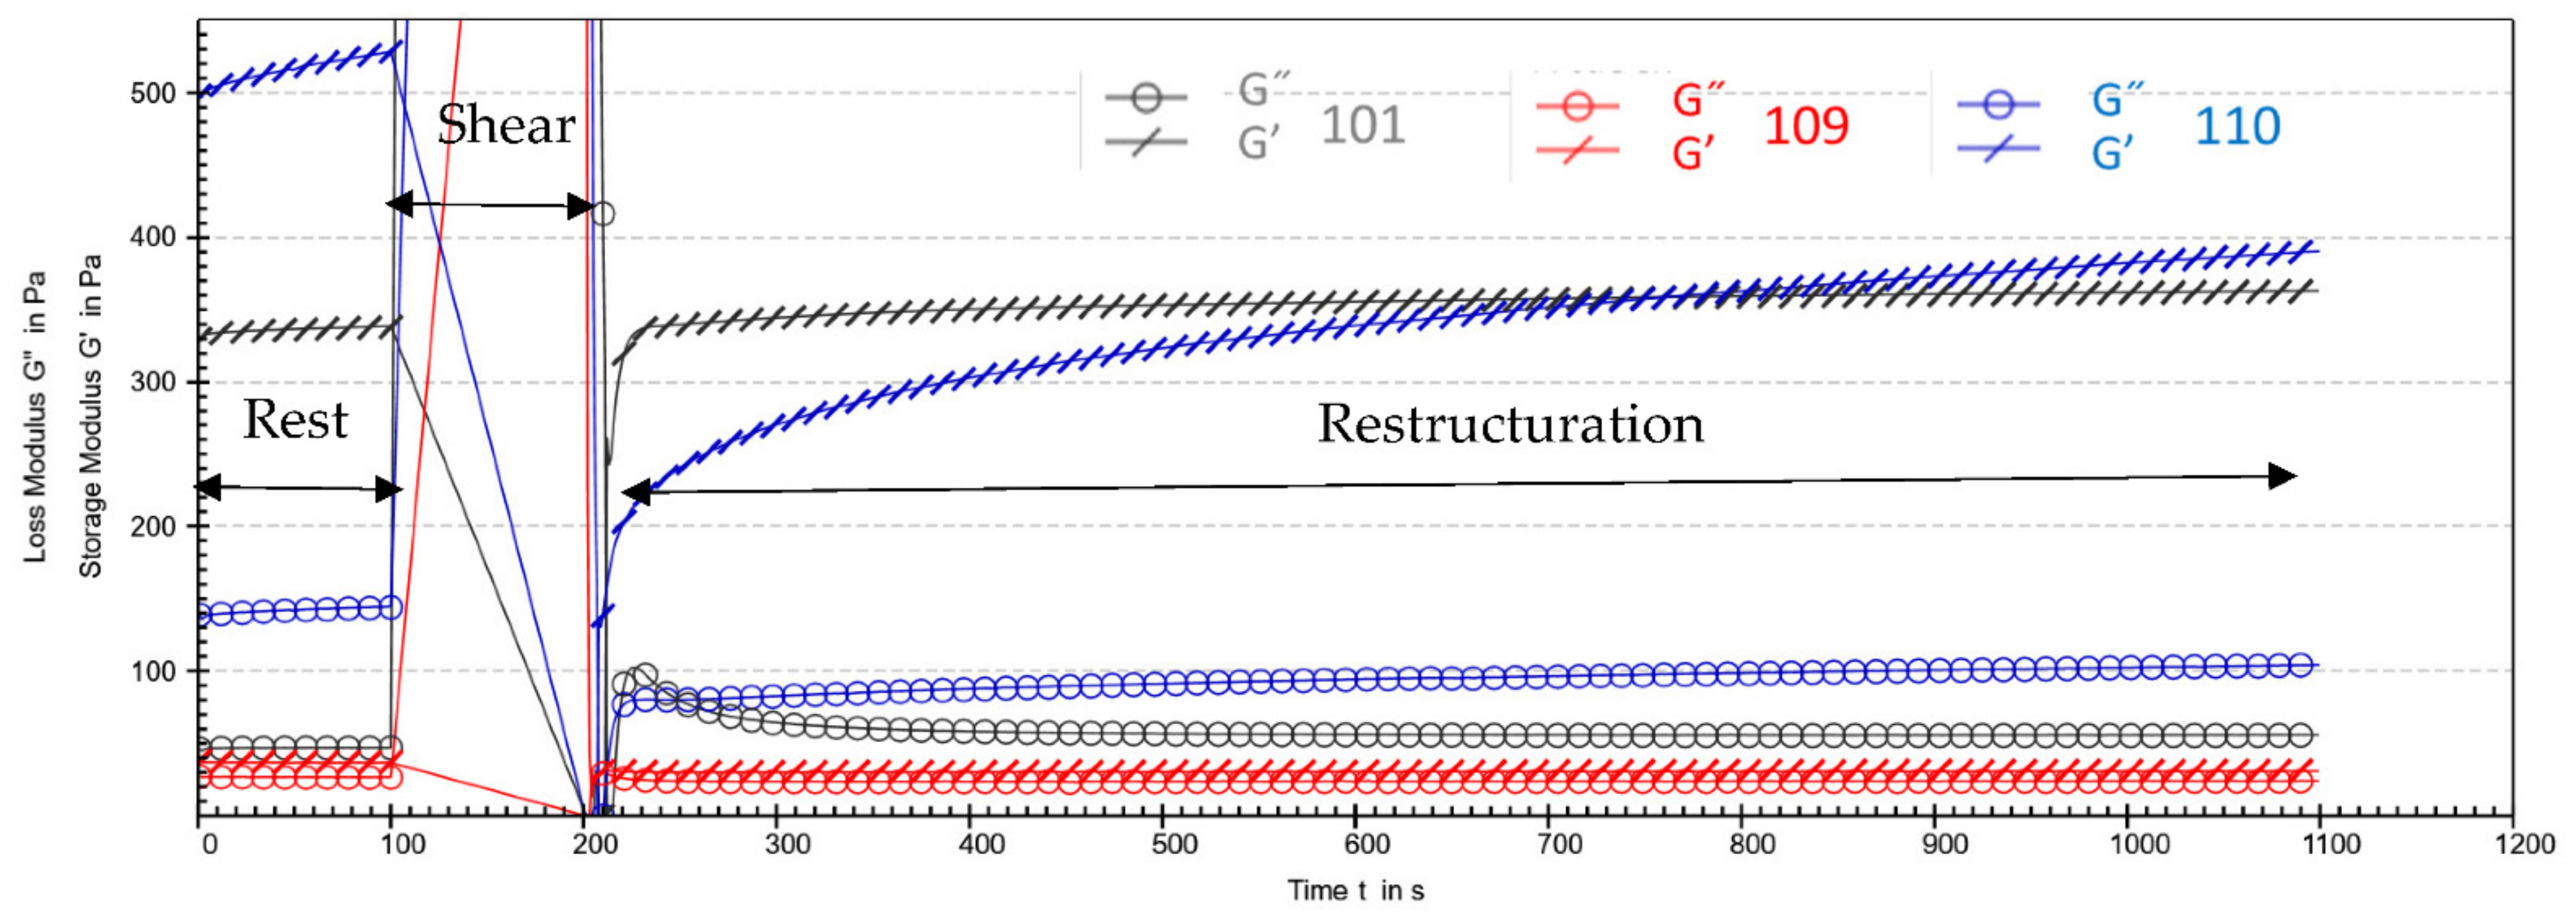
Figure 4.
Viscoelastic characterization of the three extreme products (107, 109 and 113) of the PCA (Figure 6). The crossover of each product is marked by a red circle.
Figure 4.
Viscoelastic characterization of the three extreme products (107, 109 and 113) of the PCA (Figure 6). The crossover of each product is marked by a red circle.
Table 6.
Rheological data (means ± SD) obtained from the strain tests for the 13 emulsions. The value of G′, G″ and tan δ correspond to the linear viscoelastic region (LVR).
Table 6.
Rheological data (means ± SD) obtained from the strain tests for the 13 emulsions. The value of G′, G″ and tan δ correspond to the linear viscoelastic region (LVR).
| Product | G′ (Pa) | G″ (Pa) | tan δ | γDL (%) | σDL (Pa) | σcrossover (Pa) | γcrossover (%) |
|---|
| 101 | 331.51 ± 1.71 h | 46.85 ± 0.38 ij | 0.142 ± 0.000 k | 3.235 ± 0.005 c | 9.834 ± 0.033 g | 65.47 ± 0.03 g | 82.49 ± 0.61 b |
| 102 | 4148.25 ± 35.65 a | 1090.05 ± 13.55 a | 0.263 ± 0.001 f | 0.554 ± 0.003 i | 22.680 ± 0.008 b | 93.99 ± 0.19 d | 51.99 ± 0.14 e |
| 103 | 336.57 ± 0.29 h | 43.91 ± 0.03 jk | 0.130 ± 0.000 l | 4.235 ± 0.055 a | 14.031 ± 0.192 d | 77.14 ± 0.03 f | 67.04 ± 0.11 c |
| 104 | 345.12 ± 4.64 h | 64.56 ± 0.54 i | 0.187 ± 0.001 j | 3.910 ± 0.030 b | 12.547 ± 0.273 e | 103.20 ± 2.40 c | 111.71 ± 1.79 a |
| 105 | 3111.90 ± 12.40 b | 873.48 ± 0.2 b | 0.281 ± 0.001 c | 0.069 ± 0.021 k | 1.991 ± 0.552 j | 84.78 ± 9.69 e | 42.29 ± 7.49 f |
| 106 | 2111.25 ± 25.55 c | 481.78 ± 2.89 d | 0.229 ± 0.001 i | 0.818 ± 0.054 h | 16.724 ± 0.832 c | 77.34 ± 1.02 f | 32.35 ± 1.01 g |
| 107 | 1179.00 ± 10.00 e | 114.44 ± 1.31 h | 0.097 ± 0.000 m | 2.890 ± 0.040 d | 32.190 ± 0.072 a | 159.00 ± 0.30 a | 58.18 ± 1.30 d |
| 108 | 3078.90 ± 84.70 b | 738.19 ± 16.22 c | 0.240 ± 0.001 h | 0.440 ± 0.006 j | 12.925 ± 0.144 e | 57.03 ± 0.08 h | 33.33 ± 0.70 g |
| 109 | 39.65 ± 0.02 i | 27.79 ± 0.11 k | 0.701 ± 0.002 a | 1.615 ± 0.025 e | 0.721 ± 0.011 k | 2.38 ± 0.05 k | 7.05 ± 0.21 h |
| 110 | 676.67 ± 8.48 g | 186.21 ± 4.58 g | 0.275 ± 0.003 d | 1.280 ± 0.000 f | 7.600 ± 0.151 i | 33.34 ± 0.71 j | 43.42 ± 0.96 f |
| 111 | 1384.55 ± 22.15 d | 349.62 ± 7.77 f | 0.253 ± 0.001 g | 0.854 ± 0.007 h | 10.826 ± 0.105 f | 50.44 ± 0.09 i | 34.24 ± 0.95 g |
| 112 | 976.50 ± 17.53 f | 436.96 ± 9.17 e | 0.448 ± 0.001 b | 0.951 ± 0.006 g | 8.890 ± 0.246 h | 63.16 ± 0.61 g | 42.54 ± 1.95 f |
| 113 | 4151.50 ± 119.00 a | 1106.90 ± 29.40 a | 0.267 ± 0.000 e | 0.814 ± 0.010 h | 31.515 ± 1.224 a | 112.65 ± 6.55 b | 8.95 ± 0.53 h |
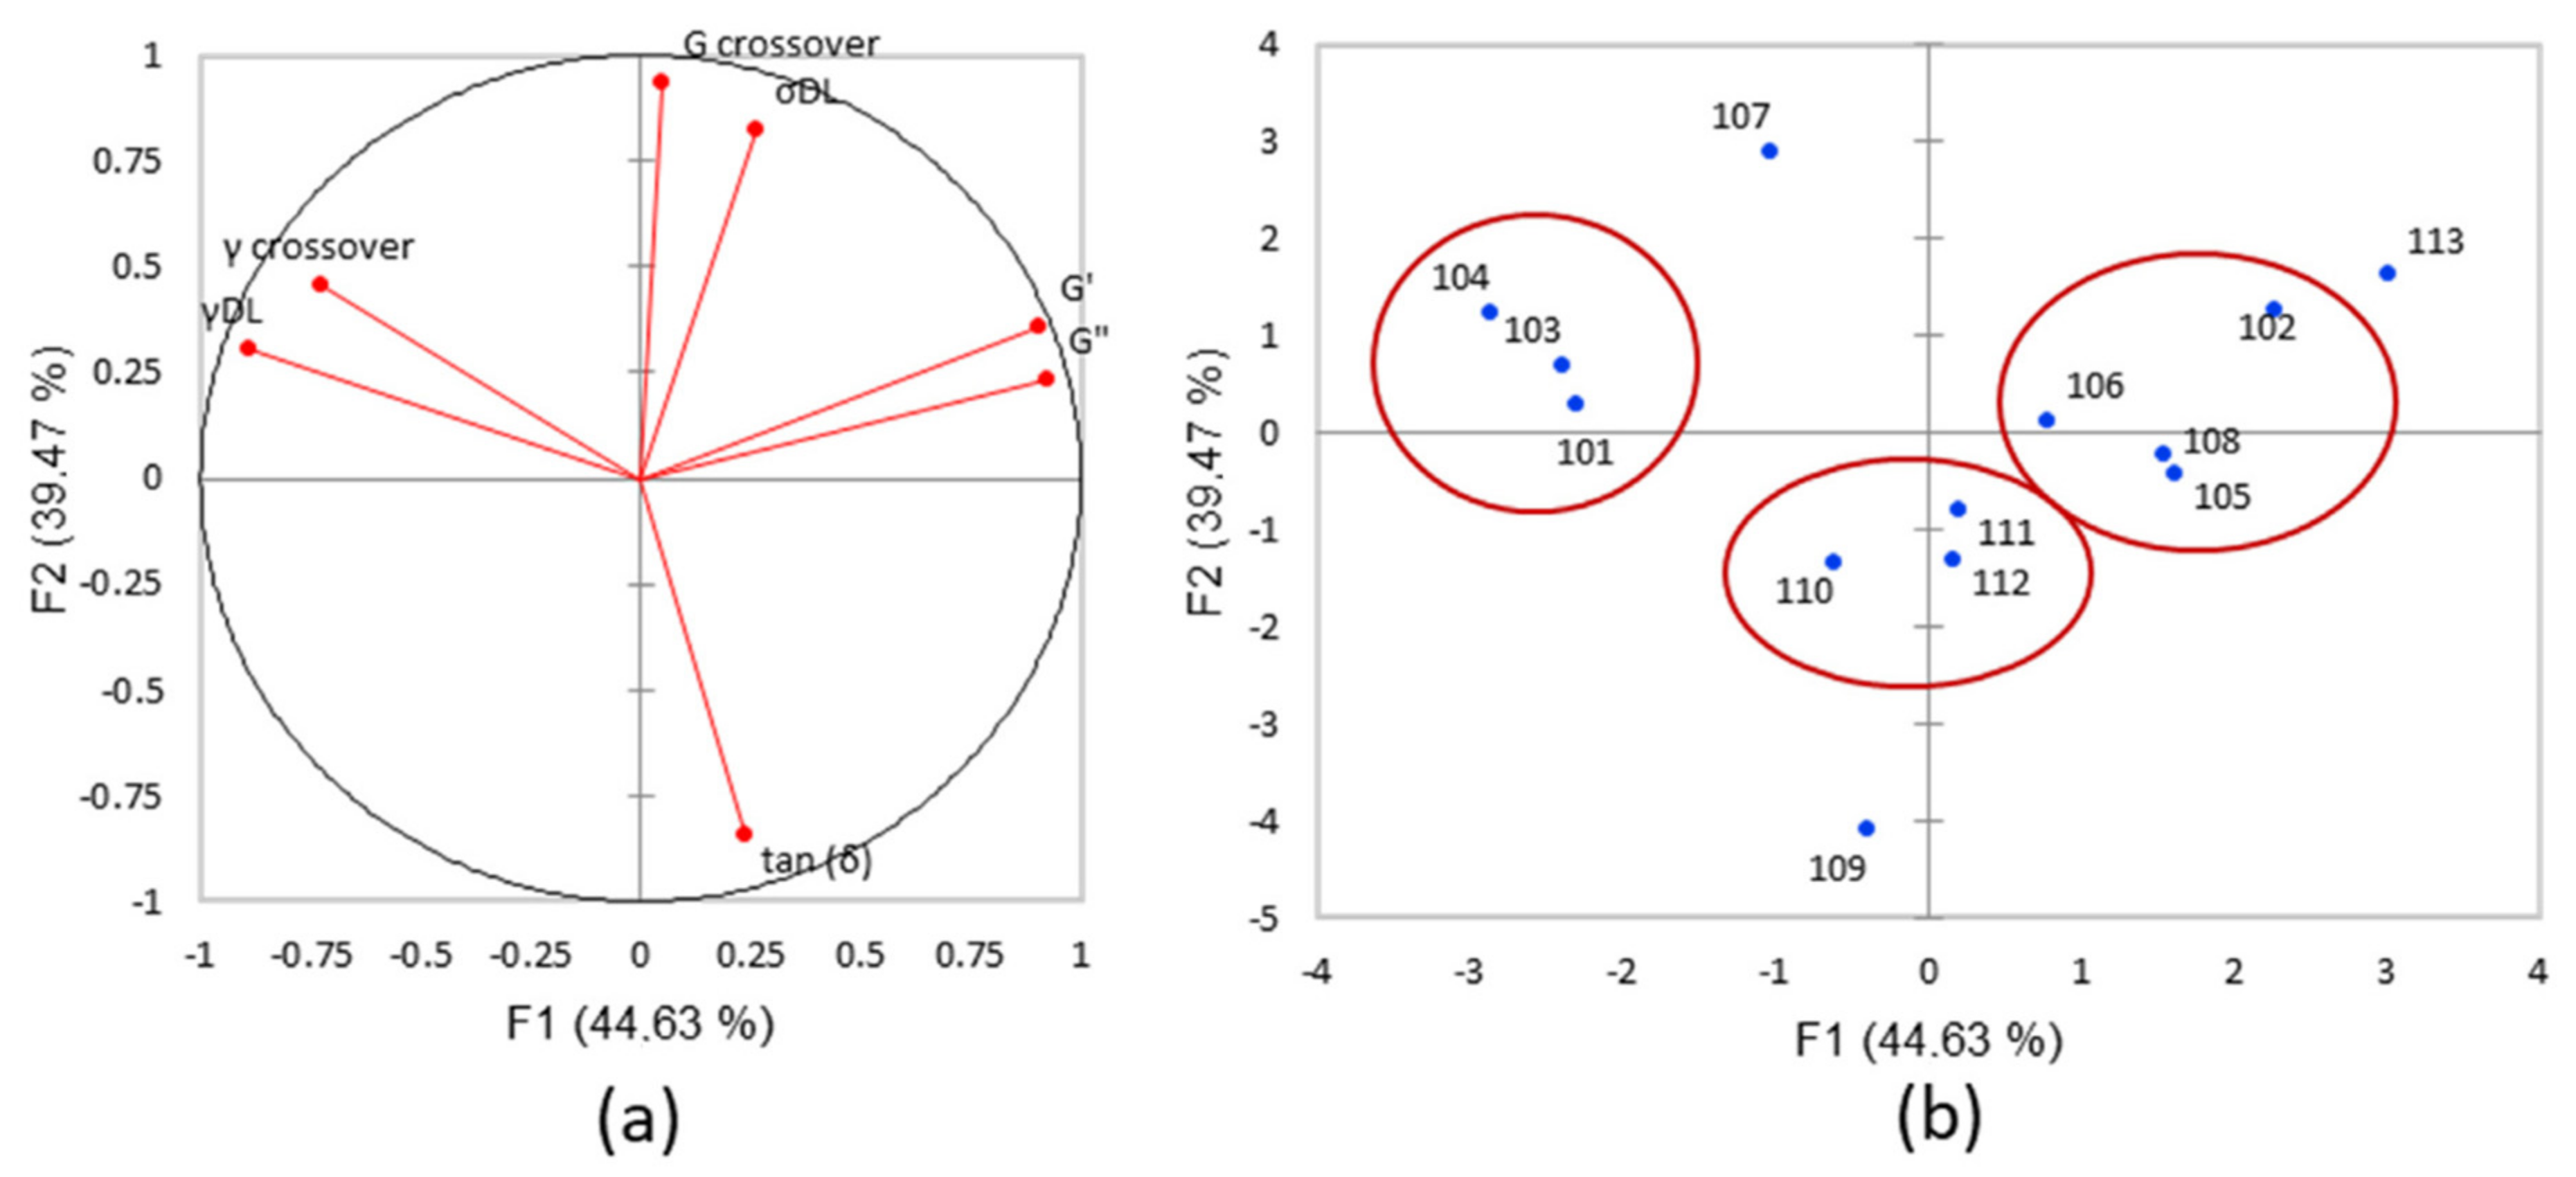
The ANOVA test showed that most products are significantly different (
p < 0.05). A PCA was carried out on the data with the 13 products as individuals and the seven rheological parameters as variables (
Figure 5). The total variables account for 84.1% of total variance (44.63% and 39.47% respectively). The loading plot of the rheological parameters shows that the vectors of variables are well presented (
Figure 5a). PC1 is positively related to G′, G″, and negatively related to the percentage of strain (γ
DL), while PC2 is positively related to stress (σ
crossover and σ
DL) and negatively related to tan δ.
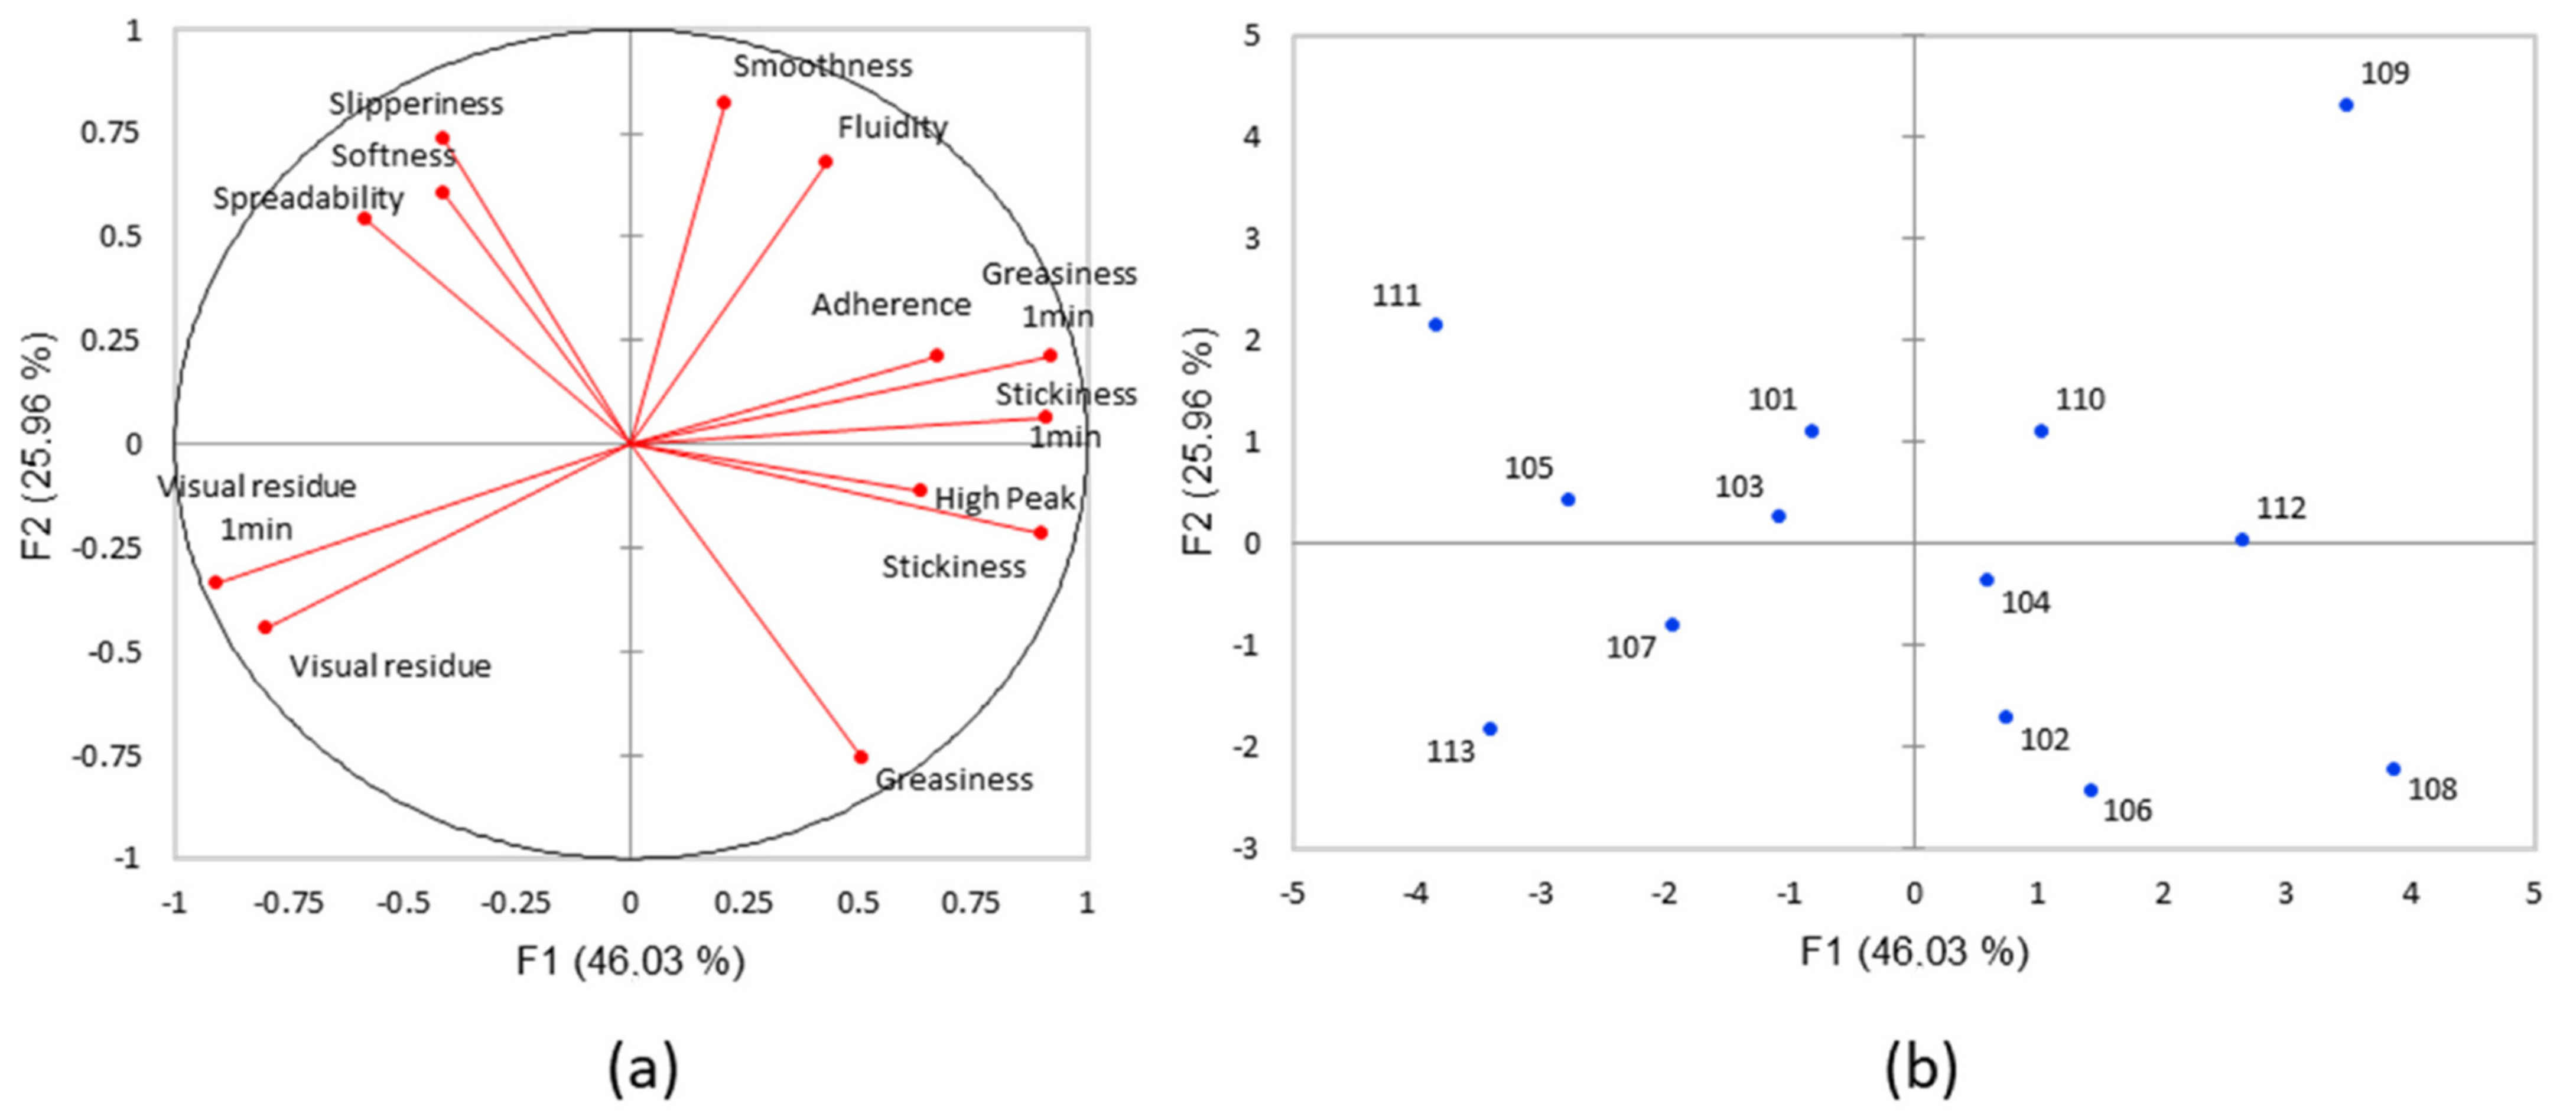
The scatter plot (
Figure 5b) shows three extreme products: 109 has the lowest values of G′ (39.65 Pa) and G″ (27.79 Pa) and tan δ is very high (0.701), 107 has the lowest value of tan δ (0.097) and the highest value of σ
crossover (159 Pa), corresponding to the least liquid product, and 113 has the highest value of G′ (4151 Pa) and a high value of σ
crossover (112.6), corresponding to a stiff and strong product [
30]. The products 102, 105, 106, and 108 made up the first cluster, representing a low value of tan δ (around 0.2) and high viscosity (2111 to 4148 Pa). The products 110, 111 and 112 comprise the second cluster, with a low G′ and G″, corresponding to the softest structure of the products. The products 101, 103, 104 comprise the last cluster, represented by a very low tan δ (0.097 to 0.180) and low viscosity (330 to 1179 Pa). Moreover, all the products had a value of tan δ < 1, specific to viscoelastic, solid-like emulsions [
27]. The module G′ is strongly correlated to G″, γ
crossover with γ
DL and σ
DL with σ
crossover. According to the values of cos
2 of this test (
Table 7), the sorting data didn’t select σ
DL, γ
crossover. On the other side, G″ is not selected because the study concerns solid viscoelastic and presented a value of G′ > G″.
Mixing oscillatory and flow test. The product analysis was carried out in greater depth by measuring the percentage of restructuring after a shear. To begin with, the viscoelasticity of the product was measured at rest (G′ and G″) for 100 s at 0.01 s
−1, and then at a shear rate of 100 s
−1 for 100 s and at 0.01 s
−1 for 900 s.
Figure 6 shows a representation of the test of the two extreme products (101 and 109) and the intermediate product (110) for the restructuring. This measure mimics the spreading of the cream on the hand. The percentage of restructuring after shearing was measured at many different times: 10 s, 30 s, 60 s, 120 s and 800 s. These different measures allowed to study the capacity of the restructuring of the product with time and corelated with the different stages of sensory assessment. The results are presented in
Table 8.
The ANOVA test shows that almost all the products are significantly different (
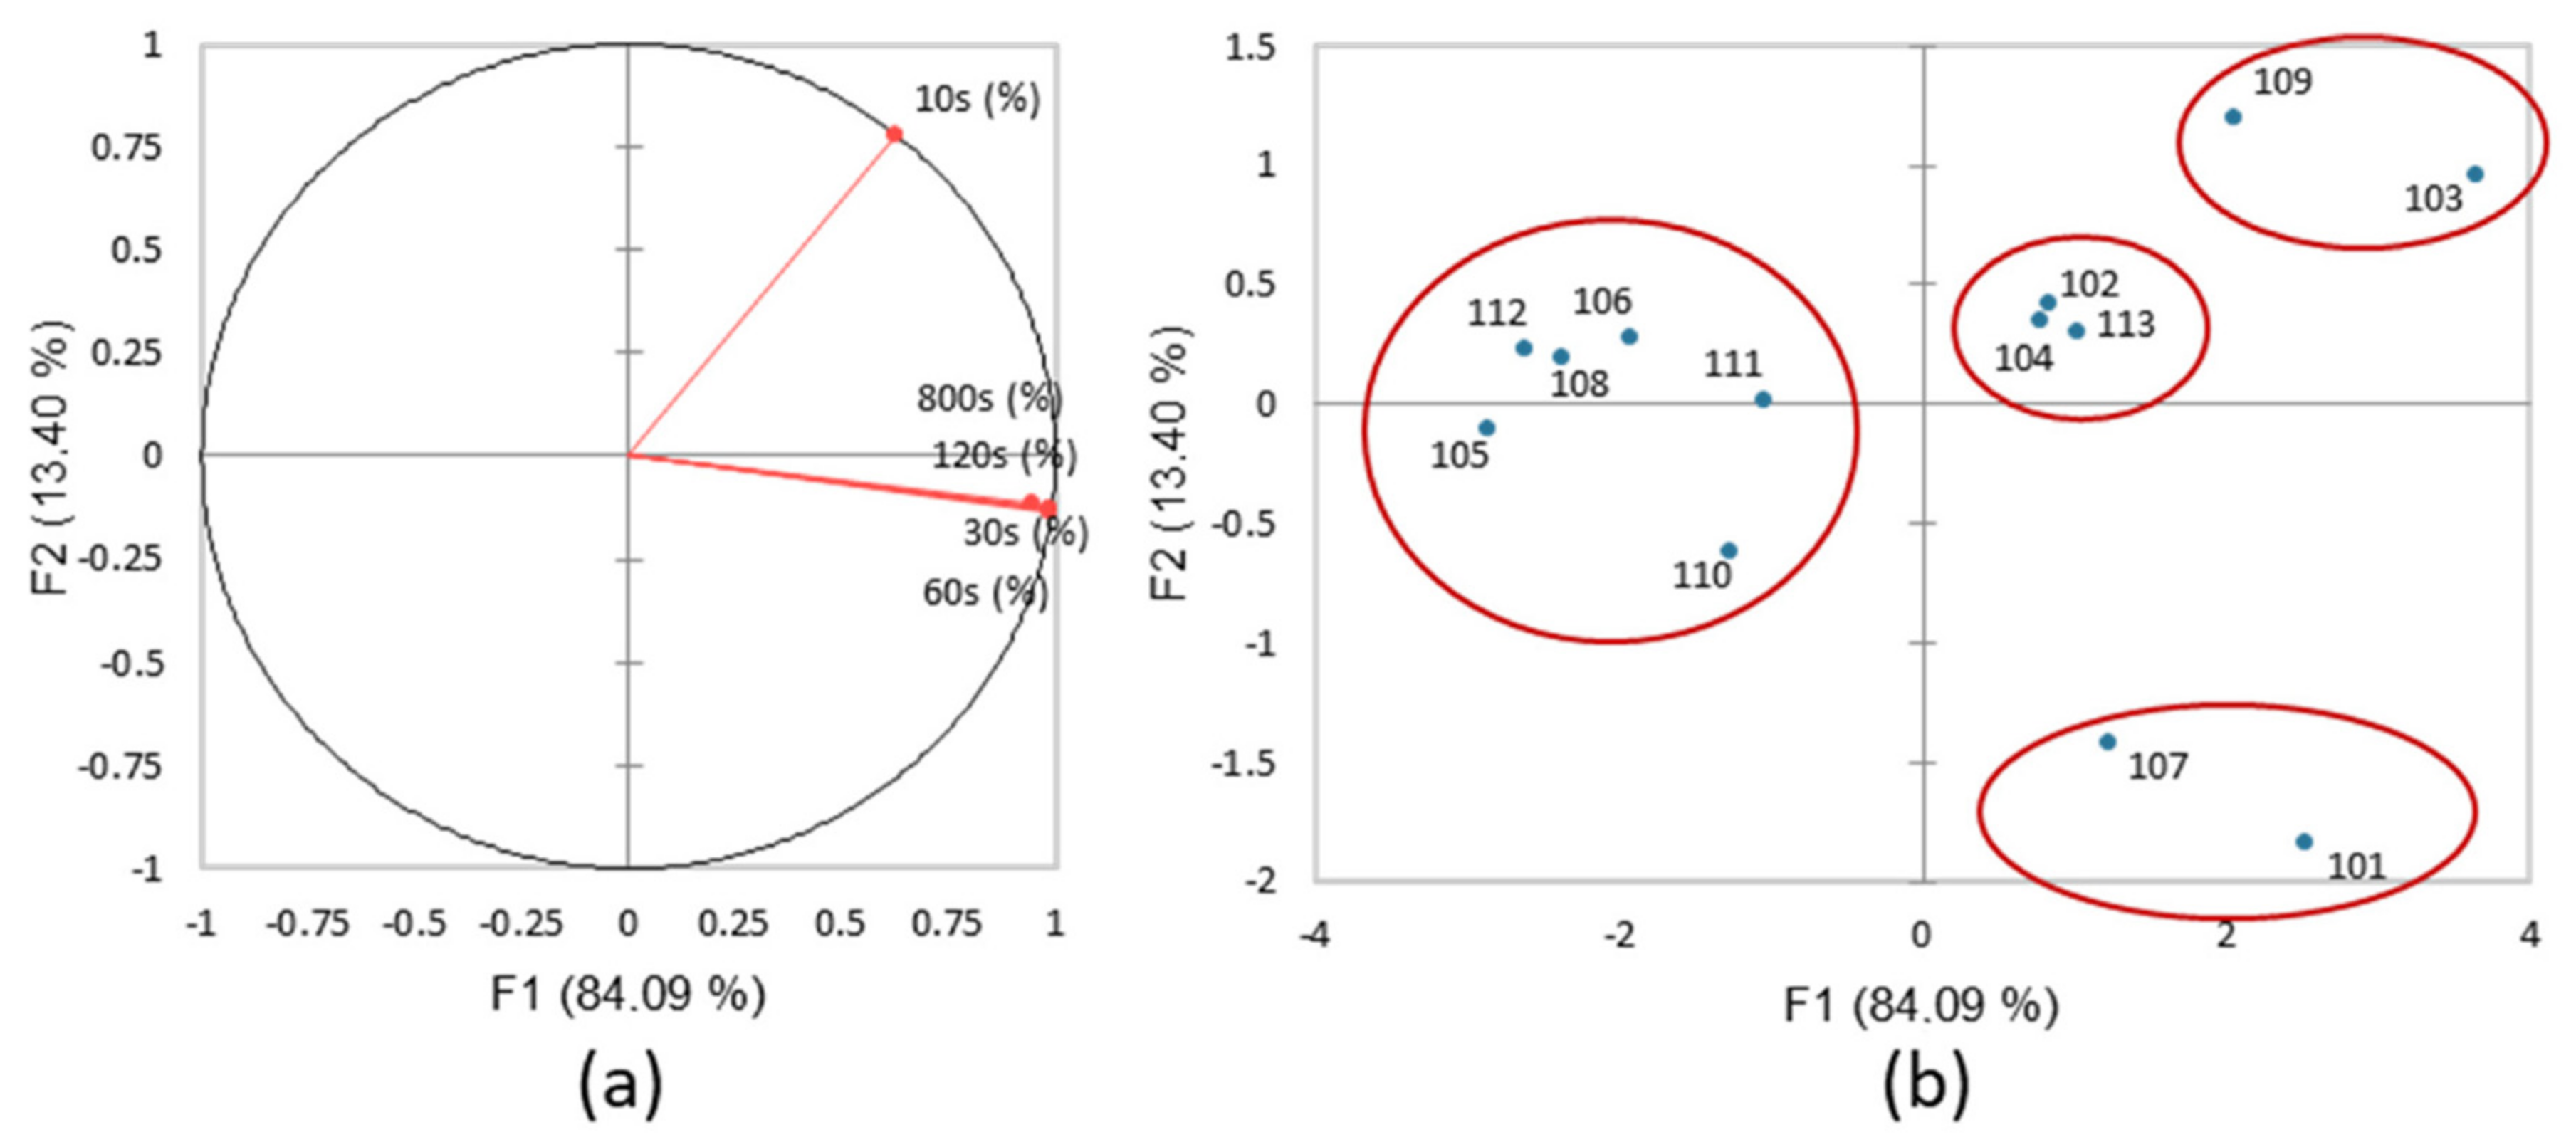
p < 0.05). The restructuring percentages after 10 s ranged from 0 to 93.7, and at the end of the test the percentages ranged from 35 to 107.4. Product 109 is defined above with lower viscosity and a weak network, and presents a faster and more stable restructuring, with a percentage equal to 85.45 at 10 s and 85.2 at 800 s. A PCA was carried out on the data with the 13 products as individuals and the 5 parameters as variables (
Figure 7). The total variables accounted for 97.49% of total variance (84.09% and 13.4% respectively). The loading plot of the restructuring test showed that the variable vectors are well represented (
Figure 7a). PC1 is correlated with the percentage of restructuring of 30 s, 60 s, 120 s and 800 s (long restructuring) and PC2 is correlated with the percentage of restructuring of 10 s (immediate restructuring). All the parameters on the PC1 are relevant (
Table 9) and are highly correlated each other. The chosen parameter is the percentage at 60 s because it is the closer to the sensorial stage “residual effects” after 1 min. Product 103 had the fastest restructuring, with 93% of restructuring after 10 s of shear and 105% after 60 s. The products 105, 106, 108, 110, 111, 112 and 113 showed a low restructuring capacity at 60 s and a low percentage at 10 s (
Figure 7b). The products 102, 104 and 113, showed a medium restructuring capacity at 60 s and 10 s. Finally, products 101 and 107 presented no restructuring at 10 s but the highest value at 60 s. The restructuring of an emulsion can be due to the network bonds or the volume fraction of the oil phase [
27]. Shearing at 100 s
−1, which represents the start of the spread of the cream on the skin, modified the bonds between the emulsion particles, with the different emulsions displaying a different effect. We can conclude that these results were due to the composition of the emulsion and the interactions between all the ingredients. The selected parameters for this method are the percentage of restructuring at 10 s and 60 s.
3.2.2. Textural Analysis
The second test often used to correlate attributes to instrumental parameters is the texture analysis [
12,
13]. The results of the penetration and extrusion tests are presented in
Table 10.
The ANOVA test showed that almost all of the products are significantly different (p < 0.05) and the number of clusters is between 8 and 11. The cosmetic products are well discriminated by these methods.
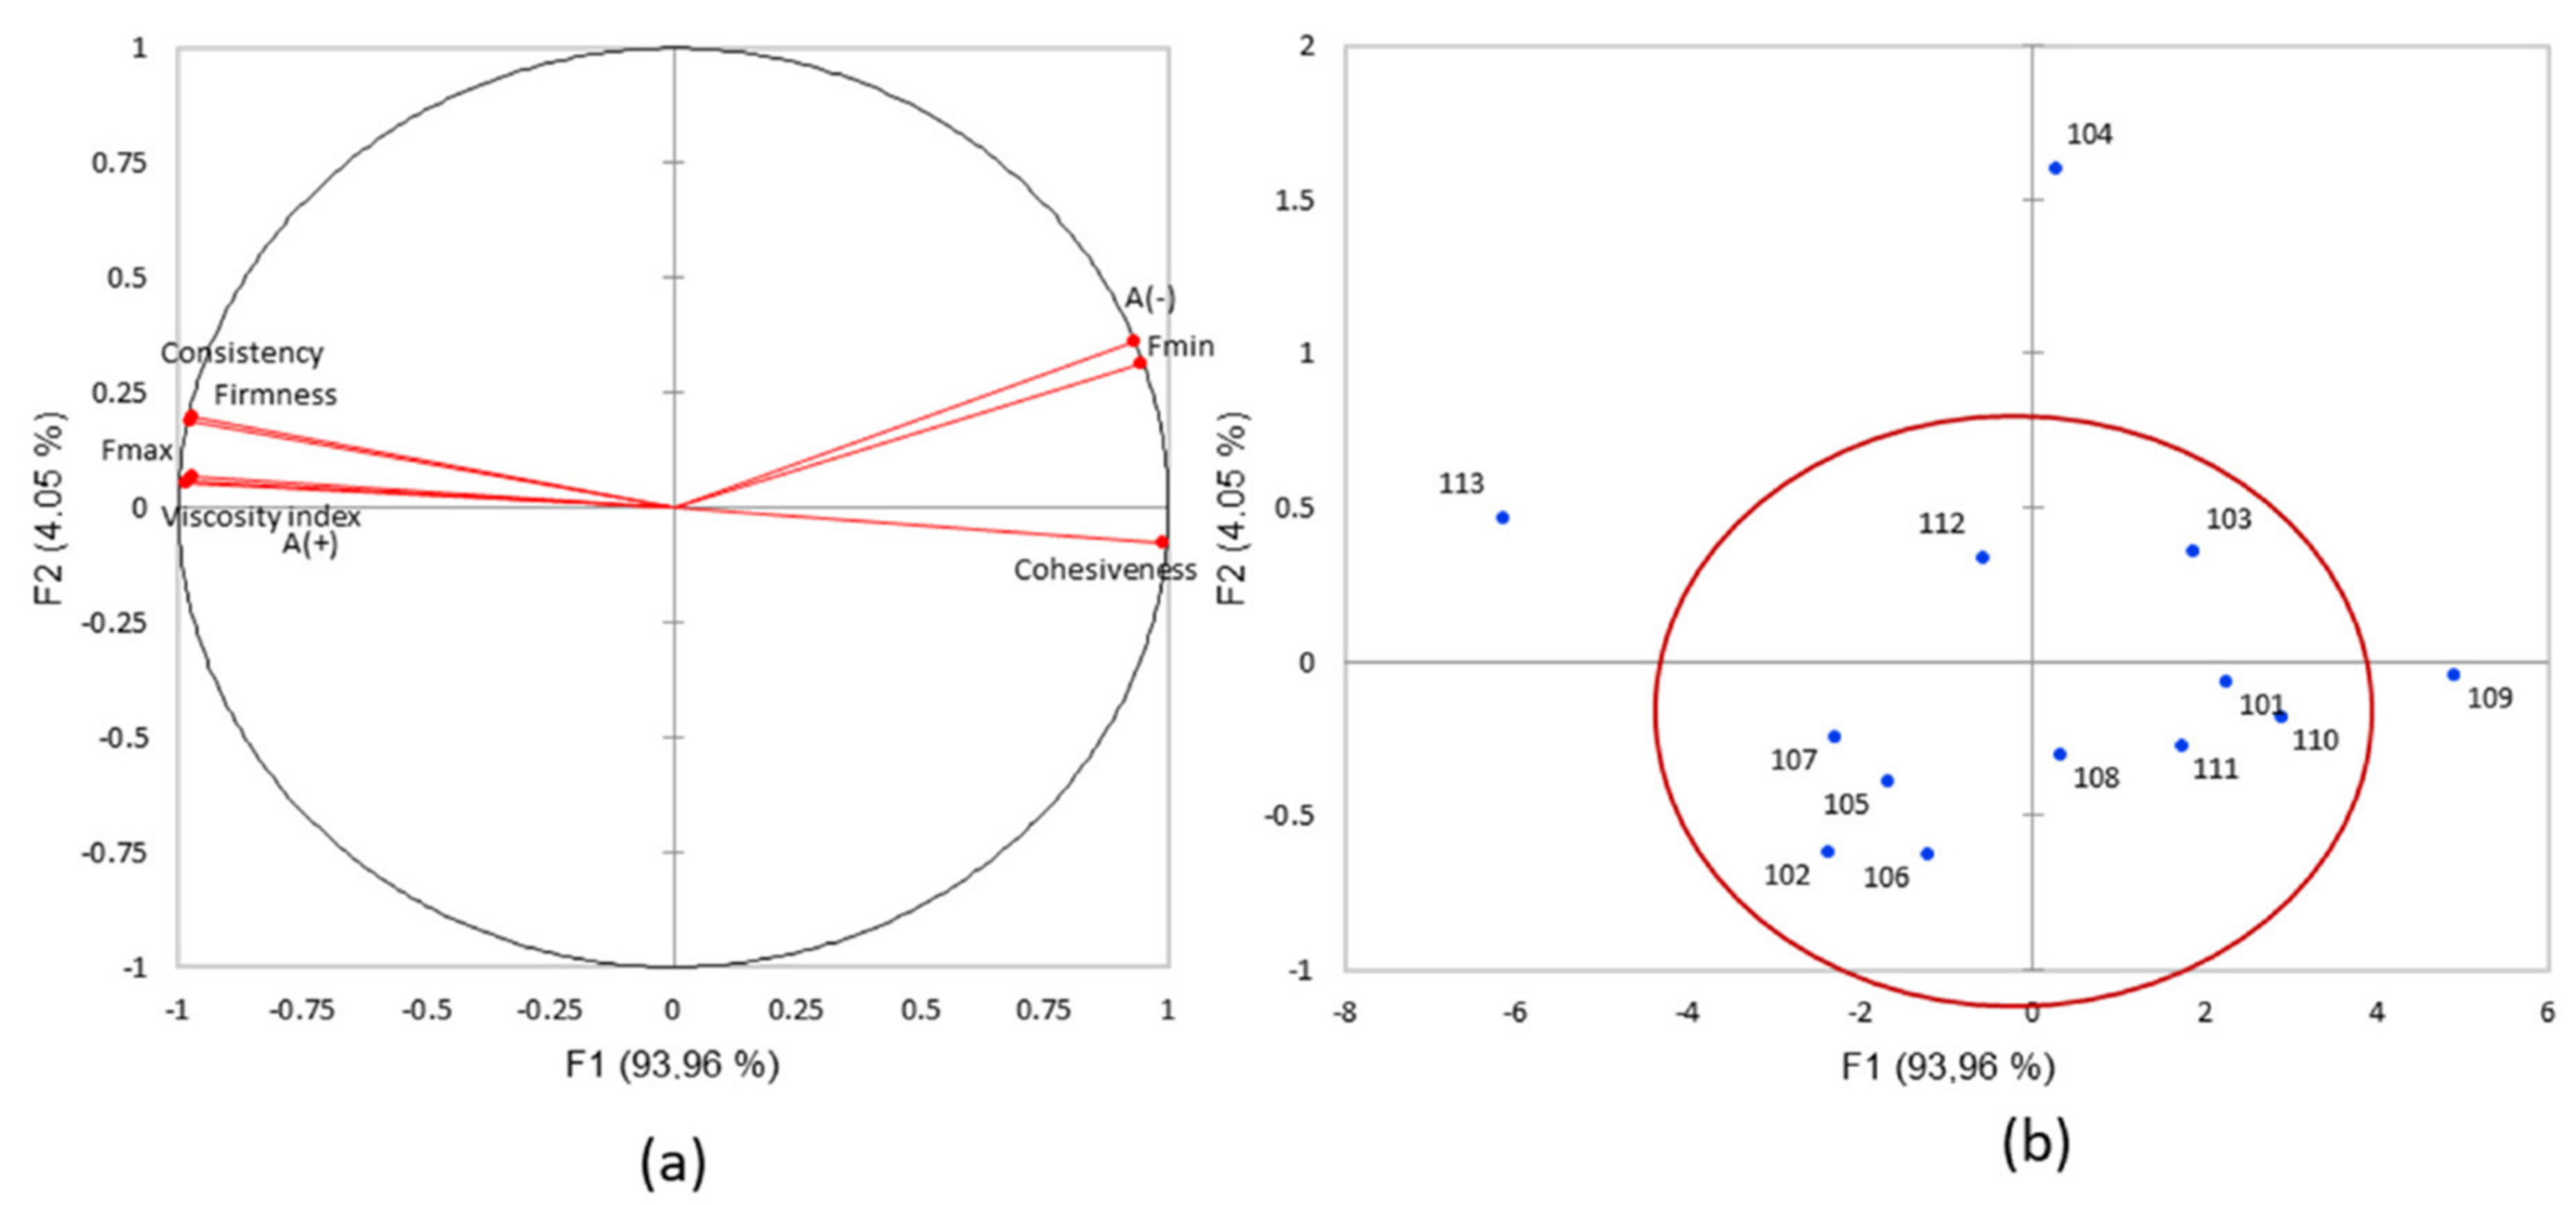
A PCA was carried out on the dataset with the 13 products as individuals and eight parameters as variables (
Figure 8).
The loading plot of the textural parameters showed that the vectors of variables are well-represented (
Figure 8a). Total variables accounted for 98.01% of total variance (93.96% and 4.05% respectively). PC1 is positively correlated to cohesiveness and negatively to viscosity. These high correlations are due to the significant difference in viscosity and consistency between the products. The scatter plot showed three extreme products (
Figure 8b): product 109 was the most fluid and the least cohesive, while product 113 appeared the most consistent in accordance with the high value of G′ (4151 Pa). Moreover, product 104 showed the highest value on PC2, which could be related to the high value of the attribute peak (9.12). The other products had mean values for the eight parameters. The texture analysis is designed to pinpoint products with high or low viscosity. Many parameters gave the same information. Consistency and firmness were highly correlated, while the Fmax and Aplus (A+) viscosity index had the same coordinates. Finally, Aminus (A−) and Fmin were also strongly correlated. The positioning of the products using the PCA method showed product 113 to be the firmest and most consistent, and 109 was the least consistent and cohesive. These results are in line with the fluid texture described above. Product 104 showed medium values for all the parameters, and the cluster of the other products showed intermediate values for certain parameters. Considering the parameters, A (−), Fmin and cohesiveness are strongly correlated with each other but anti-correlated with five parameters also strongly correlated themselves such as consistency, firmness, viscosity index, Fmax and A (+). The
Table 11 shows the cos
2 of each parameter. The extrusion test was more represented than the penetration test with four pertinent parameters against two for the penetration test.
In this case, we can consider many parameters because they are all correlated. In this study, the firmness and cohesiveness are selected.
In summary, the sorting data leaded to have less parameters to analyse by MFA. Among 26 parameters collected, 12 were selected for the multiple factor analysis (
Table 12).


 ,
, 


