Abstract
The validation of a cosmetic product is performed by physical analyses and sensory assessment. However, the recruitment of panelists takes a long time and is expensive. Moreover, to apply the product on the skin, microbiology analyses and safety are required but may not be not enough to avoid inflammatory reaction on the skin. The solution could be the substitution of sensory evaluation by instrumental measurement to predict the sensory profile before the panel. For the study, thirteen different skin care emulsions based on their composition and texture were carried out simultaneously by 12 expert panelists with a quantitative descriptive sensory evaluation profile and by rheological and textural methods. A statistical methodology was the applied to find correlation trends between both data sets. The methodology confirmed that the correlation between sensory assessment and instrumental parameters is a good solution to save time. The multiple factor analysis (MFA) showed the correlation between firmness with no visual residue attribute and the cohesion with sticky 1 min, which are evident but this methodology could be used for finding more complex correlations not found in literature.
1. Introduction
The highly competitive environment in the cosmetics market is a powerful lever for innovation. To attract and satisfy consumers, companies must quickly and qualitatively develop even more effective skincare products with a high percentage of natural ingredients. Their sensorial and perceived effectiveness largely depends on their texture, a key factor in consumers’ appreciation of the product, together with its appearance in its primary container, its handling quality and also its skin application.
Texture-related properties can be evaluated by conventional and widely described sensory analysis with a trained panel [1]. Sensory analysis is composed of several phases: the appearance, the pick-up, the rub out, and the after-feel [2], and is carried out by expert panelists with up to 6 to 12 months of training. This assessment is therefore time-consuming and costly, and efforts are being made to reduce both of these limitations [3,4,5]. Instrumental techniques such as rheology and texture analysis can provide an alternative in the search for reliable and reproducible texture information during the product development stages [6].
Major advances on this topic have been published in the last 15 years, mainly using rheology, but also texturometry. Thanks to all this work, it is possible to start identifying instrumental methods to correlate sensory attributes. For rheological methods such as the flow curve, many parameters could be correlated with different attributes, like apparent viscosity correlated with hydrophilic barrier creams [7], the hardness and softness of O/W and W/O emulsions [8] are correlated at low shear rate, with stickiness and spreadability and at high shear rate, are correlated with residual greasiness after application [7] and spreadability [9] but also correlated to the flow index [10]. Other parameters were simple to predict such as the consistency index and sensory consistency of topical formulations, Pourability attribute and viscosity [9].
Regarding oscillatory measurements, Lukic et al. established a clear correlation between yield stress, firmness and spreadability of W/O emulsions [11]. Gilbert et al. correlated G″ modulus and shape integrity on O/W emulsions [3]. Correlations were established by Adejokun et al. between LVR and firmness on O/W emulsions [9].
Concerning instrumental texture analysis, Smewing & Jachowicz used an extrusion test on shampoos to correlate the maximum positive force of firmness, and the positive area under the curve for consistency, the maximum negative force for cohesion and the negative area under the curve for the viscosity index [12]. These correlations were used as a postulate and validated on cosmetic creams [13].
All of these correlations were found on only one category of product: emulsions, to search the impact of an ingredient in the formula.
Moreover, all of the data collected to make these sensory-instrumental correlations were validated by statistical tests such as ANOVA and Duncan’s 2-2 comparison [14,15,16] to verify that the products are significantly different. Pearson’s correlation test and partial least squares test (PLS) are often used to highlight these correlations, but only on predefined formulas in which only the nature or the percentage of ingredients vary [17,18].
To analyze the results obtained for products with different ingredient compositions, several statistical approaches are proposed, such as multi-factorial models. Multiple factor analysis (MFA) allows us to simultaneously compare data from different sets of parameters [19,20,21]. These tests are very rarely used in the field of cosmetics, and even less to study sensory-instrumental correlations, but as they are efficient, we will apply them in this paper.
In summary, emulsions from different compositions have been analyzed by two main instrumental methods. We can however wonder which is the best instrumental parameter among the above to correlate one specific attribute?
The aim of this original work is to develop a new approach to establishing correlations between sensory and instrumental parameters on emulsions with different and unknown compositions to extend to other galenic. We thus explore several attributes, from texture in the jar to sensation on the skin immediately and after application.
The study focused on O/W emulsions, especially skincare products, where the exact composition of the creams’ ingredients was not considered unlike to those described below. In addition to sensory evaluation by a descriptive method, emulsions were characterized by a rheological test to determine viscoelasticity and flow behavior, and by textural tests such as firmness and consistency, among others. The instrument test protocols were developed to ensure reliable, reproducible, and comparative measurements of the product universe. The parameters were selected to mimic the sensory analysis conditions. For example, the flow test was performed up to 1000 s−1 to simulate the shear when spreading the product on the skin [22]. The geometry used for the texture analysis penetration test had a diameter comparable to that of the finger. Finally, original statistical analyses were applied to all the data to determine correlation trends between sensory attributes and instrumental parameters, and thus to make the right choice of measurement to avoid multiple analyses and save time in product design.
2. Materials and Methods
2.1. Samples
Thirteen skincare products were selected from the cosmetic skincare market, representative of varying objectives and presenting different texture properties. The exact composition of the products was not known. The products were numbered from 101 to 113. Twelve of them were O/W emulsions, while the thirteenth (#109) was an oil-in-glycerin emulsion.
2.2. Methods
2.2.1. Sensory Analysis
In order to objectively determine the sensory texture properties, a quantitative descriptive analysis was performed using a conventional type of profile following the NF ISO 13299 [23]. A trained internal panel was called upon for this study. It comprises volunteers aged from 20 to 50 years old, of both sexes, devoid of skin diseases. The panelists gave their informed consent to integrate the panel. They were specifically trained for the sensory evaluation of emulsions by carrying out sensory profiles. Rating scales with a lexicon of attributes and reference products are used for the extreme and intermediate values of each of them. The performance of the panel was carried out to ensure repeatability, discrimination, and consensus according to ISO 8586-1 [24]. Twelve panelists produced the 13 sensory profiles corresponding to the 13 products of the study. The definition protocols and rating scale for each attribute are reported in Table 1. The evaluation of product texture perception was divided into five stages. Thirteen attributes were selected for the study: three attributes were evaluated in the first stage (called “in the jar”), two during the pick-up, two during the rub out, two attributes were evaluated immediately after application, and four were evaluated 1 min after the application.

Table 1.
List of selected attributes, their definition, and extreme rating scale.
The rating scale ranges from 0 to 10, with an increment of 0.5 point, offering 21 scoring possibilities for each attribute. The products were evaluated by panelists in a room dedicated to sensory analysis composed of individual boxes, with controlled temperature and relative humidity. The panelists each had a sink, washing gel and paper at their disposal to wash their hands and forearms at the beginning of the sessions and between each evaluation. The products, randomly coded into three-digit numbers, were presented to them randomly in neutral jars to minimize the influence of factors external to the products on their responses. Finally, the panelists evaluated the products in sequential monadic rotation (one product after another) and had free access to references if they needed a reminder of the intensity scales before and during the evaluation. An average rating per product was calculated from the ratings of each panelist. The raw data (the ratings per panelist per product) were analyzed by the statistical tools presented in the statistical section.
2.2.2. Instrumental Analysis
The instrumental methods depicted in this part were chosen according to the sensorial stage (Table 2). Rheology, which represents the flow of the product under stress, can be compared to the spreading of the product on the skin, and textural methods are associated with the application of a force on the product. Considering the mixing oscillatory and flow test, this method was chosen to mimic the restructuring of the product, from the application of the product to the effects after one minute.

Table 2.
Instrumental methods chosen according to sensorial stage.
- Rheological Analysis
All the rheological tests were performed with an MCR 301 rheometer (Anton Paar; Graz, Austria) at 25 °C, controlled by the RheoCompass software (Anton Paar, Graz, autria. Measurements were made with a new sample loaded for each run. A solvent trap was used to prevent solvent evaporation during measurement. The samples were allowed to relax and acclimatize for at least 2 min after loading and before measurement.
Flow tests were carried out using a plate-plate sandblasted device (50 mm diameter). An up-shear scan was done by a stepwise logarithmic increase from 0.01 to 1010 s−1 in 590 s.
For a value of n < 1, the product presented shear-thinning behavior, n > 1 shear thickening behavior, and n = 1 Newtonian behavior. Characteristic parameters were collected, especially values of viscosity at 0.01 s−1, corresponding to the apparent viscosity, then 600 s−1 and 1000 s−1 to observe the evolution of the product under stress.
Oscillatory strain sweep tests were conducted at a frequency of 1 Hz from 0.01 to 1000% of strain using a plate-plate PMMA sandblasted device (50 mm diameter). Parameters were collected from the oscillation curves for each emulsion, including elastic and viscous moduli (G′ and G″, respectively), tan δ on the linear viscoelastic region (LVR), critical strain (γDL) and stress (σDL), corresponding to the point where the elastic modulus G′ plateau dropped by 10%, and critical strain (γcrossover) and stress (σcrossover), corresponding to the cross-over point of G′ and G″.
A protocol mixing oscillatory and flow test was carried out in three steps: a first-time sweep of 100 s was performed in the LVR of each product at 1 Hz to remain within the linearity limits of viscoelasticity, followed by a shear rate at 100 s−1 for 1 min. A second time sweep was then run at the same strain from step 1 at 1 Hz for 900 s. The percentage of restructuring were collected after 10 s, 30 s, 60 s, 120 s and 800 s.
- Textural Analysis
All instrumental characterization measurements of texture were conducted after a 24 h temperature equilibrium at 25 °C. Two tests were performed, a penetration test and an extrusion test. Three repetitions were performed for each product in each test.
The penetration test was performed with a TA.XT Plus texturometer (Stable Micro Systems, Surrey, UK) equipped with a 1 kg force sensor. The products were analyzed in a jar with a capacity of 50 mL and a diameter of 50 mm. A P/0.5S probe entered the product at a speed of 1 mm/s and at a fixed trigger force of 0.5 g, over a pre-set distance of 10 mm, and was then extracted at the same speed. The curve of the force exerted by the sample on the probe (in g) according to the time was recorded throughout the duration of the test using Exponent software. Different parameters were extracted: Fmax (maximum positive force, in g), Aplus (A+) (positive area below the curve, in g.s), Fmin (minimum negative force, in g), and Aminus (A−) (negative area below the curve, in g.s).
The extrusion test was performed on a TA Plus texturometer (Lloyd instruments Ltd., Bognor Regis, UK) with a compression disc of 45 mm diameter in an 80 mL container (50 mm diameter) filled with cream to a height of 45 mm. The probe compressed and extruded the product up and around the edge of the disc at a constant speed test of 2 mm/s to a distance of 25 mm, and then returned to its start position. Different extrusion parameters were collected (i.e., firmness, consistency, cohesiveness, and viscosity index).
2.2.3. Statistical Analysis
All the measurements were performed in triplicate and the results were expressed as mean ± SD (standard deviation). The statistical analyses were performed on sensory and instrumental data to evaluate product discrimination. A two-way analysis of variance (ANOVA) was performed, and when discrimination between the products was significant (p < 0.05), the mean scores obtained were compared using a Duncan multiple comparison test. All of the statistical analyses were performed using XLSTAT SENSORY software (Addinsoft, Paris, France) (version 2020.5.1.10.51) and “R” software (R Development Core Team, 2019) (version 4.0.3 (2020-10-10)). A Principal Component Analysis (PCA) was applied to the correlation matrix of the average values of sensory, rheological, and textural parameters to assess the correlations between variables and to highlight the properties of emulsions or groups of emulsions. To compare PCA from sensory and instrumental parameters, a multiple factor analysis (MFA) was applied to analyze the correlation of a large set of variables split into groups. The MFA is an extension of the canonical analysis. The groups can be composed of numeric or categorical variables. The first outcome was the analysis of correlations between groups and between variables. The RV-ratio was used to compute the correlations between variables and the principal component. Secondly, the MFA drew an overall map of the samples [25]. This representation can be related to the PCA map of each group.
3. Results
3.1. Sensory Analysis
The first step of the methodology was to check the diversity of the cosmetic products analyzed. The mean scores obtained for each product are presented in Table 3. According to the ANOVA, differences between the evaluated products are highly significant (p < 0.0001), which means that the assessors were able to discriminate between the 13 products.

Table 3.
Average score (±sd) of the panelists of each attribute for the 13 cosmetic products.
The fluidity attribute showed a value of 5 for product 109 but 0 for the other products, only because product 109 moves in the jar. It was nonetheless retained as it does not modify the statistical results and enables the scale of representation to be widened. All the other attributes showed higher variability since they were of different textures (five to seven clusters with Duncan’s test). To have a global vision of the products and its dispersion, two PCAs were performed. The first involved the set of sensory descriptor data, and the other examined the products in order to highlight their variability (Figure 1).
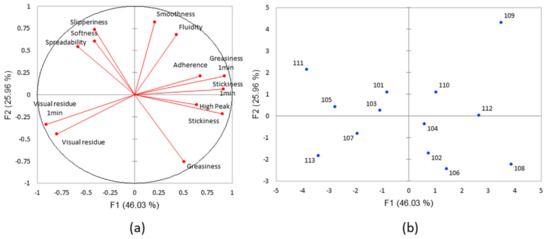
Figure 1.
(a) PCA loading plot of the attribute (variables) and (b) scatter plot of the products (individuals) for the sensory evaluation (PC1 46.03%, PC2 25.96%).
Both the PCA plot, (Figure 1a) representing the attributes with over 70% of observations, and the scatter plot showed good distribution of the product (Figure 1b). The many different products allowed us to subsequently perform a significant analysis. The PC1 axis (46.03%) is positively correlated with stickiness and adherence and negatively correlated with the no visual residue attribute. The PC2 axis (25.96%) is positively represented by the smoothness of the products and negatively represented by greasiness. For all 13 products, the attributes of slipperiness, softness and spreadability are well correlated with each other, but are anti-correlated with greasiness, in line with Lukic et al., (2013) who demonstrated the correlation between spreadability and slipperiness [11]. Both the ANOVA and the PCA showed a good variability of selected cosmetic products and can be analysed by instrumental methods.
3.2. Instrumental Analysis
The objective of this part is to validate the methods and to sort redundant and discriminant parameters in order to apply as few methods as possible, but also those most adapted to the company’s expertise.
3.2.1. Rheological Analysis
- The flow profile of emulsions under stress allows us to see how the product flows when it is spread over the skin [26]. Figure 2 shows the flow curve of three products, corresponding to the extreme and the middle products for the apparent viscosity at 0.01 s−1. All of the products exhibit a classical shear thinning behaviour and could therefore be fitted by the Herschel Bulkley model (Equation (1) with σs the yield stress, K the consistency index, and n the behavior index [25].
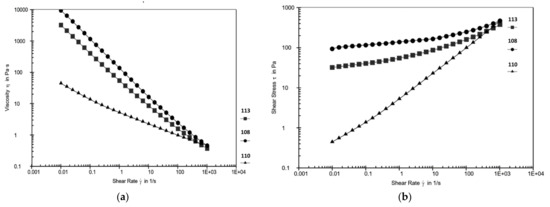
Figure 2.
Viscosity (a) and flow (b) curves of three products representing the extreme 0 (109 and 107) and the middle (103) of measurement.
Equation (1) Herschel Bulkley model
Each flow curve is perfectly overlapped with the Herschel Bulkley model (not shown in the graph).
The flow behaviour of the 13 emulsions was analysed and the results are presented in Table 4.

Table 4.
Values of viscosity (means ± SD) obtained for 3 different shear rates (in s−1) and from the Herschel Bulkley model (yield stress (σ), K and n).
For all the samples, apparent viscosity was between 55 Pa·s and 7349 Pa·s, and most of them had a yield stress. Product 109 is just a shear-thinning product, without yield stress, but the Hershel Bulkley model was performed because of the R2 level. The viscosity index (n) was lower than 1 for all the products, indicating shear-thinning behaviour.
Indeed, the more the shear rate increased, the greater the decrease in viscosity for each emulsion, in accordance with the value of n [27]. Regarding the yield stress, values ranged from 9.80 Pa for product 105 to 99.12 Pa for product 107. Almost all the products are significantly different, with a p-value less than 0.05 (Table 4). A principal component analysis (PCA) was thus carried out on the emulsion dataset, with the 13 products representing individuals and the 6 rheological parameters as variables (Figure 3). The total variables accounted for 85.48% of the total variance (63.79% and 21.69% respectively).
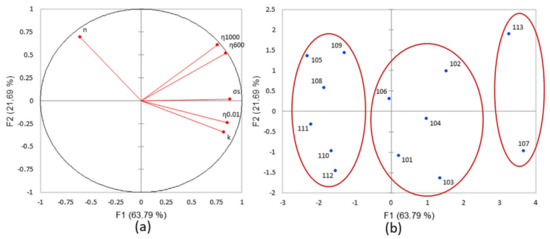
Figure 3.
(a) PCA loading plot of the rheological parameters (variables) and (b) scatter plot of the products (individuals) for the flow tests (PC1 63.79%, PC2 21.69%).
The loading plot of the rheological parameters and flow properties showed that the vectors of variables were well presented (Figure 3a). PC1 is positively represented by the apparent viscosity at 0.01 s−1 and yield stress, while PC2 is positively represented by n and negatively by K. The products in the positive PC1 axis presented high viscosity, while the negative PC1 axis presented the product with a low viscosity (Figure 3b). Product 103 had the lowest negative value on PC2 due to its weak consistency index. Products 105, 108, 109, 110, 111, and 112 belong to the first cluster, with a lower value of yield stress. The second cluster is comprised of 101, 102, 103, 104, and 106 with intermediate yield stress, while the third cluster is comprised of 107 and 113 with the highest yield stress. These two products showed that viscosity could differ but present a similar yield stress (89 and 99) Pa. The viscosity is the resistance to flow, and the behaviour of the products showed different viscosities caused by the ingredients (nature and concentration) that played a role in the flow [28]. All of the products were well discriminated with the shear flow test. Finally, the analysis of the data by the PCA makes it possible to validate this method, (Table 5) and to observe the redundant parameters and to select the most relevant one because all of the square cosines (cos2) of the parameter are significant. As the parameters η (1000) and η (600) are strongly correlated, and the parameter K is also strongly correlated with η (0.01), one of them can be selected. Each parameter has a projection angle on the two axes of the circle. The value of the cos2 of the angle makes it possible to know its representativeness; it must at least be greater than the inertia of the axis, and the higher the cos2, the more relevant it is. Among the six parameters collected in this test and according to the percentage of observation, two of them are not selected, such as η (1000), the value of the cos2 is greater on the PC1 (0.700 for 63.7%) with a higher percentage than PC2 (0.369 for 21.6%) and K.

Table 5.
Values of cos2 for each parameter for the two axes of PCA flow test (the significant values are in bold.
- Oscillatory strain tests determined the viscoelastic behavior of the samples in the range of non-destructive strain to obtain the linear viscoelastic region (LVR) and the strength of the network of the product [29]. Like the flow test, the curve of the three extreme and middle products are shown in Figure 4. Table 6 presents the test results. All the products have a value of G′ > G″ and presented predominant elastic behavior in the LVR.
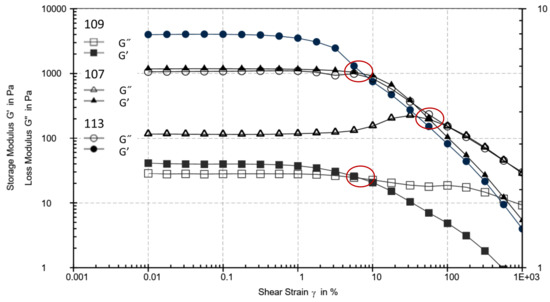
Figure 4.
Viscoelastic characterization of the three extreme products (107, 109 and 113) of the PCA (Figure 6). The crossover of each product is marked by a red circle.

Table 6.
Rheological data (means ± SD) obtained from the strain tests for the 13 emulsions. The value of G′, G″ and tan δ correspond to the linear viscoelastic region (LVR).
Table 6.
Rheological data (means ± SD) obtained from the strain tests for the 13 emulsions. The value of G′, G″ and tan δ correspond to the linear viscoelastic region (LVR).
| Product | G′ (Pa) | G″ (Pa) | tan δ | γDL (%) | σDL (Pa) | σcrossover (Pa) | γcrossover (%) |
|---|---|---|---|---|---|---|---|
| 101 | 331.51 ± 1.71 h | 46.85 ± 0.38 ij | 0.142 ± 0.000 k | 3.235 ± 0.005 c | 9.834 ± 0.033 g | 65.47 ± 0.03 g | 82.49 ± 0.61 b |
| 102 | 4148.25 ± 35.65 a | 1090.05 ± 13.55 a | 0.263 ± 0.001 f | 0.554 ± 0.003 i | 22.680 ± 0.008 b | 93.99 ± 0.19 d | 51.99 ± 0.14 e |
| 103 | 336.57 ± 0.29 h | 43.91 ± 0.03 jk | 0.130 ± 0.000 l | 4.235 ± 0.055 a | 14.031 ± 0.192 d | 77.14 ± 0.03 f | 67.04 ± 0.11 c |
| 104 | 345.12 ± 4.64 h | 64.56 ± 0.54 i | 0.187 ± 0.001 j | 3.910 ± 0.030 b | 12.547 ± 0.273 e | 103.20 ± 2.40 c | 111.71 ± 1.79 a |
| 105 | 3111.90 ± 12.40 b | 873.48 ± 0.2 b | 0.281 ± 0.001 c | 0.069 ± 0.021 k | 1.991 ± 0.552 j | 84.78 ± 9.69 e | 42.29 ± 7.49 f |
| 106 | 2111.25 ± 25.55 c | 481.78 ± 2.89 d | 0.229 ± 0.001 i | 0.818 ± 0.054 h | 16.724 ± 0.832 c | 77.34 ± 1.02 f | 32.35 ± 1.01 g |
| 107 | 1179.00 ± 10.00 e | 114.44 ± 1.31 h | 0.097 ± 0.000 m | 2.890 ± 0.040 d | 32.190 ± 0.072 a | 159.00 ± 0.30 a | 58.18 ± 1.30 d |
| 108 | 3078.90 ± 84.70 b | 738.19 ± 16.22 c | 0.240 ± 0.001 h | 0.440 ± 0.006 j | 12.925 ± 0.144 e | 57.03 ± 0.08 h | 33.33 ± 0.70 g |
| 109 | 39.65 ± 0.02 i | 27.79 ± 0.11 k | 0.701 ± 0.002 a | 1.615 ± 0.025 e | 0.721 ± 0.011 k | 2.38 ± 0.05 k | 7.05 ± 0.21 h |
| 110 | 676.67 ± 8.48 g | 186.21 ± 4.58 g | 0.275 ± 0.003 d | 1.280 ± 0.000 f | 7.600 ± 0.151 i | 33.34 ± 0.71 j | 43.42 ± 0.96 f |
| 111 | 1384.55 ± 22.15 d | 349.62 ± 7.77 f | 0.253 ± 0.001 g | 0.854 ± 0.007 h | 10.826 ± 0.105 f | 50.44 ± 0.09 i | 34.24 ± 0.95 g |
| 112 | 976.50 ± 17.53 f | 436.96 ± 9.17 e | 0.448 ± 0.001 b | 0.951 ± 0.006 g | 8.890 ± 0.246 h | 63.16 ± 0.61 g | 42.54 ± 1.95 f |
| 113 | 4151.50 ± 119.00 a | 1106.90 ± 29.40 a | 0.267 ± 0.000 e | 0.814 ± 0.010 h | 31.515 ± 1.224 a | 112.65 ± 6.55 b | 8.95 ± 0.53 h |
a,b,c,d,e,f,g,h,i,j,k Means with the same letter within a column do not differ significantly (p > 0.05).
The ANOVA test showed that most products are significantly different (p < 0.05). A PCA was carried out on the data with the 13 products as individuals and the seven rheological parameters as variables (Figure 5). The total variables account for 84.1% of total variance (44.63% and 39.47% respectively). The loading plot of the rheological parameters shows that the vectors of variables are well presented (Figure 5a). PC1 is positively related to G′, G″, and negatively related to the percentage of strain (γDL), while PC2 is positively related to stress (σcrossover and σDL) and negatively related to tan δ.
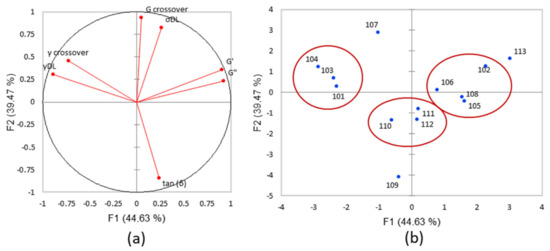
Figure 5.
(a) PCA plot of the rheological parameters (variables) and (b) scatter plot of the products (individuals) for the oscillation strain test (PC1 44.63%, PC2 39.47%).
The scatter plot (Figure 5b) shows three extreme products: 109 has the lowest values of G′ (39.65 Pa) and G″ (27.79 Pa) and tan δ is very high (0.701), 107 has the lowest value of tan δ (0.097) and the highest value of σcrossover (159 Pa), corresponding to the least liquid product, and 113 has the highest value of G′ (4151 Pa) and a high value of σcrossover (112.6), corresponding to a stiff and strong product [30]. The products 102, 105, 106, and 108 made up the first cluster, representing a low value of tan δ (around 0.2) and high viscosity (2111 to 4148 Pa). The products 110, 111 and 112 comprise the second cluster, with a low G′ and G″, corresponding to the softest structure of the products. The products 101, 103, 104 comprise the last cluster, represented by a very low tan δ (0.097 to 0.180) and low viscosity (330 to 1179 Pa). Moreover, all the products had a value of tan δ < 1, specific to viscoelastic, solid-like emulsions [27]. The module G′ is strongly correlated to G″, γcrossover with γDL and σDL with σcrossover. According to the values of cos2 of this test (Table 7), the sorting data didn’t select σDL, γcrossover. On the other side, G″ is not selected because the study concerns solid viscoelastic and presented a value of G′ > G″.

Table 7.
Values of cos2 for each parameter for the two axes of PCA oscillation strain test (the significant values are in bold).
Mixing oscillatory and flow test. The product analysis was carried out in greater depth by measuring the percentage of restructuring after a shear. To begin with, the viscoelasticity of the product was measured at rest (G′ and G″) for 100 s at 0.01 s−1, and then at a shear rate of 100 s−1 for 100 s and at 0.01 s−1 for 900 s. Figure 6 shows a representation of the test of the two extreme products (101 and 109) and the intermediate product (110) for the restructuring. This measure mimics the spreading of the cream on the hand. The percentage of restructuring after shearing was measured at many different times: 10 s, 30 s, 60 s, 120 s and 800 s. These different measures allowed to study the capacity of the restructuring of the product with time and corelated with the different stages of sensory assessment. The results are presented in Table 8.
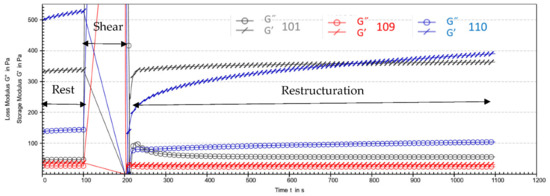
Figure 6.
Viscoelasticity measurement of the 3 extreme products (101, 109 and 110) of the PCA (Figure 5) with G′, elastic modulus, and G″, viscous modulus.

Table 8.
Values of the percentage of the emulsion’s restructuring at different times for the 13 cosmetic products.
The ANOVA test shows that almost all the products are significantly different (p < 0.05). The restructuring percentages after 10 s ranged from 0 to 93.7, and at the end of the test the percentages ranged from 35 to 107.4. Product 109 is defined above with lower viscosity and a weak network, and presents a faster and more stable restructuring, with a percentage equal to 85.45 at 10 s and 85.2 at 800 s. A PCA was carried out on the data with the 13 products as individuals and the 5 parameters as variables (Figure 7). The total variables accounted for 97.49% of total variance (84.09% and 13.4% respectively). The loading plot of the restructuring test showed that the variable vectors are well represented (Figure 7a). PC1 is correlated with the percentage of restructuring of 30 s, 60 s, 120 s and 800 s (long restructuring) and PC2 is correlated with the percentage of restructuring of 10 s (immediate restructuring). All the parameters on the PC1 are relevant (Table 9) and are highly correlated each other. The chosen parameter is the percentage at 60 s because it is the closer to the sensorial stage “residual effects” after 1 min. Product 103 had the fastest restructuring, with 93% of restructuring after 10 s of shear and 105% after 60 s. The products 105, 106, 108, 110, 111, 112 and 113 showed a low restructuring capacity at 60 s and a low percentage at 10 s (Figure 7b). The products 102, 104 and 113, showed a medium restructuring capacity at 60 s and 10 s. Finally, products 101 and 107 presented no restructuring at 10 s but the highest value at 60 s. The restructuring of an emulsion can be due to the network bonds or the volume fraction of the oil phase [27]. Shearing at 100 s−1, which represents the start of the spread of the cream on the skin, modified the bonds between the emulsion particles, with the different emulsions displaying a different effect. We can conclude that these results were due to the composition of the emulsion and the interactions between all the ingredients. The selected parameters for this method are the percentage of restructuring at 10 s and 60 s.
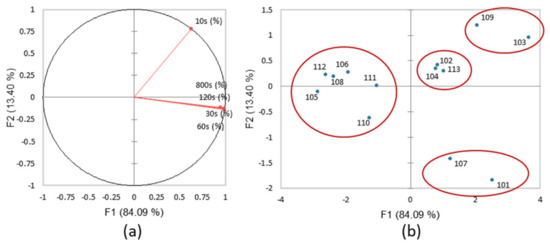
Figure 7.
(a) PCA loading plot of the rheological parameters (variables) and (b) PCA loading plot of the products (individuals) for the restructuring test.

Table 9.
Values of cos2 for each parameter for the two axes of PCA restructuring test (the significant values are in bold).
3.2.2. Textural Analysis
The second test often used to correlate attributes to instrumental parameters is the texture analysis [12,13]. The results of the penetration and extrusion tests are presented in Table 10.

Table 10.
Textural data (means ± SD) from the extrusion and penetration tests for the 13 cosmetic products.
The ANOVA test showed that almost all of the products are significantly different (p < 0.05) and the number of clusters is between 8 and 11. The cosmetic products are well discriminated by these methods.
A PCA was carried out on the dataset with the 13 products as individuals and eight parameters as variables (Figure 8).
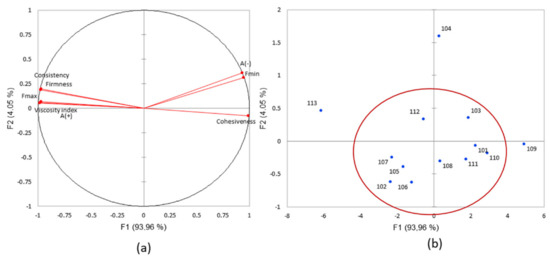
Figure 8.
(a) PCA loading plot of the textural parameters (variables) and (b) scatter plot of the products (individuals) for the textural test (PC1 93.96%, PC2 4.05%).
The loading plot of the textural parameters showed that the vectors of variables are well-represented (Figure 8a). Total variables accounted for 98.01% of total variance (93.96% and 4.05% respectively). PC1 is positively correlated to cohesiveness and negatively to viscosity. These high correlations are due to the significant difference in viscosity and consistency between the products. The scatter plot showed three extreme products (Figure 8b): product 109 was the most fluid and the least cohesive, while product 113 appeared the most consistent in accordance with the high value of G′ (4151 Pa). Moreover, product 104 showed the highest value on PC2, which could be related to the high value of the attribute peak (9.12). The other products had mean values for the eight parameters. The texture analysis is designed to pinpoint products with high or low viscosity. Many parameters gave the same information. Consistency and firmness were highly correlated, while the Fmax and Aplus (A+) viscosity index had the same coordinates. Finally, Aminus (A−) and Fmin were also strongly correlated. The positioning of the products using the PCA method showed product 113 to be the firmest and most consistent, and 109 was the least consistent and cohesive. These results are in line with the fluid texture described above. Product 104 showed medium values for all the parameters, and the cluster of the other products showed intermediate values for certain parameters. Considering the parameters, A (−), Fmin and cohesiveness are strongly correlated with each other but anti-correlated with five parameters also strongly correlated themselves such as consistency, firmness, viscosity index, Fmax and A (+). The Table 11 shows the cos2 of each parameter. The extrusion test was more represented than the penetration test with four pertinent parameters against two for the penetration test.

Table 11.
Values of cos2 for each parameter for the two axes of PCA texture test (the significant values are in bold).
In this case, we can consider many parameters because they are all correlated. In this study, the firmness and cohesiveness are selected.
In summary, the sorting data leaded to have less parameters to analyse by MFA. Among 26 parameters collected, 12 were selected for the multiple factor analysis (Table 12).

Table 12.
Number of parameters for each method before and after the screening methodology.
4. Discussion
The cosmetic products analyzed presented a good variability of sensorial, textural and rheological profiles, that is important to prove the correlation method whatever its composition.
An MFA was carried out with both sensorial and instrumental data selected (Figure 9) to evaluate potential correlations. Total variables accounted for 62.22% of total variance (37.54% and 24.68% respectively). Each color represents a type of measurement cited below (e.g., oscillation sweep in green, phase of sensory evaluation in brown, etc.).
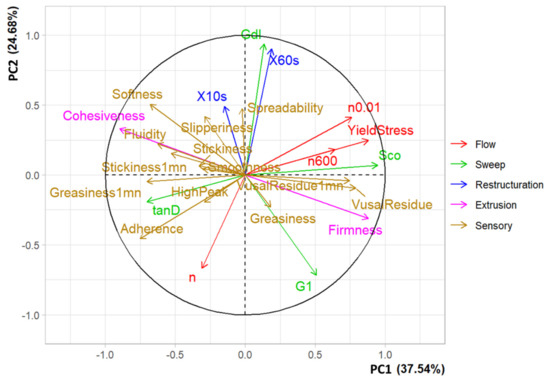
Figure 9.
MFA plot of the sensorial and instrumental parameters (variables PC1/PC2 (PC1 39.33%. PC2 23.88%). Because of R software, some variables are different in the figure than in the text. n0.01 = η (0.01). X60 s = 60 s (%). X10S = 10 s (%). G1 = G′. tan D = tan δ. Sco = σcrossover. Gdl = γDL.
Table 13 shows the value of the cos2 of each parameter and attribute. The percentage of restructuring at 10 s is only relevant on the PC3 but with only 12.8% of total observation. As we want a robust method, this parameter is not selected. However, all other parameters are relevant. On the contrary, many attributes are not correlated with instrumental parameters for the three axes such as high peak, greasiness, stickiness, smoothness and stickiness 1 mn. The attributes slipperiness and spreadability shows a relevancy on PC3 but with a low percentage of observation (12.8%), making it not strong enough for the methodology of correlation.

Table 13.
Values of cos2 for each parameter for the three axes of MFA (the significant values are in bold).
This first step allowed for the elimination of the non-relevant attributes for correlation with the instrumental parameter. The second step was to integrate only final attributes and parameters selected to highlight the stronger correlations. Figure 10 represents the MFA with the selected parameters and attributes. Total variables accounted for 74.45% of total variance (45.01% and 29.44% respectively).
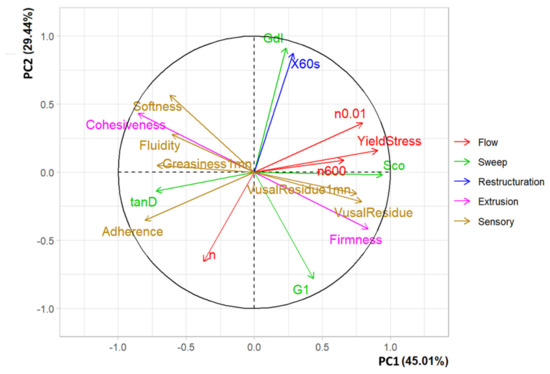
Figure 10.
MFA plot of the sensorial and instrumental parameters sorted (variables PC1/PC2 (PC1 45.01%. PC2 29.44%). Because of R software. some variables are different in the figure than in the text. n0.01 = η (0.01). X60s = 60 s (%). G1 = G′. tan D = tanδ. Sco = σcrossover. Gdl = γDL.
Table 14 presents the cos2 of each parameter and shows that only the fluidity attribute is represented on PC3 but not in PC1 and PC2. This attribute cannot be correlated to an instrumental parameter because of the low percentage of variance of this axis (10.6%) compared to the others. However, visualization of correlations is clearer, and two types of correlation are highlighted, strong and weak correlations according to the angle between two parameters. The smaller the correlation, the stronger the correlation and in the opposite, if the angle is close to 180°, we have inverse correlations, which means that when the value of one parameter increases, the other decreases.

Table 14.
Values of cos2 for each parameter for the three axes of MFA after the sort (the significant values are in bold). The pertinent parameters for PC1 and/or PC2 are in bold.
The visual residue and visual residue 1min are highly correlated to firmness but anti-correlated to cohesiveness, and weakly correlated to η (0.01), σs and σcrossover. All the other correlations are presented in Table 15. Considering the value of cos2 of the instrumental parameters, the texture seems to be more relevant than rheology for these attributes. Figure 11 represents the correlation thanks to a heatmap, which highlights correlations with different colors. The dark blue color shows the strong anticorrelation, whereas the dark red color shows the strong correlation. The lower the color becomes, the lower the correlation.

Table 15.
Summary of strong and weak correlations between selected attributed and instrumental parameters.
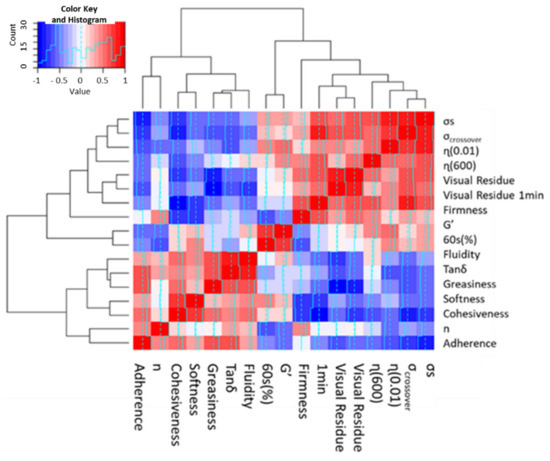
Figure 11.
Heatmap of the correlations with the selected attributes and parameters.
We can conclude that with the combination of the extrusion test associated with rheology, it is possible to determine the correct measurement for a specific attribute. Thus, the statistical methodology proposed will lead to the choice of the more efficient measure to correlate a specific attribute. This methodology may take long to develop, but once the instrumental protocols and parameters have been fixed, it should allow us to save time by limiting the sensory analysis step.
5. Conclusions
The aim of the study was to propose a methodology to discern correlation trends between sensorial attributes and instrumental parameters. Thirteen emulsions were selected and analyzed using rheological and textural measurements to position the products according to several parameters. Adopting multi-factorial analysis (MFA), sensorial and instrumental data were superposed, a first step towards finding correlation trends between the two. The statistical study of each product (PCA) optimized the instrumental measurements by eliminating certain non-significant and redundant parameters. Thus, the extrusion test can substitute visual residue, softness and greasiness 1 min attributes, and rheological measurement such as sweep test the adherence attribute. The measurement methods deployed fast and simple steps. The global correlation methodology is innovative and promising, creating correlating groups between sensory analyses and instrumental measurements for very different emulsion compositions and textures, with statistical tests not previously applied in this field. It allowed for the revealing of new correlations described in the above-cited references, but also the highlighting of new ones. It would be interesting to apply this strategy to more emulsions to refine correlation trends to make fewer instrumental measurements. This methodology could help to correlate more attributes that were not found in the present study. Furthermore, this methodology can be useful to the formulators during their development steps. They could compare different composition strategies and select the appropriate ingredients and concentrations for an optimized texture. Finally, the methodology can be used as a model for other cosmetic product categories.
Author Contributions
S.I., A.L., C.R., M.L., S.M.-T., C.B., A.-M.P.-L. and A.A. have contributed equally to this work. All authors have read and agreed to the published version of the manuscript.
Funding
This research received no external funding.
Institutional Review Board Statement
Not applicable.
Informed Consent Statement
Informed consent was obtained from all subjects involved in the study.
Data Availability Statement
Not applicable.
Acknowledgments
The authors would like to thank all the people in the EBI who took part in this research, as well as technicians from the Innovation and Development Department of Laboratoire de Biologie Végétale Yves Rocher.
Conflicts of Interest
The authors declare that they have no conflict of interest.
References
- Gilbert, L.; Picard, C.; Savary, G.; Grisel, M. Impact of Polymers on Texture Properties of Cosmetic Emulsions: A Methodological Approach: Assessing the Texture of Cosmetic Emulsions. J. Sens. Stud. 2012, 27, 392–402. [Google Scholar] [CrossRef]
- Civille, G.V.; Dus, C.A. Evaluating Tactile Properties of Skincare Products: Descriptive Analysis Technique. Cosmet. Toilet. 1991, 106, 83–88. [Google Scholar]
- Gilbert, L.; Savary, G.; Grisel, M.; Picard, C. Predicting Sensory Texture Properties of Cosmetic Emulsions by Physical Measurements. Chemom. Intell. Lab. Syst. 2013, 124, 21–31. [Google Scholar] [CrossRef]
- Eudier, F.; Hirel, D.; Grisel, M.; Picard, C.; Savary, G. Prediction of Residual Film Perception of Cosmetic Products Using an Instrumental Method and Non-Biological Surfaces: The Example of Stickiness after Skin Application. Colloids Surf. B Biointerfaces 2019, 174, 181–188. [Google Scholar] [CrossRef] [PubMed]
- Moravkova, T.; Filip, P. Relation between Sensory Analysis and Rheology of Body Lotions. Int. J. Cosmet. Sci. 2016, 38, 558–566. [Google Scholar] [CrossRef] [PubMed]
- Gilbert, L. Caractérisation Physico-Chimique et Sensorielle D’ingrédients Cosmétiques: Une Approche Méthodologique. Ph.D. Thesis, Université du Havre, Le Havre, France, 2014. [Google Scholar]
- Kulawik-Pióro, A.; Ptaszek, A.; Kruk, J. Effective Tool for Assessment of the Quality of Barrier Creams-Relationships between Rheological, Textural and Sensory Properties. Regul. Toxicol. Pharmacol. 2019, 103, 113–123. [Google Scholar] [CrossRef]
- Stern, P.; Valentova, H.; Pokorny, J. Relations between Rheological Ans Sensory Characteristics of Cosmetics Emulsions. SÖFW 1997, 123, 445–448. [Google Scholar]
- Adejokun, D.A.; Dodou, K. Quantitative Sensory Interpretation of Rheological Parameters of a Cream Formulation. Cosmetics 2019, 7, 2. [Google Scholar] [CrossRef]
- Calixto, L.S.; Infante, V.H.P.; Maia Campos, P.M.B.G. Design and Characterization of Topical Formulations: Correlations Between Instrumental and Sensorial Measurements. Aaps Pharmscitech 2018, 19, 1512–1519. [Google Scholar] [CrossRef] [PubMed]
- Lukic, M.; Jaksic, I.; Krstonosic, V.; Dokic, L.; Savic, S. Effect of Small Change in Oil Phase Composition on Rheological and Textural Properties of w/o Emulsion: Effect of Oil Phase Change on Emulsion Properties. J. Texture. Stud. 2013, 44, 34–44. [Google Scholar] [CrossRef] [PubMed]
- Smewing, J.; Jachowicz, J. Texture Analysis to Select Packagingand Formulate Hair Care Products. Cosmet. Toilet. 2007, 122, 107–112. [Google Scholar]
- Estanqueiro, M.; Amaral, M.H.; Sousa Lobo, J.M. Comparison between Sensory and Instrumental Characterization of Topical Formulations: Impact of Thickening Agents. Int. J. Cosmet. Sci. 2016, 38, 389–398. [Google Scholar] [CrossRef] [PubMed]
- Liu, C.; An, F.; He, H.; He, D.; Wang, Y.; Song, H. Pickering Emulsions Stabilized by Compound Modified Areca Taro (Colocasia Esculenta (L.) Schott) Starch with Ball-Milling and OSA. Colloids Surf. A Physicochem. Eng. Asp. 2018, 556, 185–194. [Google Scholar] [CrossRef]
- Tian, H.; Xiang, D.; Wang, B.; Zhang, W.; Li, C. Using Hydrogels in Dispersed Phase of Water-in-Oil Emulsion for Encapsulating Tea Polyphenols to Sustain Their Release. Colloids Surf. A Physicochem. Eng. Asp. 2021, 612, 125999. [Google Scholar] [CrossRef]
- Sila, A.; Martinez-Alvarez, O.; Krichen, F.; Gómez-Guillén, M.C.; Bougatef, A. Gelatin Prepared from European Eel (Anguilla anguilla) Skin: Physicochemical, Textural, Viscoelastic and Surface Properties. Colloids Surf. A Physicochem. Eng. Asp. 2017, 529, 643–650. [Google Scholar] [CrossRef]
- Gore, E.; Picard, C.; Savary, G. Spreading Behavior of Cosmetic Emulsions: Impact of the Oil Phase. Biotribology 2018, 16, 17–24. [Google Scholar] [CrossRef]
- Choi, H.-D.; Hong, J.S.; Pyo, S.m.; Ko, E.; Shin, H.-Y.; Kim, J.-Y. Starch Nanoparticles Produced via Acidic Dry Heat Treatment as a Stabilizer for a Pickering Emulsion: Influence of the Physical Properties of Particles. Carbohydr. Polym. 2020, 239, 116241. [Google Scholar] [CrossRef]
- Lê, S.; Josse, J.; Husson, F. FactoMineR: An R Package for Multivariate Analysis. J. Stat. Soft. 2008, 25. [Google Scholar] [CrossRef]
- Næs, T.; Berget, I.; Liland, K.H.; Ares, G.; Varela, P. Estimating and Interpreting More than Two Consensus Components in Projective Mapping: INDSCAL vs. Multiple Factor Analysis (MFA). Food Qual. Prefer. 2017, 58, 45–60. [Google Scholar] [CrossRef]
- Ben Jalloul, A.; Chaar, H.; Tounsi, M.S.; Abderrabba, M. Variations in Phenolic Composition and Antioxidant Activities of Scabiosa maritima (Scabiosa atropurpurea sub. maritima L.) Crude Extracts and Fractions According to Growth Stage and Plant Part. S. Afr. J. Bot. 2022, 146, 703–714. [Google Scholar] [CrossRef]
- Barnes, H.A. Rheology of Emulsions. In Interface Science and Technology; Elsevier: Amsterdam, The Netherlands, 2004; pp. 721–759. [Google Scholar]
- ISO/DIS 13299:2016; Sensory Analysis–Methodology–General Guidance for Establishing a Sensory Profile. International Organization for Standardization Sensory Analysis—Methodology—General Guidance for Establishing a Sensory Profile. International Organization for Standardization: Geneva, Switzerland, 2016.
- ISO/DIS 8586-1:1993; Sensory Analysis–Methodology-General Guidance for the Selection, Training and Monitoring of Asses-sors—Part 1: Selected Assessors. International Organization for Standardization Sensory Analysis—Methodology—General Guidance for the Selection, Training and Monitoring of Assessors—Part 1: Selected Assessors. International Organization for Standardization: Geneva, Switzerland, 1993.
- Bécue-Bertaut, M.; Pagès, J. Multiple Factor Analysis and Clustering of a Mixture of Quantitative, Categorical and Frequency Data. Comput. Stat. Data Anal. 2008, 52, 3255–3268. [Google Scholar] [CrossRef]
- Brummer, R.; Godersky, S. Rheological Studies to Objectify Sensations Occurring When Cosmetic Emulsions Are Applied to the Skin. Colloids Surf. A Physicochem. Eng. Asp. 1999, 152, 89–94. [Google Scholar] [CrossRef]
- Tadros, T. Application of Rheology for Assessment and Prediction of the Long-Term Physical Stability of Emulsions. Adv. Colloid Interface Sci. 2004, 108–109, 227–258. [Google Scholar] [CrossRef] [PubMed]
- Barnes, H.A. Rheology of Emulsions—A Review. Colloids Surf. A Physicochem. Eng. Asp. 1994, 91, 89–95. [Google Scholar] [CrossRef]
- Gallegos, C.; Franco, J.M. Rheology of Food, Cosmetics and Pharmaceuticals. Curr. Opin. Colloid Interface Sci. 1999, 4, 288–293. [Google Scholar] [CrossRef]
- Stanley, D.W.; Goff, H.D.; Smith, A.K. Texture-Structure Relationships in Foamed Dairy Emulsions. Food Res. Int. 1996, 29, 1–13. [Google Scholar] [CrossRef]
Publisher’s Note: MDPI stays neutral with regard to jurisdictional claims in published maps and institutional affiliations. |
© 2022 by the authors. Licensee MDPI, Basel, Switzerland. This article is an open access article distributed under the terms and conditions of the Creative Commons Attribution (CC BY) license (https://creativecommons.org/licenses/by/4.0/).