Article

Mosaic-CLSM Assessment of Bacterial Spatial Distribution in Cosmetic Matrices According to Matrix Viscosity and Bacterial Hydrophobicity

by
Samia Almoughrabie
1,
Chrisse Ngari
2,
Romain Briandet
1,
Valérie Poulet
2 and
Florence Dubois-Brissonnet
1,*
1
Micalis Institute, INRAE, AgroParisTech, Université Paris-Saclay, 78350 Jouy-en-Josas, France
2
Laboratoires Clarins, 5 Rue Ampère, 95300 Pontoise, France
*
Author to whom correspondence should be addressed.
Cosmetics 2020, 7(2), 32; https://doi.org/10.3390/cosmetics7020032
Submission received: 26 March 2020 / Revised: 21 April 2020 / Accepted: 5 May 2020 / Published: 11 May 2020
(This article belongs to the Special Issue Feature Papers in Cosmetics in 2020)

Abstract

:
The reliability of the challenge test depends, among other parameters, on the spatial distribution of microorganisms in the matrix. The present study aims to quickly identify factors that are susceptible to impair a uniform distribution of inoculated bacteria in cosmetic matrices in this context. We used mosaic confocal laser scanning microscopy (M-CLSM) to obtain rapid assessment of the impact of the composition and viscosity of cosmetic matrices on S. aureus spatial distribution. Several models of cosmetic matrices were formulated with different concentrations of two thickeners and were inoculated with three S. aureus strains having different levels of hydrophobicity. The spatial distribution of S. aureus in each matrix was evaluated according to the frequency distribution of the fluorescence values of at least 1350 CLSM images. We showed that, whatever the thickener used, an increasingly concentration of thickener results in increasingly bacterial clustered distribution. Moreover, higher bacterial hydrophobicity also resulted in a more clustered spatial distribution. In conclusion, CLSM-based method allows a rapid characterization of bacterial spatial distribution in complex emulsified systems. Both matrix viscosity and bacterial surface hydrophobicity affect the bacterial spatial distribution which can have an impact on the reliability of bacterial enumeration during challenge test.

1. Introduction

Controlling the contamination of cosmetic products is essential to avoid alterations of their organoleptic characteristics (color, odor, composition, etc.) and maintain their innocuity for consumers. These products can be contaminated during the processing or by consumer’s repetitive usage. Among other pathogens, Staphylococcus aureus has been found in various cosmetic products [1,2]. This Gram-positive bacterium is present on the skin and mucous membranes of 30% of the population [3] and causes a wide range of skin infections such as abscesses, furuncles, impetigo, etc. [4,5].
Each cosmetic product is characterized by a level of microbiological risk according to the standard ISO 29621:2017, which depends on several parameters such as the formula composition (preservative, ethanol, water activity, pH) or the type of packaging (unidose, airless pump, pots) [6,7].
The preservation efficiency of a cosmetic product is evaluated by a challenge test, as defined in the European standard EN ISO 11930:2019. This procedure consists in artificially inoculating a product with a target microorganism at a defined concentration that is between 105 and 106 CFU mL−1 for bacteria. The evolution of the microbial population is then monitored at defined intervals for 28 days. A preservative system is considered efficient if, after seven days of inoculation, the formula composition leads to a bacterial logarithm reduction ≥3 and if there is no growth of bacteria after 14 and 28 days.
Cosmetic products are complex systems, resulting from a mixture of an aqueous phase, a lipophilic phase and an emulsifier. Thus, the evaluation of their microbiological contamination is a major challenge. The reliability of the challenge test could be related to the spatial distribution of microorganisms in the matrix [8]. Microbial clustering can indeed influence the effectiveness of sampling plans. If the bacterial spatial distribution is heterogeneous, the probability of failing to detect a pathogen in a batch is higher than if the distribution is uniform and this can have negative consequences on public health [9]. Many factors can affect contaminant distribution, such as the inoculum preparation step [10,11,12], inoculum concentration [13], precision of serial dilutions [14], microbial growth or death, sampling process (partitioning, mixing) [15,16] and composition and structure of the matrix [17]. In complex systems, many types of physico-chemical interactions are involved between bacteria and matrix components, including van der Waals, electrostatic, Lewis acid–base and hydrophobic interactions [18]. These interactions depend on the properties of the suspending media (ionic strength, temperature) and the interfacial physico-chemical properties of both bacterial and matrix components. Bacterial cell-surface properties have already been demonstrated to influence bacterial interactions with food-matrix components [19,20] and stability of the emulsion [21,22,23]. In addition, matrix viscosity may also influence bacterial distribution. Thickeners are added to several types of cosmetic products to stabilize the system and prevent creaming or sedimentation [24]. The most common thickeners are natural nonionic (guar gum) or anionic (xanthan gum, carrageenan and alginates) polysaccharides [25]. Synthetic polyacrylates, such as carbomers, are also widely used in cosmetics. They have a low thickening power in acidic medium, but the addition of a base, such as tromethamine, neutralizes the carboxylic acid groups, which increases the electric charge of the macromolecules, causing their expansion in the formula [25]. The hydroxyethyl acrylate/sodium acryloyl dimethyl taurate copolymer, used in this study, is a pre-neutralized polyacrylate copolymer with many functions, including those of a stabilizer, texturizer and emulsifier.
Confocal laser scanning microscopy (CLSM) was extensively used to explore biofilm structure after cell labeling with fluorescent markers. It enables non-destructive fluorescence investigation of bacterial distribution, physiological heterogeneity and spatial organization in such three-dimensional communities [26,27]. Direct bacterial observation has also been achieved in thick systems, such as dairy matrices [13,28,29]. Here, we took advantage of the confocal laser scanning microscopy to characterize the spatial distribution of S. aureus in oil-in-water (O/W) emulsified matrices according to the matrix structure and bacterial surface properties.

2. Materials and Methods

2.1. Bacterial Strains and Culture Conditions

The strains used in this study were S. aureus CIP 4.83, S. aureus ATCC 29213 and S. aureus ATCC 27217. S. aureus CIP 4.83 is a strain recommended by the EN ISO 11930:2019 standard for cosmetic-product challenge tests. Each strain, stored in cryovials at −80 °C, was resuscitated by two successive subcultures in tryptic soy broth (TSB) before each experiment. Cultures were grown at 30 °C until the end of the exponential growth phase.
The bacterial inoculum was calibrated to 1010 to 1011 CFU.mL−1 in 150 mM NaCl in order to observe at least 10–100 bacteria per CLSM image (290.62 × 290.62 × 1.6 µm3). S. aureus cells were labeled with 2 µL Syto 9 (3.34 mM in DMSO, Life Technologies) and incubated in the dark for 1 h at room temperature. Syto 9 is a green cell-permeable nucleic-acid marker that stains live and dead bacteria. One gram of matrix in a 50 mL centrifuge tube was inoculated with the stained inoculum and vortexed for 30 s.

2.2. Chemicals and Materials

Acrylate copolymer, cetearyl glucoside and glyceryl stearate were purchased from SEPPIC (Puteaux, France), carbomer from Gattefossé (Lyon, France), glycerin from Oleon (Ertvelde, Belgium), cetearyl isononanoate from BASF France (Lyon, France), tocopheryl acetate from DSM (Heerlen, The Netherlands), tromethamine from Azelis (Heusden, Belgium) and guar gum and hexadecane from Sigma-Aldrich (Saint-Quentin Fallavier, France).
When necessary, 200 µL of latex green fluorescent beads latex (L4655, carboxylate-modified polystyrene, 1 µm) from Sigma-Aldrich were added to the model matrices at a concentration of 4.75 × 10¹⁰ beads mL−1.

2.3. Characterization of Bacterial Surface Properties

2.3.1. Bacterial Surface Hydrophobicity

S. aureus surface hydrophobicity was measured by bacterial adherence to hydrocarbons (BATH) [30]. Bacterial cells were harvested by centrifugation at 1575× g for 10 min and resuspended to an OD400 of 0.8 in 150 mM NaCl, precisely measured and noted as A0. Hexadecane (0.25 mL) was added to 1.5 mL of bacterial suspension. The two-phase system was vortexed for 2 min and allowed to separate for 15 min at room temperature before the OD400 was measured in the aqueous phase (A1). The percentage of solvent affinity was calculated as: the percentage of solvent affinity = (1 − A1/A0) × 100. Each experiment was performed in triplicate with independently grown cultures.

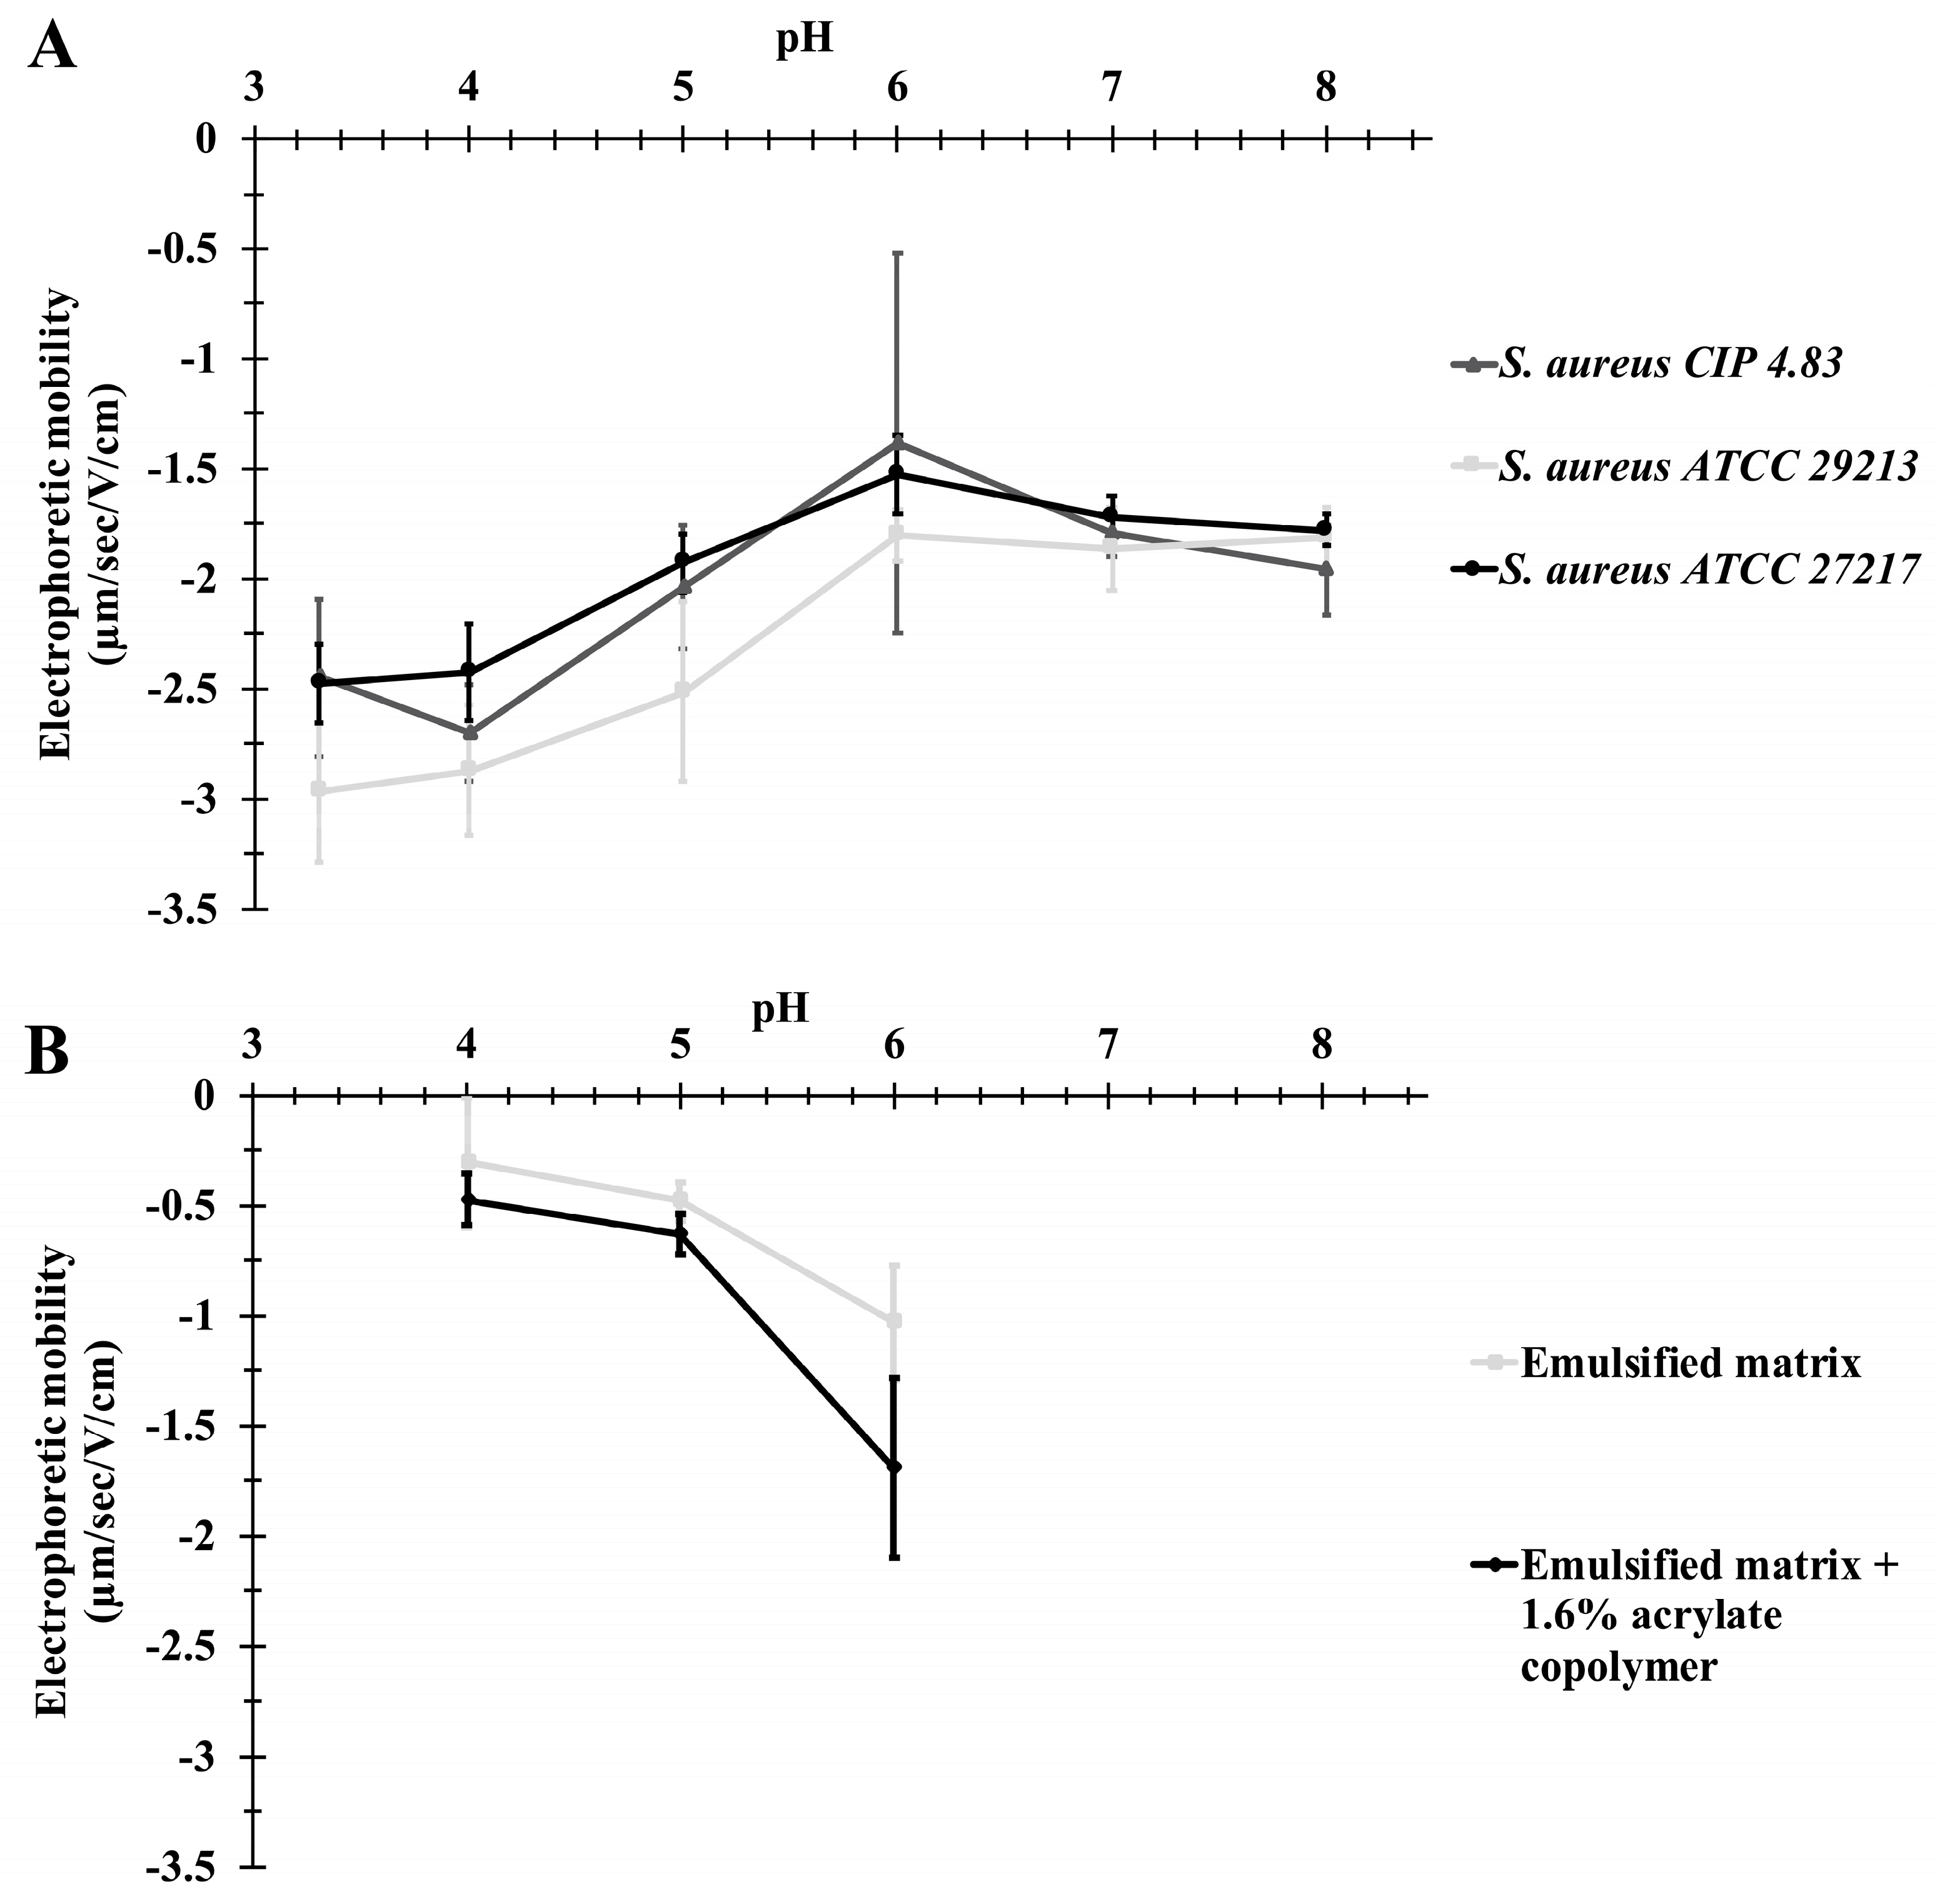
2.3.2. Bacterial Electrophoretic Mobility

The bacterial electrophoretic mobility (EM) was measured by determining the rate at which bacteria migrate in a constant electric field (120 mV). EM was assessed using a Zetameter ZetaCOMPACTTM from CAD instrumentation (Les Essarts le Roi, France). Bacterial cells were harvested by centrifugation at 1575× g for 10 min, washed twice in 150 mM NaCl, and resuspended in several phosphate buffers with a pH from 3 to 8. Each measurement recorded the movements of approximately 100 individual bacterial cells by automated video analysis. Each experiment was performed at least six times with two independent cultures.

2.4. Cosmetic Matrices

2.4.1. Commercial Matrices

Six commercial matrices (Laboratoires CLARINS, Pontoise, France), named from 1 to 6, were selected to represent the main emulsified cosmetic products, such as body lotions or creams.

2.4.2. Preparation of the Emulsified Model Matrix (35/65 O/W%)

The aqueous phase was first prepared with 0.25% carbomer in water, with the addition of acrylate copolymer (0.4% to 1.6%) when necessary and heated to 75 °C before glycerin (moisturizer, 9%) was added. The oil phase, composed of 28.8% cetearyl isononanoate (emollient), 3.5% cetearyl glucoside (emulsifier), 0.2% tocopheryl acetate (antioxidant) and 2.5% glyceryl stearate (co-emulsifier), was heated to 75 to 80 °C before being blended with the aqueous phase at 1800 rpm using a rotor-stator homogenizer (Rayneri 33/300P, Group VMI) to obtain an emulsion. Tromethamine (base, 0.15%) was finally added. Guar gum was pre-mixed with glycerin and added to a final concentration of 2.5% when necessary.

2.5. Characterization of the Emulsified Matrices

2.5.1. Viscosity Measurements

The viscosity of industrial or model matrices was measured by penetrometry using a penetrometer (PNR10, PetroMesures). A specific cone was released in 300 g of matrix and the penetration depth measured (in mm ± 0.1 mm) after 5 s: the deeper the cone sinks into the matrix, the softer the matrix. Three replicates were performed for each measurement.

2.5.2. Determination of Lipid Droplet Electrophoretic Mobility

Emulsified matrices, with or without acrylate copolymer, were diluted 1500 times in appropriate phosphate buffer prior to analysis. Electrophoretic mobility (EM) was measured at pH 4 to 6 using a ZetaCOMPACTTM Zetameter (CAD instrumentation; Les Essarts le Roi, France).

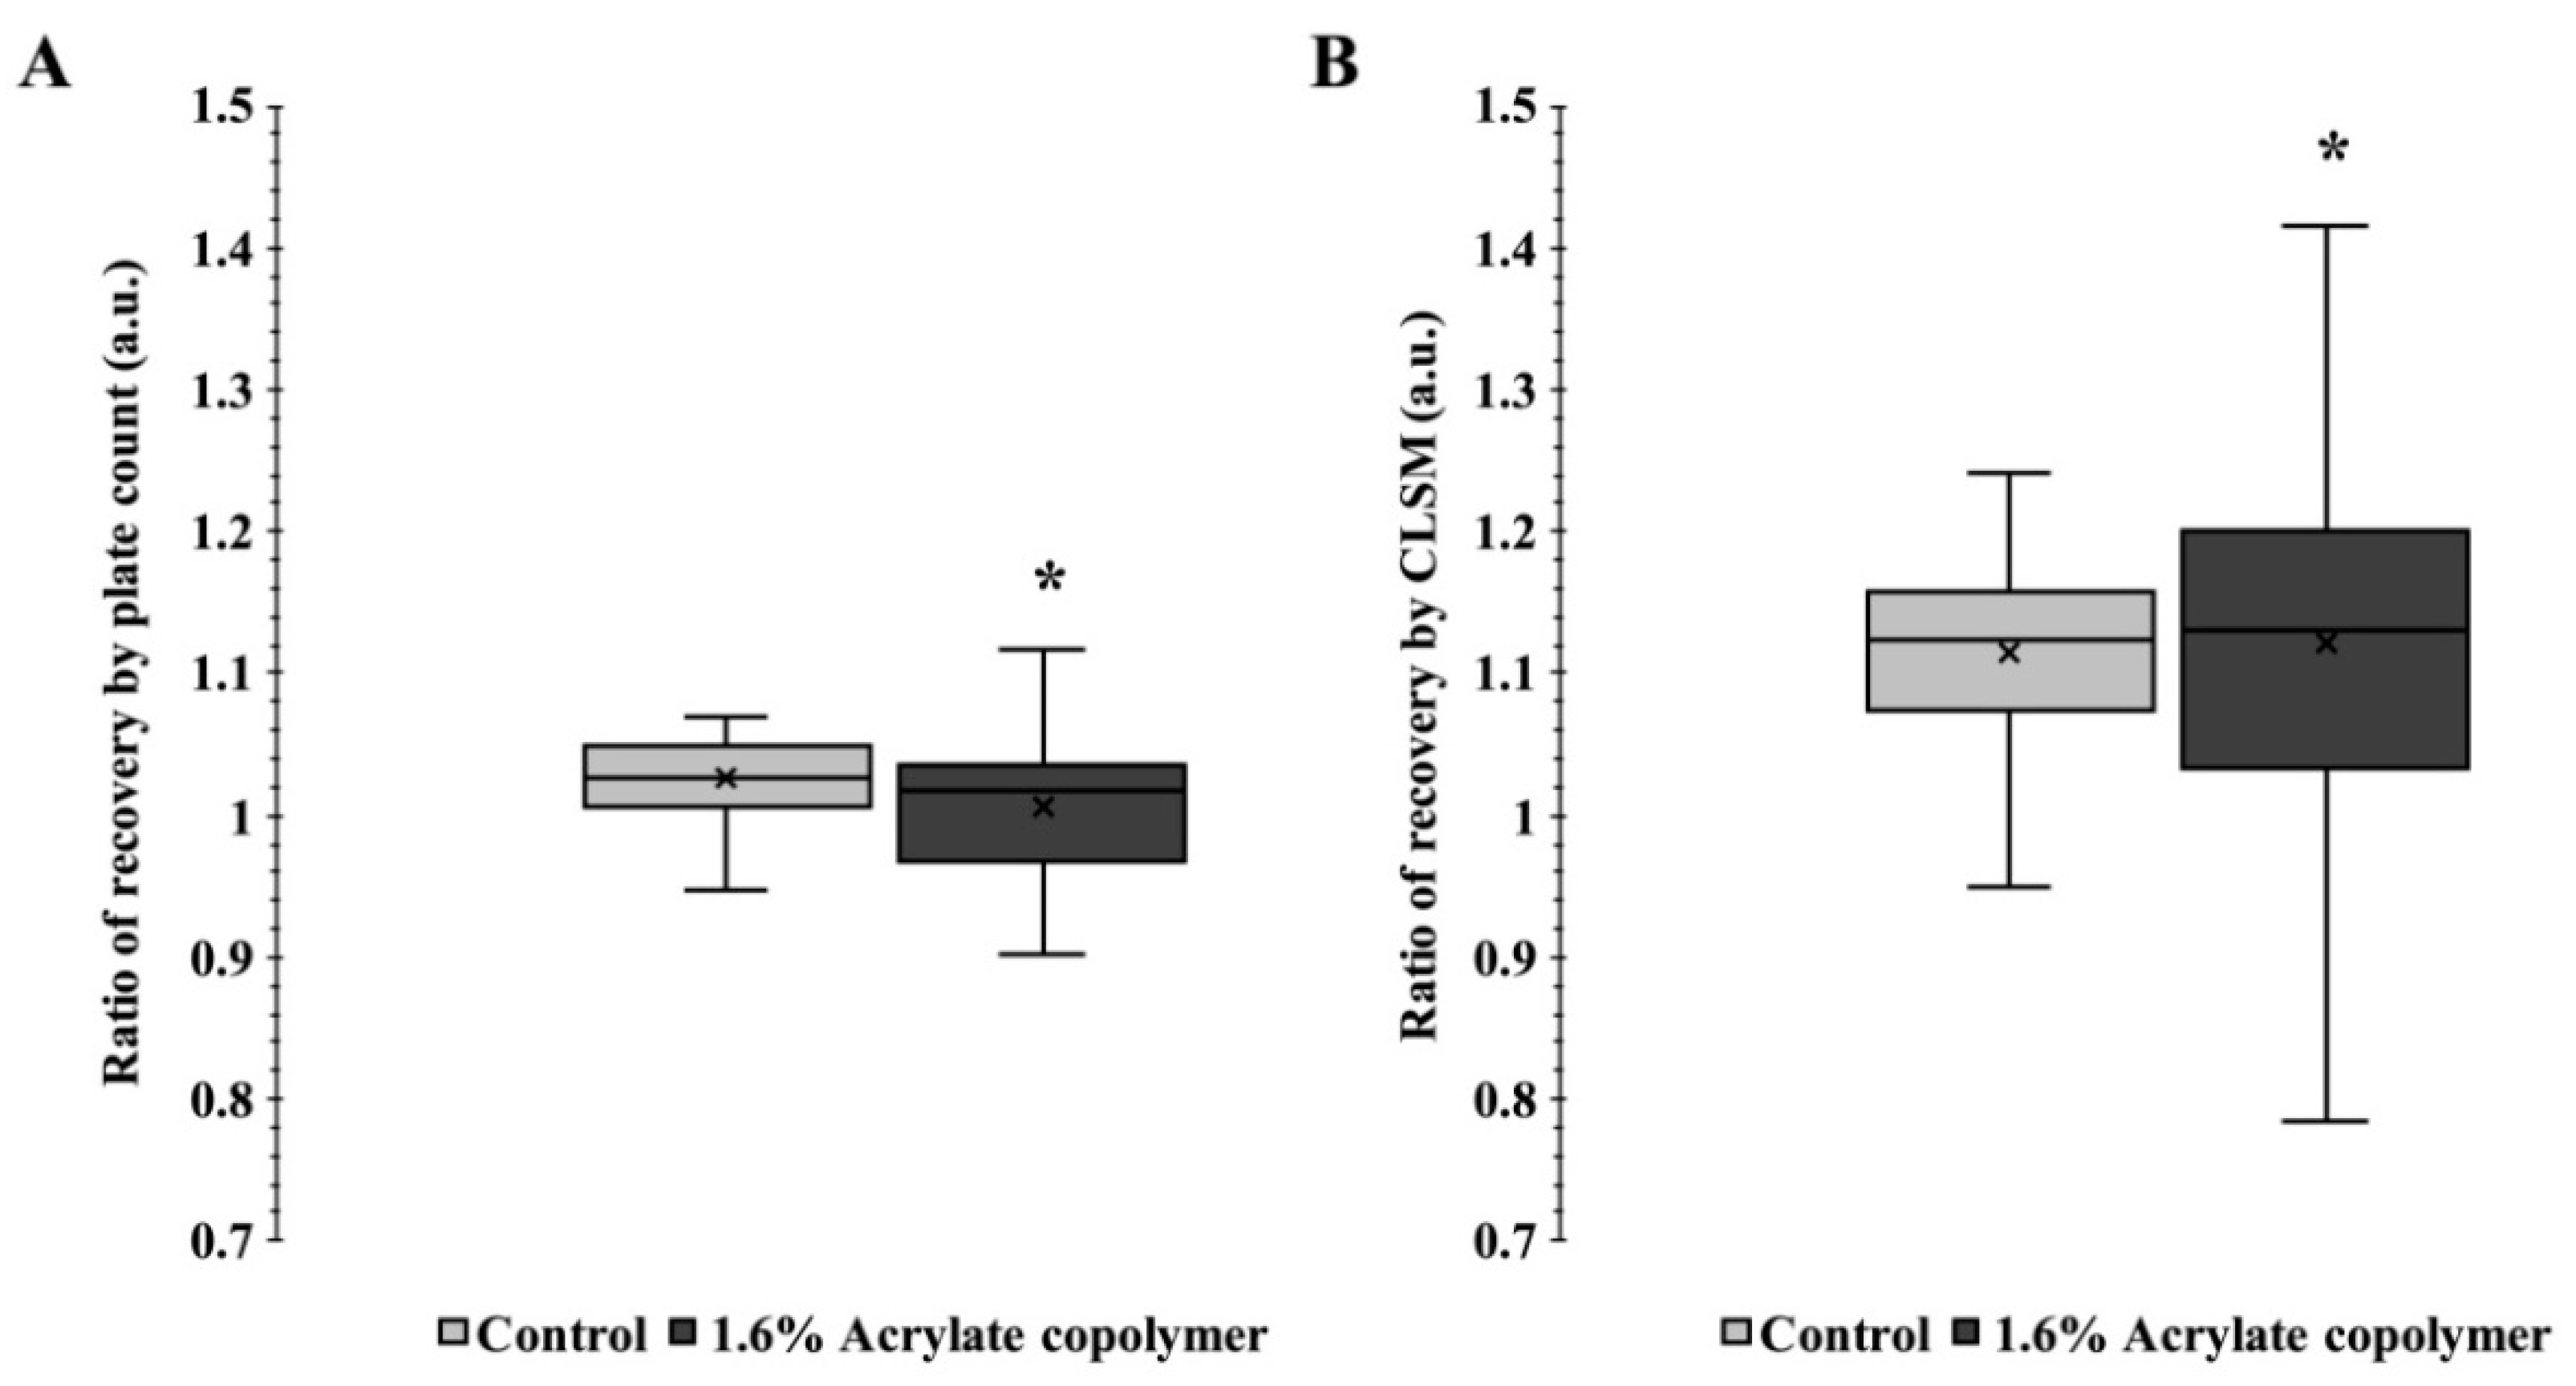
2.6. Enumeration of the Bacterial Population

Just after bacterial inoculation, 15 samples were harvested from different locations of the contaminated matrix and enumerated by serial dilution. Enumeration was performed on tryptone soya agar (TSA, BioMérieux) by the drop-plate method [31]. Plates were incubated at 30 °C for 24 to 48 h before counting. Each experiment was performed in triplicate. The ratio of recovery is the log CFU/g divided by the log inoculated CFU/g. The enumerated bacterial population was similar to the level of inoculation if the ratio of recovery is equal to 1 (Figure 3A).

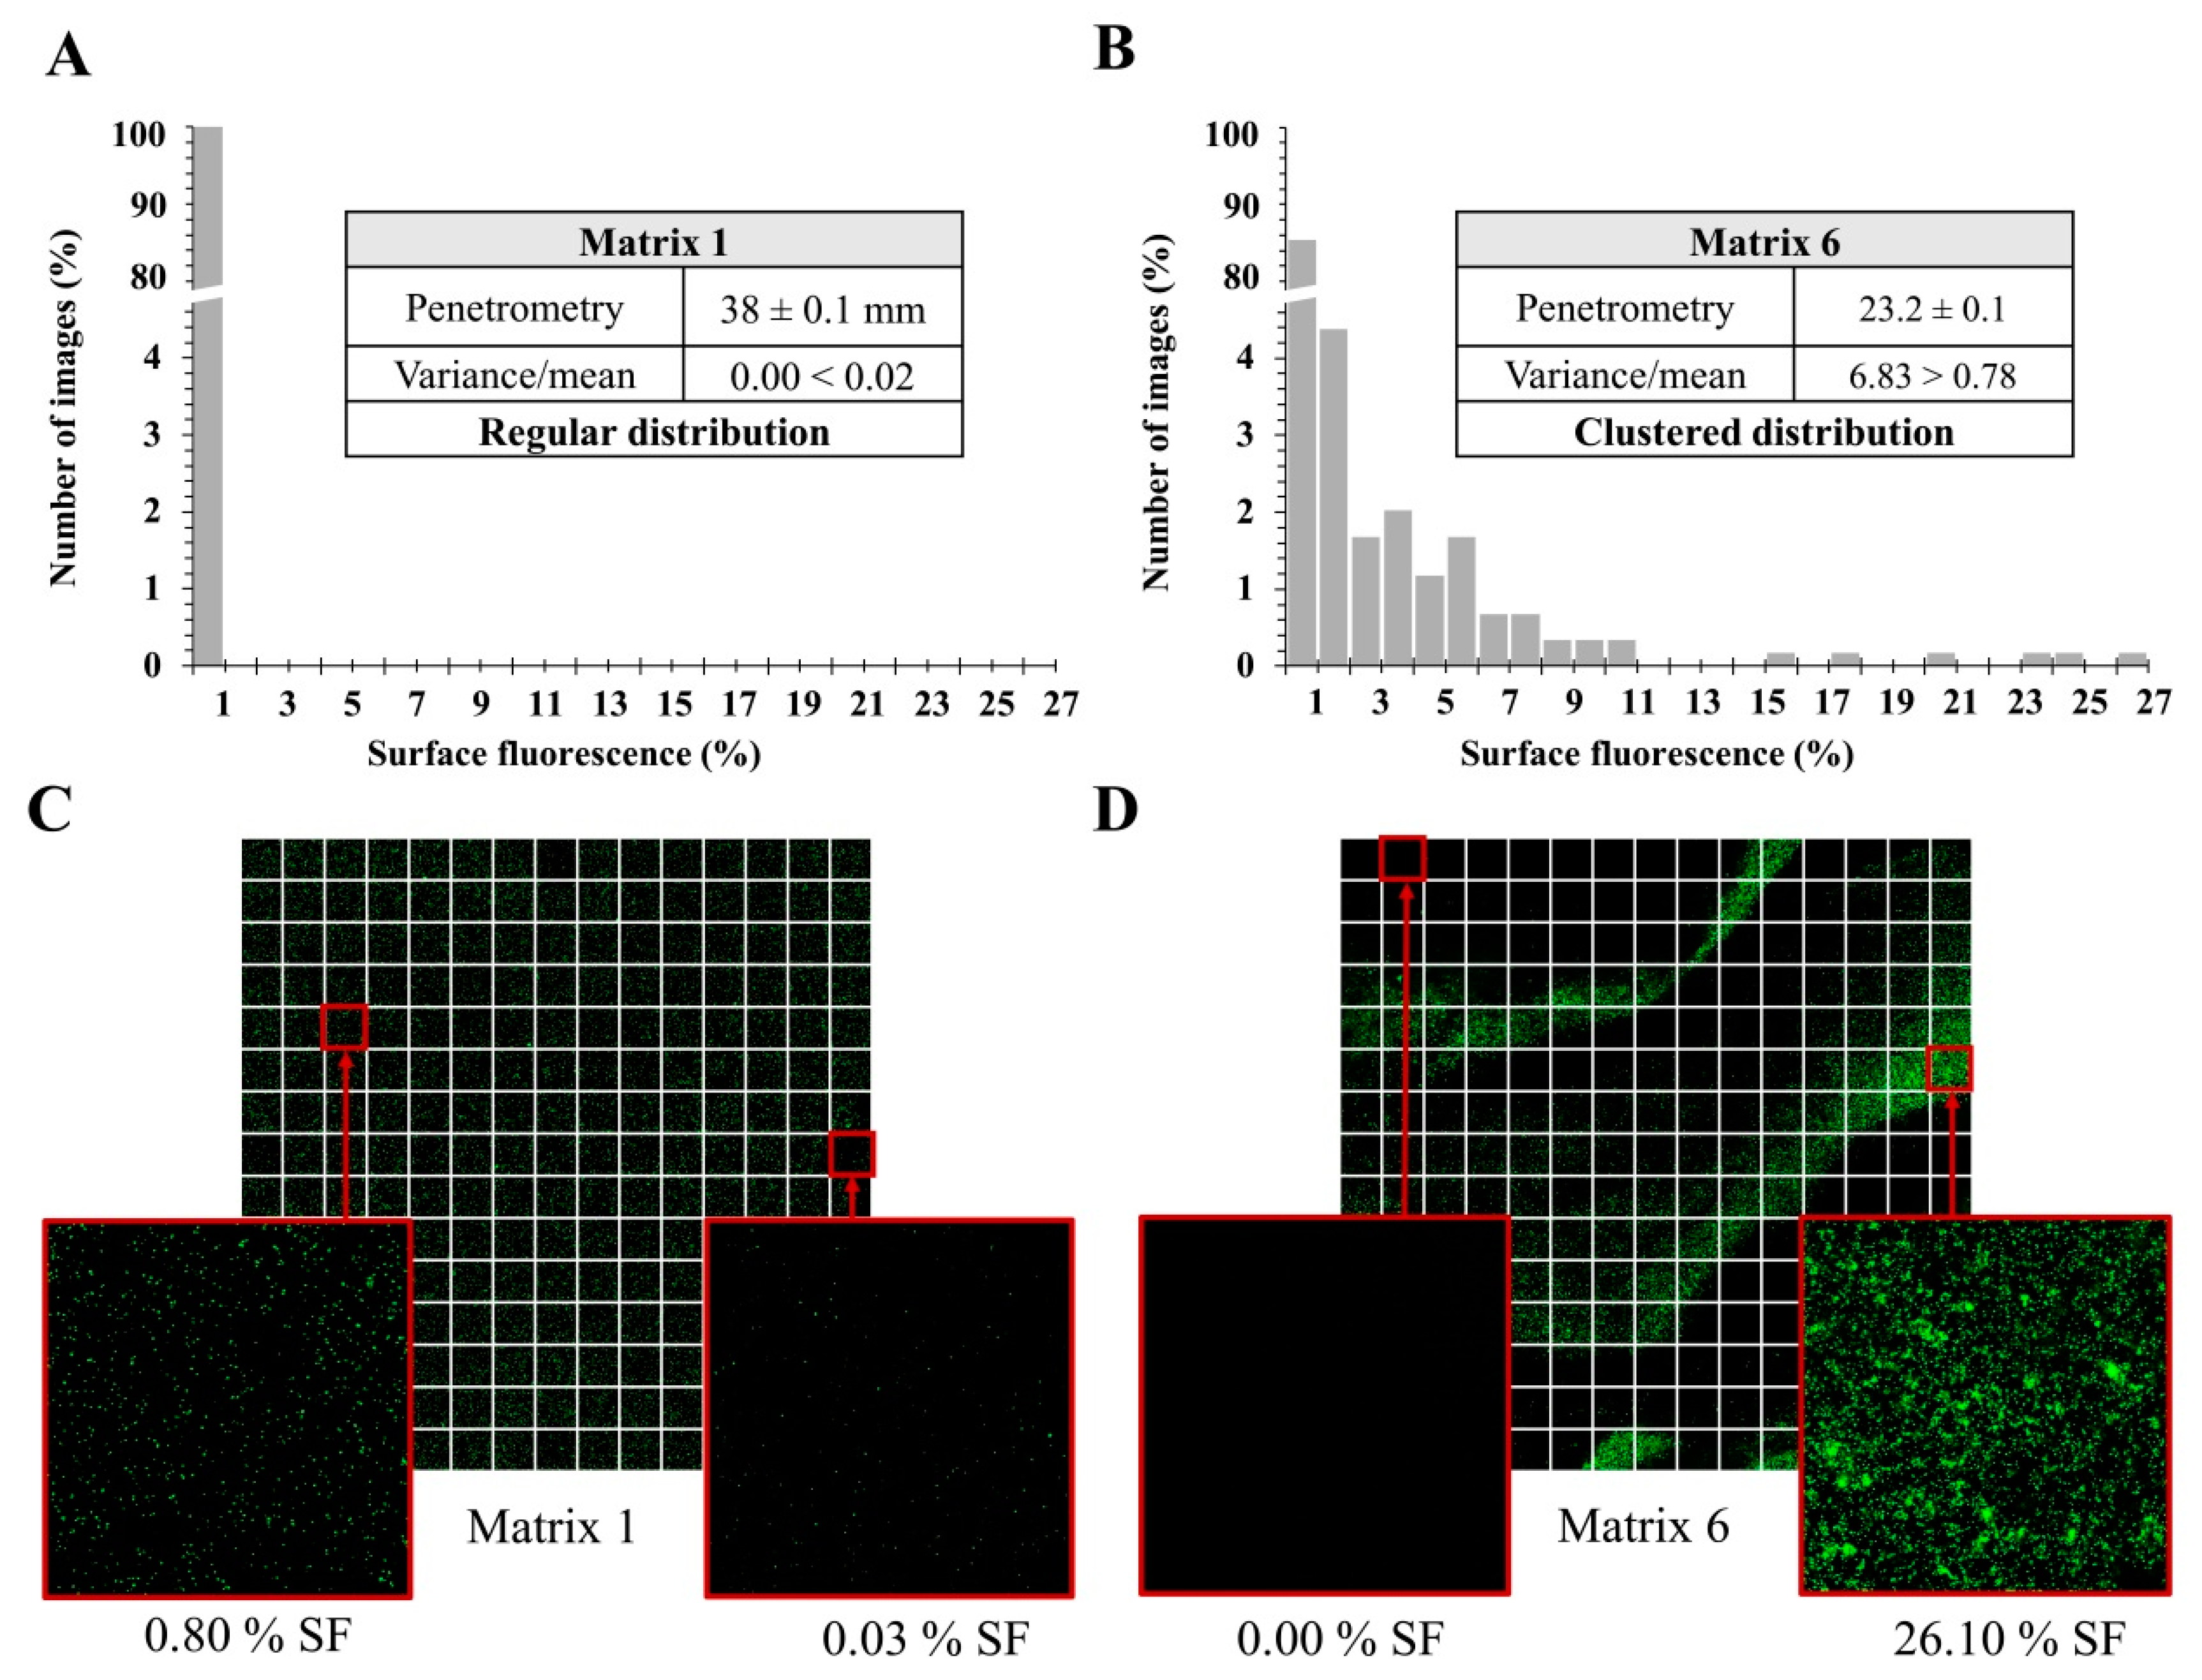
2.7. Mosaic-Confocal Laser Scanning Microscopy (M-CLSM) and Image Analysis

The inoculated matrix was dropped into the wells of polystyrene 96-well microtiter plates (Greiner Bio-One, France). Image acquisition was performed using a Leica SP8 AOBS Confocal Laser Scanning Microscope (Leica Microsystems, France) at the INRAE MIMA2 microscopy platform (https://doi.org/10.15454/1.5572348210007727E12). Syto 9 and Nile red were excited at 488 nm and 561 nm and the emitted fluorescence collected from 498 to 560 nm and 630 to 750 nm, respectively.
Each image was acquired using a 40× air objective (N.A. = 0.85) and its size was 290.62 × 290.62 × 1.6 µm3 (512 × 512 pixels). The CLSM control software was programmed to take in each well a mosaic of 15 × 15 images, each image corresponding to an observed volume of 1.3 × 10⁻⁷ mL. Acquiring mosaics instead of single images allows to visualize bigger volumes of matrix and to decrease the detection threshold per gram. For commercial matrices, a mosaic was acquired in three well for each experiment and experiments were performed in duplicate (1350 images in total for each condition). For model matrices, a mosaic was acquired in 5 wells for each experiment and experiments were performed in triplicate (3375 images in total for each condition).
The percentage of surface fluorescence (SF) for each image was calculated by binarizing the images using the MaxEntropy function in an automatic macro executed in the ImageJ software, (National Institutes of Health, Bethesda, Md., USA) [32]. In our experimental conditions, the range of SF that can be visualized on one image is between 0.0005% (one bacteria) to 100% (over 2 × 10⁵ bacteria).
The equivalent CFU mL−1 for each image acquired by CLSM was calculated first by dividing the SF of the image by the SF of one bacterium leading to a number of bacteria per image. Bacterial concentration was then calculated in bacteria per g taking into account the volume observed for one image and the matrix density (1.15 g/mL). The ratio of recovery is the equivalent log bacteria/g divided by log inoculated CFU/g.

2.8. Statistical Analysis

The bacterial spatial distribution was quantified by calculating the frequency distribution, the mean and the variance of the fluorescence values. A variance superior, equal or inferior to its mean indicates a clustered, uniform or regular spatial distribution, respectively [15].
All statistical analyses were performed using a free version of XLSTAT (Addinsoft). Factors were considered to have a statistically significant effect for a critical probability associated with the Fisher test p value lower than 0.05.

3. Results

3.1. Determination of Bacterial Surface Properties

3.1.1. Bacterial Surface Hydrophobicity

The three S. aureus strains were chosen according to their hydrophobicity to evaluate the impact of bacterial surface properties on bacterial distribution in matrices. S. aureus CIP 4.83 was the most hydrophobic strain (95% affinity for hexadecane), whereas S. aureus ATCC 292312 and ATCC 27217 had 76% and 42% affinity, respectively. We have also tested the behavior of fluorescent polystyrene microspheres. These inert beads have similar morphology to that of S. aureus (sphere of 1 µm in diameter) but are more hydrophilic than the tested bacteria (5% affinity for hexadecane).

3.1.2. Bacterial Surface Charge

The electrophoretic mobility of the three strains was measured at a pH from 3 to 8 (Figure 1A). All strains were negatively charged at an ionic strength of 1 mM. Their electrophoretic mobility was near −3 µm s−1 V−1 cm−1 at pH 3, increased to approximatively −1.5 µm s−1 V−1 cm−1 at pH 6, and remained constant from pH 6 to 8. There was no significant difference in electrophoretic mobility between the three strains.

3.2. Determination of Matrix Properties

3.2.1. Matrix Viscosity

Among the six commercial cosmetic matrices, matrices 1 and 4, which were body lotions, had penetrometry values of 38.0 ± 0.1 mm and 34.1 ± 0.2 mm, respectively. Matrices 2, 3, 5 and 6 were creams and had penetrometry values of 35.2 ± 0.4 mm, 34.4 ± 0.1 mm, 32.1 ± 0.6 mm and 23.2 ± 0.1 mm, respectively.
Model matrices formulated with 0%, 0.4%, 0.8% or 1.6% acrylate copolymer had penetrometry values of 31.5 ± 0.4 mm, 28.5 ± 0.3 mm, 27.7 ± 0.4 mm and 26.6 ± 0.3 mm, respectively. Those with 2.5% guar gum had a penetrometry value of 25.5 ± 0.4 mm.

3.2.2. Matrix Droplet Electrophoretic Mobility

Model matrices had a pH between 5 and 6. The mobility of droplets was near zero at pH 4 and slightly decreased from pH 5 to 6 for matrices with or without acrylate copolymer (Figure 1B). There was no significant difference between the electrophoretic mobility of droplets in either matrix.

3.3. Bacterial Spatial Distribution in Commercial Emulsions

We assessed the spatial distribution of S. aureus CIP 4.83 in six commercial cosmetic matrices of various viscosities by CLSM imaging to identify the formulas in which uniform homogenization is not complete.
Figure 2A,B shows the frequency distribution of surface fluorescence (SF), the mean and the variance for two of the six matrices taken as an example. For matrix 1, the variance of the SF was inferior to the mean, which indicates a bacterial regular distribution. Figure 2C illustrates the regular distribution in matrix 1 showing one series of 225 images. Matrices 2 to 5 showed a similar regular distribution with SF means between 0.03% and 0.45% (data not shown). The matrices 1 to 5 had low viscosities, with penetration values superior to 32 mm. In contrast, matrix 6 showed a bacterial clustered distribution with a variance of SF superior to the mean (Figure 2B,D). Matrix 6 had the highest viscosity, with a penetration value of 23.2 ± 0.1 mm.

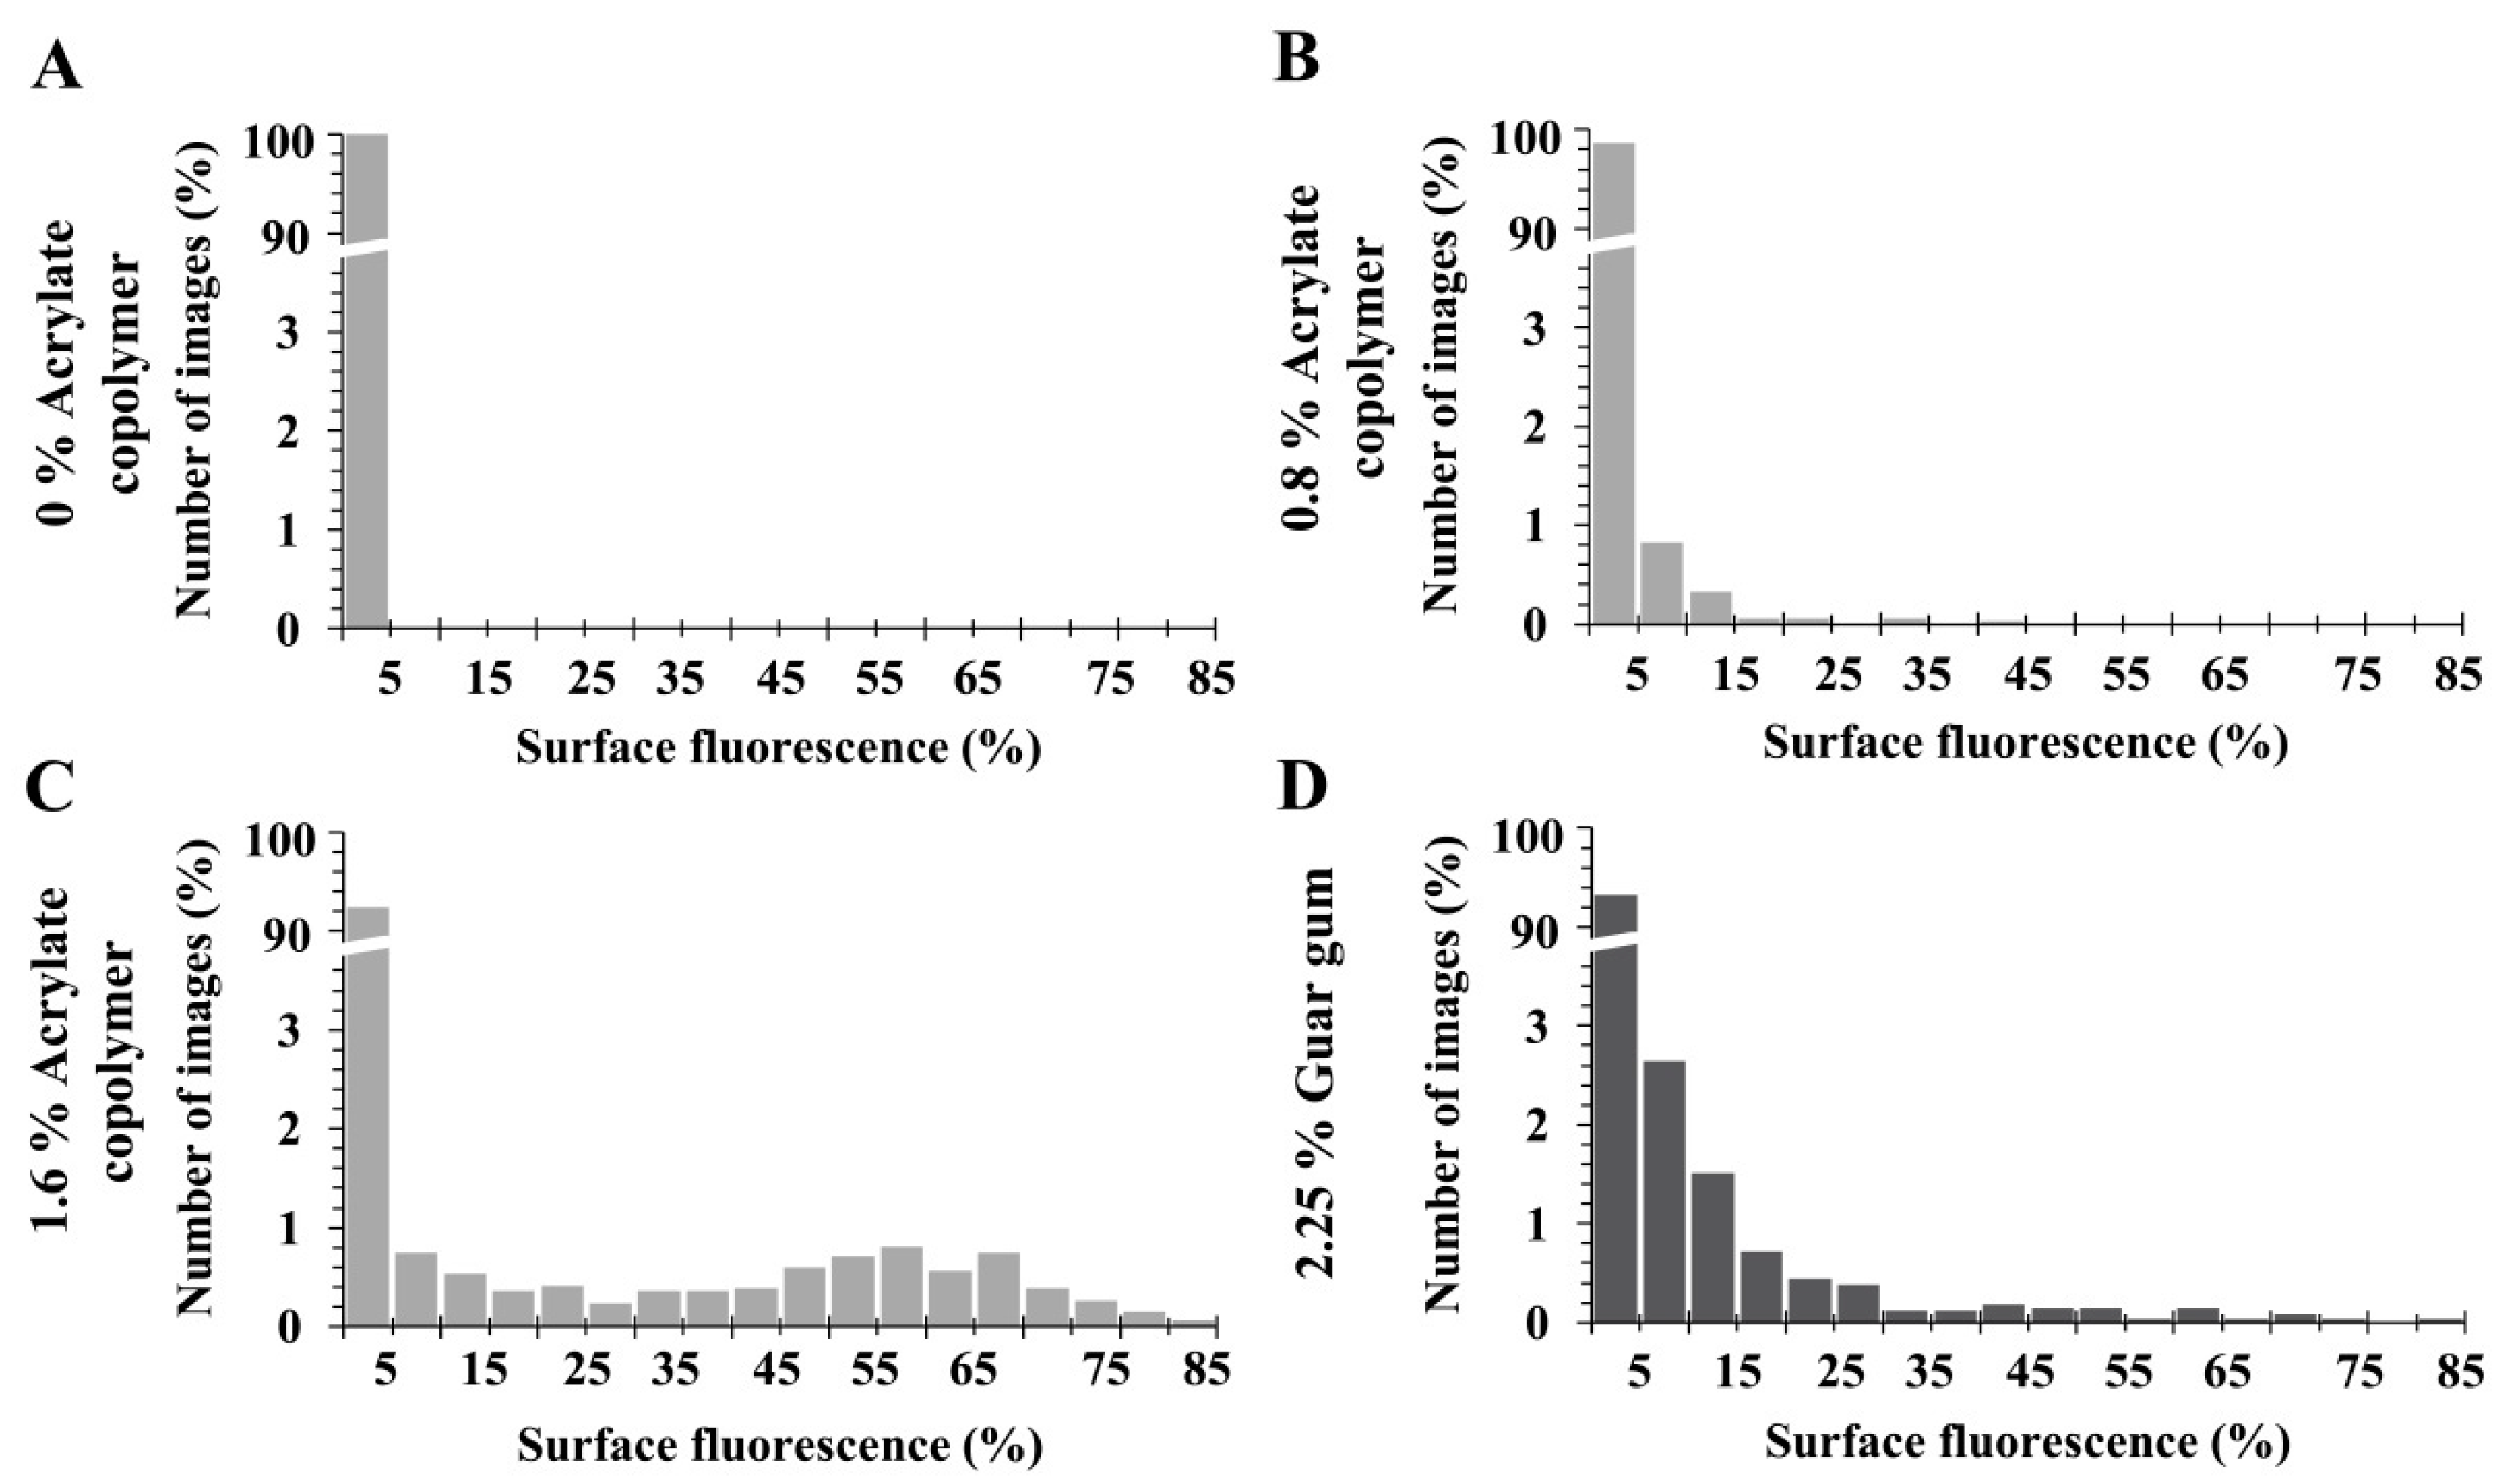
3.4. Bacterial Spatial Distribution and Enumeration in Matrices with Thickener

From the composition of matrix 6, several assays were conducted to identify the component that has impaired the regular distribution of S. aureus in the matrix. It appears to be the acrylate copolymer (data not shown). To confirm the impact of its presence, we formulated two emulsified model matrices, without or with acrylate copolymer at 1.6% and evaluated the ratio of recovery between the initial inoculum and by plate count (Figure 3A) or by M-CLSM enumeration (Figure 3B). Bacterial enumeration for both methods was significantly more variable in matrices with 1.6% acrylate copolymer than in those without acrylate copolymer (p < 0.05). We can note a higher variability for enumeration by CLSM imaging than by plate count. This is due to the substantially smaller volume analyzed by CLSM (1.3 × 105 µm3) which is equivalent to 1.5 × 10⁻⁷ g in comparison of 1 g by plate count.
We further investigated the impact of the concentration of thickener by formulating four model matrices with 0%, 0.4%, 0.8% or 1.6% acrylate copolymer and inoculating them with three different S. aureus strains or fluorescent beads. The frequency distribution of surface fluorescence was more dispersed with increasing acrylate copolymer concentration, regardless of the strain. The variance was superior to the mean for the 0.8% and far more for the 1.6% acrylate copolymer resulting in a bacterial clustered distribution (Table 1). Without acrylate copolymer or with 0.4%, the variance was inferior to the mean resulting in a regular distribution. The results were similar for hydrophilic beads which were regularly distributed in matrices with 0% to 0.4% acrylate copolymer, in contrast to 0.8% and 1.6% (Table 1). The Figure 4 illustrates the frequency distribution according to the concentration of acrylate copolymer or guar gum for S. aureus CIP 4.83.
We intend next to determine if the bacterial clustered distribution is due to the viscosity which increases when the concentration of acrylate copolymer increases or if it is due to the thickener itself. We thus formulated model matrices with guar gum, another thickener. The viscosity obtained with 2.5% guar gum was similar to that obtained with 1.6% acrylate copolymer (25.5 ± 0.4 mm versus 26.6 ± 0.3 mm). The spatial distribution of S. aureus was clustered with the guar gum (Table 1), but not without, regardless of the strain. The results were similar for hydrophilic beads (Table 1).

3.5. Spatial Distribution of Three S. aureus Strains According to Their Level of Hydrophobicity in Matrices with Thickener

Spatial distribution was not affected by the level of hydrophobicity for the three bacterial strains in matrices with 0% or 0.4% acrylate copolymer (Table 1). Conversely, in the matrix with 1.6% acrylate copolymer, the variance of SF was highly superior to the mean and have reached 176.26 for S. aureus CIP 4.83, 11.32 for S. aureus ATCC 29213 and 8.43 for S. aureus ATCC 27217 (Table 1). The most hydrophobic strain has also shown the most clustered spatial distribution in the matrix with 2.5% guar gum. Hence, the spatial distribution was increasingly clustered with increasing hydrophobicity of the strain in high viscosity matrices.

4. Discussion

The study of the spatial distribution for three S. aureus strains with different levels of hydrophobicity in several matrices with specific characteristics allowed us to understand the determinants of their distribution. First, we succeeded to obtain accurate M-CLSM images that allow rapid characterization of the bacterial spatial distribution in emulsified matrices. Despite the light diffraction by high lipid-content droplets, we optimized the settings to obtain high resolution images with a low fluorescence background signal. The mosaic mode allowed lowering the threshold of bacterial enumeration and each mosaic image (225 images) was quickly acquired in only eight minutes. An ImageJ macro was developed to batch, accelerate and standardize image quantification. Furthermore, we have used the method of Jongenburger et al. [15], highly relevant to statistically analyze the dispersion of bacterial spatial distribution in matrices. The frequency distribution was evaluated and the comparison of the variance and the mean of SF values (1350 to 3375 images per condition) allowed classifying the bacterial spatial distribution as clustered, uniform or regular. M-CLSM appears to be a quick and relevant in situ approach for both bacterial enumeration and investigation of spatial distribution in complex matrices.
The results demonstrated that an increasingly viscous matrix, due to increase in the thickener concentration, results in a bacterial increasingly clustered distribution. By consequence, the heterogeneity of the enumeration results, affected by the clustered bacterial spatial distribution, also appeared to be driven by matrix viscosity (Figure 2, Table 1). In the field of metal production, in which metallic particles are added before solidification, the distribution of such particles is critical and can affect the quality of the final product. It was shown that viscosity, among other factors, influences the metal particle distribution in the matrices [33]. In an agar-based food model system, Wimpenny et al. [34] also stated that the distribution of bacteria is affected by agar concentration. The structure of emulsions, especially droplet size, may also play a role in the bacterial spatial distribution. Brocklehurst et al. [35] have studied the spatial distribution of Listeria monocytogenes and Yersinia enterocolitica in a hexadecane/water emulsion. They showed that droplet size correlates with viscosity: the smaller the droplet size, the higher the emulsion viscosity, and thus, the greater the bacterial immobilization. Furthermore, Jongenburger et al. [9] simulated a homogeneous or heterogeneous distribution of bacterial contaminants in batches of powdered infant formula and they showed that a low level of contamination and a heterogeneous bacterial distribution lead to a higher variability of bacterial enumeration.
Besides viscosity of the matrix, our results have also shown that an increase in S. aureus surface hydrophobicity induces an increase in the clustered spatial distribution (Table 1). These observations are in accordance with those of Ly et al. [36], who demonstrated the existence of physicochemical interactions between bacteria and the constituents of food matrices. They highlighted the role of the surface hydrophobicity of lactic-acid bacteria showing that the LLD18 strain, with a highly hydrophobic surface, interacts more with lipids and hydrophobic compounds than a hydrophilic strain (LLD16). Another study showed that hydrophobic bacteria can stabilize oil-in-water emulsions by adhering to the interface and preventing droplets from coalescing, whereas hydrophilic bacteria cannot [21]. The emulsified matrix used in our study consisted of a 65% hydrophilic phase and a 35% lipophilic phase. Our hypothesis was that the hydrophobic S. aureus strain was more highly trapped at the surface of the hydrophobic droplets than the two other strains, which led to a more heterogeneous distribution of the bacteria. This shows that the choice of the bacterial strain can have a strong impact on the bacterial spatial distribution and thus on the results of enumerations after sampling.
Interactions between bacteria and emulsions could also be affected by the surface charge of the bacteria cell wall. Li et al. [22] have studied interactions between E. coli and emulsion droplets (hexadecane/water). E. coli and these droplets having opposite surface charges, the bacteria were attracted to the surface of the droplets and destabilized the emulsion. However, in our study, the S. aureus strains showed no difference in electrophoretic mobility at an ionic strength of one millimole. The negative charge was the smallest at a pH of five to six. Moreover, at these pH levels, the negative charge of the droplets of the emulsified matrices, with or without acrylate copolymer, was very low. By consequence, in this study, the bacterial surface charge was unable to explain the difference of the bacterial distribution between strains.
In conclusion, M-CLSM was shown to be a rapid and relevant technique to characterize the bacterial spatial organization in complex emulsified systems. Both matrix viscosity and bacterial surface hydrophobicity were shown to affect the S. aureus spatial distribution in cosmetic matrices. The method could be used to quickly determine the ability of a formula to allow or not a bacterial regular distribution and thus to classify cosmetic matrices upon this parameter. Hence, this method will be helpful to increase the reliability of challenge tests by adapting the sampling plans to the class of matrices. The proposed M-CLSM methodology could also be used to analyze spatial patterns of microbial contamination in food matrices or medical functional biogels.

Author Contributions

Conceived and designed the experiments: S.A., F.D.-B., C.N., V.P.; Performed the experiments: S.A.; Analyzed data: S.A., F.D.-B.; Contributed reagents/materials: C.N., V.P.; Wrote or revise the manuscript: S.A., F.D.-B., R.B., C.N. All authors have read and agreed to the published version of the manuscript.

Funding

This research received no external funding.

Acknowledgments

The zeta potential measurements were performed at the DIVVA platform (AgroSup Dijon, Université de Bourgogne–Franche-Comté. We thank Elena Exposito-Garcia and Aurelie Trainoy (Laboratoires CLARINS) for their expertise in cosmetic formulation, Julien Deschamps (INRAE, Micalis Institute) for his support in the CLSM analyses and Yasmine Dergham for proofreading the article.

Conflicts of Interest

This study has received raw materials and funds from Laboratoires CLARINS. V. Poulet and C. Ngari are employed by the company Laboratoires CLARINS. The remaining authors declare that the research was conducted in the absence of any commercial relationships.

References

  1. Tan, A.S.B.; Tuysuz, M.; Otuk, G. Investigation of preservative efficacy and microbiological content of some cosmetics found on the market. Pak. J. Pharm. Sci. 2013, 26, 153–157. [Google Scholar]
  2. Campana, R.; Scesa, C.; Patrone, V.; Vittoria, E.; Baffone, W. Microbiological study of cosmetic products during their use by consumers: Health risk and efficacy of preservative systems. Lett. Appl. Microbiol. 2006, 43, 301–306. [Google Scholar] [CrossRef] [PubMed]
  3. Ryu, S.; Song, P.; Seo, C.; Cheong, H.; Park, Y. Colonization and infection of the skin by S. aureus: Immune system evasion and the response to cationic antimicrobial peptides. Int. J. Mol. Sci. 2014, 15, 8753. [Google Scholar] [CrossRef] [PubMed] [Green Version]
  4. Lowy, F.D. Staphylococcus aureus infections. New Engl. J. Med. 1998, 339, 520–532. [Google Scholar] [CrossRef] [PubMed]
  5. Tong, S.Y.C.; Davis, J.S.; Eichenberger, E.; Holland, T.L.; Fowler, V.G. Staphylococcus aureus infections: Epidemiology, pathophysiology, clinical manifestations, and management. Clin. Microbiol. Rev. 2015, 28, 603. [Google Scholar] [CrossRef] [PubMed] [Green Version]
  6. Berthele, H.; Sella, O.; Lavarde, M.; Mielcarek, C.; Pense-Lheritier, A.M.; Pirnay, S. Determination of the influence of factors (ethanol, pH and aw) on the preservation of cosmetics using experimental design. Int. J. Cosmet. Sci. 2014, 36, 54–61. [Google Scholar] [CrossRef]
  7. Halla, N.; Fernandes, I.P.; Heleno, S.A.; Costa, P.; Boucherit-Otmani, Z.; Boucherit, K.; Rodrigues, A.E.; Ferreira, I.; Barreiro, M.F. Cosmetics Preservation: A Review on Present Strategies. Molecules 2018, 23, 1571. [Google Scholar] [CrossRef] [Green Version]
  8. Jongenburger, I.; Reij, M.W.; Boer, E.P.J.; Gorris, L.G.M.; Zwietering, M.H. Random or systematic sampling to detect a localised microbial contamination within a batch of food. Food Control 2011, 22, 1448–1455. [Google Scholar] [CrossRef]
  9. Jongenburger, I.; Reij, M.W.; Boer, E.P.J.; Zwietering, M.H.; Gorris, L.G.M. Modelling homogeneous and heterogeneous microbial contaminations in a powdered food product. Int. J. Food Microbiol. 2012, 157, 35–44. [Google Scholar] [CrossRef]
  10. Gilbert, P.; Caplan, F.; Brown, M.R.W. Centrifugation injury of Gram-negative bacteria. J. Antimicrob. Chemother. 1991, 27, 550–551. [Google Scholar] [CrossRef]
  11. Pembrey, R.S.; Marshall, K.C.; Schneider, R.P. Cell surface analysis techniques: What do cell preparation protocols do to cell surface properties? Appl. Environ. Microbiol. 1999, 65, 2877–2894. [Google Scholar] [CrossRef] [PubMed] [Green Version]
  12. Bruinsma, G.M.; Rustema-Abbing, M.; Van der Mei, H.C.; Busscher, H.J. Effects of cell surface damage on surface properties and adhesion of Pseudomonas aeruginosa. J. Microbiol. Methods 2001, 45, 95–101. [Google Scholar] [CrossRef]
  13. Jeanson, S.; Chadoeuf, J.; Madec, M.N.; Aly, S.; Floury, J.; Brocklehurst, T.F.; Lortal, S. Spatial distribution of bacterial colonies in a model cheese. Appl. Environ. Microbiol. 2011, 77, 1493–1500. [Google Scholar] [CrossRef] [Green Version]
  14. Hedges, A.J. Estimating the precision of serial dilutions and viable bacterial counts. Int. J. Food Microbiol. 2002, 76, 207–214. [Google Scholar] [CrossRef]
  15. Jongenburger, I.; Bassett, J.; Jackson, T.; Zwietering, M.H.; Jewell, K. Impact of microbial distributions on food safety I. Factors influencing microbial distributions and modelling aspects. Food Control 2012, 26, 601–609. [Google Scholar] [CrossRef]
  16. Nauta, M.J. Microbiological risk assessment models for partitioning and mixing during food handling. Int. J. Food Microbiol. 2005, 100, 311–322. [Google Scholar] [CrossRef]
  17. Lopez, C.; Maillard, M.B.; Briard-Bion, V.; Camier, B.; Hannon, J.A. Lipolysis during ripening of emmental cheese considering organization of fat and preferential localization of bacteria. J. Agric. Food Chem. 2006, 54, 5855–5867. [Google Scholar] [CrossRef]
  18. Oss, C.J.V. Long-range and short-range mechanisms of hydrophobic attraction and hydrophilic repulsion in specific and aspecific interactions. J. Mol. Recognit. 2003, 16, 177–190. [Google Scholar] [CrossRef]
  19. Burgain, J.; Scher, J.; Francius, G.; Borges, F.; Corgneau, M.; Revol-Junelles, A.M.; Cailliez-Grimal, C.; Gaiani, C. Lactic acid bacteria in dairy food: Surface characterization and interactions with food matrix components. Adv. Colloid Interface Sci. 2014, 213, 21–35. [Google Scholar] [CrossRef]
  20. Ly, M.H.; Aguedo, M.; Goudot, S.; Le, M.L.; Cayot, P.; Teixeira, J.A.; Le, T.M.; Belin, J.M.; Waché, Y. Interactions between bacterial surfaces and milk proteins, impact on food emulsions stability. Food Hydrocoll. 2008, 22, 742–751. [Google Scholar] [CrossRef] [Green Version]
  21. Dorobantu, L.S.; Yeung, A.K.C.; Foght, J.M.; Gray, M.R. Stabilization of oil-water emulsions by hydrophobic bacteria. Appl. Environ. Microbiol. 2004, 70, 6333–6336. [Google Scholar] [CrossRef] [PubMed] [Green Version]
  22. Li, J.; McClements, D.J.; McLandsborough, L.A. Interaction between emulsion droplets and Escherichia coli cells. J. Food Sci. 2001, 66, 570–657. [Google Scholar] [CrossRef]
  23. Ly, M.H.; Naitali-Bouchez, M.; Meylheuc, T.; Bellon-Fontaine, M.N.; Le, T.M.; Belin, J.M.; Wache, Y. Importance of bacterial surface properties to control the stability of emulsions. Int. J. Food Microbiol. 2006, 112, 26–34. [Google Scholar] [CrossRef] [PubMed]
  24. Pensé-Lhéritier, A.M. Conception des Produits Cosmétiques—La Formulation; Lavoisier: Paris, France, 2016. [Google Scholar]
  25. Kirk, R.E.; Othmer, D.F. Chemical Technology of Cosmetics; John Wiley & Sons: Hoboken, NJ, USA, 2013; p. 832. [Google Scholar]
  26. Bridier, A.; Dubois-Brissonnet, F.; Greub, G.; Thomas, V.; Briandet, R. Dynamics of the action of biocides in Pseudomonas aeruginosa biofilms. Antimicrob. Agents Chemother. 2011, 55, 2648–2654. [Google Scholar] [CrossRef] [Green Version]
  27. Bridier, A.; Dubois-Brissonnet, F.; Boubetra, A.; Thomas, V.; Briandet, R. The biofilm architecture of sixty opportunistic pathogens deciphered using a high throughput CLSM method. J. Microbiol. Methods 2010, 82, 64–70. [Google Scholar] [CrossRef]
  28. Doherty, S.B.; Gee, V.L.; Ross, R.P.; Stanton, C.; Fitzgerald, G.F.; Brodkorb, A. Efficacy of whey protein gel networks as potential viability-enhancing scaffolds for cell immobilization of Lactobacillus rhamnosus GG. J. Microbiol. Methods 2010, 80, 231–241. [Google Scholar] [CrossRef]
  29. Auty, M.A.; Gardiner, G.E.; McBrearty, S.J.; O’Sullivan, E.O.; Mulvihill, D.M.; Collins, J.K.; Fitzgerald, G.F.; Stanton, C.; Ross, R.P. Direct In Situ viability assessment of bacteria in probiotic dairy products using viability staining in conjunction with confocal scanning laser microscopy. Appl. Environ. Microbiol. 2001, 67, 420–425. [Google Scholar] [CrossRef] [Green Version]
  30. Rosenberg, M. Bacterial adherence to hydrocarbons: A useful technique for studying cell surface hydrophobicity. FEMS Microbiol. Lett. 1984, 22, 289–295. [Google Scholar] [CrossRef]
  31. Chen, C.Y.; Nace, G.W.; Irwin, P.L. A 6 × 6 drop plate method for simultaneous colony counting and MPN enumeration of Campylobacter jejuni, Listeria monocytogenes and Escherichia coli. J. Microbiol. Methods 2003, 55, 475–479. [Google Scholar] [CrossRef]
  32. Schneider, C.A.; Rasband, W.S.; Eliceiri, K.W. NIH image to imageJ: 25 years of image analysis. Nat. Methods 2012, 9, 671. [Google Scholar] [CrossRef]
  33. Hashim, J.; Looney, L.; Hashmi, M.S.J. Particle distribution in cast metal matrix composites—Part I. J. Mater. Process. Technol. 2002, 123, 251–257. [Google Scholar] [CrossRef]
  34. Wimpenny, J.W.T.; Leistner, L.; Thomas, L.V.; Mitchell, A.J.; Katsaras, K.; Peetz, P. Submerged bacterial colonies within food and model systems: Their growth, distribution and interactions. Int. J. Food Microbiol. 1995, 28, 299–315. [Google Scholar] [CrossRef]
  35. Brocklehurst, T.F.; Parker, M.L.; Gunning, P.A.; Coleman, H.P.; Robins, M.M. Growth of food-borne pathogenic bacteria in oil-in-water emulsions: II-Effect of emulsion structure on growth parameters and form of growth. J. Appl. Bacteriol. 1995, 78, 609–615. [Google Scholar] [CrossRef] [PubMed]
  36. Ly, M.H.; Vo, N.H.; Le, T.M.; Belin, J.M.; Wache, Y. Diversity of the surface properties of Lactococci and consequences on adhesion to food components. Colloids Surf. B Biointerfaces 2006, 52, 149–153. [Google Scholar] [CrossRef]
Figure 1. Electrophoretic mobility of the three S. aureus strains (A) and the lipid droplets of a model matrix (B) at a pH from 3 to 8. Data are expressed as the mean ± standard deviation of two biologic replicates.
Cosmetics 07 00032 g001
Figure 2. Frequency distribution of S. aureus CIP 4.83 surface fluorescence with the mean and the variance associated in (A) matrix 1 and (B) matrix 6, and a mosaic of 225 CLSM images in (C) matrix 1 and (D) matrix 6 Surface fluorescence (SF) has a threshold at 0.0005%.
Cosmetics 07 00032 g002
Figure 3. Ratio of bacterial recovery obtained with (A) 0% or 1.6% acrylate copolymer by plate count and (B) by CLSM enumeration from 3375 images. a.u.: arbitrary unit, *: significantly different from the control (p-value < 0.05) and ×: mean.
Cosmetics 07 00032 g003
Figure 4. Frequency distribution of surface fluorescence of S. aureus CIP 4.83 in matrices with various concentrations of acrylate copolymer (A) 0%, (B) 0.8%, and (C) 1.6%) or guar gum (D) 2.5%.
Cosmetics 07 00032 g004
Table 1. Mean and variance associated to frequency distribution of surface fluorescence (n = 3375 images) of three S. aureus strains and hydrophilic beads in matrices with various concentrations of acrylate copolymer (from 0% to 1.6%) or guar gum (2.5%); distribution is regular if variance < mean and clustered if variance > mean.
PolymerAcrylate CopolymerGuar Gum
0%0.4%0.8%1.6%2.5%
Penetrometry (mm)31.5 ± 0.428.5 ± 0.327.7 ± 0.426.6 ± 0.325.5 ± 0.4
Surface Fluorescence%MeanVarianceMeanVarianceMeanVarianceMeanVarianceMeanVariance
S. aureus CIP 4.830.110.010.180.020.662.793.58176.261.5537.88
DistributionRegularRegularClusteredClusteredClustered
S. aureus ATCC 292130.450.090.660.060.500.731.1611.320.946.23
DistributionRegularRegularClusteredClusteredClustered
S. aureus ATCC 272170.600.240.620.110.310.571.198.430.918.99
DistributionRegularRegularClusteredClusteredClustered
Beads1.790.242.280.381.741.901.714.212.2313.21
DistributionRegularRegularClusteredClusteredClustered

