Communication

Calebin-A, a Curcuminoid Analog Inhibits α-MSH-Induced Melanogenesis in B16F10 Mouse Melanoma Cells

by
Shilpi Goenka
1,*,
Kalyanam Nagabhushanam
2,
Muhammed Majeed
2 and
Sanford R. Simon
1,3,4
1
Department of Biomedical Engineering; Stony Brook University, Stony Brook, NY 11794, USA
2
Sabinsa Corporation, 20 Lake Drive, East Windsor, NJ 08520, USA
3
Department of Pathology, Stony Brook University, Stony Brook, NY 11794, USA
4
Department of Biochemistry and Cellular Biology, Stony Brook University, Stony Brook, NY, 11794, USA
*
Author to whom correspondence should be addressed.
Cosmetics 2019, 6(3), 51; https://doi.org/10.3390/cosmetics6030051
Submission received: 26 July 2019 / Revised: 13 August 2019 / Accepted: 15 August 2019 / Published: 19 August 2019
(This article belongs to the Special Issue Melanogenesis and Melanin-Related Compounds: A Cosmetic Perspective)

Abstract

:
Hyperpigmentation skin disorders comprise melasma, age spots, and post-inflammatory hyperpigmentation. They are characterized by an aberrant upregulation of melanin pigment and pose a significant burden aesthetically. Calebin-A (CBA) is a natural curcuminoid analog derived from turmeric root (Curcuma longa) but, unlike curcumin, it has not been explored yet for anti-melanogenic activity. Hence, in the current study, we studied CBA for its effects on α-melanocyte stimulating hormone (αMSH)-stimulated melanogenesis in B16F10 mouse melanoma cells. Our results showed that CBA (20 μM) significantly suppressed αMSH-stimulated melanogenesis after 48 h treatment. The underlying mechanisms of CBA’s anti-melanogenic activity were studied, and it was shown that CBA did not affect either intracellular tyrosinase activity or the direct activity of tyrosinase enzyme. Additionally, CBA did not affect intracellular α-glucosidase activity but significantly inhibited direct α-glucosidase activity. CBA also directly scavenged 2,2-Diphenyl-1-picrylhydrazyl (DPPH) radicals, consistent with potent antioxidant activity but did not inhibit intracellular reactive oxygen species (ROS). CBA increased acidification of cellular organelles and inhibited maturation of melanosomes by significantly reducing the number of mature melanosomes. Our results indicate that CBA may hold promise as a pigmentation inhibitor for hyperpigmentation disorders for cosmetic use by targeting pathways other than tyrosinase inhibition. Further studies to delineate the molecular signaling mechanism of melanogenesis inhibition and test anti-melanogenesis efficacy of CBA in human skin melanocytes and skin equivalents are warranted.

1. Introduction

Hyperpigmentation is caused by excessive production of melanin pigment in skin melanocytes and is associated with dermatological disorders such as lentigo senilis (LS), melasma, and post-inflammatory hyperpigmentation (PIH), which affect the individuals aesthetically. Within the melanocytes, the pigment melanin is synthesized in lysosome-related organelles called melanosomes. The melanosomes are secreted and transported to keratinocytes in the epidermis where they accumulate in the perinuclear area, thus giving coloration to the skin [1]. Tyrosinase, a membrane-bound glycoprotein, is the key rate-limiting enzyme which catalyzes the formation of melanin pigment in the melanosomes via a two-step reaction: the first step involves the hydroxylation reaction of monophenols to diphenols (monophenolase activity) and the second step involves the oxidation of diphenols to form ortho-quinones (diphenolase activity) [2,3]. The role of alpha-melanocyte stimulating hormone (αMSH), a melanocortin peptide, in mediating epidermal melanogenesis has been established. The secretion of αMSH from keratinocytes is triggered upon exposure to ultraviolet radiation (UVR) [4] which also leads to upregulation of the expression of the αMSH receptor on melanocytes [5]. Commercial tyrosinase inhibitors, such as kojic acid (KA), hydroquinone, and arbutin exhibit serious side-effects. KA leads to pigmented contact dermatitis [6], hydroquinone is carcinogenic [7], and arbutin is genotoxic [8]. Hence, there is a growing interest in search for novel natural compounds which show capacity to inhibit pigmentation in the absence of the aforementioned side-effects.
Calebin-A (CBA; chemical structure shown in Figure 1A) is a natural curcuminoid analog present in minor amounts in turmeric (Curcuma longa) which was first identified by Kim et al. [9] and has already demonstrated several pharmacological activities. For example, CBA exhibited anticancer activities in gastric cancer cells by inducing apoptosis [10], and in peripheral nerve sheath tumor cells [11] and also inhibited TNF-α-induced NF-kB activity [12]. CBA inhibited osteoclastogenesis [13], protected cells from β-amyloid toxicity [14], and prevented fatty liver disease by inhibiting adipogenesis [15]. Additionally, pharmacokinetic studies have shown that CBA was safe for oral use without any reproductive toxicity in animal studies [16]. Notably, CBA has shown superior biological activities as compared to curcumin in a limited number of studies: for example, CBA inhibited growth of human hepatoma HepG2 cells more potently than curcumin [17] and in another study, CBA showed superior protective effects on PC-12 cells in a β-amyloid toxicity model [9].
Previous reports have shown that a partially purified Curcuma longa extract [18] and curcumin [19] inhibited αMSH-stimulated melanogenesis in B16F10 cells. However, to the best of our knowledge, there has been no study of the effects of CBA on melanogenesis to date. CBA is structurally related to curcumin; however, CBA is a ferulic acid ester and lacks the beta-diketone group at 1,3 carbon which is unique to curcumin’s structure. Hence, in this work, we studied the effects of CBA on αMSH-stimulated melanogenesis using B16F10 mouse melanoma cells and delineated the mechanisms of inhibition of melanogenesis.

2. Materials and Methods

2.1. Materials

CBA (99% purity; CAS no. 336784-82-8) was obtained from Sabinsa Corporation (East Windsor, NJ). The stock solution of CBA was prepared in DMSO (Dimethyl Sulfoxide) at 50 mM and stored at −20 °C until use. Kojic Acid (KA), Mushroom tyrosinase, 3,4-dihydroxy-L-phenylalanine (L-DOPA), α-MSH, L-Tyrosine, α-glucosidase (from Baker yeast) and p-nitrophenyl-a-D-glucopyranoside (pNG) substrate were all purchased from Sigma. Lysotracker red DND-99 and 2′, 7′-dichlorodihydrofluorescein diacetate (DCFH-DA) were purchased from Molecular Probes (Invitrogen, Carlsbad, CA, USA).

2.2. Cell Culture

B16F10 mouse melanoma cells (CRL-6475™) were obtained from American Type Cell Culture (ATCC; Manassas, VA) and cultured in Dulbecco’s Modified Eagles Medium (DMEM) supplemented with 10% heat-inactivated fetal bovine serum (HI-FBS) and 1% antibiotics (penicillin-streptomycin) at 37 °C in a humidified incubator (95% air −5% CO2).

2.3. Cytotoxicity Assay

In order to test CBA for effects on melanin synthesis, we first screened CBA for any cytotoxicity to B16F10 cells using an MTS cytotoxicity assay (CellTiter Aqueous one, Promega Corp.). MTS (3-(4,5-dimethylthiazol-2-yl)-5-(3-carboxymethoxyphenyl)-2-(4-sulfophenyl)-2H-tetrazolium) reacts with mitochondrial dehydrogenases and is reduced to purple-colored formazan in viable cells. B16F10 cells (1 × 10⁴ cells/well) were seeded in 96-well plates for 24 h, after which the medium was replaced by fresh medium containing various concentrations of CBA. The final DMSO concentration in all groups, including control, was 0.1%, which did not cause cytotoxicity. After 48 h, the culture medium was aspirated, and replaced by 100 μl of fresh medium with 20 μl of MTS and incubated for 40 min, after which the absorbance was read at 490 nm using a Versamax® microplate reader. Cell viability was calculated from the absorbance values and expressed as % normalized to control group.

2.4. Melanogenesis Assay

B16F10 cells were seeded at 1.25 × 10⁵ cells/well in 12-well plates and incubated for 24 h. After 24 h, CBA was added at nontoxic concentrations in the presence of αMSH (150 nM) and cultured for 48 h. Negative control consisted of cells with no αMSH treatment and KA (0.5 mM) was used as a positive control. At the end of the treatments, cells were harvested, washed in PBS, and 250 μL of 1N NaOH was added and heated to 70 °C to solubilize melanin. Next, 200 μL aliquots of lysate were transferred to a 96-well plate and the absorbance was read at 475 nm using a microplate reader. A portion of the lysate was used to evaluate total protein content using bicinchoninic acid (BCA) assay (Pierce BCA kit, Thermo Fisher Scientific). The absorbance was normalized to total protein content and reported as relative melanin levels, expressed as % of control.

2.5. Intracellular Tyrosinase Activity

B16F10 cells were seeded in 24-well plates at a density of 5 × 10⁴ cells/well. After 24 h, the culture medium was renewed with various doses of compound CBA and further incubated for 48 h. At the end of treatments, cells were trypsinized and cell pellets were washed in PBS and lysed in cell lysis buffer (EA-0001; Signosis, Santa Clara, CA). Lysates (50 μL) were aliquoted in a 96-well microplate and 150 μL of freshly prepared 3 mM L-DOPA solution (prepared in 0.05M phosphate buffer, pH 6.8) was added. The absorbance was then measured at 475 nm in the kinetic mode every 30 s for 40 min at 30 °C using microplate reader. The tyrosinase activity was calculated from the slope of the linear range of the velocities of inhibition and was normalized by the total protein contents assayed by BCA kit and expressed as % of control.

2.6. In Vitro Diphenolase and Monophenolase Activity

The direct effect of CBA on diphenolase activity was tested using mushroom tyrosinase as a source of enzyme activity with L-DOPA substrate while the effects on monophenolase activity were tested using L-TYR substrate based on the method reported in our earlier study [20]. Briefly, 80 μL aliquots of CBA, prepared at different concentrations in 50 mM sodium phosphate (pH 6.8) buffer, were added to a 96-well microplate, followed by 100 μL of freshly prepared substrate solution (6 mM L-DOPA in phosphate-buffered saline). The reaction was started by adding 20 μL of mushroom tyrosinase enzyme (final concentration of enzyme was 3.5 µg/mL). The production of DOPAchrome was monitored by measuring the kinetics of absorbance at 475 nm (for 30 min every 30 s). The slopes of the kinetic readings were calculated to determine tyrosinase activity and compare it to the control.
For testing monophenolase activity, 80 μL aliquots of different concentrations of CBA were added to a 96-well plate with 100 μL of 2 mM L-TYR (L-Tyrosine) substrate solution and 20 μL of mushroom tyrosinase (final enzyme concentration: 12.5 µg/mL) was added to initiate the reaction. The reaction was monitored by measuring the kinetics of absorbance at 475 nm using microplate reader and slopes of the linear range were calculated to determine and compare tyrosinase activity from control.

2.7. Intracellular α-Glucosidase Activity

In order to test if CBA may inhibit the α-glucosidase enzyme which regulates the early stage of maturation of tyrosinase enzyme in cells [21,22], lysates of B16F10 cells were assayed for enzyme activity by addition of pNG substrate and the rate of formation of the reaction product p-nitrophenol was monitored at 405 nm in kinetic mode for 30 min at 37 °C in a microplate reader. The relative intracellular α-glucosidase activity was calculated as: (rate of sample reaction/rate of control reaction) × 100%.

2.8. In Vitro α-Glucosidase Enzyme Assay

The direct effect of CBA on a purified yeast α-glucosidase preparation was assayed based on a method described previously [23] with some modifications. CBA was prepared in 0.05 M phosphate buffer at different concentrations and mixed with 100 μL of 1.2 mM p-nitrophenyl-α-D-glucopyranoside (pNG) substrate solution in a 96-well plate. The reaction was initiated by addition of 20 μL of 0.45 units of α-glucosidase enzyme and the rate of the formation of the yellow-colored reaction product p-nitrophenol was monitored at 405 nm in kinetic mode for 15 min at 37 °C in a microplate reader. The relative enzyme activity (%) was calculated as: (rate of sample reaction/rate of control reaction) × 100%.

2.9. Intracellular Reactive Oxygen Species (ROS) Generation

Intracellular reactive oxygen species (ROS) generation was quantified using 2′, 7′-dichlorodihydrofluorescein diacetate (H2DCFDA), a non-fluorescent dye which is cleaved by intracellular esterases after reaction with reactive oxygen species (ROS) to fluorescent Dichlorofluorescein (DCF). For measuring intracellular ROS, B16F10 cells were seeded in 24-well plates at 4 × 10⁴ cells/ well. After 24 h, the medium was aspirated, and CBA was added at different concentrations and further incubated for 48 h. At the end of the incubations, the medium was aspirated, and cells were washed with PBS. DCFH-DA (Molecular Probes) was dissolved in DMSO to make 10 mM stock which was diluted in DMEM medium (serum-free, phenol-red free, and sodium pyruvate free) to make a working stock (50 µM) and added to cells and further incubated for 45 min at 37 °C. The cells were washed with Hank’s Buffered Salt Saline (HBSS) and fluorescence was read using a fluorescence microplate reader (Gemini EM Spectramax, Molecular Devices) set at excitation and emission wavelengths of 485 nm and 535 nm, respectively. Data was used to calculate relative fluorescence of the CBA-treated samples as percentage (%) of the control samples.

2.10. 2,2-Diphenyl-1-Picrylhydrazyl (DPPH) Antioxidant Assay

Melanogenesis is associated with an increased generation of reactive oxygen species (ROS) leading to oxidative stress [24]. Hence, compounds which possess antioxidant activity can inhibit melanin production. 2,2-Diphenyl-1-picrylhydrazyl (DPPH) is a stable free radical which changes color from purple to yellow upon reduction by electron donation from antioxidant compounds. The color change is measured spectrophotometrically using microplate reader (Versamax, Molecular Devices, USA). Briefly, DPPH was freshly prepared in methanol and mixed with different concentrations of CBA in triplicates in a 96-well plate in a final volume of 200 μL (20 μL samples with 180 μL of DPPH; final DPPH concentration was 60 μM). Ascorbic Acid (AA) at 20 µM was used as a positive control and negative control consisted of DPPH with buffer. After an incubation of 30 min, the absorbance was read at 517 nm and antioxidant activity was reported as % of DPPH radical inhibition.

2.11. Detection of Acidified Cell Organelles by Lysotracker Probe

The acidification of cellular organelles has been validated as a method to determine if melanogenesis inhibition may be regulated by compounds which can increase acidity of cellular organelles. This acidification is detectable by a fluorescent acidotropic probe Lysotracker red DND-99 (Molecular Probes, Invitrogen, USA) which labels organelles in live cells [25]. B16F10 cells were seeded onto glass-bottomed dishes at a density of 1 × 10⁵ cells/well and after 48 h, cells were treated with αMSH and αMSH with CBA for a duration of 48 h. Cells were washed in buffer and stained with Lysotracker dye (50 nM) for 30 min and images were taken using an epifluorescence microscope (Nikon Diaphot TMD, USA) equipped with excitation/emission filters: 577/590 nm. At least 5–6 random images were taken for each group and fluorescence intensities were quantified using Adobe Photoshop (CC, Version 20.0.5) based on method reported in a previous study [26]. The magic wand tool was used to select the area of the signal intensity with the tolerance levels kept constant at 55 for all analyses and the mean gray scale value (GSV) was measured. The background intensity was also measured and subtracted from the signal GSV and reported as relative fluorescence intensity in arbitrary units (A.U.)

2.12. Ultrastructural Study of Melanosomes

To study the effects of CBA on melanosome maturation, the ultrastructure was assessed by Transmission Electron Microscopy (TEM). Briefly, B16F10 cells were seeded in T12.5 tissue culture flask and treated with αMSH and αMSH with CBA (20 μM) for 48 h. The cells were harvested and pelleted, washed in PBS, and fixed in glutaraldehyde fixative overnight, and then processed for resin embedding and sectioning. Ultrathin sections (300 nm) were stained and the images were observed using a Tecnai BioTwin G TEM (FEI, OR, US), at 80 kV.
Quantification of melanosomes in different maturation stages was undertaken to study if CBA might affect any stage of melanosome maturation. Stage I and II melanosomes were counted together, based on a method reported earlier [27], in order to avoid classification errors [28]. We also counted Stage III and Stage IV melanosomes together based on a previous report [29].

2.13. Statistical Analysis

One-way analysis of variance (ANOVA) with Dunnett post-hoc test was run using GraphPad Prism software version 4.0 (GraphPad Software Inc., La Jolla, San Jose, CA, USA). Differences were considered statistically significant at p < 0.05. All data are reported as Mean ± standard deviation (SD).

3. Results and Discussion

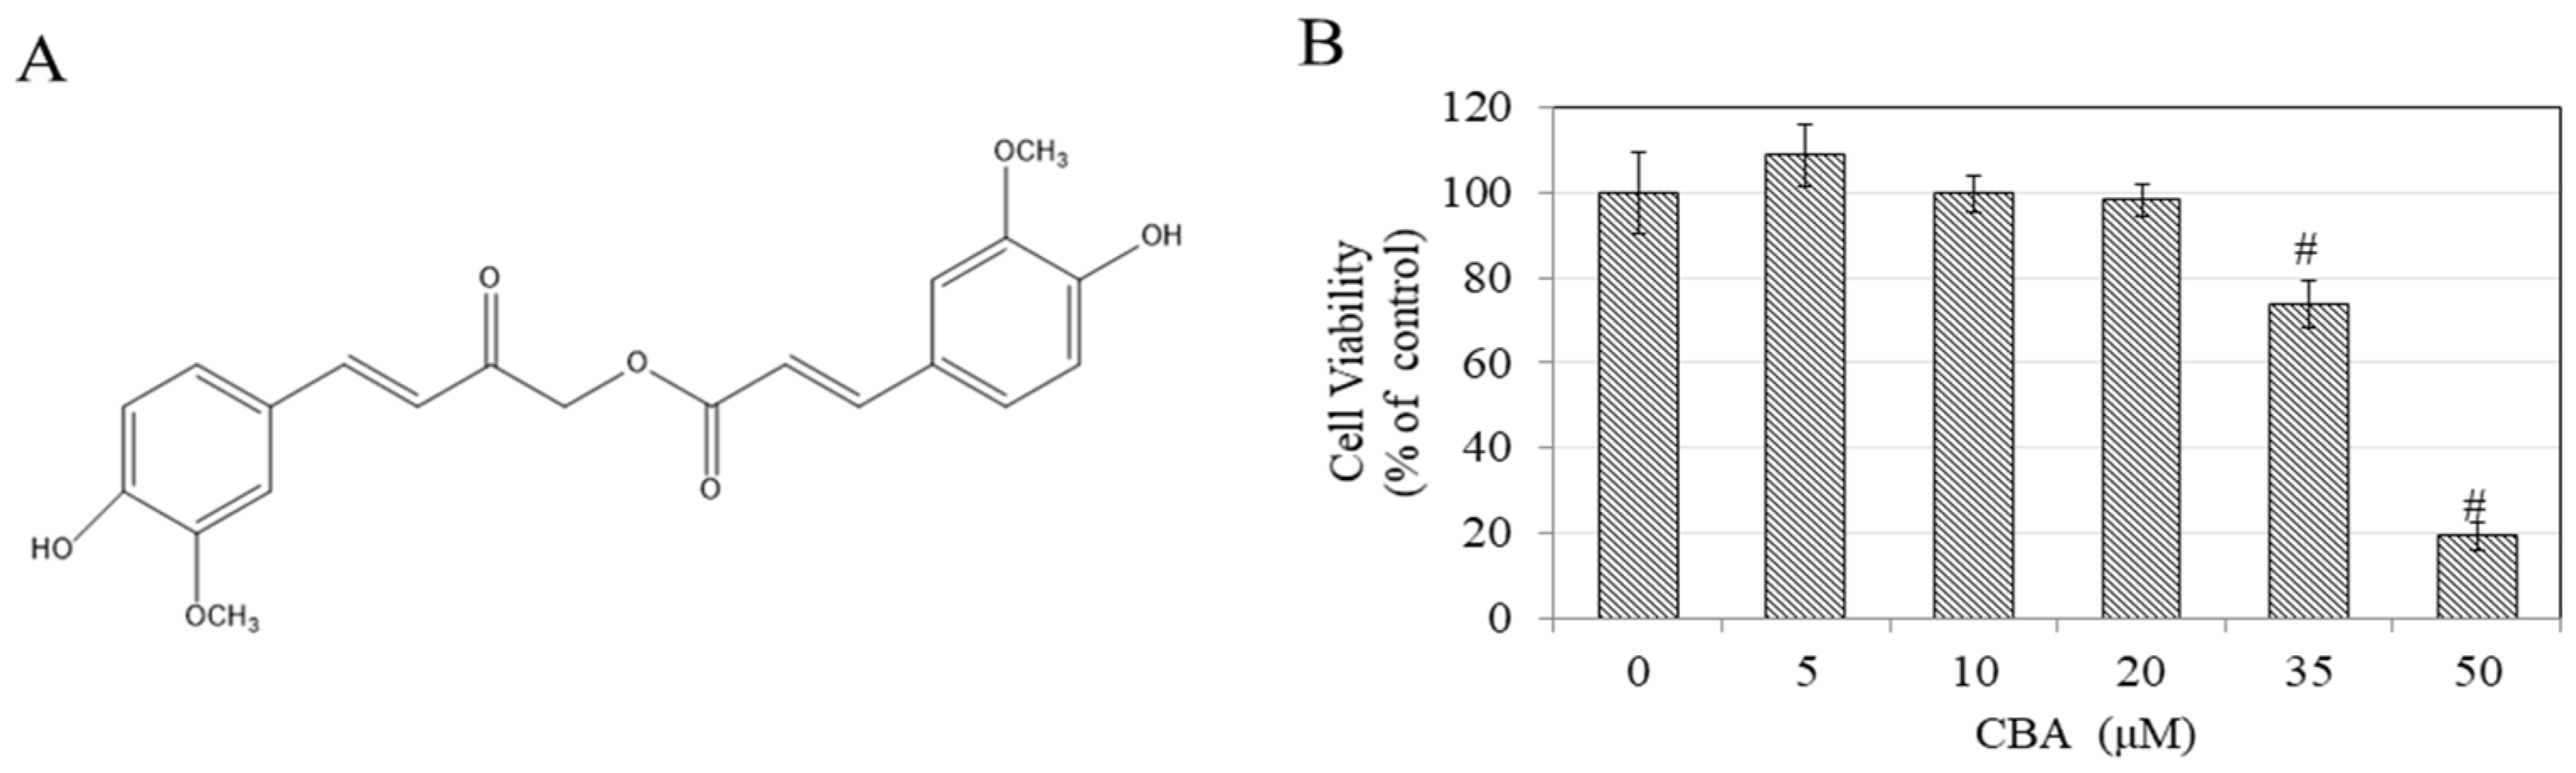
3.1. Effects of Calebin-A (CBA) on Cell Viability in B16F10 Cells

We first tested CBA for cytotoxicity using an MTS assay to select only nontoxic concentrations to be used further for testing pigment inhibition: the results are summarized in Figure 1B. CBA was significantly toxic at 35 µM and 50 µM (reduction in viability of 26% and 81%), hence a range of CBA concentrations of 5–20 μM was selected for further testing.

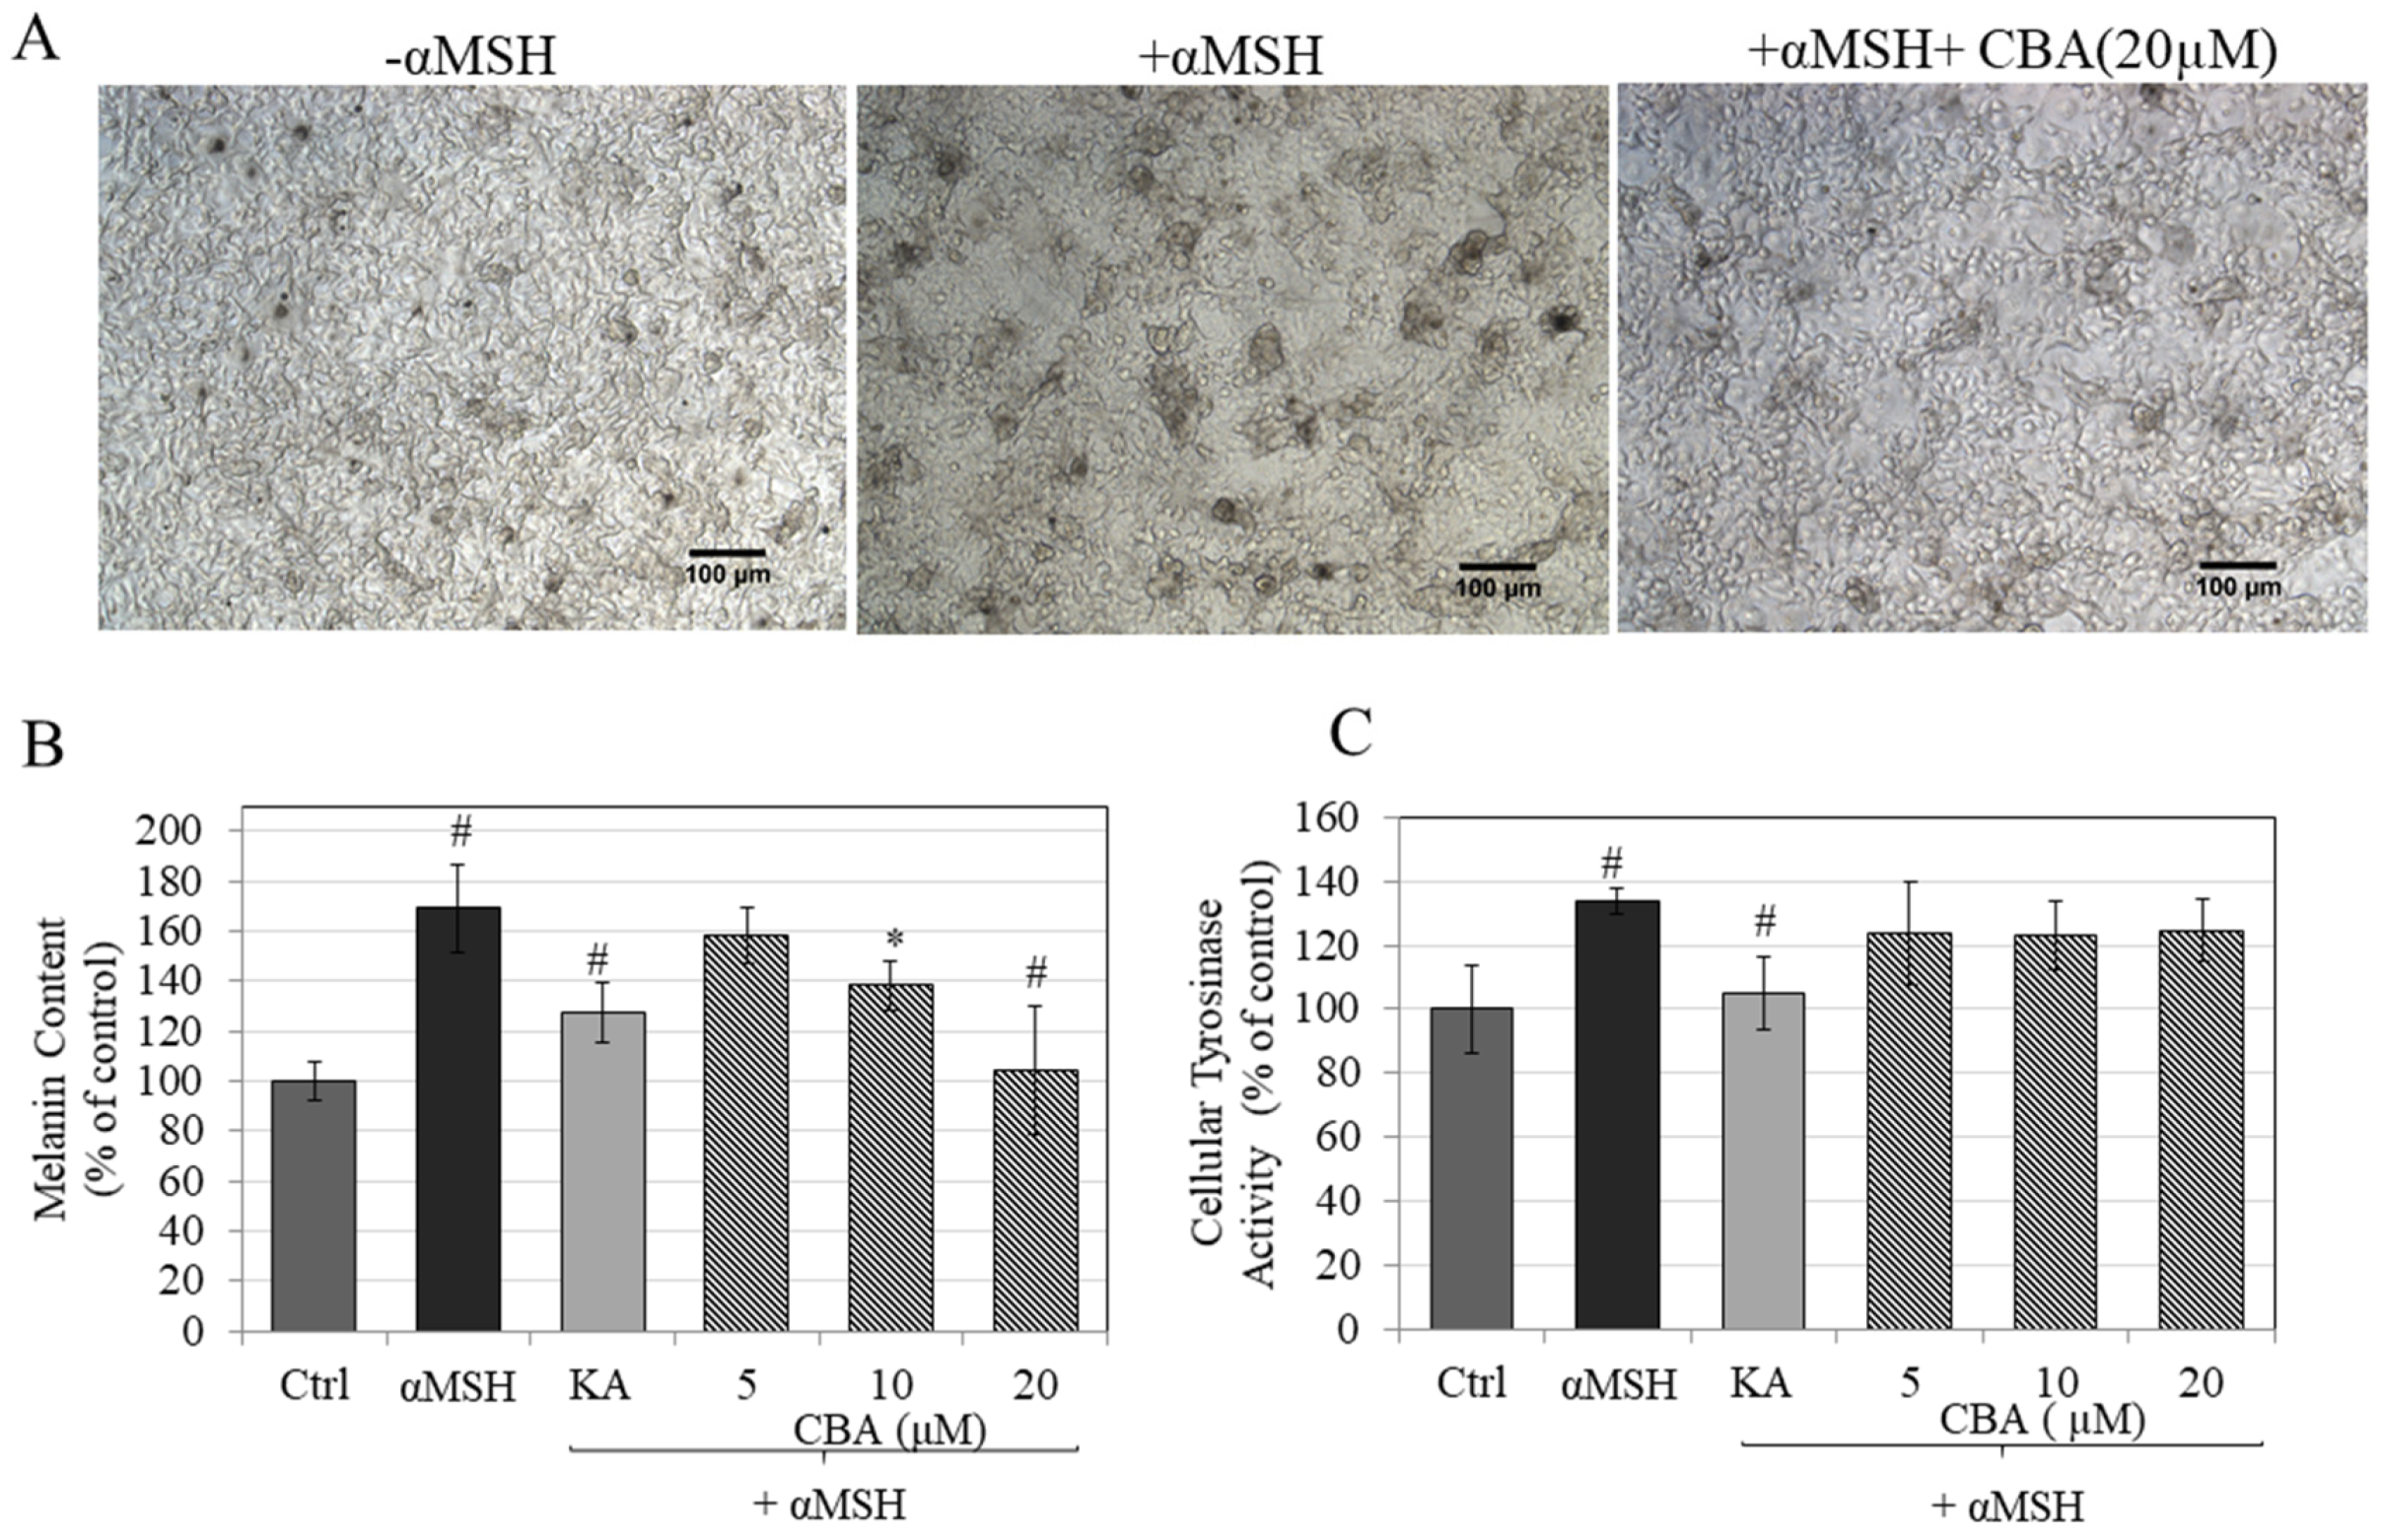
3.2. Effects of CBA on Melanin Biosynthesis

The photomicrographs of cells treated with αMSH showed a visibly greater accumulation of melanin pigment granules compared to cells without αMSH (basal). Treatment with CBA (20 µM) showed an ostensible reduction in pigment granules (Figure 2A). Estimation of melanin biosynthesis in cell pellets showed that treatment with αMSH significantly stimulated melanin levels by 69% (p < 0.01), as compared to untreated control, which was inhibited by CBA in a dose-dependent fashion. CBA significantly inhibited melanogenesis by 31% at 10 µM and by 65% at 20 µM (p < 0.01; Figure 2B). The level of inhibition was greater that achieved by kojic acid, which only produced 41% inhibition at the high dose of 500 µM. We also tested the effects of CBA on melanin synthesis under conditions of basal melanogenesis (absence of MSH) and the results showed that CBA was less potent inhibitor of melanogenesis under basal conditions: a modest inhibition of 20% was obtained only at 20 μM (Figure S1). Overall, the data demonstrate that CBA is an effective suppressor of αMSH-stimulated melanogenesis.

3.3. Effects of CBA on Intracellular Tyrosinase Activity

Tyrosinase is the rate-limiting enzyme in the melanogenesis pathway, hence compounds which can inhibit tyrosinase activity can be considered as attractive candidates for depigmentation agents. In order to identify CBA’s mechanisms of melanogenesis inhibition, we tested tyrosinase enzyme activity in cellular lysates. Results showed that CBA had no effect on intracellular tyrosinase activity at any concentration (p > 0.05) (Figure 2C).

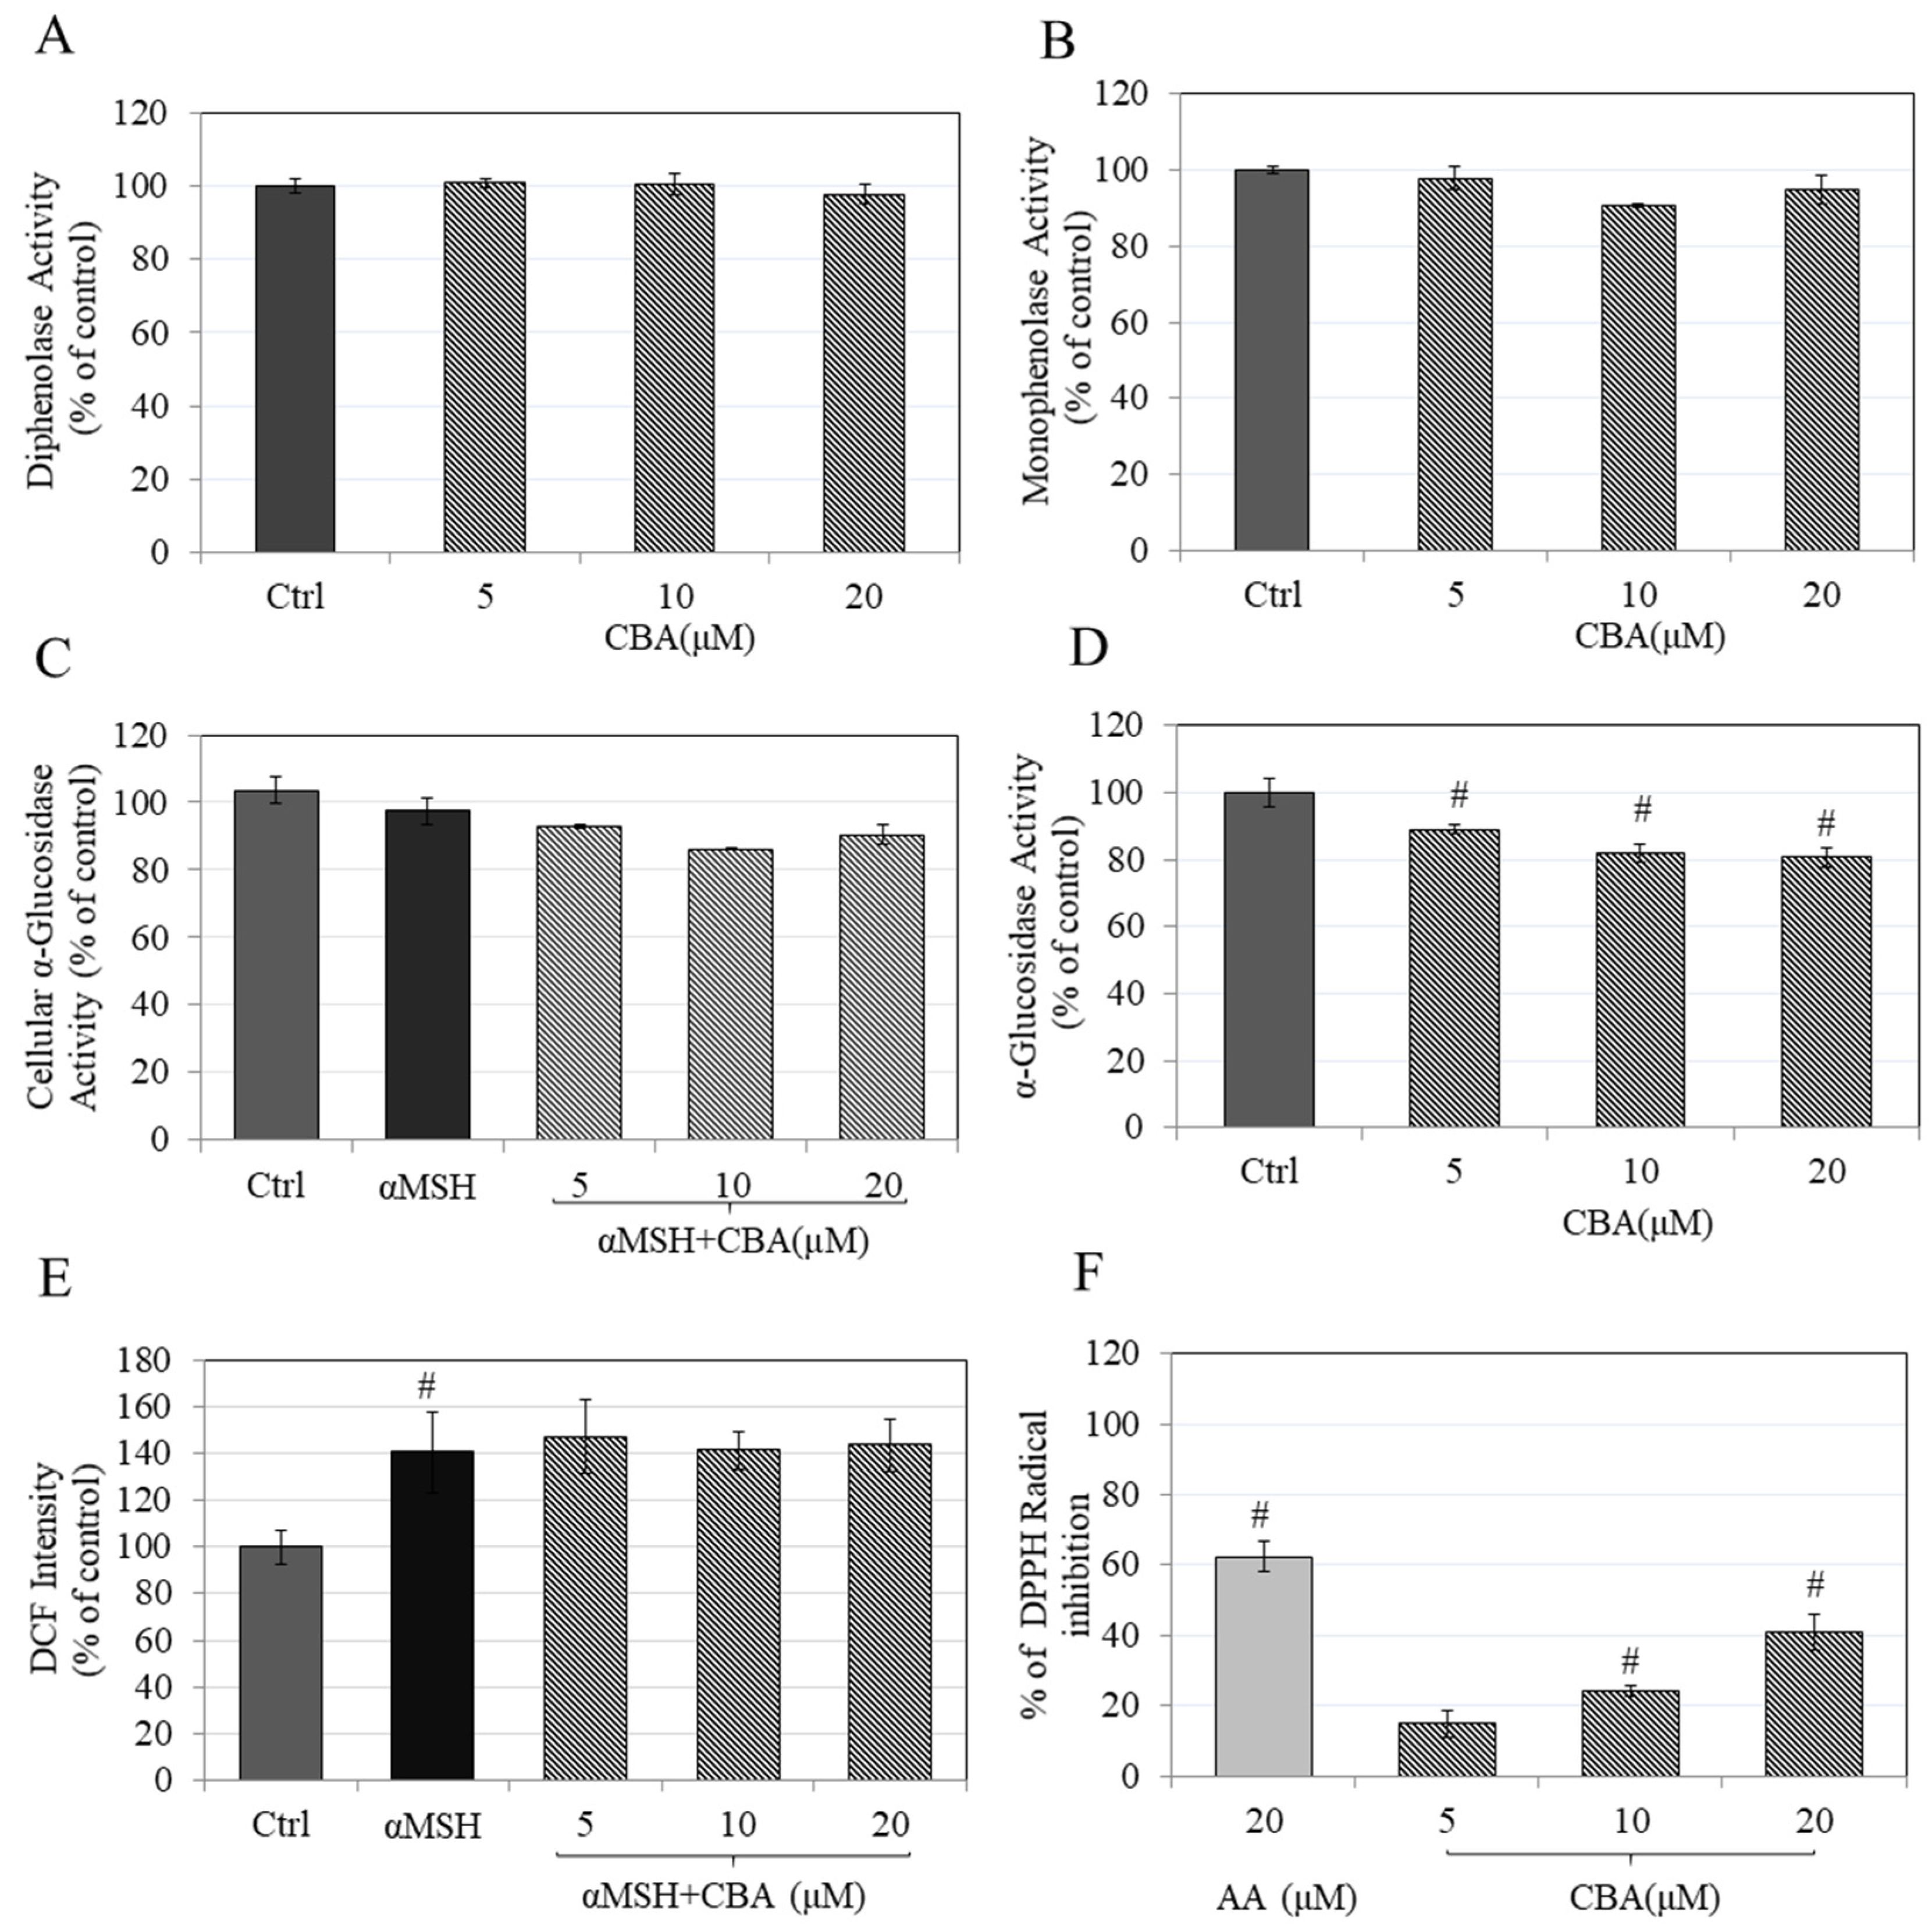
3.4. Effects of CBA on In Vitro Tyrosinase Activity

We tested whether CBA could directly inhibit the first step (monophenolase) or second step (diphenolase) of the enzyme activity of tyrosinase in an acellular system. CBA did not have any effect on either monophenolase tyrosinase activity (Figure 3A) or diphenolase activity (Figure 3B). Our results highlight that the curcuminoid analog CBA thus inhibits melanogenesis by a unique mechanism which differs from curcumin which is a tyrosinase inhibitor in an in vitro system [30].

3.5. Effects of CBA on Intracellular and In Vitro α-Glucosidase Activity

CBA had no effect on intracellular α-glucosidase activity (Figure 3C), however, it significantly inhibited activity of purified yeast α-glucosidase with reductions of 11.05%, 18.09%, and 19.45% at CBA concentrations of 5, 10, and 20 µM respectively, (Figure 3D) indicative of a direct effect. Taken together, these results show that CBA may have the potential to inhibit glycosylation of tyrosinase in a direct manner. Previous reports on the major curcuminoid curcumin that explored its anti-melanogenic efficacy did not study the role of α-glucosidase in regulation of curcumin’s anti-melanogenic effects, however, curcumin and its analogs have exhibited α-glucosidase inhibitory activity [31]. Since CBA bears some structural similarity to curcumin, our results are consistent with those reports.

3.6. Effects on Intracellular and In Vitro Antioxidant Activity

Our results showed that treatment of B16F10 cells with αMSH significantly increased intracellular ROS levels by 41% while cotreatment of the cells with CBA did not attenuate the increased ROS levels, indicating that CBA does not affect cellular ROS levels (Figure 3E). However, CBA demonstrated a potent DPPH-radical inhibition of 41% at 20 µM (Figure 3F). The IC50 values for inhibition were calculated to be 30.55 ± 4.82 μM. These results show that CBA exhibits direct free radical scavenging activity.

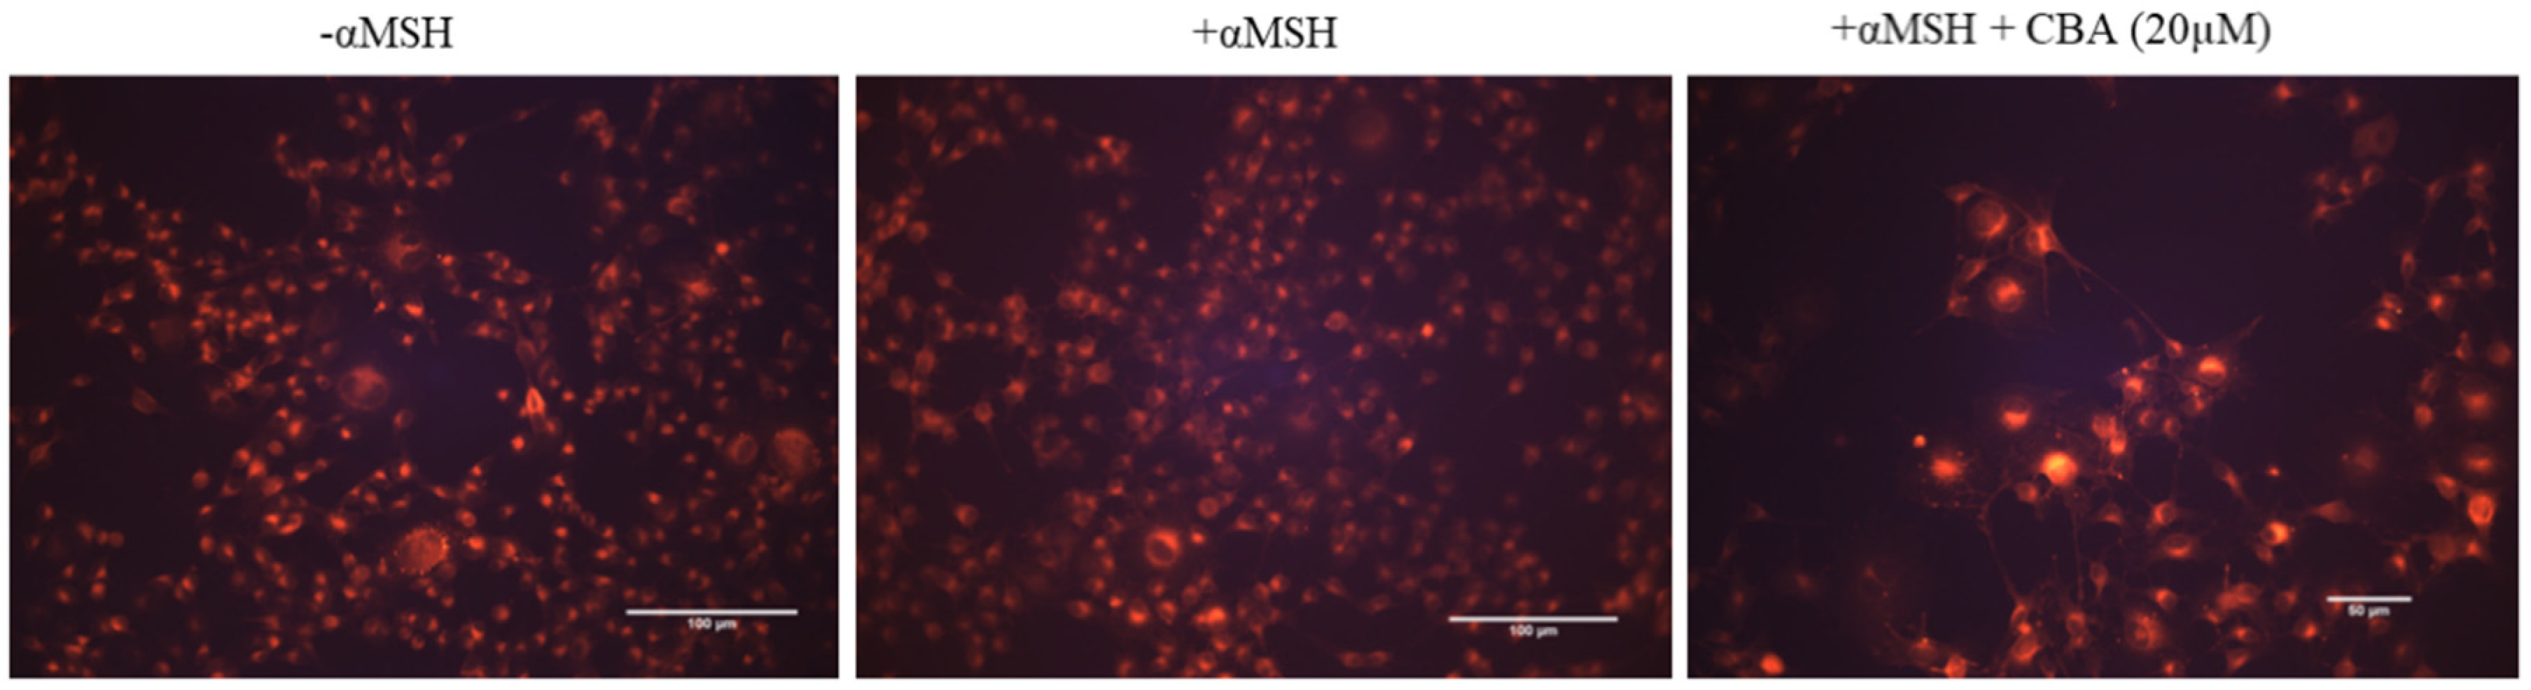
3.7. Effect on Acidification of Organelles

CBA cotreatment increased the intensity of Lysotracker staining of organelles qualitatively in B16F10 cells, as compared with cells treated with αMSH alone (Figure 4). Quantification of the fluorescence intensities showed that treatment with CBA (20 µM) significantly enhanced the intensity by 3.66-fold as compared to MSH group, indicative of an increased acidification (Figure S2). Our results of increased acidification of cellular organelles without affecting tyrosinase activity are in accordance with reported effects of the flavone hesperidin which inhibited melanogenesis by a similar mechanism [25]. We did not test if melanosomes were the key organelles which became acidified, however it has been established that acidification of organelles other than melanosomes, such as endosomes, trans-Golgi network and lysosomes can inhibit melanogenesis [25,32,33].
Intra-melanocytic acidification is regulated by the sodium-dependent VC transporter isoform gene SVCT-2, which was downregulated in a previous study where authors evaluated mechanisms of acidification leading to the anti-melanogenic activity of Vitamin C and its derivatives [34]. Future studies which quantify whether CBA might also affect gene expression of SVCT-2, are warranted.

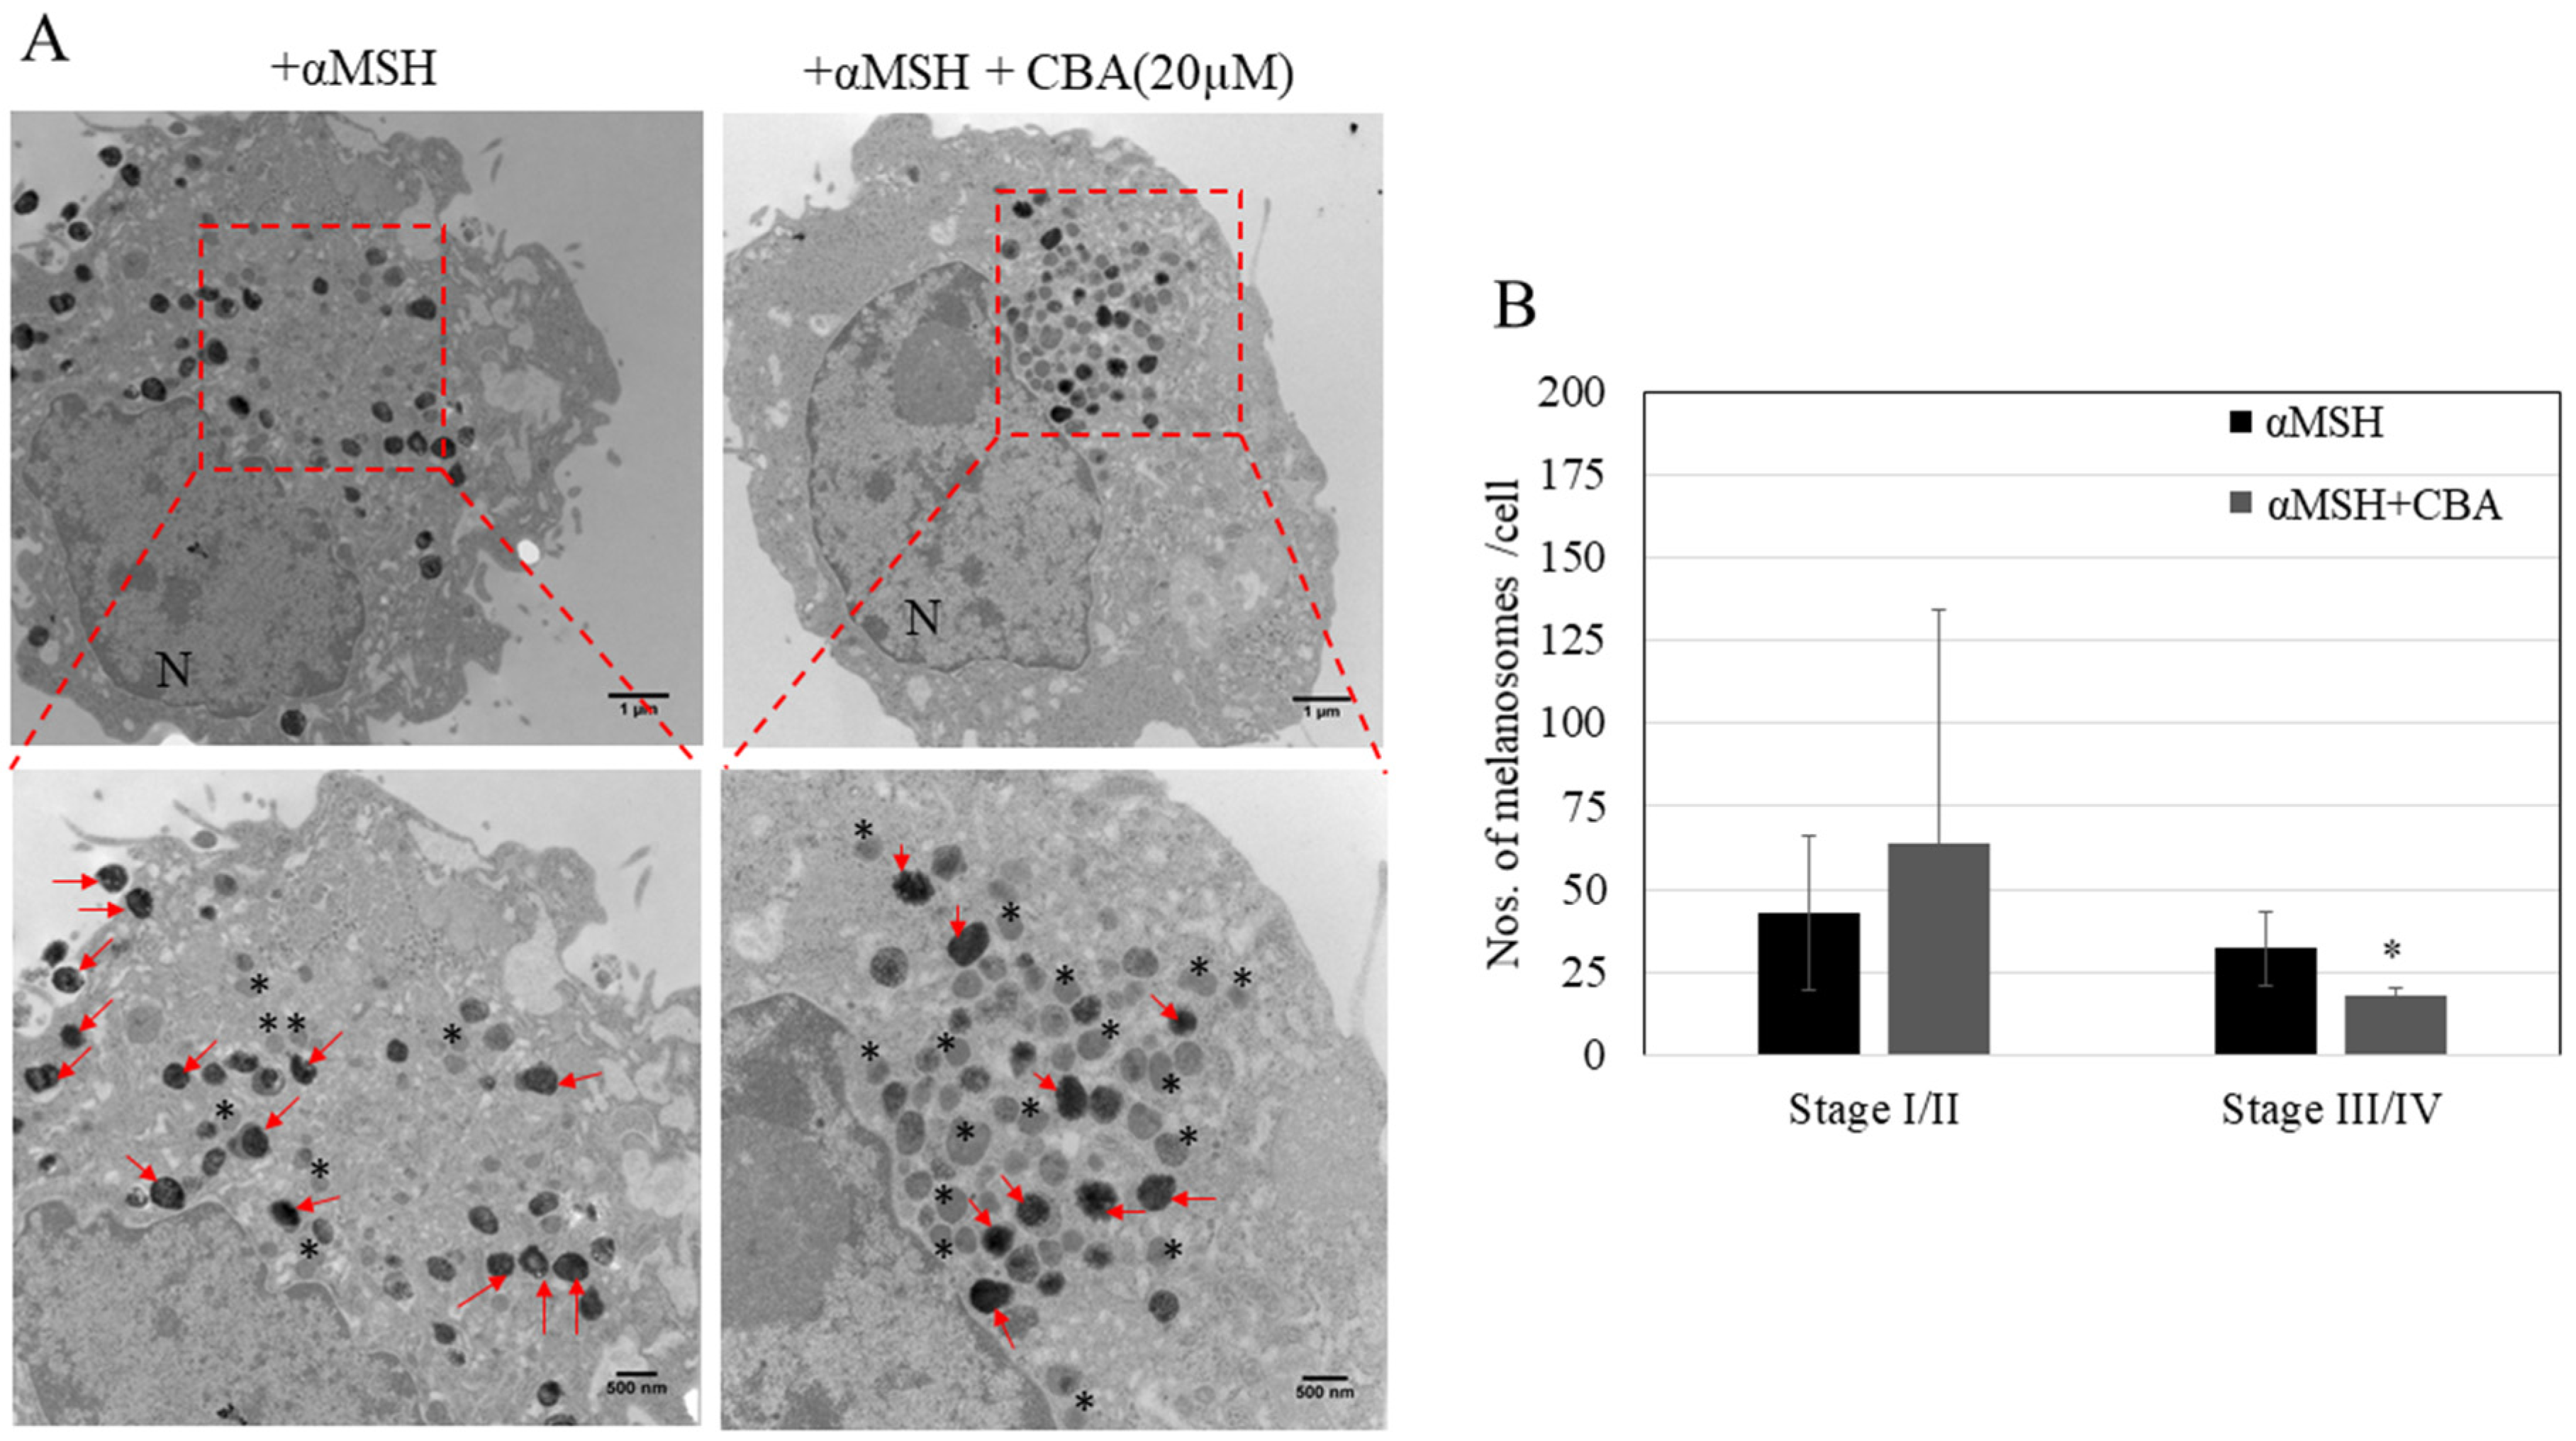
3.8. Effects of CBA on Ultrastructural Changes in Melanocytes

We next investigated if the anti-melanogenic activity of CBA could be explained, at least in part, by inhibition of the multistage pathway of melanosome maturation. Our qualitative results (Figure 5A) showed that treatment with CBA (20 µM) altered the distribution of melanosomes by causing an increase in immature melanosomes (Stage I/II) and a reduction in mature melanosomes (Stage III/IV). Quantification of melanosome stage distribution showed a significant reduction of 45% in mature melanosome count (Stage III/IV) of the αMSH + CBA treated cells as compared to cells treated with αMSH alone (Fig. 5B). This was accompanied by a trend towards increased accumulation of immature melanosomes, but the latter effect on melanosome maturation did not reach statistical significance. Collectively, the results demonstrate that CBA alters the distribution of melanosome stages and inhibits progression to mature stages which in turn, contribute to its capacity to inhibit melanin synthesis.
The biogenesis of melanosomes in melanocytes comprises four distinct stages of maturation. Stage I melanosomes, also known as premelanosomes are electron-lucent spherical organelles, while Stage II melanosomes are characterized by an internal fibrillar matrix. Stage III differs from stage II in that it has partial deposition of electron-dense melanin on the fibrillar matrix [35] and Stage IV has complete deposition of melanin on the internal fibrils. There have been reports of compounds which inhibited melanogenesis by inhibiting maturation of melanosomes [36,37]. To date, there is no report on any curcuminoid that can affect melanosome maturation; hence our report is the first to identify this mode of action for CBA.
The structure of CBA does not incorporate the beta-diketone group characteristic of the structure of the curcuminoid curcumin but rather retains the structure of an ester of ferulic acid, a metabolite of curcumin. Ferulic acid has been known to regulate melanogenesis dependent on concentration, conflicting reports showed that ferulic acid can induce melanogenesis [38] or inhibit melanogenesis [39]. CBA has a Michael acceptor group (C=C double bond) similar to curcumin. A previous study has attributed the group to CBA’s capacity to inhibit histone acetyltransferase (HAT), similar to curcumin [40].
Our results demonstrate that CBA exhibits a robust inhibition of αMSH-stimulated melanogenesis in B16F10 mouse melanoma cells. An investigation of the underlying mechanisms revealed that the anti-melanogenic activity of CBA is regulated by its capacity to induce acidification of cellular organelles. CBA did not inhibit mammalian tyrosinase activity in cellular lysates or mushroom tyrosinase in an in vitro system, nor did it affect intracellular glucosidase activity which regulates the direction of tyrosinase to cell organelle membranes, highlighting the conclusion that CBA is a not a tyrosinase inhibitor, unlike other curcuminoids. Since CBA is present in minor quantities in rhizomes of Curcuma longa (0.001% w/w), its isolation in sufficient amounts for inclusion in cosmetic formulations may be a limitation. However, a recent study demonstrated a better yield (0.05% w/w) of CBA when prepared from rhizomes of Curcuma caesia via a biotransformation process [41]. Another route has been developed to prepare synthetic CBA [42]. Another limitation associated with CBA is its poor aqueous solubility and bioavailability which is similar to the limitations associated with curcumin [43], however, solubility constraints may be overcome by use of suitable delivery excipients such as liposomes. For example, a recent study reported synthesis of liposomes of CBA which showed antiproliferative effects in human colorectal cancer and mouse neuroblastoma cells [44].

4. Conclusions

In conclusion, our results demonstrate that the curcuminoid analog CBA exhibits the capacity to inhibit αMSH-stimulated melanin biosynthesis by mechanisms which are not related to the inhibition of tyrosinase activity directly or in cellular lysates. Rather, CBA induces acidification of organelles and inhibits maturation of melanosomes. The direct antioxidant and α-glucosidase-inhibitory activities of CBA may also contribute to its anti-melanogenic activity. Future studies to test whether CBA can inhibit melanogenesis in human skin melanocytes and in vivo system are warranted.

Supplementary Materials

The following are available online at https://www.mdpi.com/2079-9284/6/3/51/s1, Figure S1: Basal (unstimulated) melanogenesis in B16F10 cells treated with CBA at various concentrations in 0.1% DMSO for 48 h quantitated by spectrophotometric method. Kojic acid (KA) was used as a positive control at 500 µM. Melanin absorbance were read at 475 nm and normalized by total protein content and relative melanin contents are reported as % of control. Values are mean ± SD of triplicate determinations.; Figure S2: Quantification of Fluorescence intensity of Lysotracker red probe. Bar plot shows the αMSH groups and αMSH group treated with CBA (20 µM). # symbol: significant as compared to αMSH (p= 0.0004); students t-test with Welch correction. Data is mean ± SD of 4 random microscopic field per condition; with total of at least 200 cells for each condition.

Author Contributions

S.G. conceived, designed and performed the experiments, analyzed the data and wrote the manuscript. K.N. and M.M. provided the purified compound, provided technical insights on compound, reviewed and approved the final manuscript. S.R.S. contributed funding for supplies and reviewed the final manuscript.

Funding

This research received no external funding.

Conflicts of Interest

The authors declare no conflict of interest. The funders had no role in the design of the study, in the collection, analyses, or interpretation of data, in the writing of the manuscript, or in the decision to publish the results.

References

  1. Tsatmali, M.; Ancans, J.; Thody, A.J. Melanocyte function and its control by melanocortin peptides. J. Histochem. Cytochem. 2002, 50, 12533. [Google Scholar] [CrossRef] [PubMed]
  2. Jimenez-Atienzar, M.; Escribano, J.; Cabanes, J.; Gandía-Herrero, F.; García-Carmona, F. Oxidation of the flavonoid eriodictyol by tyrosinase. Plant Physiol. Biochem. 2005, 43, 866–873. [Google Scholar] [CrossRef] [PubMed]
  3. Decker, H.; Tuczek, F. Tyrosinase/catecholoxidase activity of hemocyanins: structural basis and molecular mechanism. Trends Biochem. Sci. 2000, 25, 392–397. [Google Scholar] [CrossRef]
  4. Schauer, E.; Trautinger, F.; Köck, A.; Schwarz, A.; Bhardwaj, R.; Simon, M.; Ansel, J.C.; Schwarz, T.; Luger, T.A. Proopiomelanocortin-derived peptides are synthesized and released by human keratinocytes. J. Clin. Investig. 1994, 93, 2258–2262. [Google Scholar] [CrossRef] [PubMed]
  5. Chakraborty, A.; Slominski, A.; Ermak, G.; Hwang, J.; Pawelek, J. Ultraviolet B and melanocyte-stimulating hormone (MSH) stimulate mRNA production for alpha MSH receptors and proopiomelanocortin-derived peptides in mouse melanoma cells and transformed keratinocytes. J. Invest. Derm. 1995, 105, 655–659. [Google Scholar] [CrossRef] [PubMed]
  6. García-Gavín, J.; González-Vilas, D.; Fernández-Redondo, V.; Toribio, J. Pigmented contact dermatitis due to kojic acid. A paradoxical side effect of a skin lightener. Contact Dermat. 2010, 62, 63–64. [Google Scholar]
  7. Kooyers, T.; Westerhof, W. Toxicology and health risks of hydroquinone in skin lightening formulations. J. Eur. Acad. Dermatol. Venereol. 2006, 20, 777–780. [Google Scholar] [CrossRef]
  8. Cheng, S.L.; Liu, R.H.; Sheu, J.N.; Chen, S.T.; Sinchaikul, S.; Tsay, G.J. Toxicogenomics of A375 human malignant melanoma cells treated with arbutin. J. Biomed. Sci. 2007, 14, 87–105. [Google Scholar] [CrossRef]
  9. Kim, D.S.; Kim, J.Y. Total synthesis of Calebin-A, preparation of its analogues, and their neuronal cell protectivity against beta-amyloid insult. Bioorg. Med. Chem. Lett. 2001, 11, 2541–2543. [Google Scholar] [CrossRef]
  10. Li, Y.; Li, S.; Han, Y.; Liu, J.; Zhang, J.; Li, F.; Yao, L. Calebin-A induces apoptosis and modulates MAPK family activity in drug resistant human gastric cancer cells. Eur. J. Pharmacol. 2008, 591, 252–258. [Google Scholar] [CrossRef]
  11. Lee, M.J.; Tsai, Y.J.; Lin, M.Y.; You, H.L.; Kalyanam, N.; Ho, C.T.; Pan, M.H. Calebin A induced death of malignant peripheral nerve sheath tumor cells by activation of histone acetyltransferase. Phytomedicine 2019, 57, 377–384. [Google Scholar] [CrossRef]
  12. Tyagi, A.K.; Prasad, S.; Majeed, M.; Aggarwal, B.B. Calebin A novel component of turmeric, suppresses NF-kappaB regulated cell survival and inflammatory gene products leading to inhibition of cell growth and chemosensitization. Phytomedicine 2017, 34, 171–181. [Google Scholar] [CrossRef]
  13. Tyagi, A.K.; Prasad, S.; Majeed, M.; Aggarwal, B.B. Calebin A downregulates osteoclastogenesis through suppression of RANKL signalling. Arch. Biochem. Biophys 2016, 593, 80–89. [Google Scholar] [CrossRef]
  14. Park, S.Y.; Kim, D.S. Discovery of natural products from curcuma longa that protect cells from beta-amyloid insult: a drug discovery effort against Alzheimer’s disease. J. Nat. Prod. 2002, 65, 1227–1231. [Google Scholar] [CrossRef]
  15. Lai, C.S.; Liao, S.N.; Tsai, M.L.; Kalyanam, N.; Majeed, M.; Majeed, A.; Ho, C.T.; Pan, M.H. Calebin-A inhibits adipogenesis and hepatic steatosis in high-fat diet-induced obesity via activation of AMPK signaling. Mol. Nutr. Food Res. 2015, 59, 1883–1895. [Google Scholar] [CrossRef]
  16. Majeed, M.; Nagabhushanam, K.; Natarajan, S.; Bani, S.; Pandey, A.; Karri, S.K. Investigation of repeated dose (90 day) oral toxicity, reproductive/developmental toxicity and mutagenic potential of ‘Calebin A’. Toxicol Rep. 2015, 2, 580–589. [Google Scholar] [CrossRef]
  17. Chen, L.; Li, S.; Liu, C.; Guo, H.; Li, Y. Comparison of inhibitive effects of curcumin and calebin-A on human hepatoma cell line HepG2. J. Fourth Mil. Med. Univ. 2009, 30, 7–10. [Google Scholar]
  18. Jang, J.Y.; Lee, J.H.; Jeong, S.Y.; Chung, K.T.; Choi, Y.H.; Choi, B.T. Partially purified curcuma longa inhibits alpha-melanocyte-stimulating hormone-stimulated melanogenesis through extracellular signal-regulated kinase or Akt activation-mediated signalling in B16F10 cells. Exp. Dermatol. 2009, 18, 689–694. [Google Scholar] [CrossRef]
  19. Lee, J.H.; Jang, J.Y.; Park, C.; Kim, B.W.; Choi, Y.H.; Choi, B.T. Curcumin suppresses α-melanocyte stimulating hormone-stimulated melanogenesis in B16F10 cells. Int. J. Mol. Med. 2010, 26, 101–106. [Google Scholar]
  20. Goenka, S.; Ceccoli, J.; Simon, S.R. Anti-melanogenic activity of ellagitannin casuarictin in B16F10 mouse melanoma cells. Nat. Product Res. 2019, 1–6. [Google Scholar] [CrossRef]
  21. Mikami, M.; Sonoki, T.; Ito, M.; Funasaka, Y.; Suzuki, T.; Katagata, Y. Glycosylation of tyrosinase is a determinant of melanin production in cultured melanoma cells. Mol. Med. Rep. 2013, 8, 818–822. [Google Scholar] [CrossRef]
  22. Wang, N.; Hebert, D.N. Tyrosinase maturation through the mammalian secretory pathway: bringing color to life. pigment. Cell Res. 2006, 19, 3–18. [Google Scholar] [CrossRef]
  23. Song, Y.H.; Uddin, Z.; Jin, Y.M.; Li, Z.; Curtis-Long, M.J.; Kim, K.D.; Cho, J.K.; Park, K.H. Inhibition of protein tyrosine phosphatase (PTP1B) and alpha-glucosidase by geranylated flavonoids from paulownia tomentosa. J. Enzyme Inhib. Med. Chem. 2017, 32, 1195–1202. [Google Scholar] [CrossRef]
  24. Cunha, E.S.; Kawahara, R.; Kadowaki, M.K.; Amstalden, H.G.; Noleto, G.R. Melanogenesis stimulation in B16-F10 melanoma cells induces cell cycle alterations, increased ROS levels and a differential expression of proteins as revealed by proteomic analysis. Exp. Cell Res. 2012, 318, 1913–1925. [Google Scholar] [CrossRef]
  25. Yoshizaki, N.; Hashizume, R.; Masaki, H. A polymethoxyflavone mixture extracted from orange peels, mainly containing nobiletin, 3, 3’, 4’, 5, 6, 7, 8-heptamethoxyflavone and tangeretin, suppresses melanogenesis through the acidification of cell organelles, including melanosomes. J. Dermatol. Sci. 2017, 88, 78–84. [Google Scholar] [CrossRef]
  26. Lehr, H.A.; Mankoff, D.A.; Corwin, D.; Santeusanio, G.; Gown, A.M. Application of photoshop-based image analysis to quantification of hormone receptor expression in breast cancer. J. Histochem. Cytochem. 1997, 45, 1559–1565. [Google Scholar] [CrossRef]
  27. Martinez-Esparza, M.; Ferrer, C.; Castells, M.T.; García-Borrón, J.C.; Zuasti, A. Transforming growth factor beta1 mediates hypopigmentation of B16 mouse melanoma cells by inhibition of melanin formation and melanosome maturation. Int. J. Biochem. Cell Biol. 2001, 33, 971–983. [Google Scholar] [CrossRef]
  28. Fang, D.; Dockery, P.; Weatherhead, B. Stereological studies of the effects of alpha-MSH and cAMP on melanosomes in melanoma cells. Pigment Cell Res. 1998, 11, 337–344. [Google Scholar] [CrossRef]
  29. Chen, L.; Xu, Z.; Jiang, M.; Zhang, C.; Wang, X.; Xiang, L. Light-emitting diode 585 nm photomodulation inhibiting melanin synthesis and inducing autophagy in human melanocytes. J. Dermatol. Sci. 2018, 89, 11–18. [Google Scholar] [CrossRef] [Green Version]
  30. Du, Z.Y.; Jiang, Y.F.; Tang, Z.K.; Mo, R.Q.; Xue, G.H.; Lu, Y.J.; Zheng, X.; Dong, C.Z.; Zhang, K. Antioxidation and tyrosinase inhibition of polyphenolic curcumin analogs. Biosci. Biotechnol. Biochem. 2011, 75, 2351–2358. [Google Scholar] [CrossRef]
  31. Du, Z.Y.; Liu, R.R.; Shao, W.Y.; Mao, X.P.; Ma, L.; Gu, L.Q.; Huang, Z.S.; Chan, A.S. Alpha-glucosidase inhibition of natural curcuminoids and curcumin analogs. Eur. J. Med. Chem. 2006, 41, 213–218. [Google Scholar] [CrossRef]
  32. Halaban, R.; Patton, R.S.; Cheng, E.; Svedine, S.; Trombetta, E.S.; Wahl, M.L.; Ariyan, S.; Hebert, D.N. Abnormal acidification of melanoma cells induces tyrosinase retention in the early secretory pathway. J. Biol. Chem. 2002, 277, 14821–14828. [Google Scholar] [CrossRef]
  33. Watabe, H.; Valencia, J.C.; Yasumoto, K.I.; Kushimoto, T.; Ando, H.; Muller, J.; Vieira, W.D.; Mizoguchi, M.; Appella, E.; Hearing, V.J. Regulation of tyrosinase processing and trafficking by organellar pH and by proteasome activity. J. Biol. Chem. 2004, 279, 7971–7981. [Google Scholar] [CrossRef]
  34. Miao, F.; Su, M.Y.; Jiang, S.; Luo, L.F.; Shi, Y.; Lei, T.C. Intramelanocytic acidification plays a role in the antimelanogenic and antioxidative properties of vitamin C and its derivatives. Oxid Med. Cell Longev. 2019. [Google Scholar] [CrossRef]
  35. Basrur, V.; Yang, F.; Kushimoto, T.; Higashimoto, Y.; Yasumoto, K.I.; Valencia, J.; Muller, J.; Vieira, W.D.; Watabe, H.; Shabanowitz, J.; et al. Proteomic analysis of early melanosomes: identification of novel melanosomal proteins. J. Proteome Res. 2003, 2, 69–79. [Google Scholar] [CrossRef]
  36. Liang, Y.R.; Kang, S.; Deng, L.; Xiang, L.P.; Zheng, X.Q. Inhibitory effects of (-)-epigallocatechin-3-gallate on melanogenesis in ultraviolet A-induced B16 murine melanoma cell. Trop. J. Pharm. Res. 2014, 13, 1825–1831. [Google Scholar] [CrossRef]
  37. Wu, S.Y.S.; Wang, H.M.; Wen, Y.S.; Liu, W.; Li, P.H.; Chiu, C.C.; Chen, P.C.; Huang, C.Y.; Wen, Z.H. 4-(Phenylsulfanyl) butan-2-one suppresses melanin synthesis and melanosome maturation in vitro and in vivo. Int. J. Mol. Sci. 2015, 16, 20240–20257. [Google Scholar] [CrossRef]
  38. Yoon, H.S.; Lee, N.H.; Hyun, C.G.; Shin, D.B. Differential effects of methoxylated p-coumaric acids on melanoma in B16/F10 cells. Prev. Nutr. Food Sci. 2015, 20, 73–77. [Google Scholar] [CrossRef]
  39. Maruyama, H.; Kawakami, F.; Lwin, T.T.; Imai, M.; Shamsa, F. Biochemical characterization of ferulic acid and caffeic acid which effectively inhibit melanin synthesis via different mechanisms in B16 melanoma cells. Biol. Pharm. Bull. 2018, 41, 806–810. [Google Scholar] [CrossRef]
  40. Novaes, J.T.; Lillico, R.; Sayre, C.; Nagabushanam, K.; Majeed, M.; Chen, Y.; Ho, E.; Oliveira, A.; Martinez, S.; Alrushaid, S.; et al. Disposition, metabolism and histone deacetylase and acetyltransferase inhibition activity of tetrahydrocurcumin and other curcuminoids. Pharmaceutics 2017, 9, 45. [Google Scholar] [CrossRef]
  41. Majeed, A.; Majeed, M.; Thajuddin, N.; Arumugam, S.; Ali, F.; Beede, K.; Adams, S.J.; Gnanamani, M. Bioconversion of curcumin into calebin-A by the endophytic fungus Ovatospora brasiliensis EPE-10 MTCC 25236 associated with curcuma caesia. AMB Express 2019, 9, 79. [Google Scholar] [CrossRef]
  42. Majeed, A.; Nagabhushanam, K.; Majeed, M.; Thomas, S.M.; Thajuddin, N. An expeditious, green and protecting-group-free synthesis of a potent secondary metabolite calebin-a and its analogues. SynOpen 2017, 1, 125–128. [Google Scholar]
  43. Oliveira, A.L.; Martinez, S.E.; Nagabushnam, K.; Majeed, M.; Alrushaid, S.; Sayre, C.L.; Davies, N.M. Calebin A: analytical development for pharmacokinetics study, elucidation of pharmacological activities and content analysis of natural health products. J. Pharm.Sci. 2015, 18, 494–514. [Google Scholar] [CrossRef]
  44. Pan, M.; Chiou, Y.S.; Kalyanam, N.; Ho, C.T.; Ding, B. Preparation of calebin a liposomes and its antiproliferation in human cancer cells. J. Anal. Pharm. Res. 2017, 5, 137. [Google Scholar] [CrossRef]
Figure 1. (A) Chemical structure of Calebin-A (CBA), (B) Viability of B16F10 mouse melanoma cells treated with CBA at various concentrations in 0.1% DMSO for 48 h quantitated by MTS assay, #p < 0.01 versus control. Data are average of quadruplicate determinations.
Cosmetics 06 00051 g001
Figure 2. (A) Representative phase-contrast images showing B16F10 cells treated without and with αMSH in the presence of CBA (20µM), scale bar corresponds to 100µm, (B) B16F10 cells treated with CBA at various concentrations in 0.1% DMSO in the presence or absence of αMSH for 48 h quantitated by spectrophotometric method. Kojic acid (KA) was used as a positive control at 500 µM and concentration of αMSH was 150 nM, (C) Cellular tyrosinase activity in B16F10 cell lysates, #p < 0.01 versus control, *p < 0.05 versus control. Data are averaged from at least two independent experiments.
Cosmetics 06 00051 g002
Figure 3. (A) Diphenolase activity of tyrosinase enzyme measured with different concentrations of CBA, (B) Monophenolase activity of tyrosinase enzyme measured with different concentrations of CBA, (C) Cellular, and (D) In vitro α-glucosidase activity, (E) Cellular reactive oxygen species (ROS) estimated in B16F10 cells treated for 48 h with CBA as measured by reduction of Dichlorofluorescein (DCF) fluorescence using 2′,7′-Dichlorodihydrofluorescein diacetate (DCFH-DA) probe, (F) DPPH radical inhibition assay for antioxidant activity, *p < 0.05 versus control, #p < 0.01 versus control. Data for (C) is pooled from at least two independent experiments while (E) is average of quadruplicate determinations while all other assays are mean ± standard deviation (SD) of triplicate determinations.
Cosmetics 06 00051 g003
Figure 4. Representative fluorescent images of B16F10 cells treated without and with αMSH in presence of CBA (20 µM) and stained by Lysotracker dye.
Cosmetics 06 00051 g004
Figure 5. (A) Ultrastructural analysis of melanosomes in B16F10 cells treated with CBA (20 µM) in absence or presence of αMSH, N-nucleus. The red square shows the exploded view at higher magnification, the asterisk (*) symbol denotes immature melanosomes (Stage I/II) and red arrows denote mature melanosomes (Stage III/IV), (B) Quantification of melanosome numbers in different stages. A total of 325 melanosomes for the αMSH group and 287 melanosomes for the MSH + CBA group were counted from 8–10 random electron micrographs. *p < 0.05; student’s t -test with Welch correction.
Cosmetics 06 00051 g005

