Article

Formulation Development and Optimization of Glycolic Acid-Loaded Ethanol-Based Niosomes for Enhanced Dermal Delivery and Stability


by
Nuntawat Khat-udomkiri
*,
Worakamon Aranchot
,
Onnapa Panarkas
,
Nanthanat Nonthaman
and
Pavittra Theprak
School of Cosmetic Science, Mae Fah Luang University, Chiang Rai 57100, Thailand
*
Author to whom correspondence should be addressed.
Cosmetics 2026, 13(2), 86; https://doi.org/10.3390/cosmetics13020086
Submission received: 4 March 2026 / Revised: 24 March 2026 / Accepted: 30 March 2026 / Published: 2 April 2026
(This article belongs to the Section Cosmetic Formulations)

Abstract

Glycolic acid (GA), a widely used alpha-hydroxy acid in cosmetic formulations, promotes exfoliation and stimulates fibroblasts in the dermis to synthesize collagen. However, its hydrophilic nature limits penetration through the stratum corneum, reducing its overall efficacy. This study aimed to develop and optimize an ethanol-based niosomal system to enhance GA skin delivery and formulation stability for cosmetic applications. Brij 97 combined with cholesterol at a 1:1 ratio and 10% ethanol produced the optimal formulation. Blank vesicles exhibited a mean vesicle size of 170.53 ± 5.05 nm and a zeta potential of −37.77 ± 2.21 mV, indicating favorable colloidal stability. Incorporation of 10% GA resulted in vesicles with a mean size of 176.93 ± 1.51 nm, a polydispersity index of 0.12 ± 0.02, and an entrapment efficiency of 75.48 ± 0.21%. In vitro permeation studies using Strat-M® membranes demonstrated significantly higher cumulative skin penetration (49.56 ± 8.95 mg/cm2) and sustained release over 24 h compared with a conventional GA solution. Stability testing under heating–cooling cycles and storage at 4 °C showed slight increases in vesicle size while maintaining homogeneity (polydispersity index (PDI) < 0.3). These findings highlight ethanol-based niosomes as an effective strategy for enhancing GA cosmetic performance.

1. Introduction

GA is one of the most widely used alpha-hydroxy acids (AHAs) in dermatology and cosmetic science. It promotes exfoliation by disrupting intercellular adhesion within the stratum corneum and stimulates fibroblasts in the dermis to synthesize collagen, thereby improving skin texture and reducing visible signs of photoaging [1]. These properties have led to its extensive incorporation into chemical peels, brightening formulations, and anti-aging skincare products. Despite its proven efficacy, the cosmetic application of GA is frequently associated with irritation, particularly at concentrations required to achieve visible clinical outcomes. Rapid penetration of the free acid may result in erythema, burning, and stinging sensations. Furthermore, although GA is hydrophilic, its diffusion into deeper skin layers is restricted by the lipophilic barrier of the stratum corneum, limiting delivery to the dermis where collagen stimulation occurs [2]. These challenges highlight the need for advanced delivery strategies capable of balancing efficacy and tolerability.
Vesicular delivery systems, including liposomes and niosomes, have been widely investigated to improve topical bioavailability because of their biocompatibility and formulation versatility [3]. Among these, niosomes are formed from non-ionic surfactants that spontaneously assemble into closed bilayer vesicles. In this structure, the hydrophilic head groups face the external aqueous environment, while the hydrophobic tails orient inward, creating a bilayer capable of entrapping both hydrophilic and lipophilic active compounds. Such architecture supports enhanced bioavailability and provides a controlled release profile, which is advantageous for cosmetic applications requiring sustained and localized activity [4]. Previous studies have explored the use of niosomal systems for the delivery of glycolic acid and other α-hydroxy acids (AHAs), demonstrating improved skin penetration and reduced irritation compared with conventional formulations [5,6]. In addition, niosomes have been successfully applied to other small, hydrophilic active compounds, where they enhanced stability and promoted greater accumulation within the skin [7]. However, conventional vesicular systems often exhibit limited membrane flexibility. Their relatively rigid bilayer structure can restrict penetration beyond the superficial layers of the stratum corneum, thereby reducing delivery efficiency to deeper skin regions [8,9]. To overcome this limitation, ethanol-based vesicular carriers have been introduced as a modified approach. The incorporation of ethanol into the bilayer enhances membrane fluidity and increases the fluidization of stratum corneum lipids, which collectively promotes improved permeation of encapsulated active ingredients [10]. Building on these advances, the present study provides further insight into the design of ethanol-modified niosomal systems for AHA delivery, offering a more effective strategy to enhance dermal performance while maintaining suitability for cosmetic applications.
The present study introduces a systematic formulation strategy for developing ethanol-based niosomes to improve the cosmetic delivery of GA. The novelty lies in the integrated optimization of key formulation variables, including nonionic surfactant type, surfactant-to-cholesterol ratio, ethanol concentration, and GA loading level. The study aimed to identify parameters that significantly influence vesicle characteristics. Physicochemical properties, encapsulation efficiency, in vitro skin permeation, and stability were comprehensively evaluated to establish clear relationships between formulation design and functional outcomes. The optimized system offers improved loading capacity, controlled release, and enhanced penetration, supporting its application in advanced cosmetic formulations.

2. Materials and Methods

2.1. Materials

Glycolic acid, Ceteth-20 (Brij C20), Steareth-2 (Brij 72), and cholesterol were obtained from Chanjao Longevity Company Limited (Bangkok, Thailand). Oleth-10 (Brij 97) was kindly supplied by Croda (Thailand) Corporation, Limited (Bangkok, Thailand). Ethanol and Chloroform were purchased from RCI Labscan Limited (Bangkok, Thailand). Dibasic sodium phosphate dihydrate (Na2HPO4·2H2O) and monobasic sodium phosphate dihydrate (NaH2PO4·2H2O) were obtained from Ajax Finechem (Seven Hills, Australia). All other reagents and organic solvents used in this study were of analytical grade and were used without further purification.

2.2. Preparation of Glycolic Acid-Loaded Ethanol-Based Niosomes and Conventional Niosomes

Ethanol-based niosomes were prepared using the thin-film hydration method as previously described [11]. Briefly, the selected non-ionic surfactant and cholesterol were dissolved in 50 mL of chloroform in a round-bottom flask. The organic solvent was removed under reduced pressure using a rotary evaporator (Hei-VAP Expert Control, Heidolph, Schwabach, Germany) to form a thin film on the flask wall. The film was left undisturbed for 24 h to ensure complete removal of residual chloroform. For hydration, ethanol, distilled water, and glycolic acid were added to the round-bottom flask containing the thin film. The mixture was gently hand-shaken to detach and disperse the film, forming multilamellar vesicles. The dispersion was then sonicated using a probe sonicator (VCX130, SONICS, Newtown, CT, USA) with alternating pulses (20 s on/20 s off) at 40% amplitude for 8 min to reduce vesicle size. The resulting suspension was centrifuged at 7000 rpm for 5 min at 25 °C (DL-3020HR, METHER, Hefei, China). Conventional niosomes were prepared using the same procedure, except that the thin film was hydrated with distilled water containing glycolic acid without ethanol.

2.3. Factors Influencing the Preparation of Ethanol-Based Niosomes

2.3.1. Effect of Nonionic Surfactant Type

The influence of nonionic surfactant type on ethanol-based niosome formation was investigated. Brij 97, Brij C20, and Brij 72 were individually evaluated to determine their effects on vesicle characteristics, including vesicle size, PDI, and zeta potential. For this comparison, a fixed surfactant-to-cholesterol ratio of 1:1 was maintained to ensure consistent formulation conditions.

2.3.2. Effect of Surfactant-to-Cholesterol Ratio

The impact of the nonionic surfactant-to-cholesterol (Brij 97:Chol) ratio on vesicle formation and physicochemical properties was systematically examined. Brij 97 was selected as the surfactant, and formulations were prepared at varying surfactant-to-cholesterol ratios of 1:1, 2:1, 3:1, and 5:1 using the thin-film hydration method [12].

2.3.3. Effect of Ethanol Concentration

To assess the role of ethanol in vesicle performance, formulations were prepared with ethanol concentrations of 10%, 20%, 30%, 40%, and 50%, as well as a control without ethanol. The surfactant-to-cholesterol ratio was fixed at 1:1 (Brij 97:Chol), while all other parameters were kept constant [13].

2.3.4. Effect of Glycolic Acid Concentration

The influence of glycolic acid loading on vesicle characteristics was evaluated by hydrating the thin film with 10% ethanol containing GA at concentrations ranging from 0.5% to 90% w/v, while maintaining a fixed 1:1 ratio of Brij 97 to cholesterol.

2.4. Determination of Maximum Glycolic Acid Loading

The maximum loading capacity of GA in the ethanol-based niosomal system was determined by identifying the highest GA concentration that maintained physical stability [14]. Formulations containing increasing concentrations of GA were stored at room temperature overnight and subsequently centrifuged at 7000 rpm for 1 min. The maximum loading was defined as the highest concentration that showed no visible precipitation or phase separation after storage and centrifugation. This approach ensured the selection of a stable formulation suitable for further physicochemical characterization and performance evaluation.

2.5. Characterization of Glycolic Acid-Loaded Ethanol-Based Niosomes

2.5.1. Vesicle Size, Polydispersity, and Zeta Potential

Prior to analysis, niosomal formulations were diluted (1:10, v/v) with distilled water. Vesicle size, PDI, and zeta potential were measured using a nanovesicle analyzer (SZ-100Z2, HORIBA, Kyoto, Japan). These parameters were used to evaluate size distribution, colloidal homogeneity, and surface charge stability of the formulations [15].

2.5.2. Morphological Analysis by Scanning Electron Microscopy

Vesicle morphology was examined using a field-emission scanning electron microscope (MIRA4, TESCAN, Brno, Czech Republic) [16]. Ethanol-based niosomes loaded with 10% glycolic acid were diluted with ethanol, placed onto an SEM stub, and gold-coated prior to imaging. Samples were observed at 100,000× magnification to assess vesicle shape, surface characteristics, and aggregation behavior.

2.5.3. Entrapment Efficiency

Entrapment efficiency (EE) was determined using an indirect method [17]. The formulation was centrifuged at 14,000 rpm for 1 h at 4 °C to separate unencapsulated glycolic acid. The supernatant was collected and analyzed by UV–visible spectroscopy (Libra S22, Biochrom, Cambridge, UK) at 210 nm [13]. EE was calculated using the following equation:
E E ( % ) = C t C f C t × 100
where C t represents the total glycolic acid content and C f the free glycolic acid concentration.

2.5.4. Differential Scanning Calorimetry

Differential scanning calorimetry (DSC3+, METTLER TOLEDO, Columbus, OH, USA) was conducted to evaluate the thermal behavior and fluidizing effect of ethanol within the vesicular system [18]. Samples were heated from −70 °C to 300 °C at a rate of 10 °C/min under a nitrogen atmosphere [17].

2.6. In Vitro Release and Permeation Studies

The permeation profiles of glycolic acid-loaded ethanol-based niosomes (LGA10%) and glycolic acid solution (GA10%) were evaluated using a vertical Franz diffusion cell system (LOGAN FDC-6, LOGAN, Somerset, NJ, USA) equipped with a Strat-M® synthetic membrane (Merck Millipore, Burlington, MA, USA) [19,20]. The Strat-M® membrane, a commercially available multilayer model, was selected for its ability to simulate the barrier properties of human skin. It comprises a dense layer and a more porous layer, supported by a lipid-impregnated structure that mimics the stratum corneum [21]. Prior to the experiment, the membrane was equilibrated in phosphate-buffered saline (PBS) for 30 min to ensure proper hydration. It was then mounted between the donor and receptor compartments, with the active surface oriented toward the donor side. The receptor compartment was filled with 15 mL of PBS and maintained at 37 ± 0.5 °C under continuous magnetic stirring at 100 rpm to simulate physiological conditions. At predetermined intervals (2, 4, 6, 8, 12, and 24 h), 100 µL aliquots were withdrawn from the receptor medium and analyzed using a UV–Vis spectrophotometer at 210 nm. Following completion of the permeation study, the Strat-M® membranes were carefully removed, rinsed with 0.5% sodium lauryl sulfate solution to eliminate residual surface glycolic acid, and gently dried. The membranes were then sectioned and immersed in 2 mL of methanol for 24 h at 4 °C to extract retained glycolic acid. After extraction, samples were homogenized for 3 min and centrifuged at 3500 rpm for 5 min. The supernatant was analyzed at 210 nm to quantify the total glycolic acid retained within the membrane. Permeation data were expressed as cumulative drug permeated (mg/cm2) and steady-state flux (mg/cm2/h), providing a comparative assessment of delivery efficiency between the niosomal formulation and the free glycolic acid solution.

2.7. Stability Studies

2.7.1. Heating–Cooling Cycle Test

The physical stability of blank and glycolic acid-loaded ethanol-based niosomes was assessed using a heating–cooling cycle test [22]. The formulations were subjected to six consecutive cycles, with each cycle consisting of storage at 4 °C for 24 h followed by storage at 45 °C for an additional 24 h using temperature and humidity chamber (GOTECH/GT-7005-AT2, Gotech Testing Machines Inc., Taichung, Taiwan). Vesicle size, PDI, and zeta potential were measured prior to the stability study and again after completion of the six cycles. Changes in these parameters were used to evaluate the resistance of the vesicular system to temperature-induced stress.

2.7.2. Long-Term Stability Study

For long-term stability evaluation, samples were stored in triplicate at 4 °C, room temperature, and 45 °C for a period of three months [14]. Vesicle size, PDI, and zeta potential were determined at baseline and after 1, 2, and 3 months of storage. At the end of the three-month period, entrapment efficiency was also measured for samples stored under each condition. This approach allowed for a comprehensive assessment of both physical stability and active compound retention over time, reflecting conditions relevant to cosmetic product storage and distribution.

2.8. Statistical Analysis

All experimental data are expressed as mean ± standard deviation (S.D.) based on three independent replicates. Differences between two related groups were evaluated using an independent t-test, while comparisons among multiple groups were conducted using one-way analysis of variance (ANOVA). When significant differences were detected (p < 0.05), Fisher’s Least Significant Difference (LSD) was applied as a post hoc analysis to identify specific group differences. A significant level of p < 0.05 was considered statistically significant throughout the study.

3. Results and Discussion

3.1. Development of Ethanol-Based Niosome

3.1.1. Effect of Nonionic Surfactant Type

To develop the niosomal delivery system, formulations were prepared using the thin-film hydration method. Different nonionic surfactants—Brij 97, Brij C20, and Brij 72—were individually combined with cholesterol at a fixed 1:1 molar ratio. The influence of surfactant selection on key physicochemical properties, including vesicle size (nm), PDI, and zeta potential (mV), was systematically evaluated. The results are summarized in Table 1.
The findings clearly demonstrate that the type of nonionic surfactant plays a significant role in determining the physicochemical characteristics of niosomes. Variations in vesicle size, size distribution, and surface charge can be largely attributed to differences in molecular structure, hydrophilic–lipophilic balance (HLB), and the critical packing parameter (CPP) of the surfactants employed.
From a structural perspective, surfactants differ in the number and arrangement of their hydrophobic tails as well as in the size of their hydrophilic head groups. These molecular features influence how efficiently the molecules organize into bilayer vesicles. Surfactants such as Brij 97, which possess a single hydrophobic chain and relatively higher HLB value, tend to form more compact and well-organized bilayers. This efficient packing promotes the formation of smaller vesicles (401.80 ± 16.28 nm). In contrast, Brij 72, characterized by a lower HLB value (4.9) and distinct structural configuration, forms substantially larger vesicles (2390.00 ± 121.20 nm). The increased size can be attributed to less efficient molecular packing and higher interfacial tension between the lipid and aqueous phases [23,24]. The critical packing parameter further explains these observations. CPP, defined as the ratio between the hydrophobic tail volume and the product of head group area and tail length, predicts the preferred geometry of self-assembled structures. Surfactants with CPP values favoring bilayer formation tend to produce stable vesicular systems. Higher CPP values are generally associated with cylindrical or bilayer structures, whereas lower values promote more spherical assemblies [25]. The balance between head group size and tail volume in Brij 97 appears to favor the formation of stable, smaller vesicles compared with Brij 72. HLB is another important determinant of vesicle characteristics. Surfactants with higher HLB values, such as Brij 97 (HLB 12.4) and Brij C20 (HLB 15.7), enhance hydrophilicity at the vesicle interface. This reduces interfacial tension during hydration and facilitates the formation of smaller and more uniformly dispersed vesicles [26]. In addition, surfactants with higher molecular weight contribute to improved membrane rigidity and structural integrity, limiting vesicle expansion and supporting the formation of compact bilayers [27]. Together, these properties explain the comparatively smaller vesicle sizes observed for Brij 97 and Brij C20 formulations.
Although nonionic surfactants do not carry a formal charge, they significantly influence the zeta potential of the resulting niosomes. Zeta potential reflects the surface charge environment of vesicles and is a key indicator of colloidal stability. In this study, Brij 97, Brij C20, and Brij 72 produced zeta potential values of −68.87 mV, −54.20 mV, and −41.67 mV, respectively. These negative values suggest the presence of surface-associated ions and structured hydration layers that contribute to electrostatic repulsion between vesicles. A higher absolute zeta potential generally indicates greater resistance to aggregation, thereby enhancing dispersion stability [28]. The more negative zeta potential observed for Brij 97 can be associated with its higher HLB and greater affinity for water. The hydrophilic polyoxyethylene chains likely interact strongly with surrounding water molecules, forming a hydration shell that influences the surface charge distribution [29]. In contrast, the lower HLB of Brij 72 results in a comparatively weaker hydration layer and reduced electrostatic stabilization, consistent with its lower absolute zeta potential value. These findings highlight that even in nonionic systems, molecular architecture and hydrophilicity substantially affect surface properties and stability.
Surfactant type also influenced the PDI, which reflects the uniformity of vesicle size distribution. Lower PDI values indicate a more homogeneous system, an important attribute for cosmetic formulations where consistency and stability are essential. Brij 97 and Brij C20 exhibited relatively low PDI values (0.36 ± 0.04 and 0.35 ± 0.24, respectively), suggesting the formation of more uniform vesicles. In contrast, Brij 72 showed a higher PDI (0.62 ± 0.55), indicating broader size distribution and reduced homogeneity [30]. Differences in carbon chain length, degree of saturation, and molecular flexibility likely contribute to these variations, as longer or more structurally favorable chains promote more stable and uniform bilayer assembly [26].
Overall, the results demonstrate that subtle differences in surfactant molecular characteristics translate into marked variations in vesicle size, stability, and uniformity. Surfactants with higher HLB values and favorable packing geometry, particularly Brij 97, produced smaller, more stable, and more homogeneous niosomes. These attributes are particularly advantageous for cosmetic applications, where formulation stability, controlled delivery, and consistent performance are critical.

3.1.2. Effect of Surfactant-to-Cholesterol Ratio

Based on the previous findings, Brij 97 was selected as the surfactant for further formulation development due to its favorable vesicle size, uniformity, and stability profile. To optimize bilayer composition, different surfactant-to-cholesterol ratios (1:1, 2:1, 3:1, and 5:1) were systematically investigated. Vesicle size (nm), PDI, and zeta potential (mV) were determined for each ratio, and the results are summarized in Table 2.
The surfactant-to-cholesterol ratio had a pronounced influence on the physicochemical properties of the niosomes. When Brij 97 and cholesterol were combined at a 1:1 ratio, the resulting vesicles exhibited a mean vesicle size of 168.40 ± 3.12 nm. As the proportion of surfactant increased, vesicle size expanded progressively, reaching 552.17 ± 24.10 nm at a 5:1 ratio. This trend indicates that increasing the relative amount of surfactant promotes the formation of larger vesicular structures. This behavior can be explained by the intrinsic characteristics of Brij 97, which possesses a relatively high hydrophilic–lipophilic balance (HLB) value [31]. Surfactants with higher HLB values exhibit stronger affinity for the aqueous phase and enhance hydration during vesicle formation [32]. When present in excess while cholesterol content remains constant, Brij 97 molecules contribute to increased water incorporation into the bilayer system. This enhanced hydration can expand the vesicle membrane and promote the formation of larger vesicles. In addition, a higher surfactant proportion may reduce the packing density of the bilayer, further contributing to vesicle enlargement.
Changes in surfactant-to-cholesterol ratio also affected the PDI, which reflects the uniformity of vesicle size distribution. At a 1:1 ratio, the formulation displayed a low PDI value of 0.15 ± 0.05, indicating a narrow and homogeneous size distribution. However, as the surfactant proportion increased, PDI values rose to 0.42 ± 0.06 (3:1 ratio) and 0.39 ± 0.07 (5:1 ratio). The increase in PDI suggests greater variability in vesicle size and reduced homogeneity within the dispersion. The observed reduction in uniformity can be linked to the role of cholesterol in stabilizing the bilayer membrane. Cholesterol intercalates between surfactant molecules, enhancing membrane rigidity and reducing permeability. When the surfactant level increases without a corresponding increase in cholesterol, the relative stabilizing effect of cholesterol diminishes. This imbalance may produce a more fluid and less organized bilayer structure, resulting in vesicles of varying sizes [33]. Consequently, vesicle size distribution becomes broader, and PDI values increase.
Zeta potential measurements further highlight the impact of formulation composition on colloidal stability. The 1:1 and 2:1 surfactant-to-cholesterol ratios exhibited zeta potential values of −45.37 ± 1.16 mV and −46.05 ± 3.24 mV, respectively. In contrast, the 3:1 and 5:1 ratios showed less negative values of −39.73 ± 0.38 mV and −41.60 ± 0.52 mV. Although all formulations demonstrated negative surface charge, the higher absolute values observed at lower surfactant ratios suggest stronger electrostatic repulsion between vesicles and, therefore, improved dispersion stability.
The relationship between PDI and zeta potential is also noteworthy. A lower PDI reflects greater size uniformity, which supports more consistent surface charge distribution across vesicles. Uniform vesicles are less prone to aggregation and exhibit more predictable electrostatic interactions in suspension [34]. As surfactant levels increased and PDI rose, the accompanying reduction in absolute zeta potential values may indicate a slight decrease in colloidal stability. This combination of larger vesicle size, broader size distribution, and reduced electrostatic repulsion suggests that excessive surfactant can compromise system stability. Taken together, these findings demonstrate that the 1:1 surfactant-to-cholesterol ratio provides the most balanced profile, characterized by smaller vesicle size, narrow size distribution, and favorable zeta potential.

3.1.3. Effect of Ethanol Concentration

Based on the optimization results obtained from previous experiments, a 1:1 ratio of nonionic surfactant (Brij 97) to cholesterol was chosen for the development of the ethanol-based niosomal nanocarrier system. To further optimize bilayer formation, the effect of aqueous ethanol concentration was investigated. Ethanol levels ranging from 10% to 50% (v/v) were evaluated while maintaining a constant surfactant-to-cholesterol ratio. Ethanol plays an important role in enhancing membrane flexibility and influencing vesicle assembly, therefore, selecting an appropriate concentration is essential for producing stable niosomal formulations. The impact of ethanol concentration on vesicle size (nm), PDI, and zeta potential (mV) was evaluated, and the corresponding results are presented in Table 3.
The impact of ethanol concentration on vesicle size (nm), PDI, and zeta potential (mV) was evaluated. Table 3 demonstrates that appropriate ethanol concentrations can effectively modulate vesicle characteristics. Formulations containing 10% and 20% aqueous ethanol produced relatively small and stable vesicles, with vesicle sizes of 181.63 ± 3.58 nm and 181.17 ± 8.70 nm, respectively. These formulations also exhibited favorable zeta potential values of −47.87 ± 1.12 mV and −43.37 ± 2.74 mV compared with formulations without ethanol. In contrast, formulations containing higher ethanol concentrations (30–50%) showed agglomeration during storage, making accurate vesicle size measurement difficult due to aggregation and phase instability.
Ethanol influences vesicle formation by interacting with lipid molecules and altering membrane structure. At moderate concentrations, ethanol penetrates the lipid bilayer, increasing membrane fluidity and reducing lipid packing density. This promotes the formation of smaller, more flexible vesicles [35]. However, excessive ethanol can destabilize the bilayer structure, leading to vesicle enlargement, structural collapse, or flocculation during storage. Based on previous studies, ethanol concentrations of 20–40% are generally considered optimal for stable vesicle formation; therefore, 10–50% aqueous ethanol was selected for this study [13].
Regarding surface charge, ethanol influences the electrostatic properties of vesicles. Moderate ethanol concentrations tend to increase the magnitude of negative zeta potential, enhancing colloidal stability by strengthening electrostatic repulsion between vesicles and reducing aggregation [36]. In contrast, excessive ethanol levels may disrupt bilayer integrity, reduce absolute zeta potential values, and increase aggregation risk [10]. Overall, these findings highlight the importance of optimizing ethanol concentration to achieve stable, uniform, and efficient ethanol-based niosomal delivery systems.

3.1.4. Effect of Glycolic Acid Concentration and Maximum Glycolic Acid Loading Determination

Glycolic acid was encapsulated to improve the delivery efficiency of active compounds within the niosomal nanocarrier system. To optimize formulation performance, glycolic acid was incorporated at different concentrations ranging from 0.5% to 90% (w/v) (Table 4).
The vesicle size of ethanol-based niosomes was clearly influenced by the concentration of glycolic acid incorporated into the formulation. The largest vesicles, measuring 260.57 ± 3.67 nm, were observed at a low glycolic acid concentration of 1%, whereas the smallest vesicles, at 168.80 ± 1.66 nm, were achieved with a 9% glycolic acid concentration. These observations suggest that glycolic acid plays a dual role in the formulation process, acting both as a surfactant and as a stabilizing agent during the self-assembly of nanosized vesicles [37]. By reducing interfacial tension between the organic and aqueous phases, glycolic acid facilitates more uniform vesicle formation and prevents aggregation [38]. At lower concentrations, insufficient stabilization may result in larger vesicles, while moderate concentrations optimize packing and reduce vesicle size. This effect highlights the importance of carefully balancing glycolic acid content to achieve desired vesicle dimensions.
PDI values, which reflect the homogeneity of vesicle size distribution, were observed to remain below 0.5 across all formulations, indicating good dispersion and uniformity [27]. Minor variations in PDI were noted with increasing glycolic acid concentration, but all values remained within the acceptable range, confirming that the formulations maintain a consistent vesicle size distribution and are suitable for stable cosmetic applications. A lower PDI is particularly critical for ensuring reproducibility, predictable performance, and enhanced penetration in topical formulations.
Zeta potential analysis further revealed significant changes in surface charge with varying glycolic acid concentrations. At a low glycolic acid concentration of 1%, the zeta potential measured 24.53 ± 3.45 mV, whereas at higher concentrations, such as 90%, it decreased sharply to 4.43 ± 3.76 mV. Similarly, a very low concentration of 0.5% exhibited a zeta potential of 4.57 ± 0.31 mV. This reduction in zeta potential indicates diminished electrostatic repulsion among vesicles, which could compromise colloidal stability [39]. The underlying mechanism is linked to the chemical nature of glycolic acid, a hydrophilic molecule containing hydroxyl groups. In an acidic or aqueous environment, these hydroxyl groups can accept protons (H+), forming positively charged species (H3O+), which alters the overall surface charge distribution of the niosomes [40,41]. This protonation process can partially neutralize the negative charges contributed by other vesicular components, resulting in a lower absolute zeta potential.
The interplay between vesicle size, PDI, and zeta potential demonstrates how glycolic acid concentration not only impacts vesicle dimensions but also influences their electrostatic stability. Low to moderate concentrations appear to optimize vesicle packing and maintain sufficient surface charge to prevent aggregation, whereas very high concentrations may induce charge screening or overhydration, leading to potential instability. These findings underscore the critical role of glycolic acid in fine-tuning the physicochemical properties of ethanol-based niosomes for cosmetic and topical applications, particularly when controlled delivery, uniform dispersion, and long-term stability are desired outcomes.

3.2. Heating and Cooling Cycles

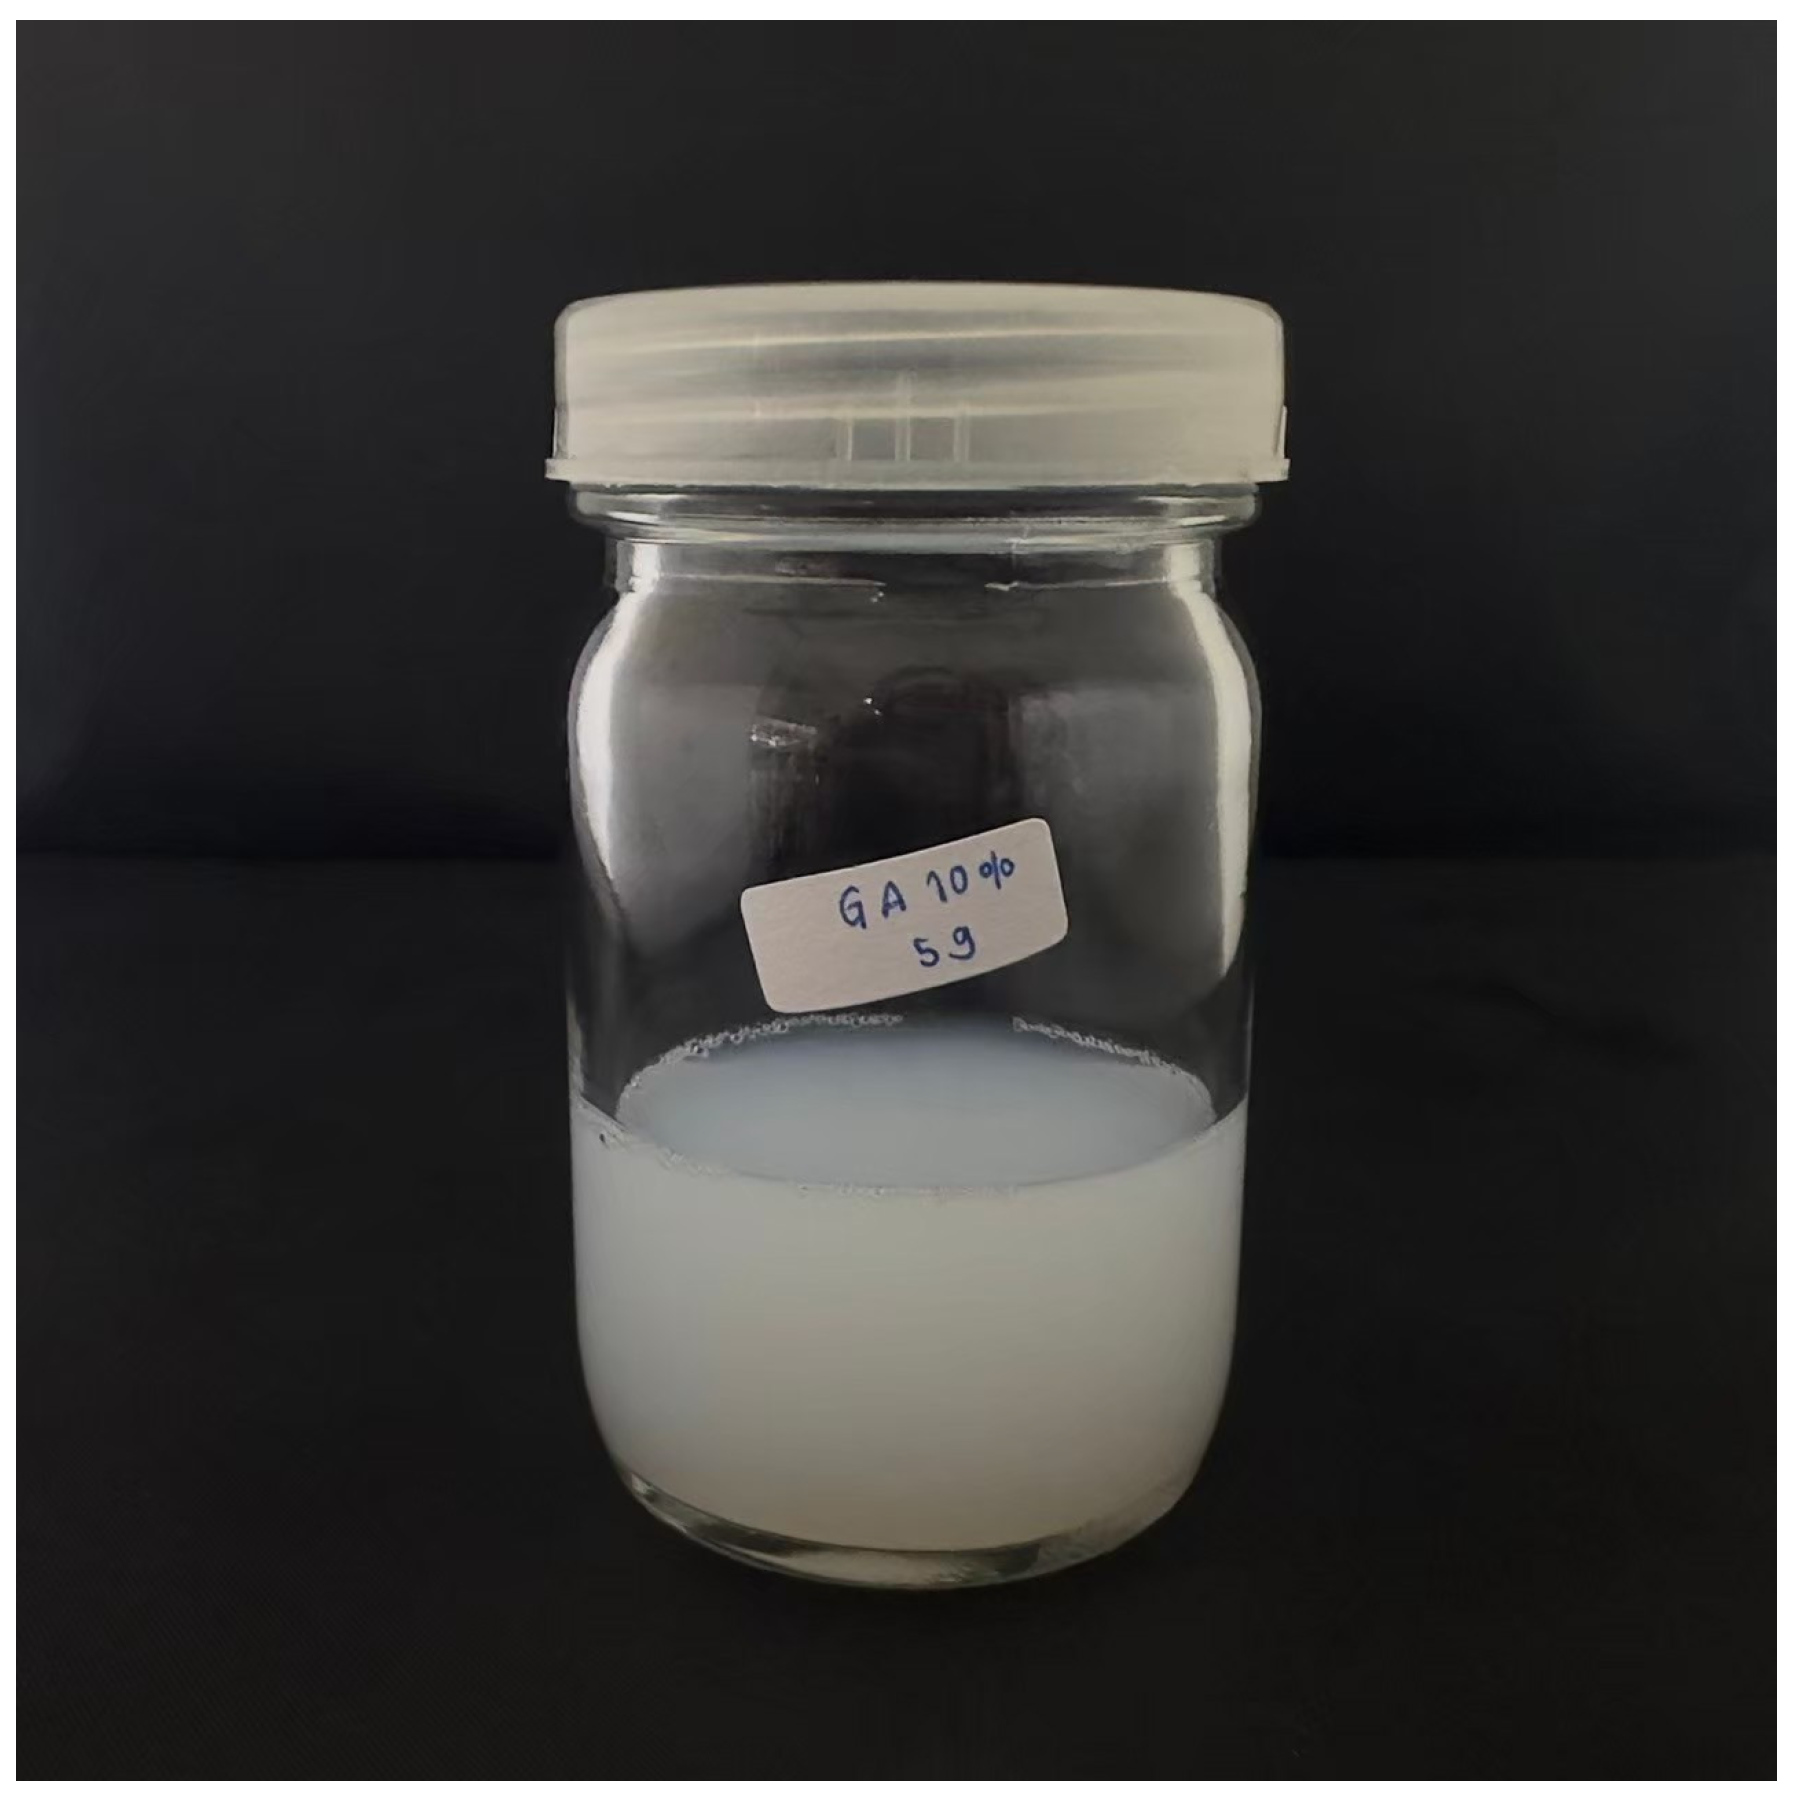
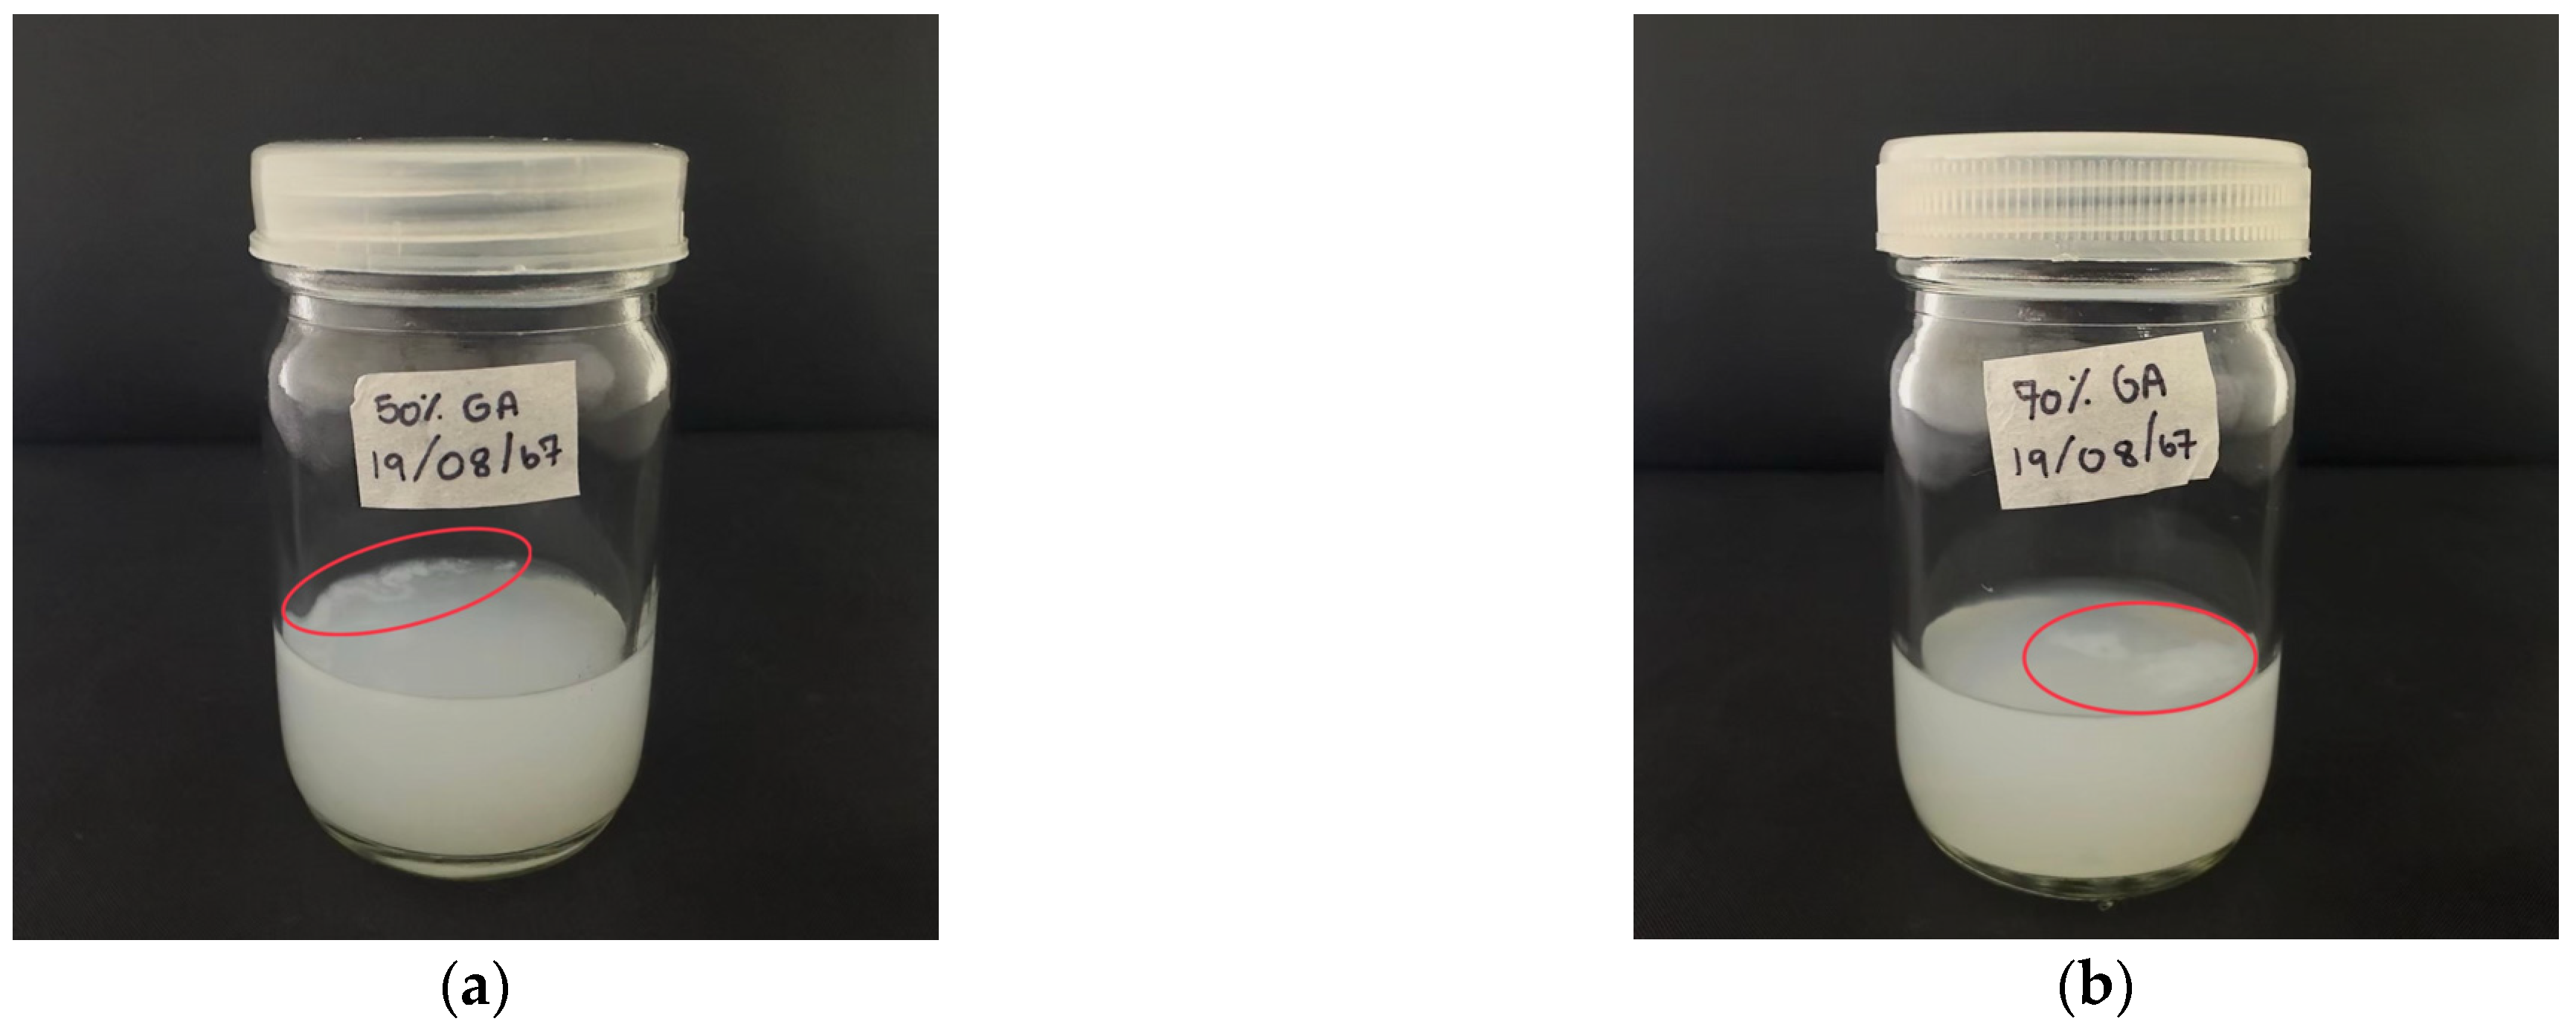
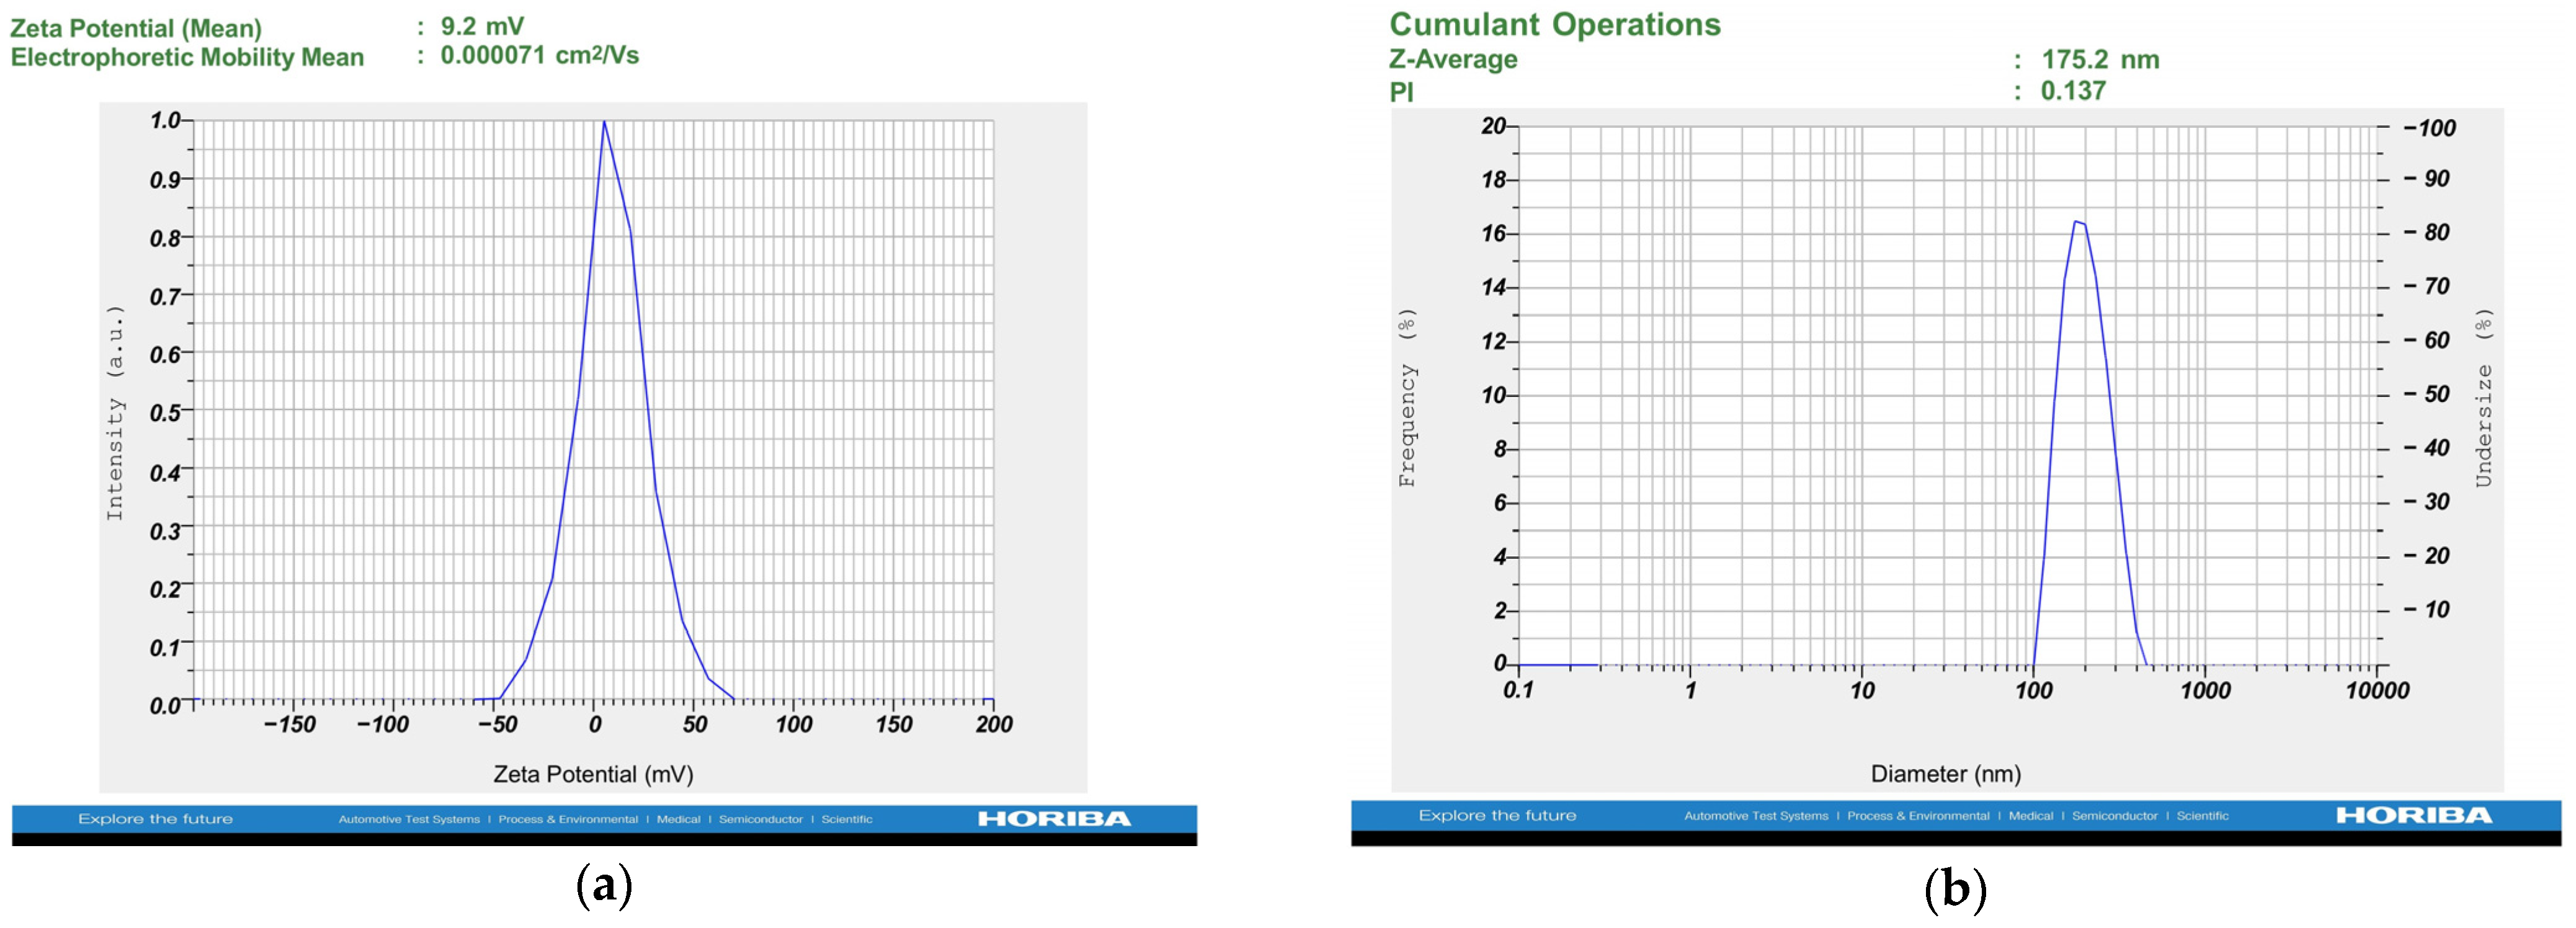
Stability testing is a crucial step in evaluating the shelf life of cosmetic formulations and ensuring that environmental conditions do not compromise product quality or performance on the skin. the stability of ethanol-based niosomes, including blank formulations and glycolic acid-loaded niosomes (0.5–90%), was assessed using six heating–cooling cycles. Each cycle consisted of storage at 4 °C followed by 45 °C, with each temperature maintained for 24 h. The stability of the vesicular system was evaluated by monitoring changes in vesicle size, PDI, and zeta potential (Table 5). The results showed that formulations containing up to 10% glycolic acid maintained good short-term stability, with only minimal vesicle growth observed. In contrast, higher glycolic acid concentrations (20–90%) resulted in vesicle agglomeration and reduced stability (Figure 1), likely because glycolic acid approached its solubility limit within the ethanol-based niosomal matrix [42]. Based on these findings, the maximum stable loading concentration of glycolic acid was determined to be 10% (Figure 2 and Figure 3). Vesicle sizes of glycolic acid-loaded ethanol-based niosomes after heating-cooling cycle ranged from 182.87 ± 2.35 nm to 240.33 ± 2.81 nm. PDI values provide insight into vesicle size uniformity. Formulations with PDI values below 0.8 are considered well dispersed, while values closer to 0.3 indicate highly uniform and stable systems [16]. In this study, most formulations showed reduced PDI values and maintained acceptable homogeneity. However, formulations containing 20–90% glycolic acid showed signs of aggregation, consistent with reduced colloidal stability. Zeta potential is another key indicator of colloidal stability, with values greater than ±30 mV generally indicating sufficient electrostatic repulsion to prevent vesicle aggregation [43]. Blank ethanol-based niosomes exhibited a zeta potential of −38.47 ± 2.21 mV, indicating good inherent stability. After glycolic acid loading, zeta potential values decreased over time, ranging from −9.53 ± 1.69 mV to 1.27 ± 1.45 mV. This reduction suggests weakened electrostatic repulsion, promoting vesicle aggregation. Glycolic acid, a weak organic acid, may donate protons (H+) to nanovesicle surfaces, neutralizing surface charges and reducing dispersion stability [44,45]. Based on these results, 10% glycolic acid was selected as the optimal loading concentration for further studies.

3.3. Morphological Analysis of Glycolic Acid-Loaded Ethanol-Based Niosomes Using Scanning Electron Microscopy (SEM)

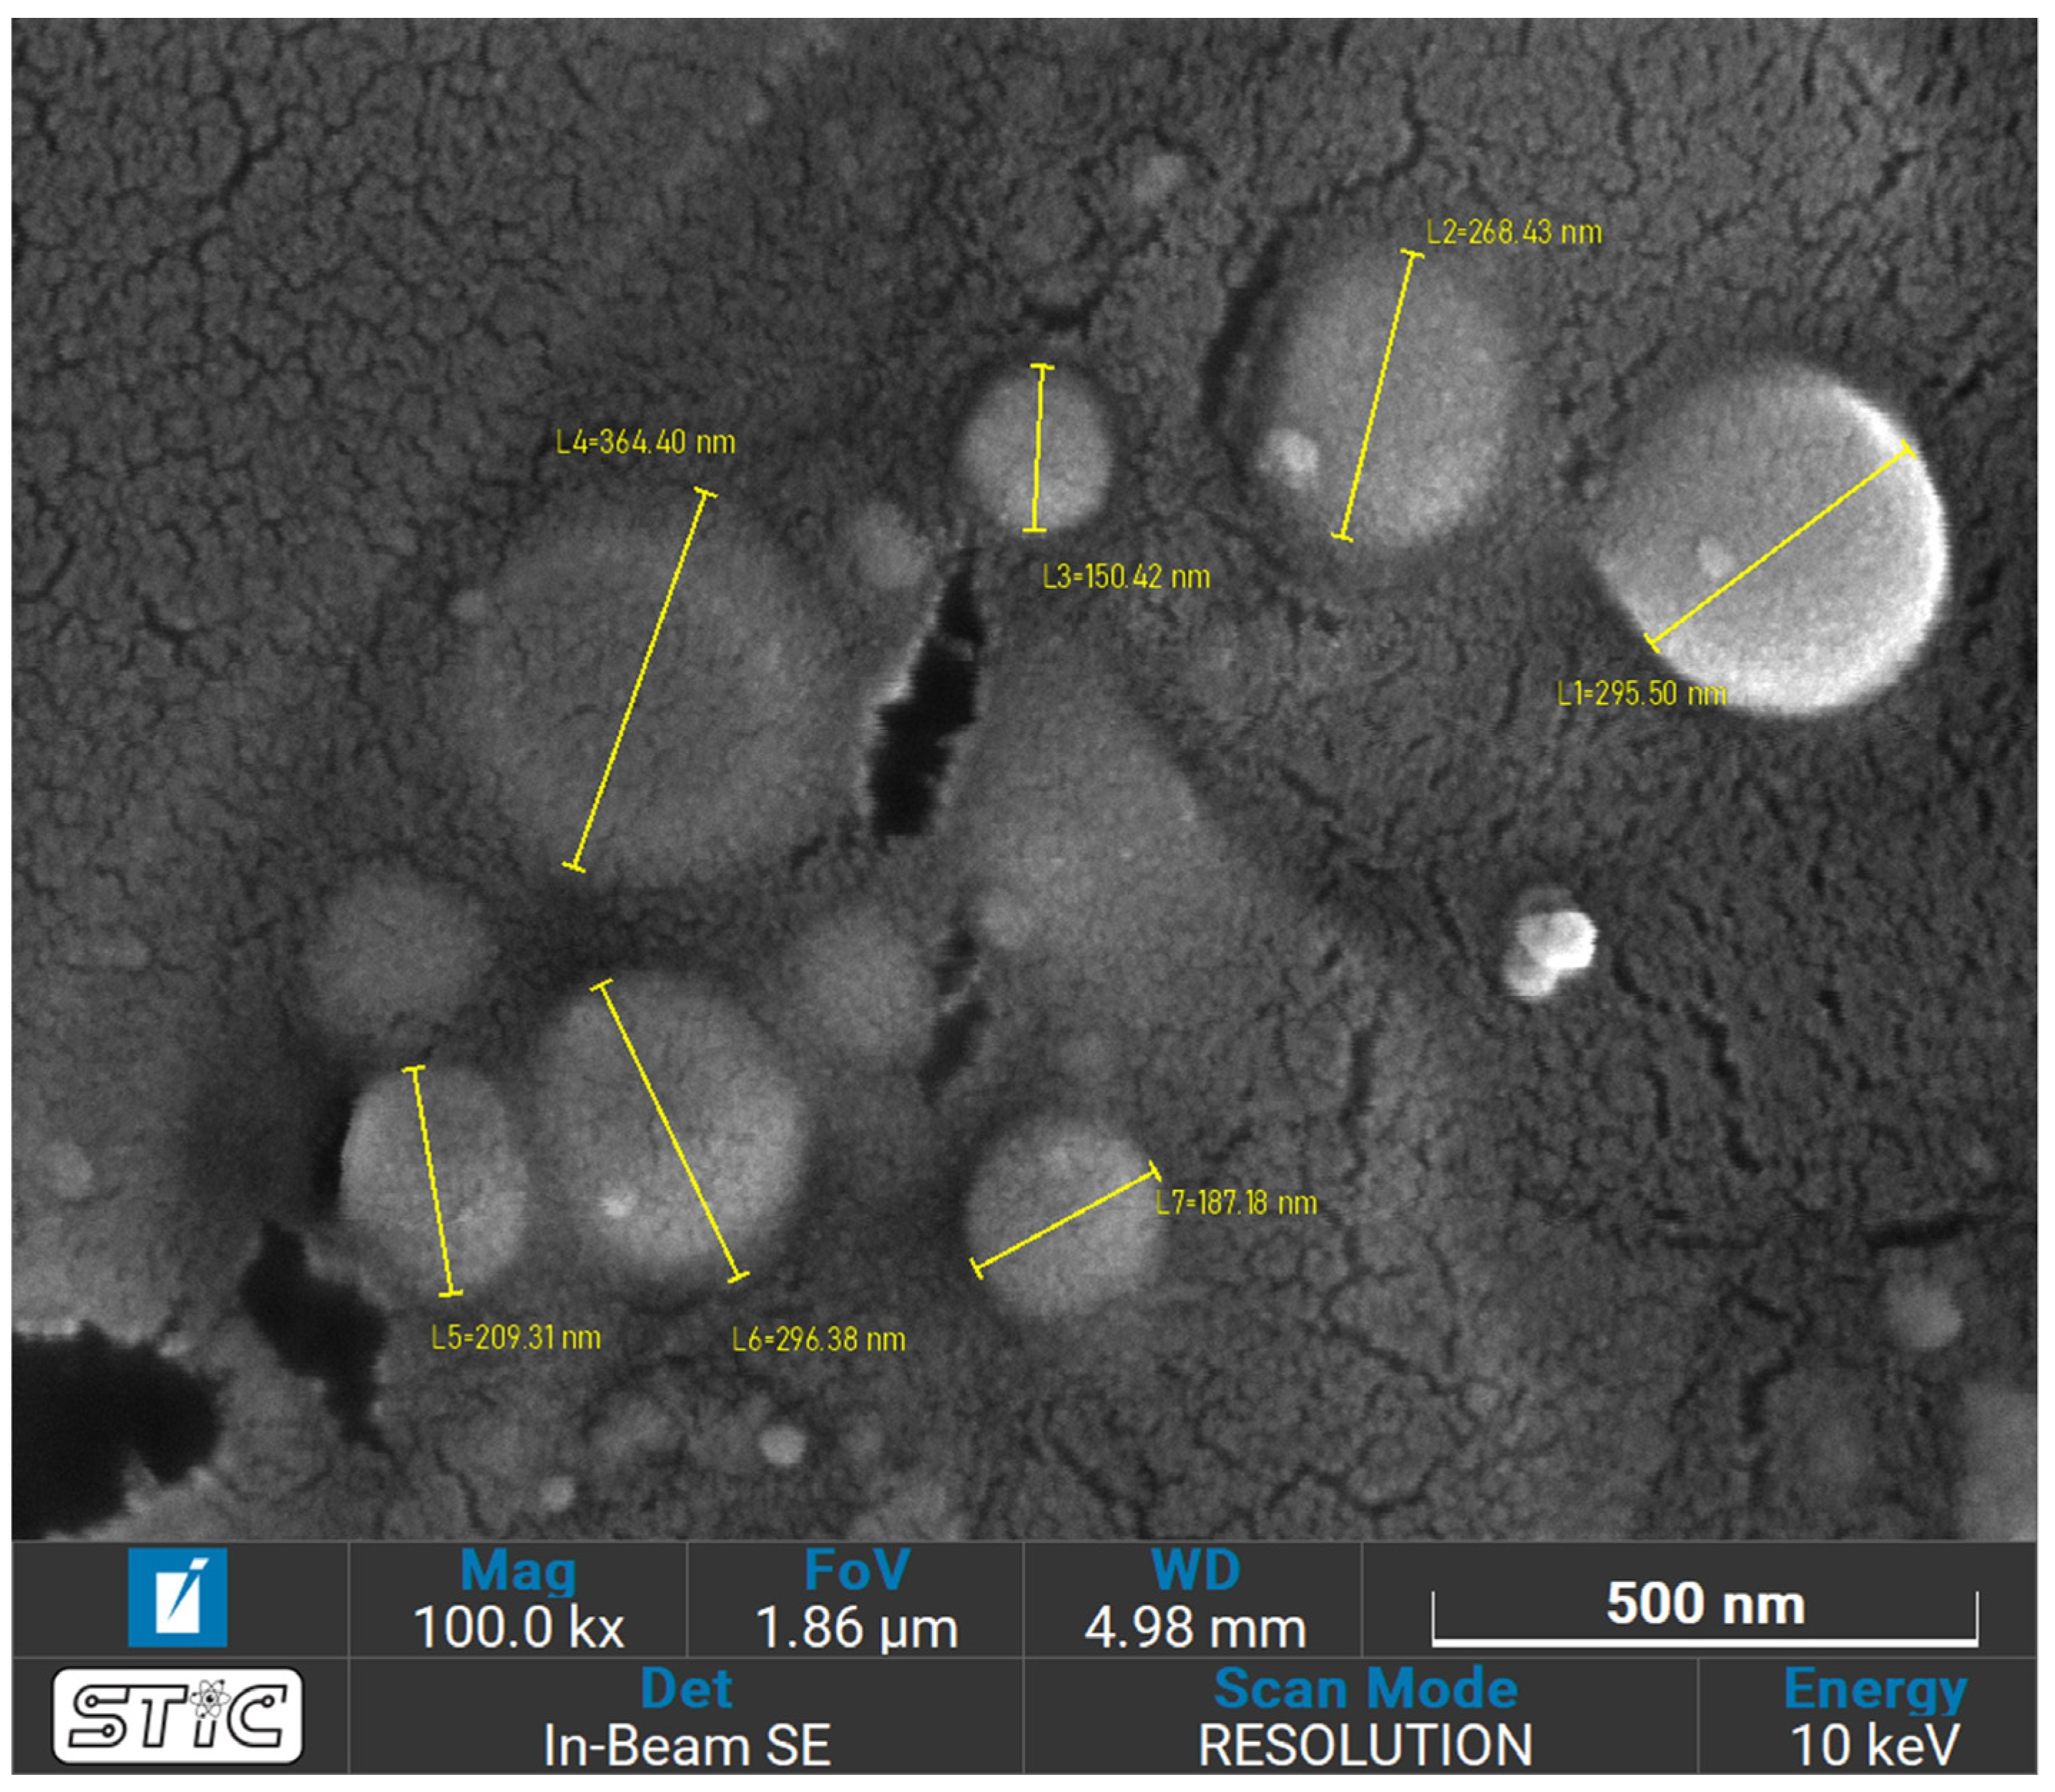
The morphological characteristics of glycolic acid-loaded ethanol-based niosomes were examined using scanning electron microscopy (SEM). The images revealed that the vesicles exhibited a generally spherical shape with smooth, well-defined surfaces. As shown in Figure 4, the vesicle diameters ranged from approximately 150 nm to 356 nm, indicating the presence of nanoscale vesicles with slight size variation across the sample population. These visual observations support the quantitative measurements obtained from dynamic light scattering (DLS) analysis using a nanovesicle analyzer, which showed an average vesicle size of 176.96 ± 1.51 nm. Since DLS measurements are based on assumptions of spherical vesicle geometry and report the hydrodynamic radius (Rh), SEM imaging provides complementary confirmation of vesicle morphology [46]. In addition, the relatively low PDI value of 0.12 ± 0.02 indicates a narrow vesicle size distribution and good formulation uniformity. This finding is consistent with the homogeneous vesicle appearance observed in the SEM micrographs. Overall, the combined SEM and DLS results confirm that the developed ethanol-based niosomal system possesses stable structural characteristics suitable for cosmetic delivery applications.

3.4. Entrapment Efficiency

The glycolic acid-loaded ethanol-based niosomes demonstrated a high entrapment efficiency (EE) of 75.48% ± 0.21, indicating strong drug-loading capability. This performance is superior to many conventional vesicular systems, such as traditional liposomes, which typically show lower encapsulation efficiency due to their relatively rigid membrane structure [47]. When compared with previous reports on liposomal gel formulations containing glycolic acid, which showed an EE of approximately 64.0 ± 2.1% [48], the present formulation exhibits improved drug retention. These findings align with earlier studies reporting that the inclusion of ethanol in vesicular systems enhances encapsulation efficiency [49]. The high encapsulation efficiency observed in this study can be attributed to the role of ethanol in modifying vesicle structure. Ethanol acts as a co-solvent, improving the solubility of glycolic acid within the vesicular matrix while interacting with the polar head groups of surfactant molecules. This interaction increases membrane flexibility, allowing the bilayer to accommodate a greater amount of active compounds compared with more rigid vesicular systems [18]. In addition, cholesterol contributes to bilayer stability by strengthening membrane structure and reducing drug leakage, thereby improving long-term drug retention within the vesicles [50]. Together, these components support the formation of a stable and efficient nanocarrier system for cosmetic delivery applications.

3.5. Differential Scanning Calorimetry (DSC)

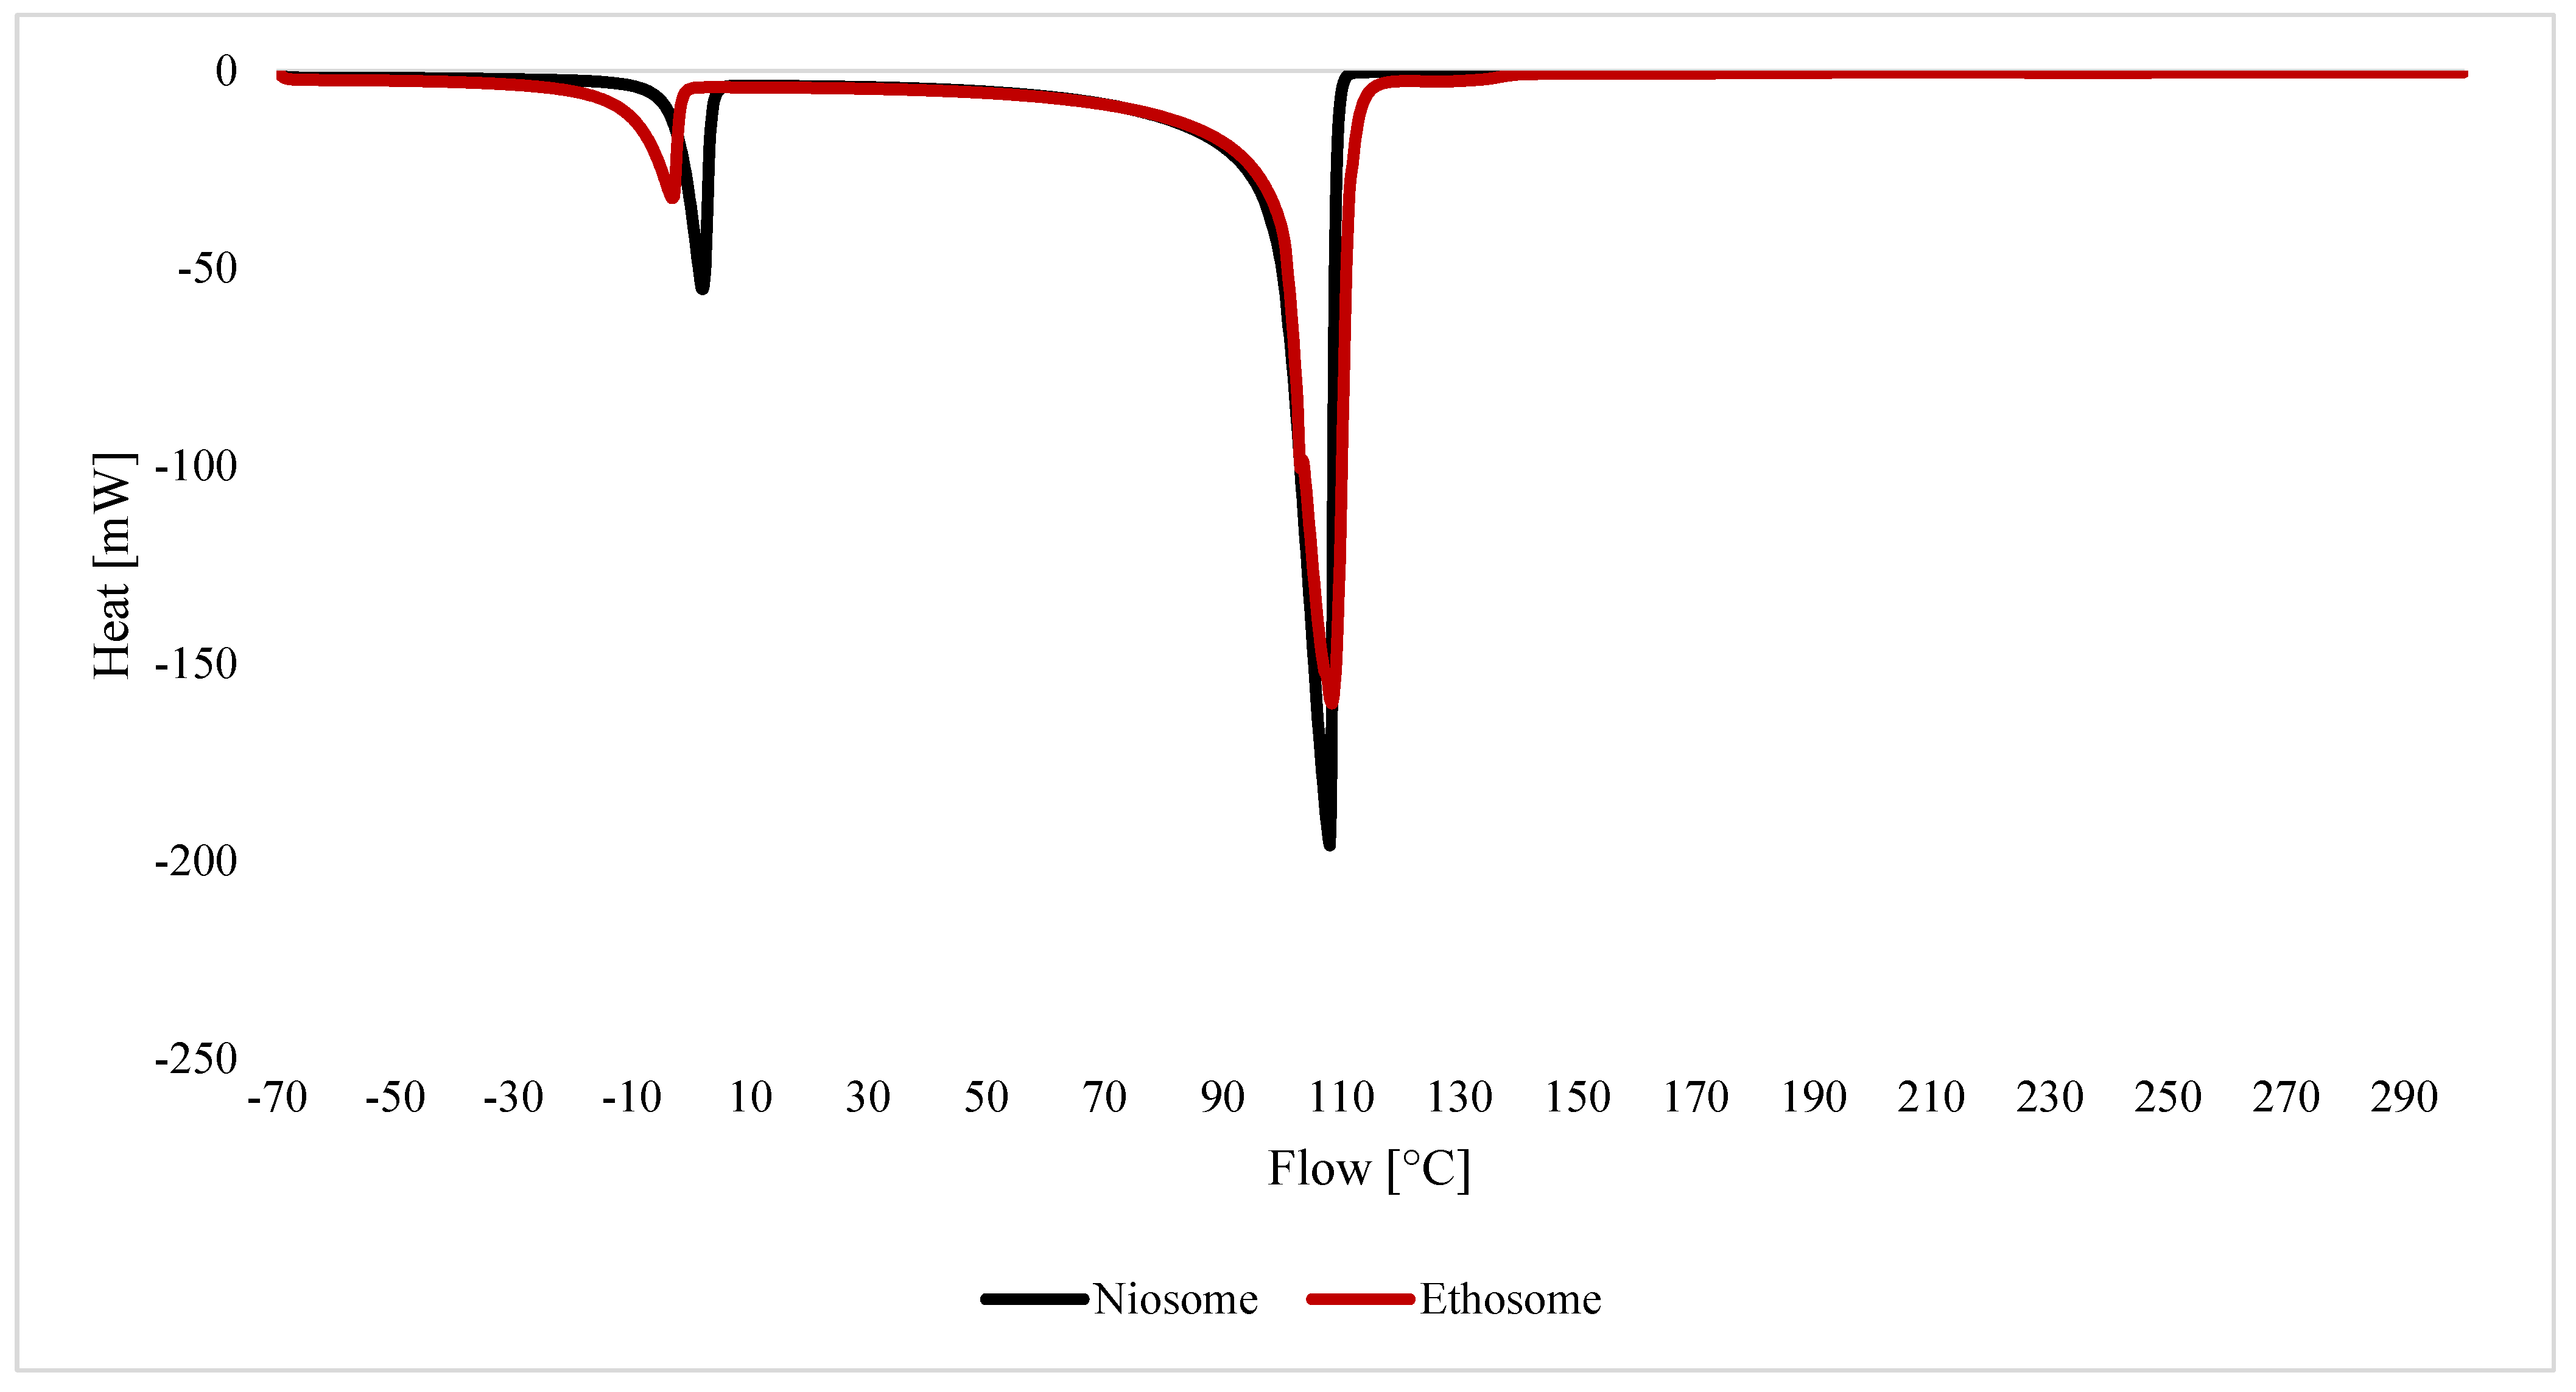
DSC was employed to assess the thermal transition behavior of ethanol-based niosomes and conventional niosomes loaded with 10% glycolic acid, as shown in Figure 5. In this study, heat flow is presented according to the instrument configuration, where endothermic events appear as downward peaks and exothermic events as upward peaks. The thermograms revealed two distinct endothermic transitions across all formulations, indicating characteristic phase changes associated with the vesicular bilayer structure. The first peak appeared between approximately −3.17 °C and 2 °C, representing the thermal transition associated with the vesicular bilayer structure. The ethanol-based niosomes (red line) exhibited a leftward shift toward lower temperatures compared with conventional niosomes (black line), indicating a reduction in transition temperature. In addition, the peak corresponding to ethanol-based niosomes was broader and showed a smaller thermal transition area, suggesting a lower enthalpy change during bilayer transition. These characteristics indicate that ethanol disrupts lipid packing within the bilayer, increasing membrane fluidity and flexibility [51]. The presence of ethanol also contributes to lowering the melting temperature of the vesicular system, promoting bilayer fluidization and enhancing vesicle deformability [47]. This increased membrane mobility enables ethanol-based niosomes to more easily deform and penetrate biological barriers such as the stratum corneum. Overall, the DSC results support the proposed mechanism that ethanol enhances bilayer flexibility and vesicle deformability. This structural modification is consistent with the broader thermal peak observed in ethanol-based niosomes and helps explain their improved transdermal delivery performance compared with conventional niosomes.

3.6. In Vitro Release and Permeation Studies

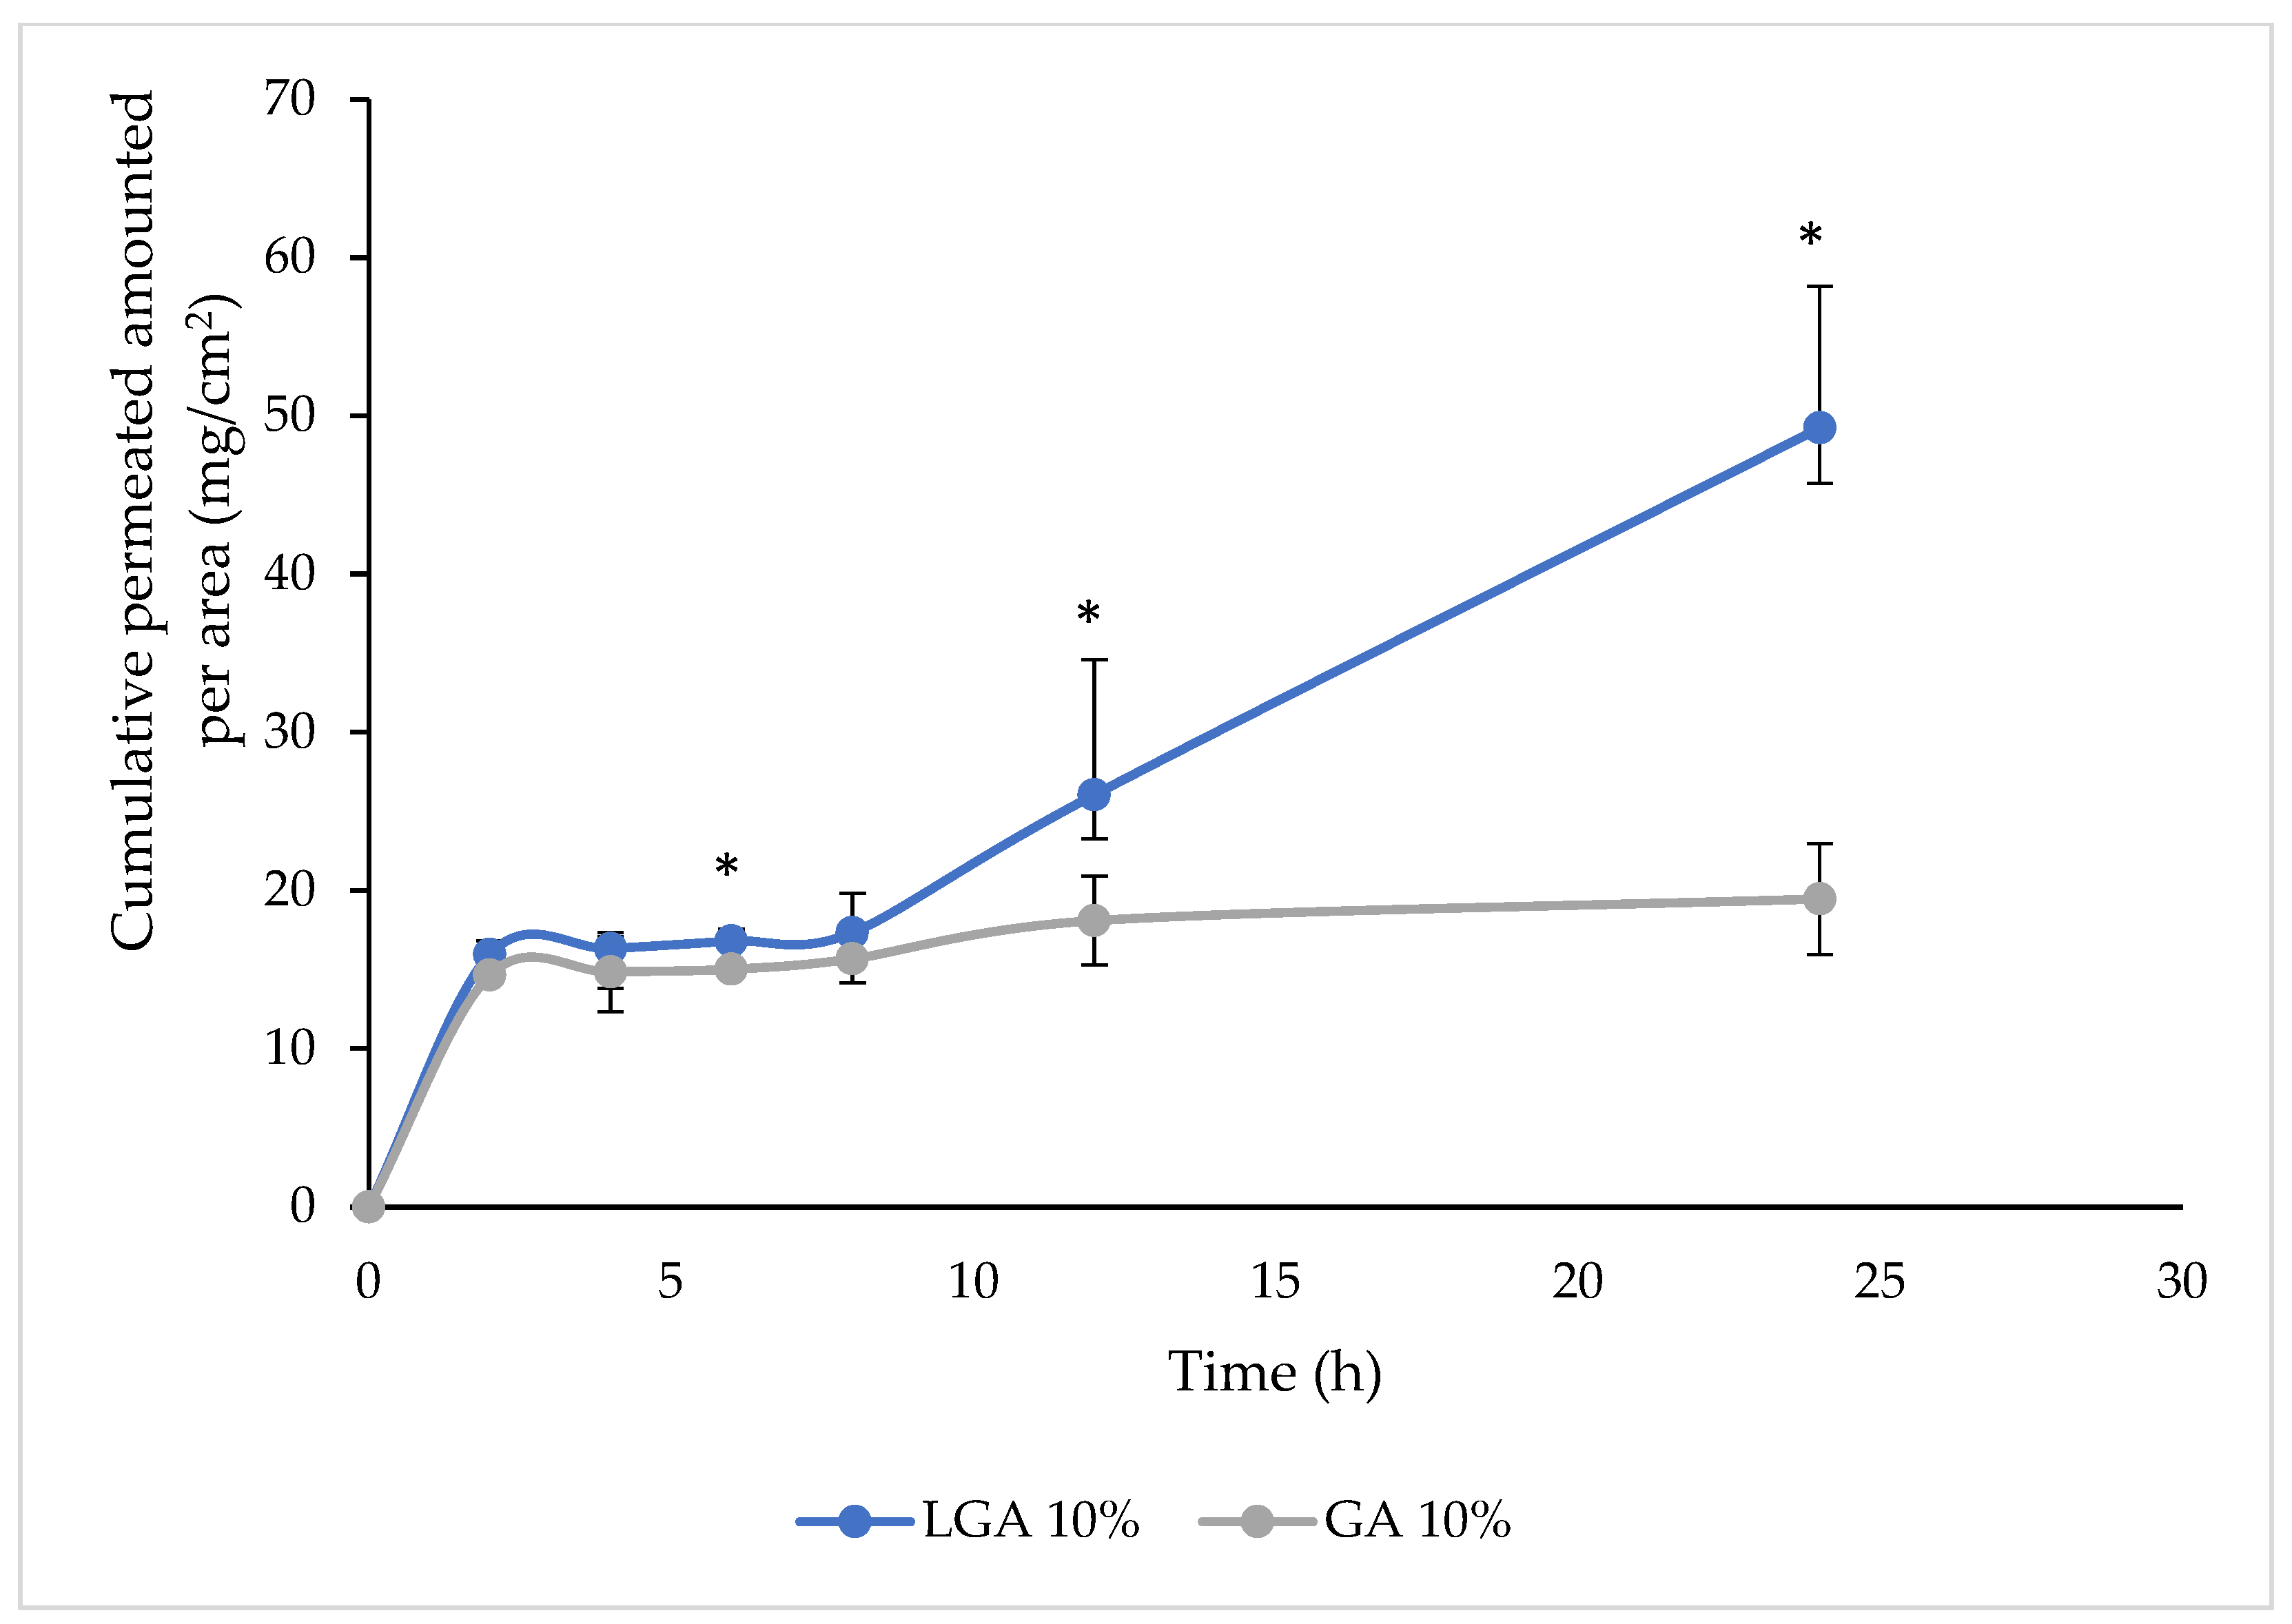
Although conventional niosomes were characterized using DSC to demonstrate differences in membrane fluidity, they were not included in the permeation study. Instead, this study focused on comparing the optimized ethanol-based niosomal system with a conventional glycolic acid solution to establish a baseline performance reference. The in vitro permeation behavior of LGA 10% and GA 10% was evaluated using a Franz diffusion cell fitted with a Strat-M® membrane. Although Strat-M® is widely used due to its reproducibility and structural similarity to human skin, it does not fully replicate the biological complexity of native tissue. Specifically, it lacks viable epidermal and dermal layers, metabolic activity, and appendageal pathways such as hair follicles and sweat glands, all of which can influence permeation in vivo. In addition, differences in lipid composition and organization may lead to variations in diffusion behavior compared with the human stratum corneum [52]. Therefore, the results obtained in this study should be interpreted as a comparative assessment of formulation performance rather than a direct prediction of in vivo dermal absorption. Despite these limitations, the Strat-M® membrane provides a consistent and controlled platform for evaluating permeation differences between formulations. The results showed that the cumulative amount of glycolic acid permeated per unit area was significantly higher for LGA 10% compared with GA 10% in both the receptor compartment and membrane deposition analysis. In both formulations, a burst release was observed during the first 2 h. However, the glycolic acid solution reached a plateau after 12 h, indicating limited further permeation. In contrast, the ethanol-based niosomal formulation showed a continuous increase in permeation up to 24 h, demonstrating sustained release behavior and improved membrane penetration (Figure 6). Furthermore, the cumulative amount of glycolic acid retained within the membrane for the niosomal system was approximately 1.7 times higher than that of the solution system, indicating greater skin deposition potential (Table 6). The lower permeation and deposition of GA 10% can be attributed to its ionic and highly water-soluble nature, which limits its ability to penetrate the lipid-rich stratum corneum [53]. Conversely, ethanol-based niosomes exhibit enhanced vesicle flexibility due to the presence of ethanol, which increases bilayer deformability and enables vesicles to pass more efficiently through the stratum corneum barrier [54]. It is important to note that this study emphasizes dermal, rather than transdermal delivery. For cosmetic applications, localized action within the stratum corneum and epidermis is preferred. Accordingly, formulation parameters—such as vesicle size (~190–200 nm), controlled ethanol content, and cholesterol incorporation—were optimized to enhance skin penetration and retention while limiting systemic exposure. The Strat-M® membrane simulates skin barrier properties but does not fully reflect in vivo absorption. Overall, the findings demonstrate that ethanol-based niosomes improve glycolic acid delivery by enhancing penetration, sustaining release, and increasing skin deposition, supporting their potential use in topical cosmetic formulations.

3.7. Long-Term Stability Study

The stability of blank and glycolic acid-loaded ethanol-based niosomes was evaluated to assess their structural integrity and long-term performance. Stability was examined by monitoring key physicochemical parameters, including vesicle size, PDI, and zeta potential. The formulations were stored under three different environmental conditions: 4 °C, room temperature, and 45 °C, to simulate various storage and transportation environments commonly encountered in cosmetic product handling. The stability results are presented in Figure 7, Figure 8 and Figure 9.
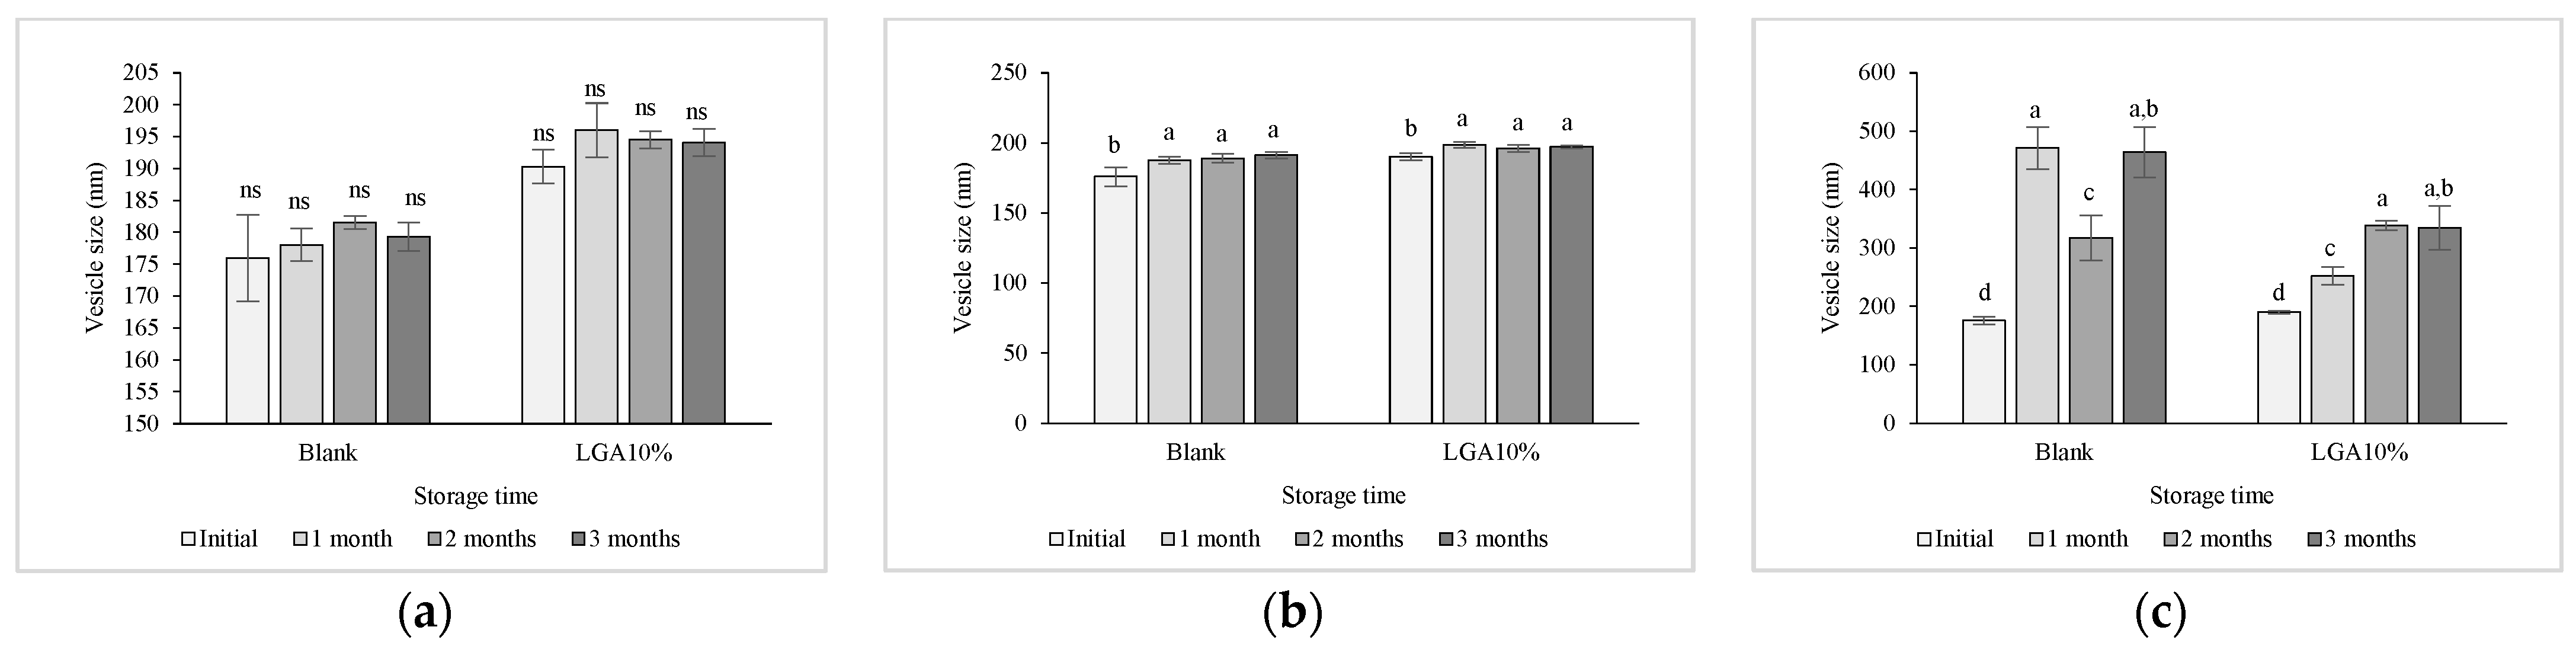
Vesicle size variation was strongly influenced by storage temperature for both blank ethanol-based niosomes and LGA 10% formulations. As shown in Figure 7, storage at 45 °C produced the greatest increase in vesicle diameter compared with storage at 4 °C and room temperature, where size changes were minimal. This size enlargement is likely caused by thermally induced vesicle fusion and aggregation. In the LGA 10% formulation, this effect was more pronounced at 45 °C, possibly due to interactions between glycolic acid and the surfactant bilayer. Specifically, glycolic acid may form hydrogen bonds with the polyoxyethylene (PEO) head groups of the surfactant, which can disrupt membrane packing and increase bilayer fluidity [55]. For transdermal delivery applications, an optimal vesicle size is generally considered to be within the range of 200–300 nm [56]. Under 4 °C and room temperature storage, vesicle sizes remained within a favorable range of approximately 175–200 nm. In contrast, samples stored at 45 °C showed marked vesicle growth, with sizes ranging from 250 to 480 nm, exceeding the optimal transdermal delivery range. These findings indicate that ethanol-based niosomes maintain good physical stability under moderate storage conditions but become unstable under prolonged thermal stress.
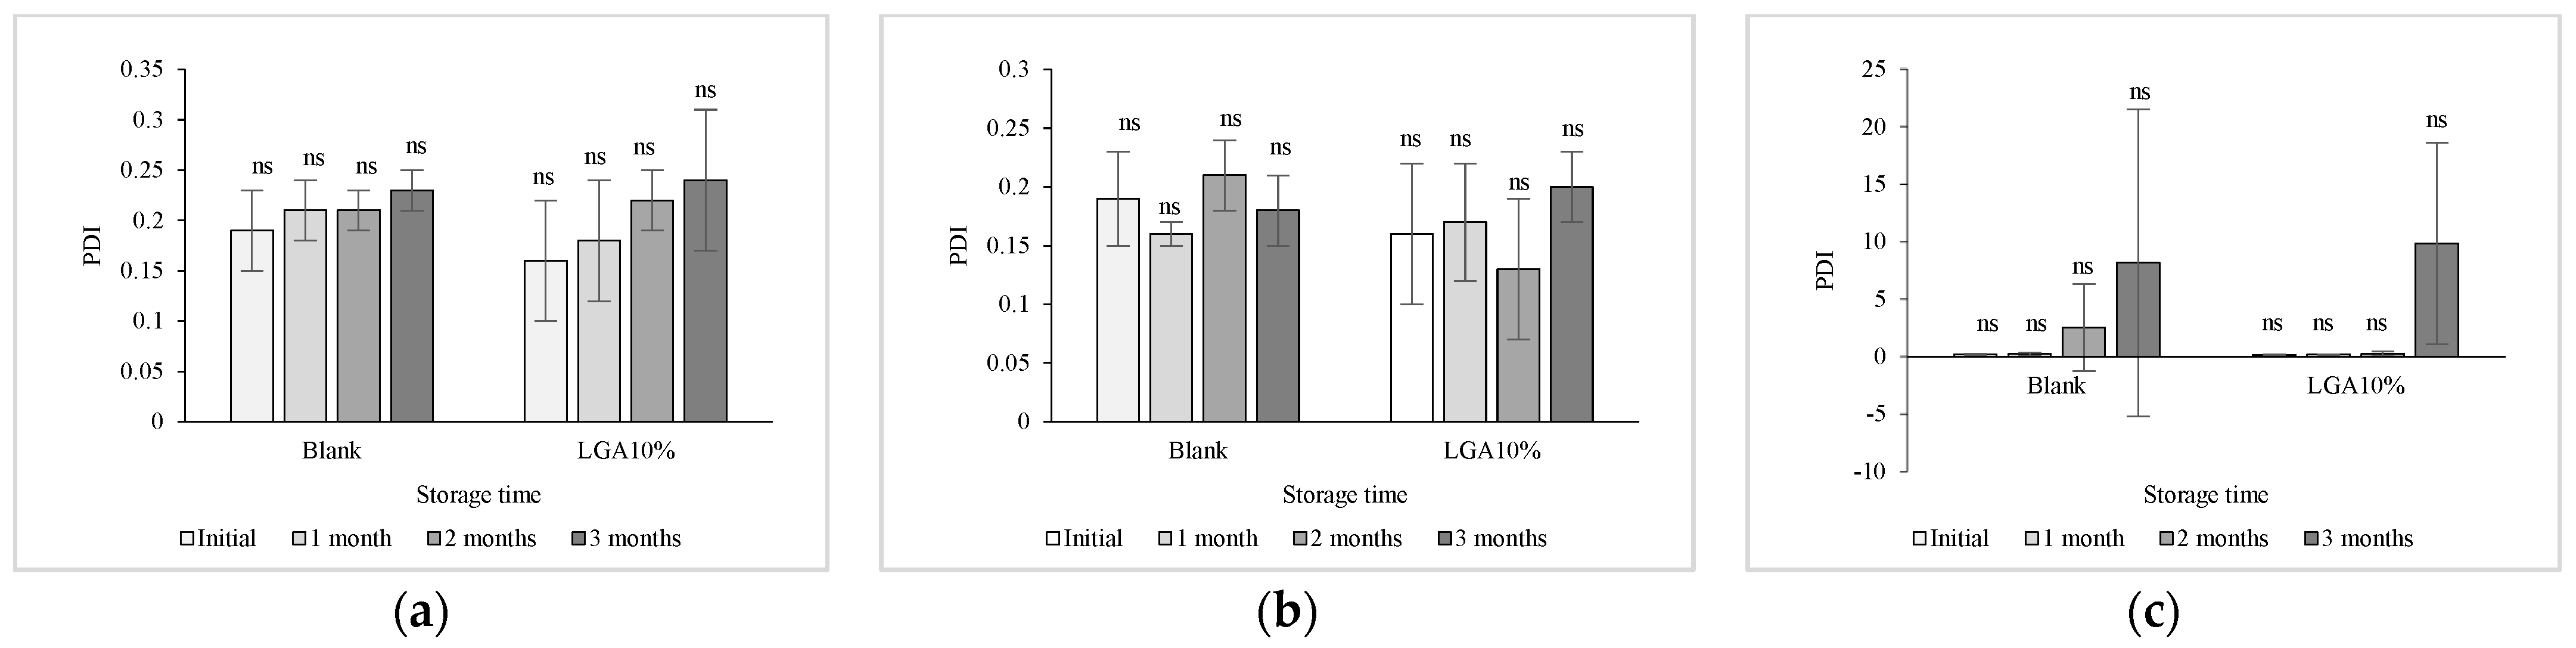
PDI values further supported these observations. PDI values below 0.3 generally indicate good vesicle size uniformity [56]. Throughout the study, PDI values for both blank and LGA 10% formulations remained below this threshold when stored at 4 °C and room temperature, with values ranging from 0.18 to 0.23 for blank niosomes and 0.16 to 0.24 for LGA 10% (Figure 8). These results suggest good dispersion stability. However, after 90 days of storage at 45 °C, PDI values increased significantly, reaching between 8.17 and 9.85, indicating severe loss of homogeneity. This increase is likely associated with heterogeneous vesicle distribution caused by thermal stress–induced fusion, deformation, and uneven vesicle swelling [57].
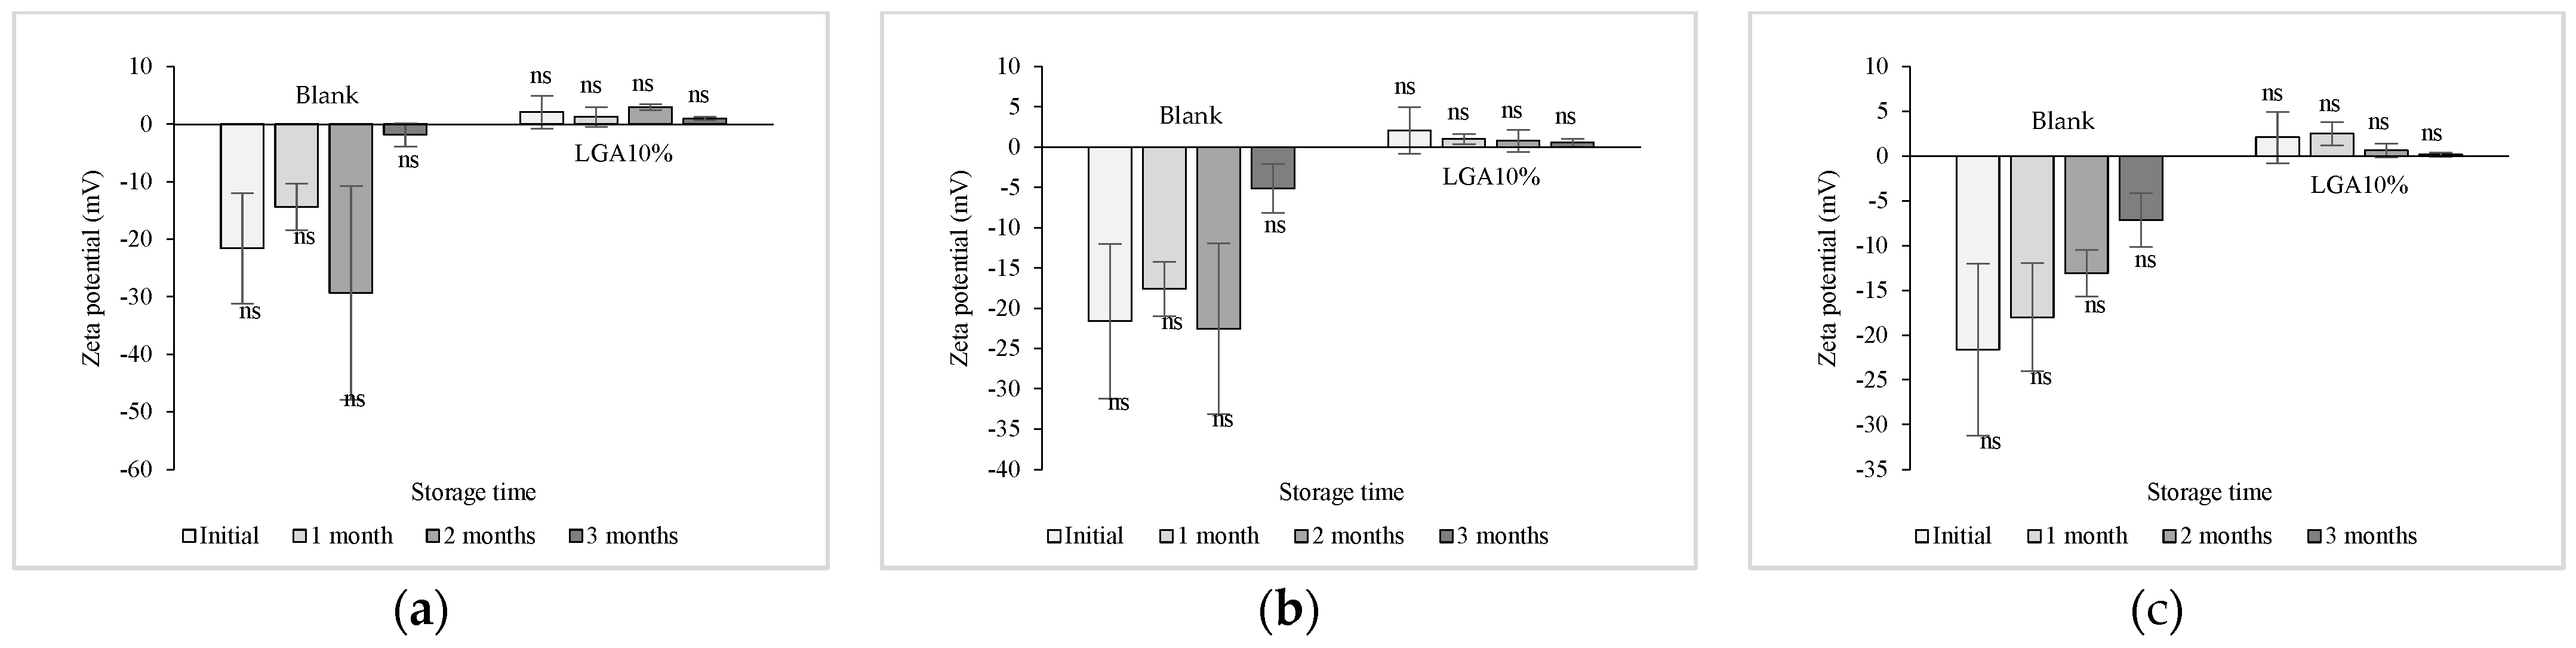
Zeta potential analysis showed that high-temperature storage reduced the magnitude of surface charge. Blank ethanol-based niosomes exhibited a shift toward less negative zeta potential values, possibly due to desorption of surface ions or ethanol loss from the vesicle membrane under heat stress. Similarly, LGA 10% formulations showed a progressive decrease in zeta potential magnitude over time, approaching near-neutral values (Figure 9). Zeta potentials close to zero indicate weak electrostatic repulsion between vesicles, which increases aggregation risk [43].
Overall, both formulations demonstrated good stability when stored at 4 °C and room temperature, as reflected by consistent vesicle size, PDI, and zeta potential values. In contrast, high-temperature storage at 45 °C caused significant instability. Elevated temperature likely promoted dehydration of surfactant head groups [55], leading to vesicle swelling, fusion, and structural disruption. These findings highlight the importance of appropriate storage conditions to maintain the physicochemical stability of ethanol-based niosomal formulations for cosmetic delivery applications.
After 3 months of storage, the entrapment efficiency (%EE) of glycolic acid-loaded ethanol-based niosomes decreased under all tested storage conditions compared with the initial values (Table 7). This reduction is primarily attributed to time-dependent drug leakage from the vesicular system. Similar findings have been reported in previous studies, which demonstrated that drug leakage from vesicular carriers can occur gradually during prolonged storage [58]. Over time, structural rearrangement of the bilayer membrane and increased membrane permeability may allow the hydrophilic glycolic acid molecules to slowly diffuse out of the vesicles [59]. These results are consistent with earlier reports showing that %EE can decrease over time even in vesicular systems stored at low temperatures [17]. Notably, when comparing storage at 4 °C, room temperature, and 45 °C over the 3-month period, no statistically significant differences in %EE were detected among the conditions. This suggests that the ethanol-based niosomal system retained a relatively stable encapsulation capacity despite observable changes in vesicle size and PDI at elevated temperatures. Overall, these findings suggest that storage duration plays a more dominant role than temperature in influencing entrapment efficiency loss in this formulation. While temperature affects vesicle stability, prolonged storage appears to promote gradual drug release from the nanocarrier matrix, reducing long-term encapsulation efficiency. These observations highlight the importance of optimizing both formulation design and storage conditions to maintain drug retention in cosmetic nanocarrier systems.

4. Conclusions

This study successfully developed and optimized glycolic acid-loaded ethanol-based niosomes using the thin-film hydration method, demonstrating their suitability for dermal delivery in cosmetic applications. The optimized formulation exhibited a uniform vesicular structure with a nanoscale size (~170–180 nm), low polydispersity, and high entrapment efficiency, indicating effective encapsulation and stability. Key formulation parameters—including surfactant type, surfactant-to-cholesterol ratio, ethanol concentration, and active compound loading—were found to significantly influence vesicle characteristics and overall performance. The optimized system showed improved physicochemical properties, with ethanol contributing to bilayer fluidity and enhanced vesicle performance. These features translated into superior in vitro behavior, as the niosomal formulation provided enhanced skin permeation, sustained release, and greater membrane deposition compared with the glycolic acid solution. The formulation also maintained acceptable stability under standard storage conditions, although elevated temperatures led to vesicle enlargement and reduced entrapment efficiency. Overall, the findings highlight the potential of ethanol-based niosomes as an effective delivery platform for glycolic acid in topical cosmetic formulations. By improving skin penetration and retention while maintaining formulation stability, this system offers a promising approach for enhancing the efficacy of cosmetic actives. Further studies on safety, long-term stability, and in vivo performance are warranted to support its practical application.

Author Contributions

Conceptualization, N.K.-u.; methodology, N.K.-u.; formal analysis, W.A., O.P., N.N., P.T. and N.K.-u.; investigation, W.A., O.P., N.N., P.T. and N.K.-u.; writing—original draft preparation, W.A., O.P., N.N. and P.T.; writing—review and editing, N.K.-u.; visualization, W.A., O.P., N.N., P.T. and N.K.-u.; project administration, N.K.-u.; funding acquisition, N.K.-u. All authors have read and agreed to the published version of the manuscript.

Funding

This research was funded by National Science, Research, and Innovation Fund (NSRF), grant number 692A02022.

Institutional Review Board Statement

Not applicable.

Informed Consent Statement

Not applicable.

Data Availability Statement

The original contributions presented in this study are included in the article. Further inquiries can be directed to the corresponding author.

Acknowledgments

The authors gratefully acknowledge Croda (Thailand) Corporation, Limited for kindly providing Brij 97 samples used in this study. We also sincerely thank Mae Fah Luang University for providing laboratory facilities, equipment, and chemical reagents necessary to conduct this research. In addition, we appreciate the technical support from the Scientific and Technological Instruments Center (STIC), Mae Fah Luang University, for their assistance with Scanning Electron Microscopy (SEM) and Differential Scanning Calorimetry (DSC) analyses. In preparing this manuscript, the authors utilized ChatGPT version 5.2 and Quillbot Premium version to enhance readability. Following the use of these tools, the authors carefully reviewed and revised the content as necessary and take full responsibility for the final version.

Conflicts of Interest

The authors declare no conflicts of interest.

References

  1. Karwal, K.; Mukovozov, I. Topical AHA in dermatology: Formulations, mechanisms of action, efficacy, and future perspectives. Cosmetics 2023, 10, 131. [Google Scholar] [CrossRef]
  2. Yu, Y.-Q.; Yang, X.; Wu, X.-F.; Fan, Y.-B. Enhancing permeation of drug molecules across the skin via delivery in nanocarriers: Novel strategies for effective transdermal applications. Front. Bioeng. Biotechnol. 2021, 9, 646554. [Google Scholar] [CrossRef] [PubMed]
  3. Sumiyya, J.; Tayyaba, R.; Zainab, N.; Nayab, S. Exploring niosomes: A comprehensive review of their structure, formulation, and biomedical applications. Curr. Res. Pharm. Sci. 2024, 2, 1–34. [Google Scholar] [CrossRef]
  4. Bautista-Solano, A.A.; Dávila-Ortiz, G.; Perea-Flores, M.D.; Martínez-Ayala, A.L. A comprehensive review of niosomes: Composition, structure, formation, characterization, and applications in bioactive molecule delivery systems. Molecules 2025, 30, 3467. [Google Scholar] [CrossRef]
  5. Rezaeiroshan, A.; Saeedi, M.; Morteza-Semnani, K.; Akbari, J.; Gahsemi, M.; Nokhodchi, A. Development of trans-Ferulic acid niosome: An optimization and an in-vivo study. J. Drug Deliv. Sci. Technol. 2020, 59, 101854. [Google Scholar] [CrossRef]
  6. Klinhom, S. Development of Glycolic Acid Niosome for Skin Delivery. Master’s Thesis, Chulalongkorn University, Bangkok, Thailand, 2008. [Google Scholar] [CrossRef]
  7. Lens, M. Niosomes as vesicular nanocarriers in cosmetics: Characterisation, development and efficacy. Pharmaceutics 2025, 17, 287. [Google Scholar] [CrossRef]
  8. Sudhakar, K.; Fuloria, S.; Subramaniyan, V.; Sathasivam, K.V.; Azad, A.K.; Swain, S.S.; Sekar, M.; Karupiah, S.; Porwal, O.; Sahoo, A.; et al. Ultraflexible liposome nanocargo as a dermal and transdermal drug delivery system. Nanomaterials 2021, 11, 2557. [Google Scholar] [CrossRef]
  9. Chauhan, N.; Vasava, P.; Khan, S.L.; Siddiqui, F.A.; Islam, F.; Chopra, H.; Emran, T.B. Ethosomes: A novel drug carrier. Ann. Med. Surg. 2022, 82, 104595. [Google Scholar] [CrossRef]
  10. Shitole, M.; Nangare, S.; Patil, U.; Jadhav, N.R. Review on drug delivery applications of ethosomes: Current developments and prospects. Thai J. Pharm. Sci. 2022, 46, 251–265. [Google Scholar] [CrossRef]
  11. Patel, P.S.; Kumar, A.; Misra, S.K.; Devi, S.; Kapoor, A.; Tripathi, S.; Tiwari, R. Ethosomes: A novel approach to overcoming skin barriers for efficient drug delivery. Asian J. Pharm. 2025, 19, 921. [Google Scholar] [CrossRef]
  12. Sahore, R.; Dua, J.S.; Prasad, D.N.; Sharma, D.; Hans, M. Formulation and evalution of levamisole niosomes by using sonication method. J. Drug Deliv. Ther. 2019, 9, 553–559. [Google Scholar] [CrossRef]
  13. Devaki, J.; Pavuluri, S.; Suma, N. Ethosomes: A vesicular carrier as a novel tool for transdermal drug delivery system. J. Drug Deliv. Ther. 2023, 13, 159–164. [Google Scholar] [CrossRef]
  14. Chaikul, P.; Khat-udomkiri, N.; Iangthanarat, K.; Manosroi, J.; Manosroi, A. Characteristics and in vitro anti-skin aging activity of gallic acid loaded in cationic CTAB niosome. Eur. J. Pharm. Sci. 2019, 131, 39–49. [Google Scholar] [CrossRef]
  15. Ardeshiri, H.; Radfar, A.H.; Hatam, G.; Bahreini, M.S.; Azarpira, N.; Chelliapan, S.; Kamyab, H.; Kasaee, S.R.; Amani, A.M.; Mosleh-Shirazi, S. Evaluation the biological effect of niosomal hydrogel base amphotericin in combination with Artemisia sieberi essential oil for treatment of cutaneous leishmaniasis: In vitro and in vivo studies. Result Chem. 2025, 15, 102185. [Google Scholar] [CrossRef]
  16. Mehmood, Y.; Shahid, H.; Ahmed, S.; Khursheed, A.; Jamshaid, T.; Jamshaid, M.; Mengistie, A.A.; Dawoud, T.M.; Siddique, F. Synthesis of vitamin D3 loaded ethosomes gel to cure chronic immune-mediated inflammatory skin disease: Physical characterization, in vitro and ex vivo studies. Sci. Rep. 2024, 14, 23866. [Google Scholar] [CrossRef] [PubMed]
  17. Nasri, S.; Rahaie, M.; Ebrahimi-Hoseinzadeh, B.; Hatamian-Zarmi, A.; Sahraeian, R. A new ethosomal nanoparticle for controlled release of black cumin compounds against cancer cells. Nanomed. Res. J. 2021, 6, 158–169. [Google Scholar] [CrossRef]
  18. Shinde, P.; Page, A.; Bhattacharya, S. Ethosomes and their monotonous effects on Skin cancer disruption. Front. Nanotechnol. 2023, 5, 1087413. [Google Scholar] [CrossRef]
  19. Aljohani, A.A.; Alanazi, M.A.; Munahhi, L.A.; Hamroon, J.D.; Mortagi, Y.; Qushawy, M.; Soliman, G.M. Binary ethosomes for the enhanced topical delivery and antifungal efficacy of ketoconazole. OpenNano 2023, 11, 100145. [Google Scholar] [CrossRef]
  20. Kanpipit, N.; Thapphasaraphong, S.; Phupaboon, S.; Puthongking, P. The characteristics and biological activities of niosome-entrapped salicylic acid-contained oleoresin from Dipterocarpus alatus for skin product applications. Adv. Pharmacol. Pharm. Sci. 2024, 2024, 1642653. [Google Scholar] [CrossRef]
  21. Pulsoni, I.; Lubda, M.; Aiello, M.; Fedi, A.; Marzagalli, M.; von Hagen, J.; Scaglione, S. Comparison between Franz diffusion cell and a novel micro-physiological system for in vitro penetration assay using different skin models. SLAS Technol. 2022, 27, 161–171. [Google Scholar] [CrossRef]
  22. Kanpipit, N.; Mattariganont, S.; Temprom, L.; Thopan, P.; Lomthaisong, K.; Krongsuk, S.; Thapphasaraphong, S. Response surface methodology—Optimized niosomes encapsulating whole tomato extract: Release profile and mechanistic insights for UVB protection and anti-melanogenesis applications. OpenNano 2026, 27, 100267. [Google Scholar] [CrossRef]
  23. Zagorc, U.; Božič, D.; Arrigler, V.; Medoš, Ž.; Hočevar, M.; Romolo, A.; Kralj-Iglič, V.; Kogej, K. The Effect of different surfactants and polyelectrolytes on nano-vesiculation of artificial and cellular membranes. Molecules 2024, 29, 4590. [Google Scholar] [CrossRef]
  24. Ritthe, P.V.; Fugate, D.A.; Shafi, D.S.; Rudrurkar, M.N.; Kazi, A.J.; Patil, S.R.; Sante, R.U.; Shaikh, I. Unlocking the potential of niosomes: A comprehensive review. Asian J. Pharm. Res. Dev. 2024, 12, 239–246. [Google Scholar] [CrossRef]
  25. Gao, S.; Sui, Z.; Jiang, Q.; Jiang, Y. Functional evaluation of niosomes utilizing surfactants in nanomedicine applications. Int. J. Nanomed. 2024, 19, 10283–10305. [Google Scholar] [CrossRef]
  26. Fadaei, M.S.; Fadaei, M.R.; Kheirieh, A.E.; Rahmanian-Devin, P.; Dabbaghi, M.M.; Nazari Tavallaei, K.; Shafaghi, A.; Hatami, H.; Baradaran Rahimi, V.; Nokhodchi, A.; et al. Niosome as a promising tool for increasing the effectiveness of anti-inflammatory compounds. Excli J. 2024, 23, 212–263. [Google Scholar] [CrossRef]
  27. Liga, S.; Paul, C.; Moacă, E.-A.; Péter, F. Niosomes: Composition, formulation techniques, and recent progress as delivery systems in cancer therapy. Pharmaceutics 2024, 16, 223. [Google Scholar] [CrossRef]
  28. Yaghoobian, M.; Haeri, A.; Bolourchian, N.; Shahhosseni, S.; Dadashzadeh, S. The impact of surfactant composition and surface charge of niosomes on the oral absorption of repaglinide as a BCS II model drug. Int. J. Nanomed. 2020, 15, 8767–8781. [Google Scholar] [CrossRef] [PubMed]
  29. Pandey, P.; Pal, R.; Khadam, V.; Chawra, H.; Singh, R. Advancement and characteristics of non-ionic surfactant vesicles (niosome) and their application for analgesics. Int. J. Pharm. Investig. 2024, 14, 616–632. [Google Scholar] [CrossRef]
  30. Singpanna, K.; Charnvanich, D. Effect of the hydrophilic-lipophilic balance values of non-ionic surfactants on size and size distribution and stability of oil/water soybean oil nanoemulsions. Thai J. Pharm. Sci. 2021, 45, 487–491. [Google Scholar] [CrossRef]
  31. Vashist, S.; Gadewar, M. Preparation and characterization of mucoadhesive proniosomal gel of curcumin with thiolated chitosan for the treatment of oral mucositis. Int. J. Pharm. Investig. 2023, 13, 666–672. [Google Scholar] [CrossRef]
  32. Moammeri, A.; Chegeni, M.M.; Sahrayi, H.; Ghafelehbashi, R.; Memarzadeh, F.; Mansouri, A.; Akbarzadeh, I.; Abtahi, M.S.; Hejabi, F.; Ren, Q. Current advances in niosomes applications for drug delivery and cancer treatment. Mater. Today Bio 2023, 23, 100837. [Google Scholar] [CrossRef]
  33. Ritwiset, A.; Maensiri, S.; Krongsuk, S. Insight into molecular structures and dynamical properties of niosome bilayers containing melatonin molecules: A molecular dynamics simulation approach. RSC Adv. 2024, 14, 1697–1709. [Google Scholar] [CrossRef] [PubMed]
  34. Hoseini, B.; Jaafari, M.R.; Golabpour, A.; Momtazi-Borojeni, A.A.; Karimi, M.; Eslami, S. Application of ensemble machine learning approach to assess the factors affecting size and polydispersity index of liposomal nanoparticles. Sci. Rep. 2023, 13, 18012. [Google Scholar] [CrossRef] [PubMed]
  35. Nabila, F.H.; Islam, R.; Shimul, I.M.; Moniruzzaman, M.; Wakabayashi, R.; Kamiya, N.; Goto, M. Ionic liquid-mediated ethosome for transdermal delivery of insulin. Chem. Commun. 2024, 60, 4036–4039. [Google Scholar] [CrossRef]
  36. Priya, S.; Jyothi, D.; James, J.; Maxwell, A. Formulation and optimization of ethosomes loaded with ropinirole hydrochloride: Application of quality by design approach. Res. J. Pharm. Technol. 2020, 13, 4339. [Google Scholar] [CrossRef]
  37. Mohammad Hamdi, N.A.; Ismail, A.F.H.; Salahuddin, M.; Lestari, W. Ascorbic acid-loaded poly(lactic-co-glycolic acid) nanoparticles incorporated into a polyacrylic acid gel as a promising tool for site-specific oral cancer therapy. Thai J. Pharm. Sci. 2023, 46, 696–710. [Google Scholar] [CrossRef]
  38. Xie, S.; Wang, S.; Zhu, L.; Wang, F.; Zhou, W. The effect of glycolic acid monomer ratio on the emulsifying activity of PLGA in preparation of protein-loaded SLN. Colloids Surf. B Biointerfaces 2009, 74, 358–361. [Google Scholar] [CrossRef]
  39. Wang, L.; Wang, P.; Liu, Y.; Mustafa Mahayyudin, M.A.; Li, R.; Zhang, W.; Zhan, Y.; Li, Z. The effect of different factors on poly(lactic-co-glycolic acid) nanoparticle properties and drug release behaviors when co-loaded with hydrophilic and hydrophobic drugs. Polymers 2024, 16, 865. [Google Scholar] [CrossRef]
  40. Ali, R.; Saeed, N.; Al-Niemi, K. Study of isothermal, kinetic and thermodynamic parameters of adsorption of glycolic acid by a mixture of adsorbent substance with ab-initio calculations. Egypt. J. Chem. 2022, 65, 489–504. [Google Scholar] [CrossRef]
  41. Roces, C.B.; Christensen, D.; Perrie, Y. Translating the fabrication of protein-loaded poly(lactic-co-glycolic acid) nanoparticles from bench to scale-independent production using microfluidics. Drug Deliv. Transl. Res. 2020, 10, 582–593. [Google Scholar] [CrossRef]
  42. Witika, B.A.; Bassey, K.E.; Demana, P.H.; Siwe-Noundou, X.; Poka, M.S. Current advances in specialised niosomal drug delivery: Manufacture, characterization and drug delivery applications. Int. J. Mol. Sci. 2022, 23, 9668. [Google Scholar] [CrossRef]
  43. Németh, Z.; Csóka, I.; Semnani Jazani, R.; Sipos, B.; Haspel, H.; Kozma, G.; Kónya, Z.; Dobó, D.G. Quality by design-driven zeta potential optimisation study of liposomes with charge imparting membrane additives. Pharmaceutics 2022, 14, 1798. [Google Scholar] [CrossRef]
  44. Huang, M.-H.; Huang, S.-Y.; Chen, Y.-X.; Chen, C.-Y.; Lin, Y.-S. Elaboration of charged poly(lactic-co-glycolic acid) microparticles for effective release of tranexamic acid. Polymers 2020, 12, 808. [Google Scholar] [CrossRef]
  45. Xiong, Y.; Liu, X.; Xiong, H. Aggregation modeling of the influence of pH on the aggregation of variably charged nanoparticles. Sci. Rep. 2021, 11, 17386. [Google Scholar] [CrossRef]
  46. Senjab, R.M.; AlSawaftah, N.; Abuwatfa, W.H.; Husseini, G.A. Advances in liposomal nanotechnology: From concept to clinics. RSC Pharm. 2024, 1, 928–948. [Google Scholar] [CrossRef]
  47. Musielak, E.; Krajka-Kuźniak, V. Liposomes and ethosomes: Comparative potential in enhancing skin permeability for therapeutic and cosmetic applications. Cosmetics 2024, 11, 191. [Google Scholar] [CrossRef]
  48. Moghimipour, E.; Gorji, A.; Yaghoobi, R.; Salimi, A.; Latifi, M.; Aghakouchakzadeh, M.; Handali, S. Clinical evaluation of liposome-based gel formulation containing glycolic acid for the treatment of photodamaged skin. J. Drug Target. 2024, 32, 74–79. [Google Scholar] [CrossRef] [PubMed]
  49. Muslim, R.K.; Maraie, N.K. Preparation and evaluation of nano-binary ethosomal dispersion for flufenamic acid. Mater. Today Proc. 2022, 57, 354–361. [Google Scholar] [CrossRef]
  50. Manpreet, D.; Sachdeva, S.; Kaur, H.; Singh, J. Ethosomes: A revolutionary approach in advanced drug delivery systems. J. Drug Deliv. Ther. 2025, 15, 186–192. [Google Scholar] [CrossRef]
  51. Alhur, S.J.A.; Mahmood, H.S. Fabrication and assessment of ethosomes for effective transdermal delivery of loxoprofen. Iran. J. Basic Med. Sci. 2025, 28, 728–738. [Google Scholar] [CrossRef]
  52. Neupane, R.; Boddu, S.H.S.; Renukuntla, J.; Babu, R.J.; Tiwari, A.K. Alternatives to biological skin in permeation studies: Current trends and possibilities. Pharmaceutics 2020, 12, 152. [Google Scholar] [CrossRef]
  53. Zhan, B.; Wang, J.; Li, H.; Xiao, K.; Fang, X.; Shi, Y.; Jia, Y. Ethosomes: A promising drug delivery platform for transdermal application. Chemistry 2024, 6, 993–1019. [Google Scholar] [CrossRef]
  54. Prajapati, R.V.; Shah, N.; Upadhyay, D.U. Ethosomal nanocarriers: A revolutionary path-breaking vesicular drug delivery. Int. J. Sci. Res. 2024, 19, 74–79. [Google Scholar]
  55. Kroll, P.; Benke, J.; Enders, S.; Brandenbusch, C.; Sadowski, G. Influence of temperature and concentration on the self-assembly of nonionic CiEj surfactants: A light scattering study. ACS Omega 2022, 7, 7057–7065. [Google Scholar] [CrossRef] [PubMed]
  56. Sallustio, V.; Farruggia, G.; di Cagno, M.P.; Tzanova, M.M.; Marto, J.; Ribeiro, H.; Goncalves, L.M.; Mandrone, M.; Chiocchio, I.; Cerchiara, T.; et al. Design and characterization of an ethosomal gel encapsulating rosehip extract. Gels 2023, 9, 362. [Google Scholar] [CrossRef] [PubMed]
  57. Nasr, A.M.; Moftah, F.; Abourehab, M.A.S.; Gad, S. Design, formulation, and characterization of valsartan nanoethosomes for improving their bioavailability. Pharmaceutics 2022, 14, 2268. [Google Scholar] [CrossRef] [PubMed]
  58. Khudair, N.; Agouni, A.; Elrayess, M.A.; Najlah, M.; Younes, H.M.; Elhissi, A. Letrozole-loaded nonionic surfactant vesicles prepared via a slurry-based proniosome technology: Formulation development and characterization. J. Drug Deliv. Sci. Technol. 2020, 58, 101721. [Google Scholar] [CrossRef]
  59. Ababei-Bobu, A.; Profire, B.-Ș.; Iacob, A.-T.; Chirliu, O.-M.; Lupașcu, F.G.; Profire, L. Niosomes as vesicular carriers: From formulation strategies to stimuli-responsive innovative modulations for targeted drug delivery. Pharmaceutics 2025, 17, 1473. [Google Scholar] [CrossRef]
Figure 1. Agglomeration in ethanol-based niosomes loaded with high glycolic acid concentrations: (a) GA 50% and (b) GA 70%. Visible vesicle agglomerates indicate reduced colloidal stability at elevated GA loading (Red circle).
Cosmetics 13 00086 g001
Figure 2. Ethanol-based niosome formulation loaded with 10% glycolic acid.
Cosmetics 13 00086 g002
Figure 3. Vesicle size distribution and zeta potential of glycolic acid-loaded ethanol-based niosomes measured using a Zetasizer ZS-100 (HORIBA, Ltd., Kyoto, Japan). (a) Zeta potential of LGA 10% formulation showing a value of 9.2 mV. (b) Vesicle size distribution of LGA 10% formulation with a Z-average size of 175.20 nm and a PDI of 0.14, indicating a relatively uniform and stable vesicular system.
Cosmetics 13 00086 g003
Figure 4. Scanning electron microscopy (SEM) images of 10% glycolic acid-loaded ethanol-based niosomes.
Cosmetics 13 00086 g004
Figure 5. DSC thermograms of ethanol-based niosomes and conventional niosomes. The red curve represents ethanol-based niosomes, while the black curve corresponds to conventional niosomes. Endothermic peaks are shown in the downward direction, whereas exothermic peaks are shown upward, according to the instrument heat flow setting.
Cosmetics 13 00086 g005
Figure 6. Cumulative permeated amount of glycolic acid per unit area from LGA 10% and GA 10% over 24 h, measured using receptor compartment samples in a Franz diffusion cell system. All data are expressed as mean ± S.D. from triplicate experiments. * Indicates statistically significant differences between LGA 10% and GA 10% at the same time point (p < 0.05).
Cosmetics 13 00086 g006
Figure 7. Vesicle size variation in blank and LGA 10% during 3 months of storage under different temperature conditions: (a) 4 °C, (b) room temperature, and (c) 45 °C. Data are presented as mean ± S.D. (n = 3). “ns” denotes non-significant differences, while different letters represent statistically significant differences among groups (p < 0.05).
Cosmetics 13 00086 g007
Figure 8. PDI variation in blank and LGA 10% during 3 months of storage under different temperature conditions: (a) 4 °C, (b) room temperature, and (c) 45 °C. Data are presented as mean ± S.D. (n = 3). “ns” denotes non-significant differences.
Cosmetics 13 00086 g008
Figure 9. Zeta potential variation in blank and LGA 10% during 3 months of storage under different temperature conditions: (a) 4 °C, (b) room temperature, and (c) 45 °C. Data are presented as mean ± S.D. (n = 3). “ns” denotes non-significant differences.
Cosmetics 13 00086 g009
Table 1. Effect of nonionic surfactant type on vesicle size (nm), PDI, and zeta potential (mV) of niosomes.
FormulationRatioVesicle Size (nm)PDIZeta Potential (mV)
Brij 97: Chol1:1401.80 ± 16.28 a0.36 ± 0.04 a−68.87 ± 1.58 a
Brij C20: Chol1:1720.93 ± 298.62 a0.35 ± 0.24 a−54.20 ± 1.21 b
Brij 72: Chol1:12390.00 ± 121.20 b0.62 ± 0.55 a−41.67 ± 2.74 c
Values are given as mean ± S.D. from triplicate. a–c Mean with the same letter in a column are significantly different at p < 0.05.
Table 2. Effect of surfactant-to-cholesterol ratio on vesicle size (nm), PDI, and zeta potential (mV) of niosomes.
Formulation RatioVesicle Size (nm)PDIZeta Potential (mV)
Brij 97: Chol1:1168.40 ± 3.12 a0.15 ± 0.05 a−45.37 ± 1.16 a
Brij 97: Chol2:1299.90 ± 5.56 b0.26 ± 0.05 b−46.05 ± 3.24 a
Brij 97: Chol3:1394.43 ± 15.03 c0.42 ± 0.06 c−39.73 ± 0.38 b
Brij 97: Chol5:1552.17 ± 24.10 d0.39 ± 0.07 c−41.60 ± 0.52 b
Values are given as mean ± S.D. from triplicate. a–d Mean with the same letter in a column are significantly different at p < 0.05.
Table 3. Effect of ethanol concentration on vesicle size (nm), PDI, and zeta potential (mV) of niosomes and ethanol-based niosomes.
Formulation RatioEthanol (%)Vesicle Size (nm)PDIZeta Potential (mV)
Brij 97: Chol1:10226.63 ± 6.24 a0.29 ± 0.39 a−37.43 ± 1.15 c
Brij 97: Chol1:110181.63 ± 3.58 b0.07 ± 0.05 b−47.87 ± 1.12 a
Brij 97: Chol1:120181.17 ± 8.70 b0.10 ± 0.01 b−43.37 ± 2.74 b
Brij 97: Chol1:130Agglomeration
Brij 97: Chol1:140
Brij 97: Chol1:150
Values are given as mean ± S.D. from triplicate. a–c Mean with the same letter in a column are significantly different at p < 0.05.
Table 4. Vesicle size (nm), PDI, and zeta potential (mV) of ethanol-based niosomes loaded with different concentrations of glycolic acid.
Formulation RatioEthanol (%)Glycolic Acid (% w/v)Vesicle Size (nm)PDIZeta Potential (mV)
Brij 97: Chol1:100251.33 ± 6.48 l0.26 ± 0.09 bc−46.57 ± 0.59 a
Brij 97: Chol1:1100170.53 ± 5.05 ab0.14 ± 0.10 ab−37.77 ± 2.21 b
Brij 97: Chol1:110 0.5173.10 ± 2.25 abc0.09 ± 0.07 a4.57 ± 0.31 c
Brij 97: Chol1:1101.0260.57 ± 3.67 m0.30 ± 0.01 c24.53 ± 3.45 h
Brij 97: Chol1:110 2.0187.97 ± 0.81 gh0.19 ± 0.06 abc18.13 ± 1.46 fgh
Brij 97: Chol1:1103.0180.07 ± 1.25 de0.14 ± 0.01 ab19.90 ± 2.15 gh
Brij 97: Chol1:110 4.0180.33 ± 2.18 de0.08 ± 0.03 a18.33 ± 1.03 fgh
Brij 97: Chol1:1105.0186.97 ± 1.10 fgh0.15 ± 0.03 ab15.13 ± 0.99 ef
Brij 97: Chol1:110 6.0183.67 ± 2.40 efg0.16 ± 0.03 ab16.13 ± 2.25 efg
Brij 97: Chol1:1107.0180.17 ± 1.66 de0.10 ± 0.07 a13.90 ± 2.17 e
Brij 97: Chol1:110 8.0174.57 ± 1.29 bc0.10 ± 0.04 a13.63 ± 0.31 e
Brij 97: Chol1:1109.0168.80 ± 1.66 a0.11 ± 0.02 a12.97 ± 0.58 e
Brij 97: Chol1:110 10176.93 ± 1.51 cd0.12 ± 0.02 a9.10 ± 1.85 d
Brij 97: Chol1:11020186.63 ± 1.59 fgh0.15 ± 0.01 ab9.17 ± 4.36 d
Brij 97: Chol1:110 30182.17 ± 0.87 def0.19 ± 0.01 ab7.30 ± 2.35 cd
Brij 97: Chol1:11040191.80 ± 1.10 hi0.09 ± 0.01 a3.73 ± 0.21 c
Brij 97: Chol1:110 50187.87 ± 2.39 gh0.18 ± 0.09 ab7.67 ± 1.29 cd
Brij 97: Chol1:11060195.17 ± 0.40 ij0.16 ± 0.04 ab5.43 ± 2.01 cd
Brij 97: Chol1:110 70191.30 ± 5.12 hi0.14 ± 0.10 ab4.60 ± 2.00 c
Brij 97: Chol1:11080196.93 ± 3.38 jk0.15 ± 0.03 ab6.40 ± 3.40 cd
Brij 97: Chol1:110 90201.53 ± 4.74 k0.18 ± 0.15 ab4.43 ± 3.76 c
Values are given as mean ± S.D. from triplicate. a–m Mean with the same letter in a column are significantly different at p < 0.05.
Table 5. Stability of ethanol-based niosomes evaluated using the heating–cooling cycle method.
Formulation RatioEthanol (%)Glycolic Acid
(% w/v)
Vesicle Size (nm)PDIZeta Potential (mV)
InitialAfterInitialAfterInitialAfter
Brij 97: Chol1:100251.33 ± 6.48265.07 ± 1.19 *0.26 ± 0.090.24 ± 0.05−46.57 ± 0.59−32.10 ± 0.96 *
Brij 97: Chol1:1100170.53 ± 5.05179.17 ± 3.200.14 ± 0.100.20 ± 0.08 *−37.77 ± 2.21−38.47 ± 2.21
Brij 97: Chol1:1100.5173.10 ± 2.25240.33 ± 2.81 *0.09 ± 0.070.39 ± 0.01 *4.57 ± 0.31−2.80 ± 0.70 *
Brij 97: Chol1:1101.0260.57 ± 3.67239.83 ± 5.06 *0.30 ± 0.010.36 ± 0.01 *24.53 ± 3.45−1.70 ± 0.79 *
Brij 97: Chol1:1102.0187.97 ± 0.81198.50 ± 2.52 *0.19 ± 0.070.27 ± 1.3918.13 ± 1.46−9.53 ± 1.69 *
Brij 97: Chol1:1103.0180.07 ± 1.25189.03 ± 1.40 *0.14 ± 0.010.20 ± 0.84 *19.90 ± 2.151.27 ± 1.45 *
Brij 97: Chol1:1104.0180.33 ± 2.18185.90 ± 5.720.08 ± 0.030.18 ± 0.0718.33 ± 1.030.60 ± 2.31 *
Brij 97: Chol1:1105.0186.97 ± 1.10198.03 ± 2.01 *0.15 ± 0.030.20 ± 0.0215.13 ± 0.990.77 ± 0.47 *
Brij 97: Chol1:1106.0183.67 ± 2.40190.00 ± 4.750.16 ± 0.030.23 ± 0.01 *16.13 ± 2.25−1.70 ± 1.31 *
Brij 97: Chol1:1107.0180.17 ± 1.66182.87 ± 2.35 *0.10 ± 0.070.15 ± 0.0313.90 ± 2.17−0.93 ± 4.01 *
Brij 97: Chol1:1108.0174.57 ± 1.29182.90 ± 3.25 *0.10 ± 0.040.12 ± 0.0813.63 ± 0.31−0.23 ± 1.07 *
Brij 97: Chol1:1109.0168.80 ± 1.66188.90 ± 4.94 *0.11 ± 0.020.12 ± 0.0712.97 ± 0.580.73 ± 1.23 *
Brij 97: Chol1:11010176.93 ± 1.51186.50 ± 3.04 *0.12 ± 0.020.13 ± 0.089.10 ± 1.850.53 ± 2.93 *
Brij 97: Chol1:11020186.63 ± 1.59Agglomeration0.15 ± 0.01Agglomeration9.17 ± 4.36Agglomeration
Brij 97: Chol1:11030182.17 ± 0.870.19 ± 0.017.30 ± 2.35
Brij 97: Chol1:11040191.80 ± 1.100.09 ± 0.013.73 ± 0.21
Brij 97: Chol1:11050187.87 ± 2.390.18 ± 0.097.67 ± 1.29
Brij 97: Chol1:11060195.17 ± 0.400.16 ± 0.045.43 ± 2.01
Brij 97: Chol1:11070191.30 ± 5.120.14 ± 0.104.60 ± 2.00
Brij 97: Chol1:11080196.93 ± 3.380.15 ± 0.036.40 ± 3.40
Brij 97: Chol1:11090201.53 ± 4.740.18 ± 0.154.43 ± 3.76
Values are given as mean ± S.D. from triplicate. * indicates significant differences when compared with initial (p < 0.05).
Table 6. Cumulative permeated amount per unit area and permeation flux of glycolic acid from GA 10% and LGA 10% over 24 h.
Cumulative Permeated AmountFluxes
Sample(mg/cm2)(mg/cm2/h)
Whole skinReceiving
Compartment
Whole skinReceiving
compartment
GA 10%2.515 ± 0.42819.728 ± 3.5180.105 ± 0.0180.822 ± 0.147
LGA 10%4.248 ± 0.154 *49.558 ± 8.951 *0.177 ± 0.006 *2.065 ± 0.373 *
All values are expressed as mean ± S.D. from triplicate experiments. * indicates statistically significant differences (p < 0.05).
Table 7. Entrapment efficiency of glycolic acid-loaded ethanol-based niosomes after 3 months of storage at 4 °C, room temperature (RT), and 45 °C.
Storage TemperatureEntrapment Efficiency (%EE)
InitialAfter
4 °C75.48 ± 0.2160.01 ± 0.70 *
RT75.48 ± 0.2159.86 ± 0.51 *
45 °C75.48 ± 0.2158.93 ± 0.95 *
Data are presented as mean ± S.D. * indicates statistically significant differences compared with initial entrapment efficiency values (p < 0.05).
Disclaimer/Publisher’s Note: The statements, opinions and data contained in all publications are solely those of the individual author(s) and contributor(s) and not of MDPI and/or the editor(s). MDPI and/or the editor(s) disclaim responsibility for any injury to people or property resulting from any ideas, methods, instructions or products referred to in the content.