1. Introduction
In topical products, preservatives, along with fragrances, are among the classes of excipients that most commonly cause adverse reactions, including skin irritation, endocrine disruption, and microbiome alteration [
1]. Recently, the media has influenced consumers to avoid products containing synthetic preservatives, leading to an increased demand for eco-friendly and sustainable products [
2,
3]. Finding alternatives to preservatives has become a booster for natural products or products containing natural components [
4,
5,
6]. Besides sustainability, the use of natural ingredients can also present interesting combined properties, such as antioxidant effects, enabling the development of multifunctional excipients [
7].
Among natural options,
Rosmarinus officinalis, popularly known as rosemary, has demonstrated antimicrobial activity, primarily due to the synergistic action of carnosic and rosmarinic acids [
8,
9]. Rosemary is a plant belonging to the Lamiaceae family and originally from the Mediterranean region, currently found all over the world [
10], and has already been widely used as a preservative in the food industry [
11], showing potential for use in the pharmaceutical and cosmetic industries.
Additionally, coffee by-products, which contain phenolic compounds such as chlorogenic acid and caffeine, also show antimicrobial properties [
12,
13,
14,
15,
16]. Coffee is one of the biggest commodities and one of the most consumed beverages worldwide, with a characteristic flavor and aroma, and the main coffee species traded worldwide are
Coffea arabica L. (arabica) and
Coffea canephora Pierre (robusta) [
17,
18,
19]. Given the environmental impact of coffee waste, with more than 50% weight being estimated to be discarded during the production of coffee powder [
14], utilizing these by-products as natural preservatives presents both sustainability and efficacy benefits.
This study evaluates the antimicrobial and antioxidant properties of rosemary and coffee by-product extracts, and explores their combined potential as a preservative system for topical formulations.
2. Materials and Methods
2.1. Material
Quercetin (95% of purity), ethylenediaminetetraacetic acid disodium salt dihydrate (EDTA), and 1,1-diphenyl-2-picrilhhydrasyl (DPPH) were provided by Sigma-Aldrich (São Paulo, Brazil); sodium carbonate, butylhydroxytoluene (BHT) by Êxodo Científica (Sumaré, São Paulo, Brazil); methanol, aluminum chloride, and sodium chloride by Synth (São Paulo, Brazil); Folin–Ciocalteau, ethanol, gallic acid, Tween 80, and soy lecithin by Dinâmica (São Paulo, Brazil); Polawax NF® by Croda (Campinas, São Paulo, Brazil); and octyl stearate, dimethicone, methylparaben, and propylparaben by MagisPharma (Campinas, São Paulo, Brazil). All solvents and reagents used were of analytical grade.
2.2. Plant Samples
Coffee pulp was donated by the Institute of Food Technology (ITAL, Campinas SP, Brazil) through the NIT APTA (São Paulo Agency for Agribusiness Technology), and was registered in the National System of Genetic Resource Management and Associated Traditional Knowledge (SisGen) under registration numbers A9C95AB (C. arabica) and A0C807C (C. cannefora). These samples were processed, generating different types for analysis.
(A) Concentrated aqueous extract: This was obtained by the extraction of the pulp of C. cannefora in water and concentrated with temperature and negative pressure (vacuum). Procedures were based on the patent filed with the INPI (Instituto Nacional da Propriedade Industrial, Brazil), under registration number BR 102018002715-8.
(B) Flour: This was obtained by drying the whole pulp of C. arabica by forced air circulation, obtained after mechanical peeling (or pulping). The drying temperature was 55 °C, until the final humidity was between 2 and 4% w/w. The dry product went through 3 sequential mills in a knife and hammer mill.
Rosemary dried leaves were purchased at a local market (Mogi Mirim market, São Paulo, Brazil) and were registered in the National System of Genetic Heritage Management and Associated Traditional Knowledge (SisGen) under registration number A024F1B.
2.3. Extract Preparation
Coffee samples were extracted by the maceration method. Five grams of
C. arabica (CA) or
C. cannefora (CR) were weighed and extracted with 100 mL of 70% (
v/
v) ethanol at 25 °C under agitation for 20 min, and then filtered through a filter paper [
20].
Rosemary extracts were prepared by weighing five grams of dry leaves and then extracting it using 100 mL of (i) ethanol 70% (
v/
v) by ultrasound (AU70) and (ii) by infusion (AU70), (iii) ethanol P.A. by ultrasound (AU100) and by infusion (AU100), and then filtered through a filter paper [
10,
21].
After filtration, coffee and rosemary extracts had the solvent removed under vacuum from the samples in a rotary evaporator (Fisatom 802, Fisatom, São Paulo, SP, Brazil) for 1 h, at 80 °C and 150 rpm. Subsequently, all the extracts were subjected to lyophilization (Lyostar 3, SP Scientific, Gardiner, NY, USA). The samples were frozen at −40 °C for 4 h, followed by drying under vacuum at 100 mTorr. [
22].
Descriptions of the extract abbreviations used in the study are as follows: CA: Coffea arabica flour extracted by maceration with 70% ethanol; CR: Coffea cannefora (robusta) concentrated aqueous extract extracted by maceration with 70% ethanol; AU70: Rosmarinus officinalis leaves extracted by ultrasound with 70% ethanol; AI70: Rosmarinus officinalis leaves extracted by infusion with 70% ethanol; AU100: Rosmarinus officinalis leaves extracted by ultrasound with ethanol p.a.; AI100: Rosmarinus officinalis leaves extracted by infusion with ethanol p.a.
2.4. Total Phenolic Content
The total phenolic content was evaluated by the Folin–Ciocalteu method. The lyophilized extracts were solubilized in ethanol 70% (
v/
v) (1 mg/mL and 0.5 mg/mL for coffee and rosemary extracts, respectively). The reactional medium was made by adding in a 96-well plate: 20 µL aliquots of the samples, 180 µL of ultrapure water, 20 µL of methanol, 20 µL of Folin–Ciocalteu 1 N, and 60 µL of sodium carbonate. A standard curve was prepared with gallic acid in the range from 0 to 10 µg/mL. The samples were incubated in the dark at room temperature for 20 min. Absorbances were analyzed on a spectrophotometer (Thermo Scientific, Multiskan Sky, Vantaa, Finland) at 760 nm, and the results are expressed in mg gallic acid equivalents/g of sample (mg GAE/g sample) [
23].
2.5. Flavonoid Content
Flavonoid content was evaluated by solubilizing 8 mg of the lyophilized extracts in 2 mL of methanol, and mixing 500 µL of this solution with 500 µL of a 2% (
w/
v) solution of aluminum chloride (AlCl
3) in methanol. A blank control was prepared by mixing 500 µL of AlCl3 with 500 µL of methanol. Absorbances were analyzed on a spectrophotometer (Thermo Scientific, Multiskan Sky, Vantaa, Finland) after 10 min at 425 nm. A standard curve was prepared with quercetin in the range from 2 to 10 µg/mL. The result was expressed in mg of quercetin equivalents/g sample (mg QE/g sample) [
24].
2.6. Analysis of Antioxidant Activity
2.6.1. Free Radical Scavenging Activity—DPPH
The lyophilized extracts were solubilized in methanol in the range from 0.05 to 8 mg/mL. Then, 20 µL aliquots of these solutions were added in a 96-well plate, with 280 µL of 1,1- diphenyl-2-picrilhhydrasyl (DPPH) at a concentration of 32 μg/mL. The samples were incubated and protected from light for 30 min at room temperature. The absorbance was then measured at 517 nm in a spectrophotometer (Thermo Scientific, Multiskan Sky, Vantaa, Finland). The results were calculated and expressed as a percentage of antioxidant activity (% AA) Equation (1) and IC
50, using the software GraphPad Prism version 5.0 [
25].
2.6.2. Ferric Reducing Antioxidant Power—FRAP
The lyophilized extracts were solubilized in methanol in the range from 0.05 to 8 mg/mL. Then, 20 µL aliquots of these solutions were added in plates of 96 wells with 15 µL of ultrapure water and 265 µL of FRAP reagent. The samples were incubated for 30 min in the dark at 37 °C. The absorbance was measured at 595 nm in a spectrophotometer (Thermo Scientific, Multiskan Sky, Vantaa, Finland). A standard curve with gallic acid at the concentrations of 0 to 6 µg/mL was prepared, and the results are expressed as mg GAE/g sample and EC
50, using the software GraphPad Prism version 5.0 [
26].
2.7. Evaluation of Antimicrobial Activity
2.7.1. Microorganism Strains and Growing Conditions
The selected microorganisms were
Staphylococcus aureus (ATCC 6538),
Pseudomonas aeruginosa (ATCC 9027),
Escherichia coli (ATCC 8739), and
Candida albicans (ATCC 10231). The bacterial strains were cultured on tryptone soya agar (TSA, Difco™) for 24 h at 37 °C, while the yeast was grown on Sabouraud dextrose agar (SDA, Difco™) at 37 °C for 48 h [
27].
2.7.2. Determination of the Minimum Inhibitory Concentration—MIC
In all the wells of a 96-well plate, 100 µL of Mueller Hinton broth (MHB—for bacteria), or Roswell Park Memorial Institute (RPMI) medium (for yeast) were deposited. Then, 100 µL of the extracts was added to the first-row wells and 2× serial dilutions performed, obtaining concentrations within the 0.005–10 mg/mL range for rosemary samples, 0.025–50 mg/mL for CR and 0.05–100 mg/mL for CA.
The inoculum was prepared from strains cultivated on agar by collecting isolated colonies and dispersing them in MHB for bacteria and 0.9% saline solution for yeast. The absorbance was adjusted to 0.1 at 660 nm for bacteria and 530 nm for yeast. The inoculum was then diluted in MHB or RPMI according to the tested microorganism, achieving a concentration of 1 × 10⁶ CFU/mL for bacteria, and 1 × 10⁵ CFU/mL for yeast.
After, 100 µL of the inoculum was added to each well and the plate was incubated for 24 h at 37 °C. After the incubation period, the absorbance was measured at 660 nm in a spectrophotometer (Thermo Scientific, Multiskan Sky, Vantaa, Finland). Then, 30 µL of 0.01% (
w/
v) resazurin in ultrapure water was added to each well and, after 15 min, microbial growth was visually evaluated. The test was performed in triplicate and 70% ethanol and ultrapure water were used as the controls [
28].
2.7.3. Evaluation of Extract Association with Antimicrobial Activity
Extract associations were evaluated using the checkerboard method [
29]. The test was carried out in a 96-well plate, and the extracts were added at concentrations 1×, 1/2×, 1/4×, and 1/8× of the MIC value, adding 25 µL of each extract, 50 µL of MHB (for bacteria), or 50 µL RPMI (for yeast), and 100 µL of the inoculum (1 × 10
6 CFU/mL for bacteria, and 1 × 10
5 CFU/mL for yeast). The plate was incubated for 24 h at 37 °C. After the incubation period, the absorbance was measured at 660 nm in a spectrophotometer (Thermo Scientific, Multiskan Sky, Vantaa, Finland). Then, 30 µL of resazurin 0.01% (
m/
v) in ultrapure water were added to each well, and, after 15 min, the absorbance was measured at 570 nm.
The association effect was calculated through the fractional inhibitory concentration index (FICI), according to Equation 2, as follows: FICI ≤ 0.5, the extracts have synergic effects; 0.5 < FICI < 1, the extracts are partially synergistic; FICI = 1, the extracts have additive effects; 1 < FICI ≤ 4, the extracts are indifferent; and FICI > 4, the extracts have antagonism effects [
29].
2.8. Anti-Proliferative Activity Evaluation
2.8.1. Cell Line
The immortalized human keratinocytes (HaCat) were kindly donated by Dr. Ricardo Della Coletta (University of Campinas). Stock cultures were grown in a complete medium [RPMI-1640 (Nutricell, Brasil) supplemented with 5% fetal bovine serum (Vitrocell, Brasil) at 37 °C and 5% of CO2. All experiments were carried out with cells at 5 to 12 passages.
DMSO (100 mg/mL) addition was followed by serial dilution in a complete medium, resulting in final concentrations of 0.15, 1.5, 15, and 150 µg/mL. As previously reported, final concentration of DMSO (≤0.15%) did not affect cell viability [
30]. Doxorubicin (0.015, 0.15, 1.5, and 15 µg/mL) was diluted in the same way and used as positive control of cell death.
2.8.2. Anti-Proliferative Activity Assay
Anti-proliferative activity was performed following the NCI60 protocol with a few modifications [
30,
31,
32].
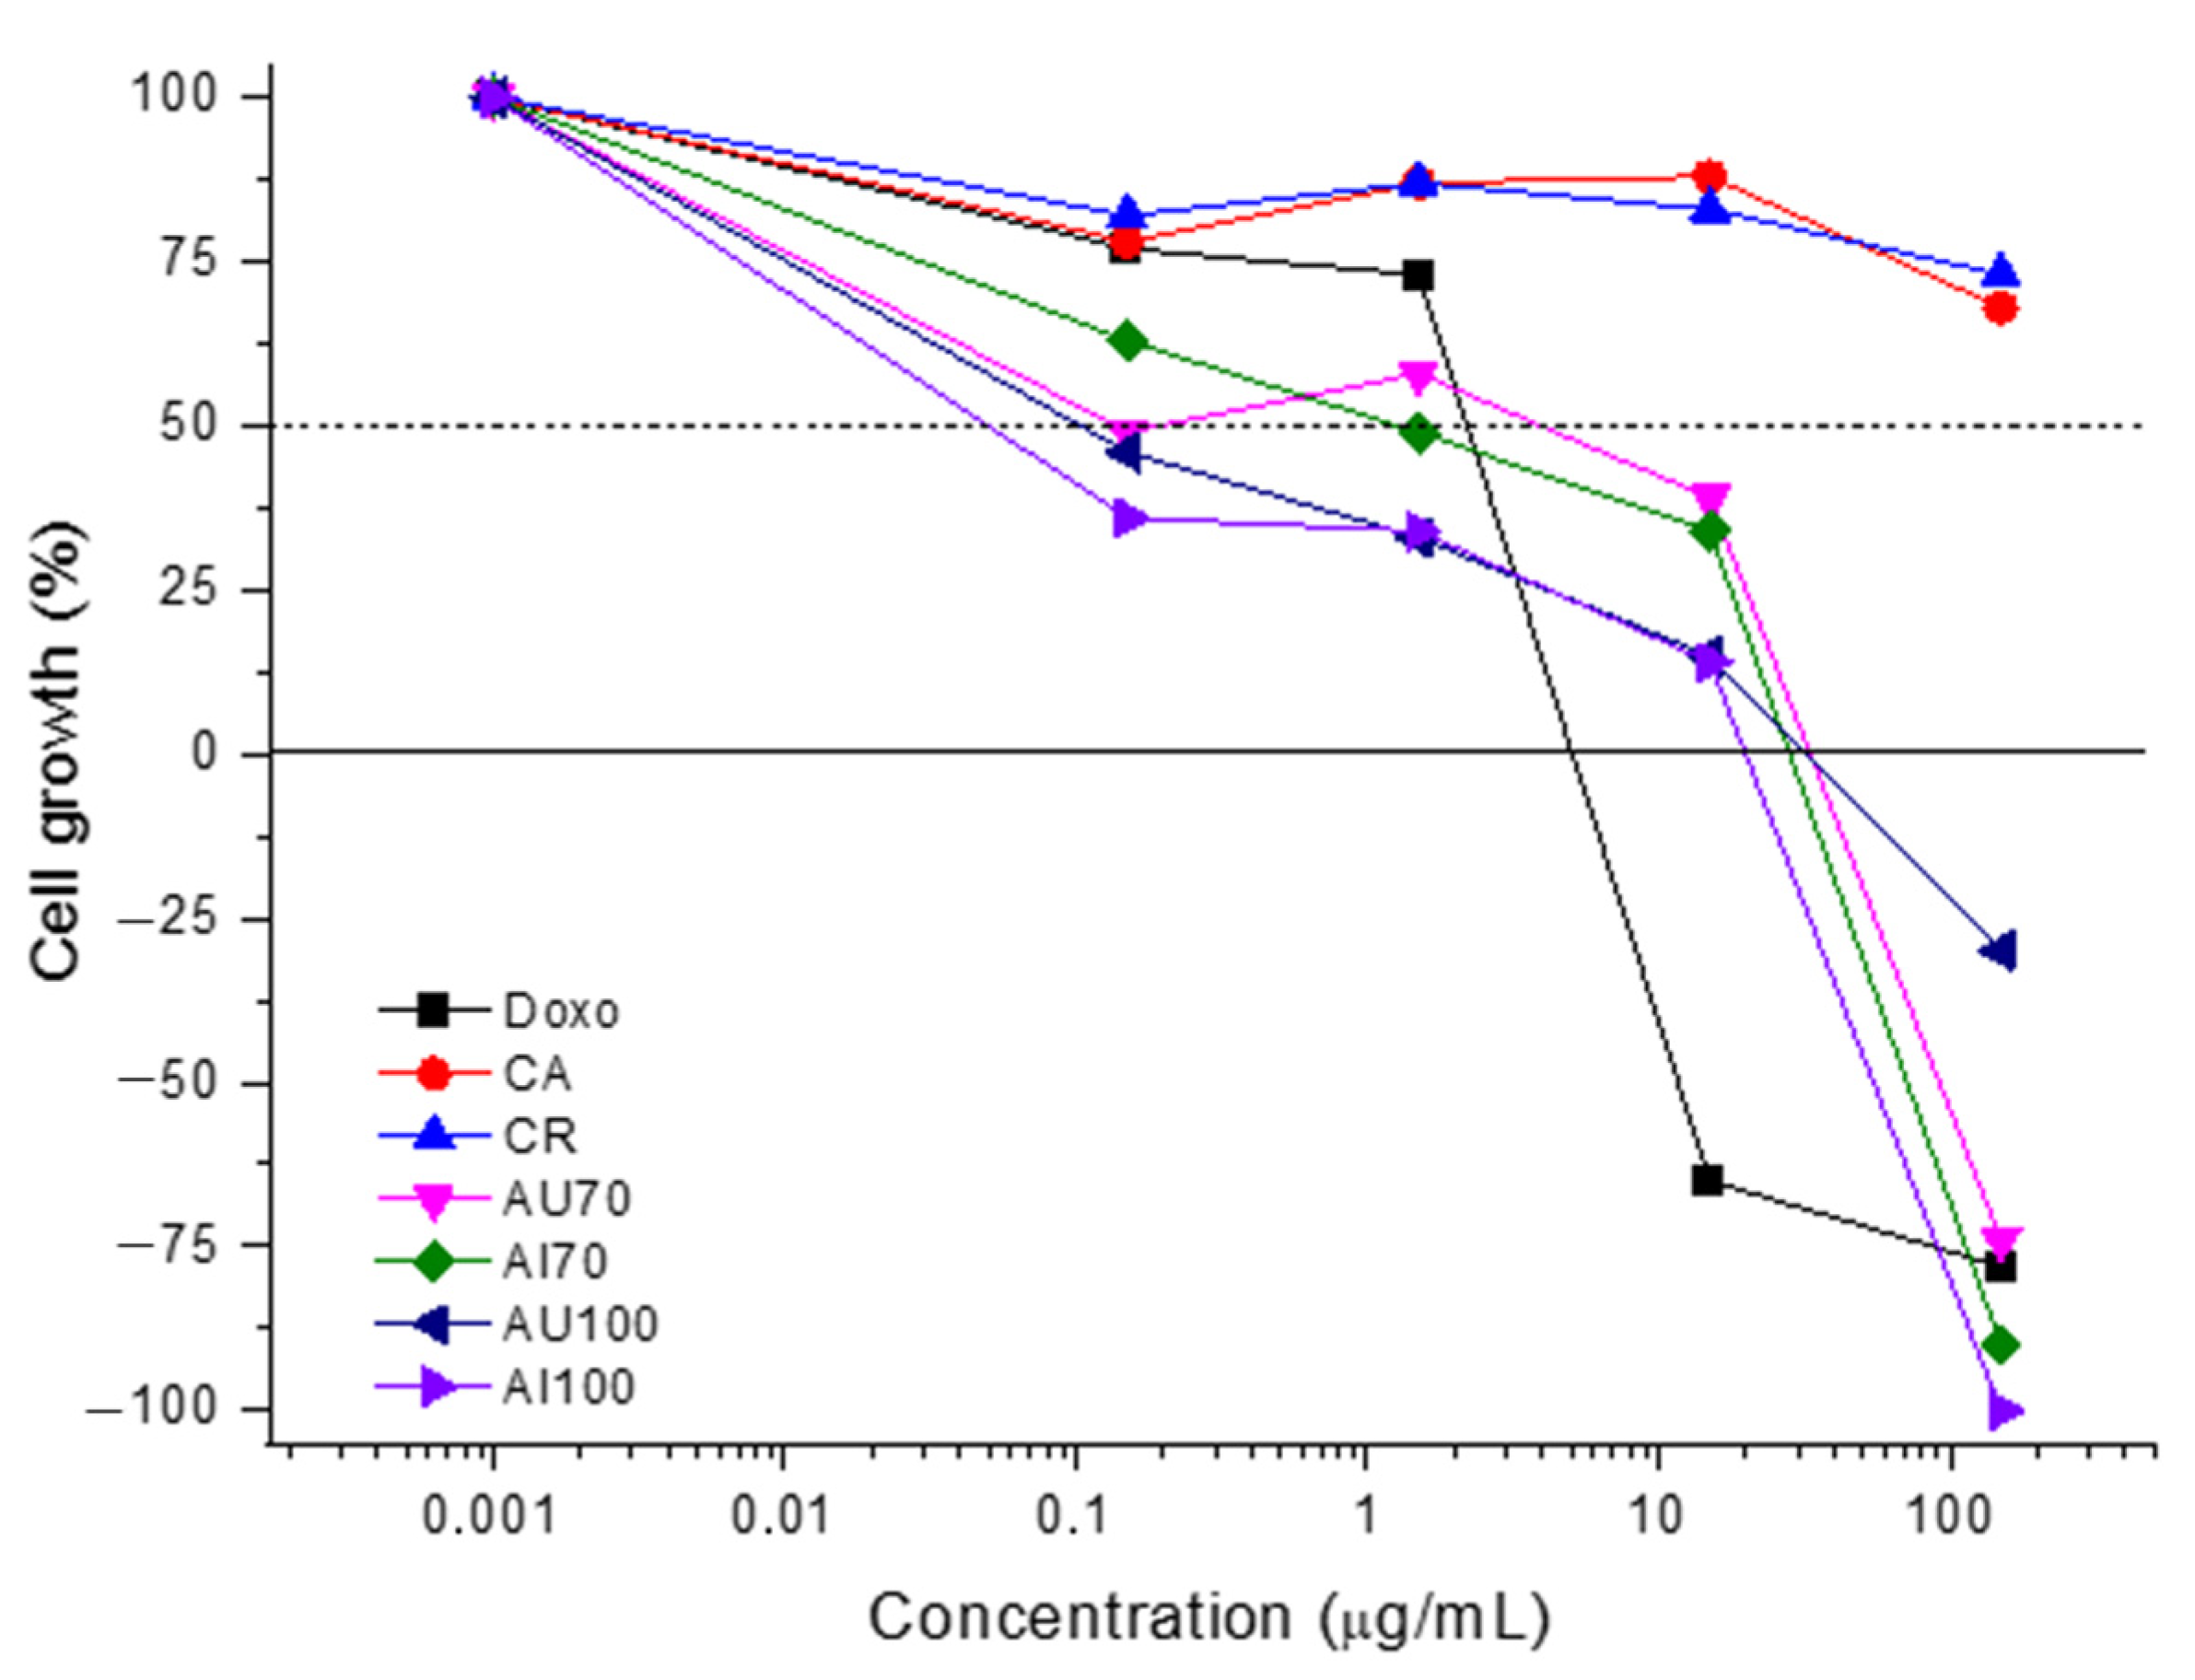
HaCaT cells were plated in 96-well plates (100 μL/well, 4 × 10⁴ cell/mL) for 24 h before sample addition (100 μL/well, 0.15 to 150 µg/mL) in triplicate, and incubated for 48 h at 37 °C and 5% of CO2. Before (T0) and after (T1) sample addition, the cells were fixed with trichloroacetic acid (50%, 50 μL/well), and cell proliferation quantification was determined by sulforhodamine B (SRB) protocol at 540 nm using a microplate reader spectrophotometer (VersaMax, Molecular Devices, San Jose, USA). Considering the difference between T0 and T1 absorbance values as representing 100% of cell growth, the proliferation (%) of HaCaT cells in the presence of each sample concentration was calculated and plotted as cell growth versus sample concentration. Using these curves, the effective concentration representing the sample concentration required to promote the total (TGI) growth inhibition of the keratinocytes was calculated by sigmoidal regression using Origin 8.0 software.
2.9. Development of an Emulsion Containing the Coffee and Rosemary Extracts
An oil-in-water (
O/
W) emulsion was developed according to
Table 1, using the standard method described by the Brazilian National Health Surveillance Agency (ANVISA) [
33]. For this, after heating both phases to 70 °C separately, the aqueous phase was poured into the oily phase and dispersed using Ultra-turrax
® (IKA, Staufen, Germany) at 14,000 rpm for 2 min. After cooling, the preservative solution was added.
2.10. Stability Tests
According to ISO/TR 18811:2018, preliminary screening tests, such as centrifugation, are commonly used to assess the physical stability of cosmetic products before proceeding to long-term or accelerated stability studies [
34]. Formulation was evaluated according to the stability assay recommended at Stability Guide of Cosmetic Products of ANVISA. For the pre-stability test, 5 g of formulation was submitted to a centrifuge cycle at 3000 rpm for 30 min, and it was analyzed whether there was phase separation [
35].
2.11. Mechanical Analysis
The spreadability and textural analysis were performed using a texture analyzer (Stable Micro Systems TAXT plus, Godalming, UK) using the compression mode, according to the parameters in
Table 2. For the textural analysis, both blank formulations and those containing extracts were evaluated using a standard back-extrusion container (50 mm diameter) filled to approximately 75% of its capacity. Parameters, including firmness (g), consistency (g·sec), cohesiveness (g), and work of cohesion (g·sec), were determined. For spreadability testing, the same formulations were placed into the female cone, ensuring that air pockets were removed by pressing down. The firmness (g) and work of shear (g·sec) were then measured [
36].
2.12. Challenge Test
2.12.1. Microorganism Preparation
The selected microorganisms were
S. aureus (ATCC 6538),
P. aeruginosa (ATCC 9027),
E. coli (ATCC 8739), and
C. albicans (ATCC 10231). The bacterial strains were cultured on tryptone soya agar (TSA, Difco™) for 24 h at 37 °C, while the yeast was grown on a Sabouraud dextrose agar (SDA, Difco™) at 37 °C for 48 h [
27].
2.12.2. Validation of Microbial Recovery
Preliminary studies were performed to assure the inoculum recovery by neutralizing the preservative system. The neutralizing medium was made using 0.5% (
m/
v) polysorbate 80, 0.07% (
m/
v) lecithin, and MHB, for bacteria, or Sabouraud dextrose broth, for yeast [
37]. The suspension of each microorganism was made in a sterile physiological saline solution (10
8 CFU/mL) and dilutions were made to achieve the concentration of 10
4 CFU/mL. 0.1 mL of the suspension of each microorganism was inoculated in 8.9 mL of the neutralizer and 1 g of the formulation, and 1 mL of the mixture were poured in the appropriate agar medium. After 48 h at 37 °C, the microorganisms were counted. The neutralizer toxicity was assessed comparing the physiological saline suspensions to the neutralizing medium.
Both determinations were compared to the recovery in a sterile physiological saline suspension with the same inoculum concentration (100 CFU/mL). The tests were made in triplicate [
38,
39].
2.12.3. Preservative Effectiveness Testing
The formulations with the extracts (20 g) were placed in sterile containers and inoculated with 0.2 mL of each bacterial or yeast suspension, obtaining a final concentration of approximately 10
6 CFU/g. The samples were homogenized using a sterile glass stirring rod, and incubated at 25 °C. Samples of 1 g were removed and placed into sterile conical tubes with 9 mL of a neutralizing medium, and were homogenized using a vortex mixer for 1 min. Dilutions of 10
−1 and 10
−2 were made, and 1 mL was poured in the appropriated agar medium. The same procedure was performed on days 0, 7, 14, 21, and 28. Cell viability was determined by the plate count method. All determinations were performed in triplicate, and the results represent an average of two different experiments [
38,
40].
4. Discussion
Previous studies have reported on values of 104.3 GAE/g of raw coffee [
46], and 17.75 to 21.56 mg GAE/g of spent coffee ground [
47]. Regarding flavonoid content, studies have reported values of approximately 0.18 to 1.05 mg QE/g of coffee bean extract [
48]. The observed differences can be attributed, in part, to the solvent used for extraction, as hydroalcoholic mixtures generally yield a higher phenolic content compared to pure water extractions [
49]. It is important to highlight that in this study, the coffee by-products analyzed exhibited phenolic content comparable to that of coffee beans, suggesting that these by-products retain a substantial concentration of bioactive compounds.
According to the literature, the total phenolic content values for rosemary values ranged from 26.43 ± 1.55 to 136.66 ± 7.41 mg EAG/g sample depending on the solvent and the extraction method used for extract preparation [
50,
51,
52]. For extractions using ethanol p.a., the results ranged from 2.98 [
53] to 11.89 [
54] mg QE/g sample. Comparative studies on solvent efficiency highlight the critical role of solvent polarity in the extraction of phenolic compounds. More polar solvents have been shown to enhance the extraction efficiency of rosemary phenolics [
51,
55,
56]. Given that the main compounds in rosemary, carnosic and rosmarinic acids, exhibited different polarities, hydroalcoholic solvents with ethanol-to-water ratios of 70:30 or 80:20 are optimal for their simultaneous extraction [
57]. Additionally, higher temperatures favor the extraction of phenolic compounds [
56], aligning with the results found.
The extracts that showed a higher total phenolic content also showed better antioxidant activity for both methods used. Similar results were found in the literature for the coffee samples reported for the coffee peel (34.8–82.6% AA) and the pulp (26.0–77.9% AA) [
58]. Meanwhile, rosemary samples showed lower values than those reported in other studies, whereby rosemary samples showed IC
50 values between 0.007 and 0.011 mg/mL [
54], and between 0.007 and 0.022 mg/mL [
59], but these results align with the observation that ethanol p.a. is less effective than mixing ethanol and water as extracting antioxidant compounds [
50,
56].
The MIC values found were lower than those found by Duangjai, Suphrom [
60] for coffee pulp (MIC of 37.5 mg/mL against
E. coli). A study using another coffee by-product, silverskin, found MIC values ranging from 0.3 mg/mL for
S. aureus to >1000 mg/mL for
P. aeruginosa [
61]. For the spent coffee of both species, MIC values against
C. albicans were 40 mg/mL [
62].
C. arabica leaves also showed antimicrobial activity against
E. coli and
S. aureus, reinforcing the potential of other coffee by-products [
63]. For the rosemary samples, the antimicrobial activity of their leaves is well documented in the literature, and is possibly due to the synergistic action between carnosic acid and rosmarinic acid [
64,
65,
66,
67]. This activity has already been demonstrated by several authors for rosemary extracts obtained using different methods and solvents [
51,
54,
68,
69].
A synergistic antimicrobial effect is generally desirable, as it allows for the use of less raw material to achieve the same effect, optimizing material utilization and potentially reducing cases of antimicrobial resistance [
70]. Studies have reported that phenolic compounds have their antimicrobial action due to their ability to change the structure of the cytoplasmic membrane. At subinhibitory concentrations, they facilitate the entry of other substances that act inside the bacterial cell, requiring a smaller amount of both compounds to show antimicrobial action [
41]. In the present study, the CR extract, despite having a higher concentration of total phenolics, showed a lower amount of flavonoids compared to CA. Meanwhile, the combination of CA with rosemary extracts generally exhibited better-synergy results. This may indicate that flavonoids are more related to the interaction between the extracts.
Although total phenolic and flavonoid contents were quantified in this study, these measurements provide only an overall estimation of bioactive compounds. To fully understand the specific constituents responsible for the observed biological activities, more detailed analyses using advanced techniques such as LC-MS or HPLC are necessary. These methods would allow for the identification and quantification of individual active compounds (e.g., carnosic acid, rosmarinic acid, chlorogenic acid), thereby strengthening the characterization of the formulation and providing clearer insights into its mechanisms of action. Future work should incorporate such analyses to enhance the robustness of the results.
A study associated rosemary extracts with
Salvia officinalis and
Thymus vulgaris, and obtained synergistic action against
S. aureus,
P. aeruginosa, and
E. coli [
69]. Another study showed that catechin, a polyphenolic compound present in many plants, acted synergistically with antibiotics against
S. aureus and
E. coli, but not against
P. aeruginosa [
71]. These findings suggest that combining antimicrobial compounds with different mechanisms of action can enhance efficacy, allowing for a reduced amount of active ingredients to achieve the desired effect.
Coffee by-products, such as green coffee and silverskin, are safe for topical use, once they demonstrate the absence of an effect on the proliferation and viability of human keratinocyte cells at concentrations up to 10 mg/mL [
61,
72,
73]. Also, further studies will be necessary to fully establish the safe use considering other aspects such as photosensitivity, pigmentation changes, and pruritus [
74,
75]. Regarding rosemary extracts,
R. officinalis glycolic extract, up to 100 mg/mL, maintained HaCaT cell viability greater than 50% [
76], suggesting that the glycolic extract might be safer for topical use compared to alcoholic and hydroalcoholic rosemary extracts, considering only cell viability and proliferation.
Besides suggesting an undesirable effect on proliferation of normal keratinocytes, the weak cytostatic effect observed for rosemary extracts may be suggestive of a potential effect on the treatment of skin diseases related to the disordered proliferation of keratinocytes, such as actinic keratosis, non-melanoma skin cancer, and psoriasis [
77,
78]. However, the biological activity of topical products includes the ability of their penetration through the skin barrier. It is important that the active substance is released from the formulation, reaches the skin, and overcomes the stratum corneum, penetrating deep into the epidermis and the dermis [
79]. Depending on the formulation goal, the emulsion can be adjusted to modulate the release and concentration of active compounds, either to limit cytostatic effects on healthy keratinocytes or enhance them in hyperproliferative conditions. Therefore, release and skin permeation studies, and complementary studies evaluating the irritation action and mechanisms of anti-proliferative activity in more complex experimental models are essential to better assess the potential application of these extracts in topical treatments.
The addition of the extracts to the emulsion was responsible for the pH drop, which may be interesting since formulations with a more acidic pH (between 4 and 5) are beneficial for the skin once they improve the skin’s barrier function and hydration, and help maintain a healthy microbiota, reducing the colonization of pathogenic microorganisms [
80,
81,
82]. Also, the incorporation of extracts altered the sensory properties of the formulation by increasing cohesion and reducing spreadability. These changes may affect user perception, making the product feel thicker and less easy to spread when compared to the blank formulation.
Regarding the ability of extracts to preserve formulations, other studies showed the potential of natural products to achieve this objective [
38,
83,
84,
85]. Nevertheless, many studies using natural products failed to preserve the formulation against yeasts [
38,
84]. It is possible that the presence of a complex formulation causes some of the constituents present in the extract to migrate to the oily phase of the emulsion, altering its antimicrobial activity when compared to the in vitro action. Another point is the use of formulation constituents as an energy substrate for the growth of
C. albicans, as already observed by another study [
86]. Finally, the pH of the formulation can significantly influence the growth of microorganisms, with
C. albicans being more resistant to these variations compared to the bacterial strains tested, which showed optimal growth at a pH close to neutrality [
87,
88,
89].
Extracts, being a set of compounds, face some challenges for the implementation of their use in industries. It is essential that the extraction process guarantees the integrity of the active substances, and that there is no negative interaction between the compounds of the extract among themselves, nor between them and the formulation [
7]. Another way of applying natural products to preserve formulations is their concomitant use with synthetic products. A study carried out by Kunicka-Styczyńska, Sikora [
86] showed that the use of essential oils achieved synergy with synthetic preservatives, which made it possible to reduce their use by up to eight times, without reducing conservation and lowering the adverse effects of synthetics preservatives. In this study, the combination of rosemary and coffee extracts served to reduce the need for synthetic preservatives against bacteria, although the use of antifungal agents may still be required to achieve the standard parameters.


 ,
, 


