Article

RNA Sequencing Reveals Effects of a New Complex Bath Additive on Cultured Cells

1
Doctoral Program in Sports Medicine, Graduate School of Comprehensive Human Sciences, University of Tsukuba, 1-1-1 Tennodai, Tsukuba 305-8572, Japan
2
X-PLOSION LLC, 2F Yamazaki CA Building, 3-8-11 Ougicho, Naka-ku, Yokohama 231-0027, Japan
3
Human Biology Program, University of Tsukuba, 1-1-1 Tennodai, Tsukuba 305-8572, Japan
4
Laboratory of Sports Medicine, Department of Clinical Medicine, Institute of Medicine, University of Tsukuba, 1-1-1 Tennodai, Tsukuba 305-8572, Japan
*
Author to whom correspondence should be addressed.
Cosmetics 2025, 12(3), 98; https://doi.org/10.3390/cosmetics12030098
Submission received: 3 April 2025 / Revised: 4 May 2025 / Accepted: 9 May 2025 / Published: 13 May 2025

Abstract

:
In recent years, bath additives developed to enhance the physiological benefits of bathing have become a popular part of self-care routines. However, there has been little investigation of the biological effects of these additives, especially in terms of their impact on gene expression. To bridge this research gap, this study was implemented to reveal the effects of a newly developed complex bath additive, Karada Totonou ProBath (KTPB), on gene expression, using RNA sequencing (RNA-seq). Two human skin-derived cell lines (keratinocytes and fibroblasts) were treated with KTPB at a final concentration of 100 μg/mL, and RNA extracted between 15 and 240 min after treatment was subjected to RNA-seq analysis. The results showed that KTPB induced significant changes in the expression of over 80 genes in both cell lines. In particular, the expression levels of genes encoding Early Growth Response Protein 1 and Hyaluronic Acid Synthases increased over time following the treatment. Enrichment analysis showed the upregulation of pathways associated with cell activation in both cell types, with no evidence of KTPB-related cytotoxicity. The findings suggest that KTPB activates the metabolism of skin cells through hormesis without inducing toxicity. Our results provide new insights promoting future research in this field.

Graphical Abstract

1. Introduction

Regular full-body bathing is important for maintaining hygiene and supporting physiological functions of the human body, making it an essential aspect of well-being. There has been a growing demand for bath additives offering supplementary benefits beyond basic cleansing, with various products of this type having been released onto the market. Recent market data showed that the value of bath additives in Japan was 53.6 billion JPY (360 million USD) in 2022 [1], while, in the US, it was 2.12 billion USD in 2024 [2], with both markets experiencing steady growth. These economic trends emphasize the increasingly prominent role of bath additives for health and wellness in daily life in the world. Compounds commonly used in bath additives include inorganic salts, carbon dioxide, medicinal plants, alkaline salts, protein-digesting enzymes, medicinal plants, and fat-soluble components [3]. Each of these compounds is added to formulations of bath additives to achieve particular beneficial effects on cleansing, skin barrier function, blood circulation, and heat retention [3]. In addition, aromatic oils are included in these products to generate a relaxing olfactory effect. Research has indicated the beneficial effects for cognitive function and sleep quality of adding aromatic oils to bath additives [4].
Online databases [5,6] on studies performed internationally contain reports of several studies about bath additives related to psoriasis [7,8], atopic dermatitis [9,10], disordered sleep [4], and osteoarthritis [11]. Meanwhile, in Japan, research on the effects of bath additives on body temperature and blood flow has also been reported [3]. The obtained findings suggest that the compounds present in these additives possess unique effects. However, the study of bath additives is still in its infancy, and the analytical methods used in the studies performed to date are limited, with physiological and subjective indicators obtained by analyzing the body’s surface predominantly being used. However, there is clearly scope for deeper investigation, given that any physiological changes must also be accompanied by changes in the gene expression within cells.
The fundamental molecular mechanism of life is that transcription is regulated and gene expression is altered by the interaction of intracellular molecules due to external stimuli. From this perspective, to clarify the effects of bath additives, analytical methods that can read and interpret comprehensive gene regulation should be used. However, this has not yet been achieved on a global scale.
RNA sequencing (RNA-seq) is a method that comprehensively elucidates gene regulation. Recent advances in RNA-seq technology have led to significant cost reductions, making it a widely accessible tool for researchers in various fields. This technology is frequently employed in studies reported in prominent medical and biological journals to elucidate the underlying mechanisms in cells, the roles played by molecules, and the effects of drugs [12,13,14].
Recently, we used market analyses to select the components that are in high demand among the bath additives currently available on the Japanese market and developed a new bath additive that contains a complex mixture of these components. We named this additive Karada Totonou ProBath (KTPB; Figure 1A), which is a powder-type product. KTPB was designed for athletes and fitness enthusiasts, but it is also expected to be effective for maintaining good health among those with a particular interest in beauty products and among the general public. KTPB was developed as a complex bath additive containing 10 major compounds with expected efficacy as follows: three types of sodium salts (sodium chloride, sodium sulfate, and sodium bicarbonate); five Japanese and Chinese herbal ingredients (Unshu mandarin peel, Angelica acutiloba root extract, Capsicum frutescens fruit extract, ginger root extract, and Cnidium officinalis rhizome extract); and two enzymes (protease and lipase). All ingredients contained in KTPB are listed in Supplemental Table S1.
After developing the bath additive, we looked for ways to verify its effectiveness, referring to previous research. However, as mentioned above, to the best of our knowledge, no previous studies have clarified the effects of any bath additive on the gene expression level. To start to bridge this research gap, this study was planned with the aim of using RNA-seq on an experimental system with cultured skin cells to comprehensively analyze the molecular mechanisms by which the bath additive KTPB exerts its effects. The results of this study not only show the effects of KTPB but also highlight that RNA-seq is a useful analytical technique for future research on bath additives.

2. Materials and Methods

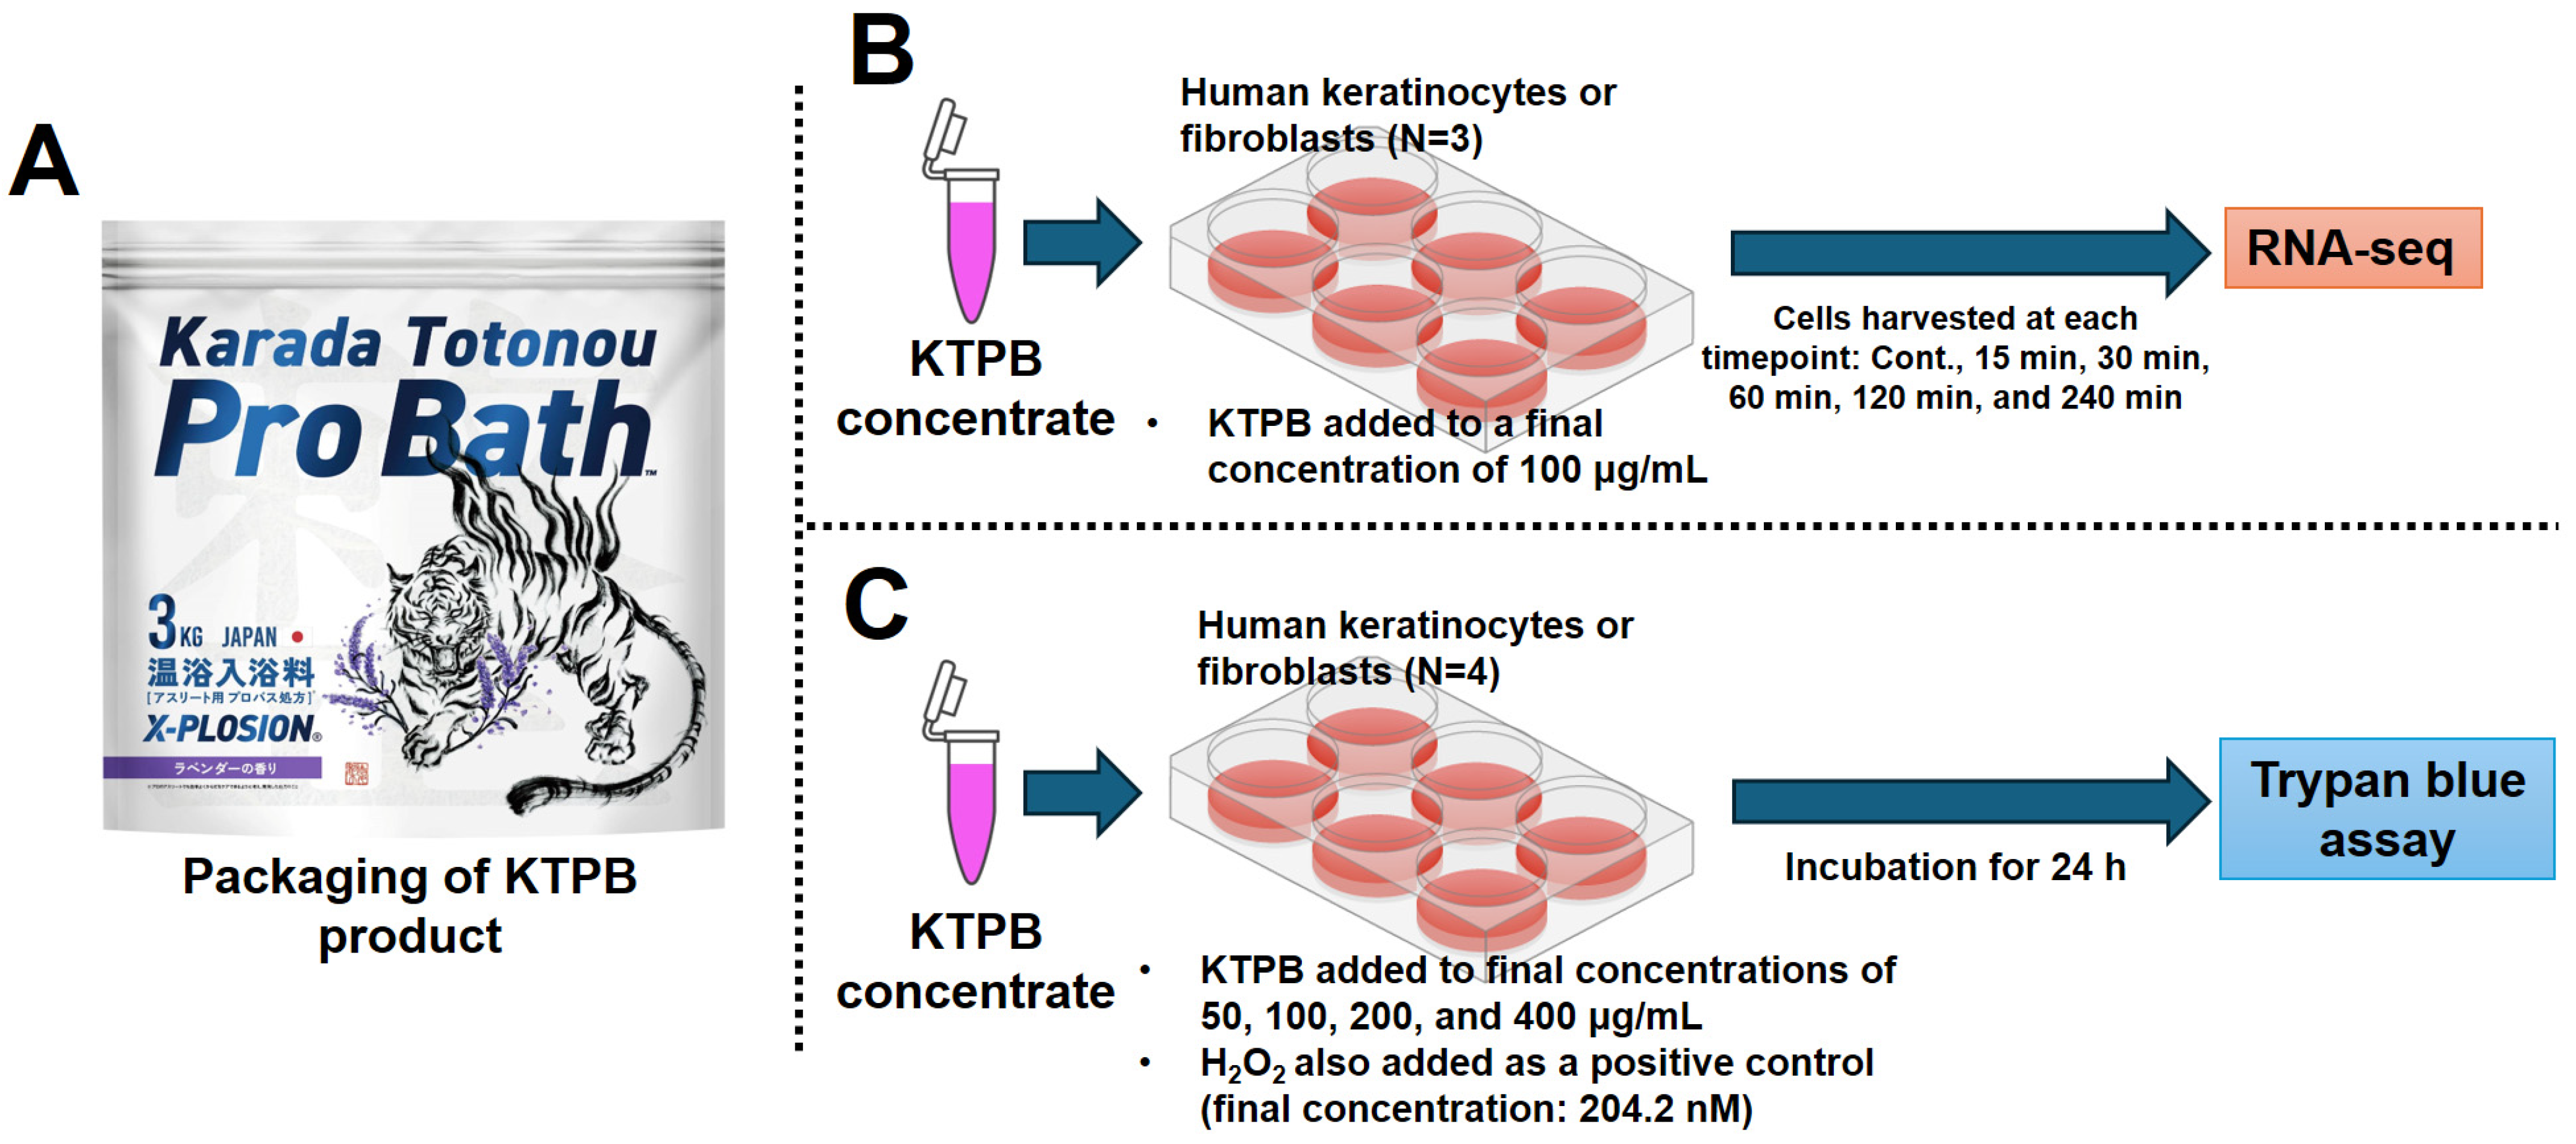
2.1. Cell Culture Experiments

An overview of the experiment is shown in Figure 1. In this study, two cell lines obtained from the Japanese Cell Bank (JCRB Cell Bank) were used. The first is a line of immortalized keratinocytes derived from humans (PSVK1; registration number JCRB1093), while the second is a line of immortalized human fibroblasts (OUMS-36T-7; registration number JCRB1006.7). These two cell lines were selected because keratinocytes and fibroblasts are two of the major cellular components of the skin. The keratinocytes were grown in Keratinocyte Growth Medium 3 (Cat#C-20021; PromoCell GmbH, Heidelberg, Germany) containing antibiotics (streptomycin and penicillin G) in a CO2 incubator maintained at 37 °C. The fibroblasts were grown in DMEM (Cat#C11965500BT; Thermo Fisher Scientific, Waltham, MA, USA) containing the same antibiotics and 10% calf serum (US Cosmic Calf Serum, Cat#SH30072; Cytiva, Tokyo, Japan) on the same incubator. Subsequently, both cell lines underwent experiments involving the addition of KTPB.
The experiment was conducted using a six-well culture plate with each well containing 2 mL of culture medium, with three (RNA-seq) or four (trypan blue assay) replicates per group. For keratinocytes, 5 × 10⁵ cells were seeded into each well, and after 48 h of incubation, including a medium change after 24 h, KTPB was added. For fibroblasts, 2.5 × 10⁵ cells were seeded into each well, and after 24 h of incubation, the same procedure was initiated. The KTPB concentrate for each experiment was made by dissolving the powder in Milli-Q water (Merck KGaA, Darmstadt, Germany) immediately prior to the experiment.
For the RNA-seq analysis, KTPB was added to the medium of both cell lines to a concentration of 100 μg/mL (the volume added was 40.8 μL/well/2 mL of medium). At 15, 30, 60, 120, and 240 min, the medium was aspirated and removed; after which, 900 μL of QIAzol Lysis Reagent (QIAGEN, Venlo, the Netherlands) was applied to lyse the cells. The cell lysate was then subjected to QIAcube Connect (QIAGEN), and RNA was extracted and purified using the spin column method on the equipment. For the control group (Cont.), 40.8 μL of Milli-Q water was added, and RNA was extracted and purified using the same method 120 min later. The final elution volume using Milli-Q water was 30 μL for all samples.
To ascertain whether KTPB exhibits cytotoxic properties, the trypan blue assay was also performed. The same number of cells as in the above experiment were seeded in a six-well plate containing 2 mL of culture medium and incubated for the same length of time. KTPB was then added to each well to achieve final concentrations of 50, 100, 200, and 400 μg/mL. In addition, a group loaded with hydrogen peroxide (H2O2; final concentration of 204.2 μM) was established as a positive control representing a cytotoxic state. After 24 h of incubation, the cells were washed with 2 mL of PBS; after which, 400 μL/well of trypsin solution (2.5 g/L trypsin and 1 mmol/L EDTA solution, Cat#32777-44; Nacalai Tesque, Kyoto, Japan) was added to detach the cells, followed by incubation at 37 °C for 5 min. The cells were well suspended by pipetting and then transferred into a microtube; after which, they were immediately stored on ice until the trypan blue assay was performed. This assay was performed by mixing the staining solution (Trypan Blue Solution, Cat#20577-34; Nacalai) and the cell suspension at a ratio of 1:1 (10 μL:10 μL), and then, this mixture was input into the side chamber (Cat#C10228; Thermo Fisher Scientific). The slide was read using Countess 3 (Thermo Fisher Scientific) to count live and dead cells. After obtaining the data, the number of live cells per well was calculated, and statistical tests were performed.
As a separate experiment, the osmotic pressure of DMEM with KTPB added was measured using OSMO STATION 2 (Cat#OM-6060; ARKRAY, Nakagyo-ku, Kyoto, Japan), and the results were as follows: Cont: 332 mOsm/kg H2O, KTPB 100 μg/mL: 332 mOsm/kg H2O, 200 μg/mL: 335 mOsm/kg H2O, 400 μg/mL: 337 mOsm/kg H2O, and DMEM alone: 339 mOsm/kg H2O. These results excluded the influence of hyperosmotic pressure on the cells caused by salt.

2.2. RNA-Seq

The RNA-seq was carried out by targeting mRNA with a polyA tail. The sequencing was performed based on our previously reported method [15,16,17,18], with some modifications. The RNA solutions of 18 samples [5 timepoints and the Cont. group; n = 3 for each group] of each cell line were tested for integrity using the Agilent RNA 600 Nano Kit (Cat#5067-1511; Agilent Technologies, Santa Clara, CA, USA) on a bioanalyzer (Agilent Technologies). The RNA Integrity Number (RIN) of all the samples was 10, highlighting that the RNAs were suitable for library preparation for the RNA-seq. Libraries were prepared using 1250 ng of total RNA from each sample using the NEBNext Ultra II RNA Library Prep Kit for Illumina and the NEBNext Poly(A) mRNA Magnetic Isolation Module (Cat#E7770S and E7490L; New England Biolabs, Ipswich, MA, USA), in accordance with the manufacturer’s instructions, using LabDroid “Maholo” (Robotic Biology Institute Inc., Tokyo, Japan), which can automate the experiment. The final PCR cycle was 12 for the library preparations. Concentrations and size distributions of the libraries were measured using an Agilent DNA 7500 Kit (Cat#5067-1506; Agilent Technologies) with a bioanalyzer. All libraries were confirmed to be approximately 350 bp and to be suitable for next-generation sequencing (NGS) runs. Libraries were pooled, and the concentrations were adjusted to 4 or 10 nM. These pooled libraries were then denatured and neutralized. Next, the libraries were subjected to a NGS run using NextSeq500/550 v2.5 (75 cycles) Kits (Cat#20024906; Illumina, San Diego, CA, USA) on the NextSeq 500 System (Illumina) for keratinocyte libraries. The library derived from fibroblasts was run on the NovaSeq X Plus System (Illumina) using the NovaSeq X Series 10B Reagent Kit (Illumina). Sequencing was performed using 36 base paired-end reads on the NextSeq 500 System, and 151 base paired-end reads on the NovaSeq X Plus System. After the sequencing run, FASTQ files were exported using bcl2fastq2 Conversion Software v2.20 (Illumina) [19]. Subsequently, the basic NGS run data were checked using CLC Genomics Workbench 24.0 software (QIAGEN, Hilden, Germany). The quality of the reads was assessed. Overall, 98.5% of the reads of the keratinocyte libraries had a PHRED score exceeding 20, reflecting a successful NGS run. Similarly, the corresponding value was 97.6% for the fibroblast libraries. The number of reads was approximately 13.1 to 26.2 million per sample as paired-end reads [15,16,17,18].

2.3. Bioinformatic Analysis

The following bioinformatic analyses were conducted to identify the genes, pathways, and GO terms affected by KTPB. The FASTQ files were mapped to the human genome (GRCh38 in the CLC software) with annotation files (GFF file of GRCh38 in the CLC software), using the tool “RNA-Seq analysis” in the CLC software. Subsequently, BAM (binary alignment and map) files were generated. A principal component analysis (PCA) plot was created using the tool “PCA for RNA-Seq” in the software. The expression of all the genes was then quantified. A statistical differential expression test was performed using the “Differential Expression for RNA-Seq” tool in the software. Subsequently, to extract the differentially expressed genes (DEGs) associated with KTPB loading, a filter was implemented using the following two criteria in the CLC software: the Due to Group (ANOVA-like) test with a Bonferroni-corrected p-value of <0.001 and a max group mean (average of the RPKM value) of >10. A heatmap was created using the expression values in the form of count per million mapped reads (CPM) for the above-mentioned extracted genes in the CLC software. A gene list for each cluster of heatmaps was extracted, and Gene Ontology (GO) and pathway analyses were performed using the web tool Metascape [20]. In these Metascape analyses [20], focus was placed on the top 10 terms/pathways based on the corrected p-values. Text mining was performed using words that were also included among the lower-level terms within the top 10 terms mentioned above, using AI text mining [21] as a free web tool. Cluster dendrograms were generated based on the expression (represented by CPM) of all the genes, using the R programming language (version 4.1.1). In addition, in the cluster dendrograms, the distance threshold was set to 5000 or 4000. The web tool Venny ver. 2.1.0 [22] was used to identify RNAs with dramatically fluctuating expression, using the following criteria: max group mean of 100, log2 fold change of 3, and Bonferroni-corrected p-value of <0.001. A volcano plot was created in the CLC software to visualize the significant genes using Bonferroni-corrected p-value and log2 fold changes. Coverage graphs of the represented samples were also created for each timepoint in both cell lines using the tool “Create Track List” in the CLC software using the BAM files. The expression levels of the significant genes were graphically displayed using the TPM (transcripts per million) values in Microsoft Excel for Microsoft 365 MSO (version 2412). Supplemental Table S2 presents the quantitative expression values, fold changes, and p-values of all the genes and samples in both cell lines obtained by the analysis using the CLC software.

2.4. Statistical Analyses

For the data of the trypan blue assay, statistical analyses were performed using GraphPad Prism software (version 10.2.0). To check the normality of the distributions, all experimental data of the assay were evaluated using the Shapiro–Wilk normality test. Subsequently, a parametric test was used, because the normality test showed that the data were normally distributed for all of the samples. Comparisons of six groups were performed using one-way ANOVA followed by the Tukey–Kramer test as a post hoc test. A p-value less than 0.05 was considered to indicate statistical significance.
For RNA-seq data, the Due to Group (ANOVA-like) test implemented in the CLC software was performed to calculate Bonferroni-corrected p-values. A p-value less than 0.001 was considered to indicate statistical significance.

3. Results

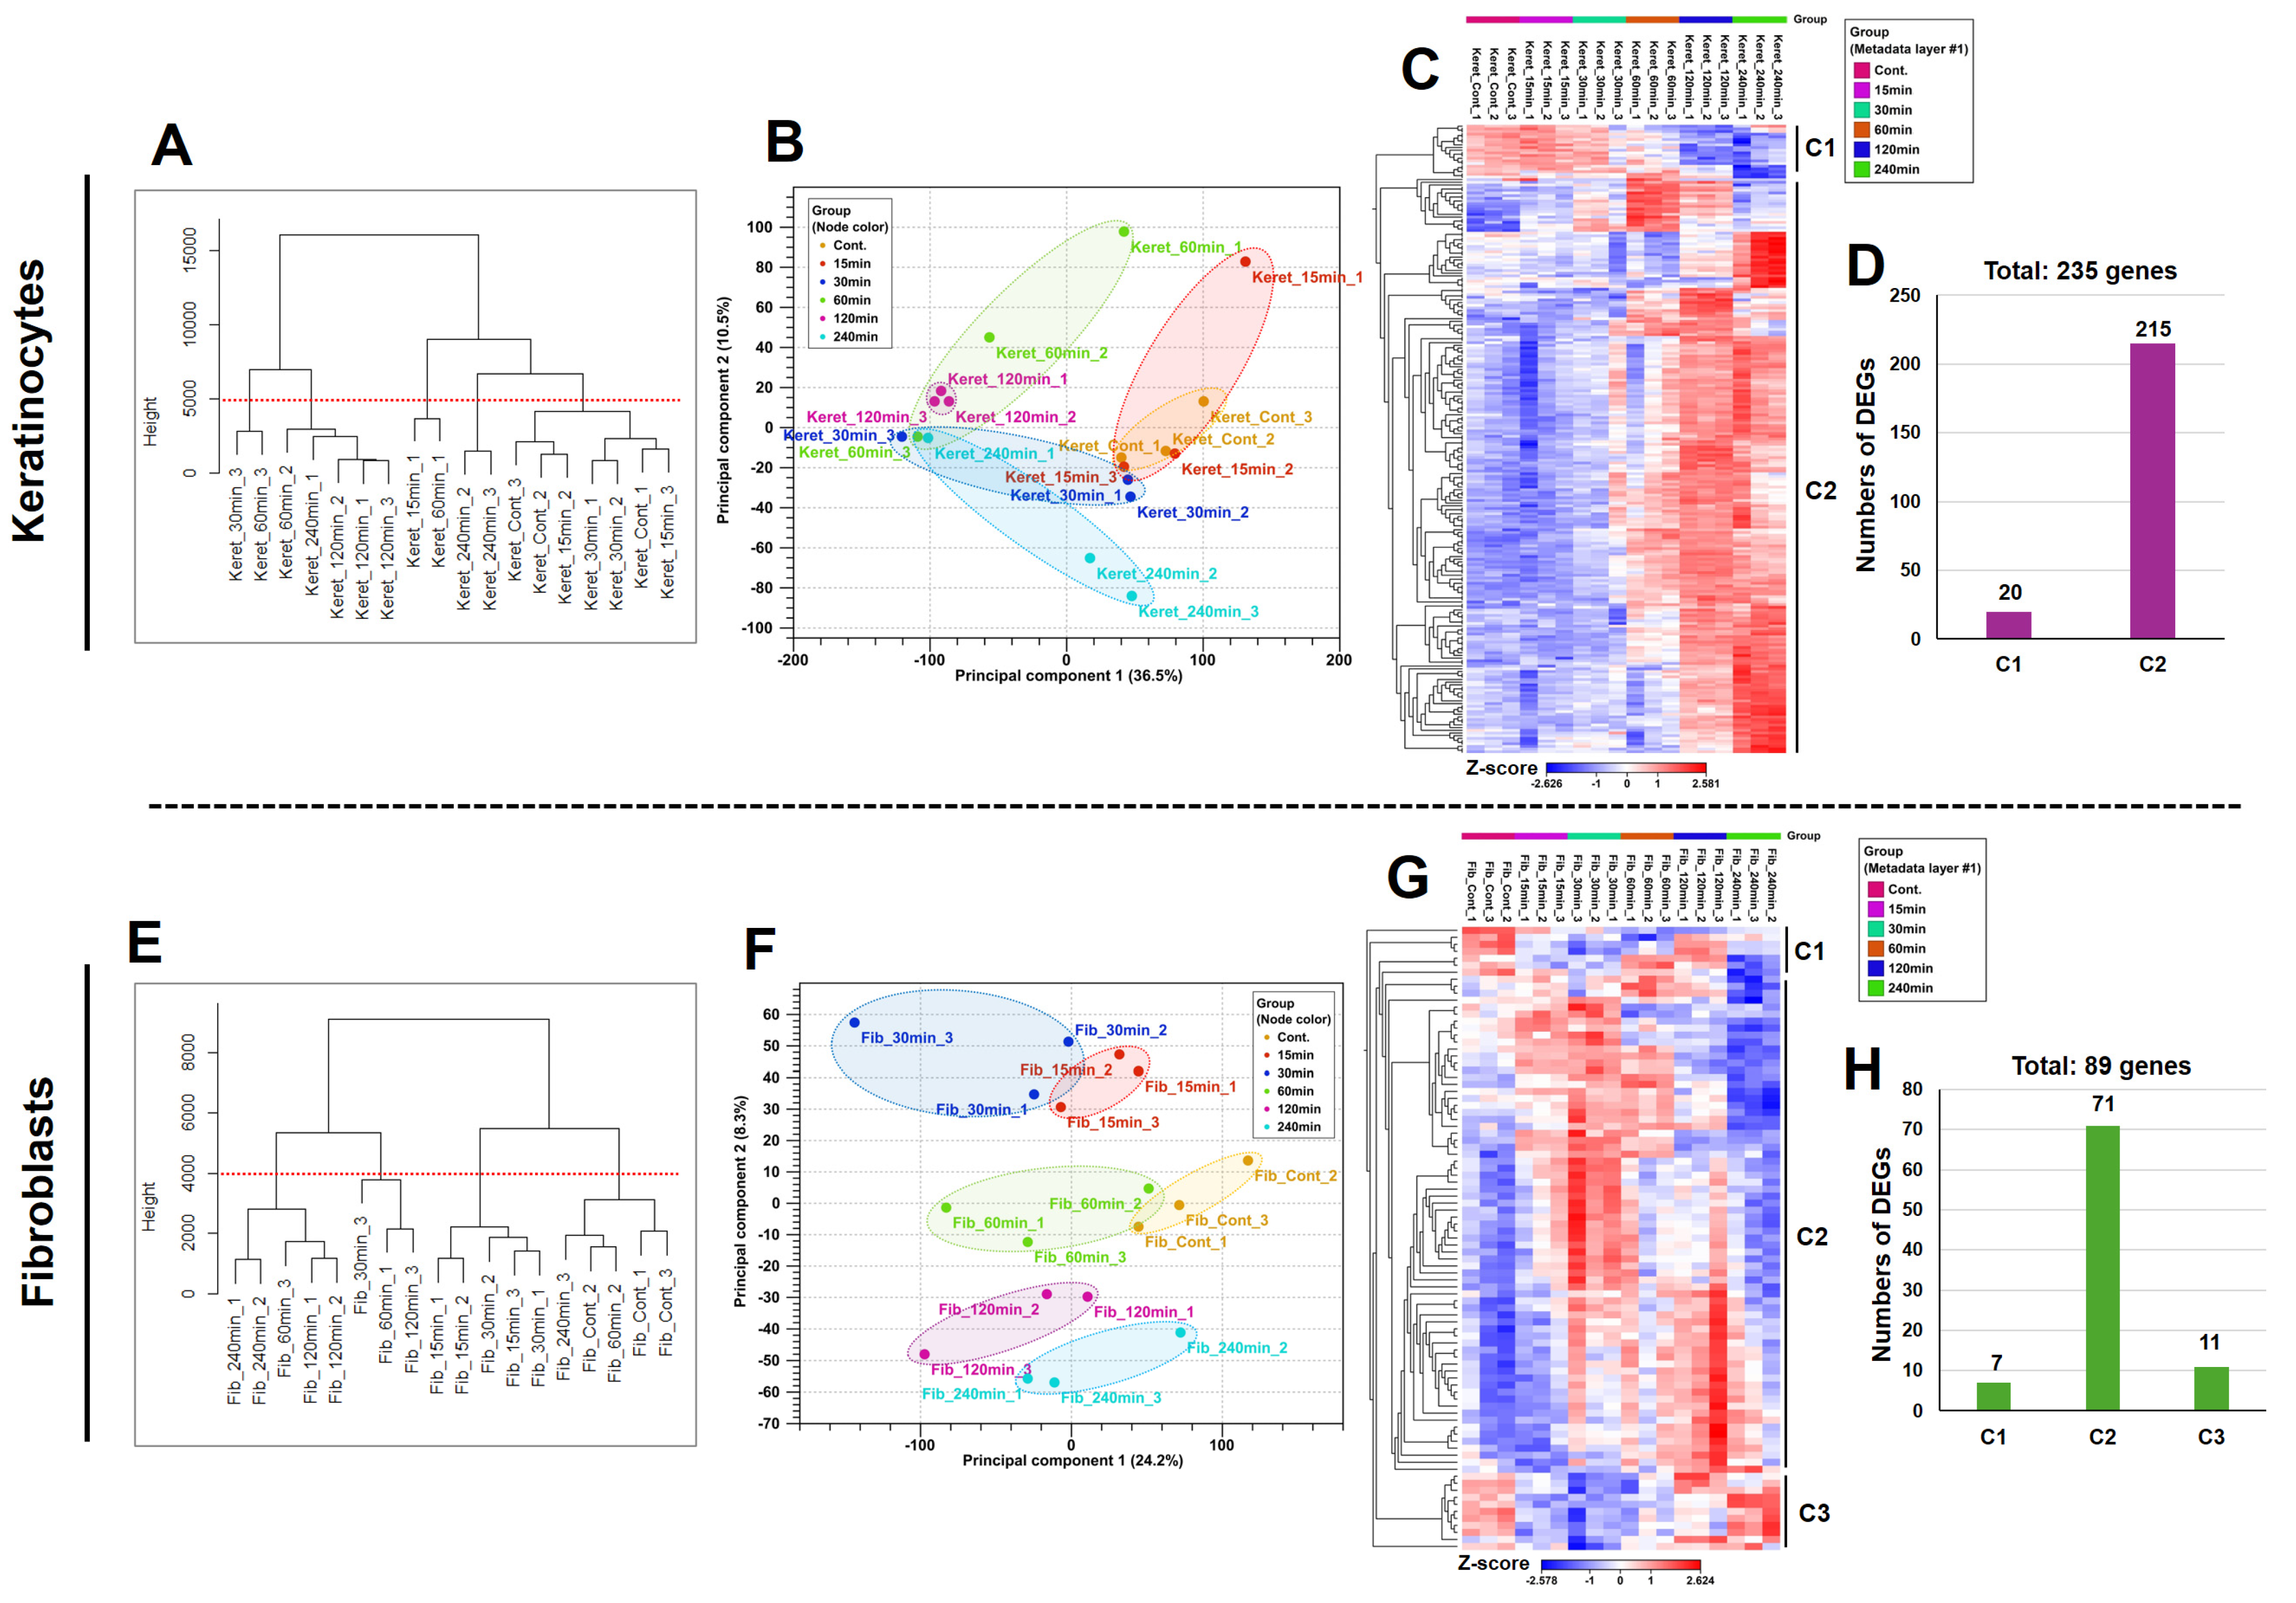
3.1. KTPB Affects the Expression of Many Genes Depending on the Time Course

When the threshold was set at 5000 for height (vertical axis; Euclidean distance), the cluster dendrogram for keratinocytes could be divided into five clusters (Figure 2A). A PCA plot for the keratinocyte cell line showed distinct cluster separation that depended on the time course since KTPB exposure. This was especially pronounced at 60, 120, and 240 min compared with the findings in the Cont. group (Figure 2B). The samples with short Euclidean distances in Figure 2A are also plotted close to each other in the PCA plot in Figure 2B. When the genes with significant change in expression in the same cell line were visualized in a heatmap, clear changes were observed depending on the time elapsed since the addition of the KTPB (Figure 2C). Using that heatmap, it was possible to classify the genes into two clusters (Figure 2C-C1 and C2), one in which gene expression increased and the other in which it decreased with the addition of KTPB. There were many genes (n = 215) which expression increased after the addition of KTPB compared with that in the Cont. group (Figure 2C-C2; Figure 2D-C2), while far fewer genes (n = 20) showed decreased expression (Figure 2C-C1; Figure 2D-C1).
In contrast to the above, when the threshold was set to 4000 for height, the cluster dendrogram for fibroblasts could be divided into four clusters (Figure 2E). The PCA plot for fibroblasts also showed distinct cluster separation that depended on the time course. The difference compared with the Cont. group was pronounced at all timepoints (Figure 2F). The samples with short Euclidean distances in Figure 2E are also plotted close to each other in the PCA plot in Figure 2F. When the genes which expression significantly changed in the fibroblast cell line were visualized in a heatmap, clear changes were observed depending on the time elapsed after the addition of KTPB (Figure 2G). Using that heatmap, it was possible to classify the genes into three clusters (Figure 2G-C1, C2, and C3), one in which gene expression increased with the addition of KTPB and two in which it decreased. Compared with the levels in Cont., there were many genes (n = 71) which expression increased after the addition of KTPB (Figure 2G-C2; Figure 2H-C2), while few genes (n = 7 and 11 in the two clusters) showed decreased expression (Figure 2G-C1 and C3; Figure 2H-C1 and C3).
These findings suggest that the results of each bioinformatic analysis were consistent, and KTPB has physiological activities that change gene expression for the two cell lines.

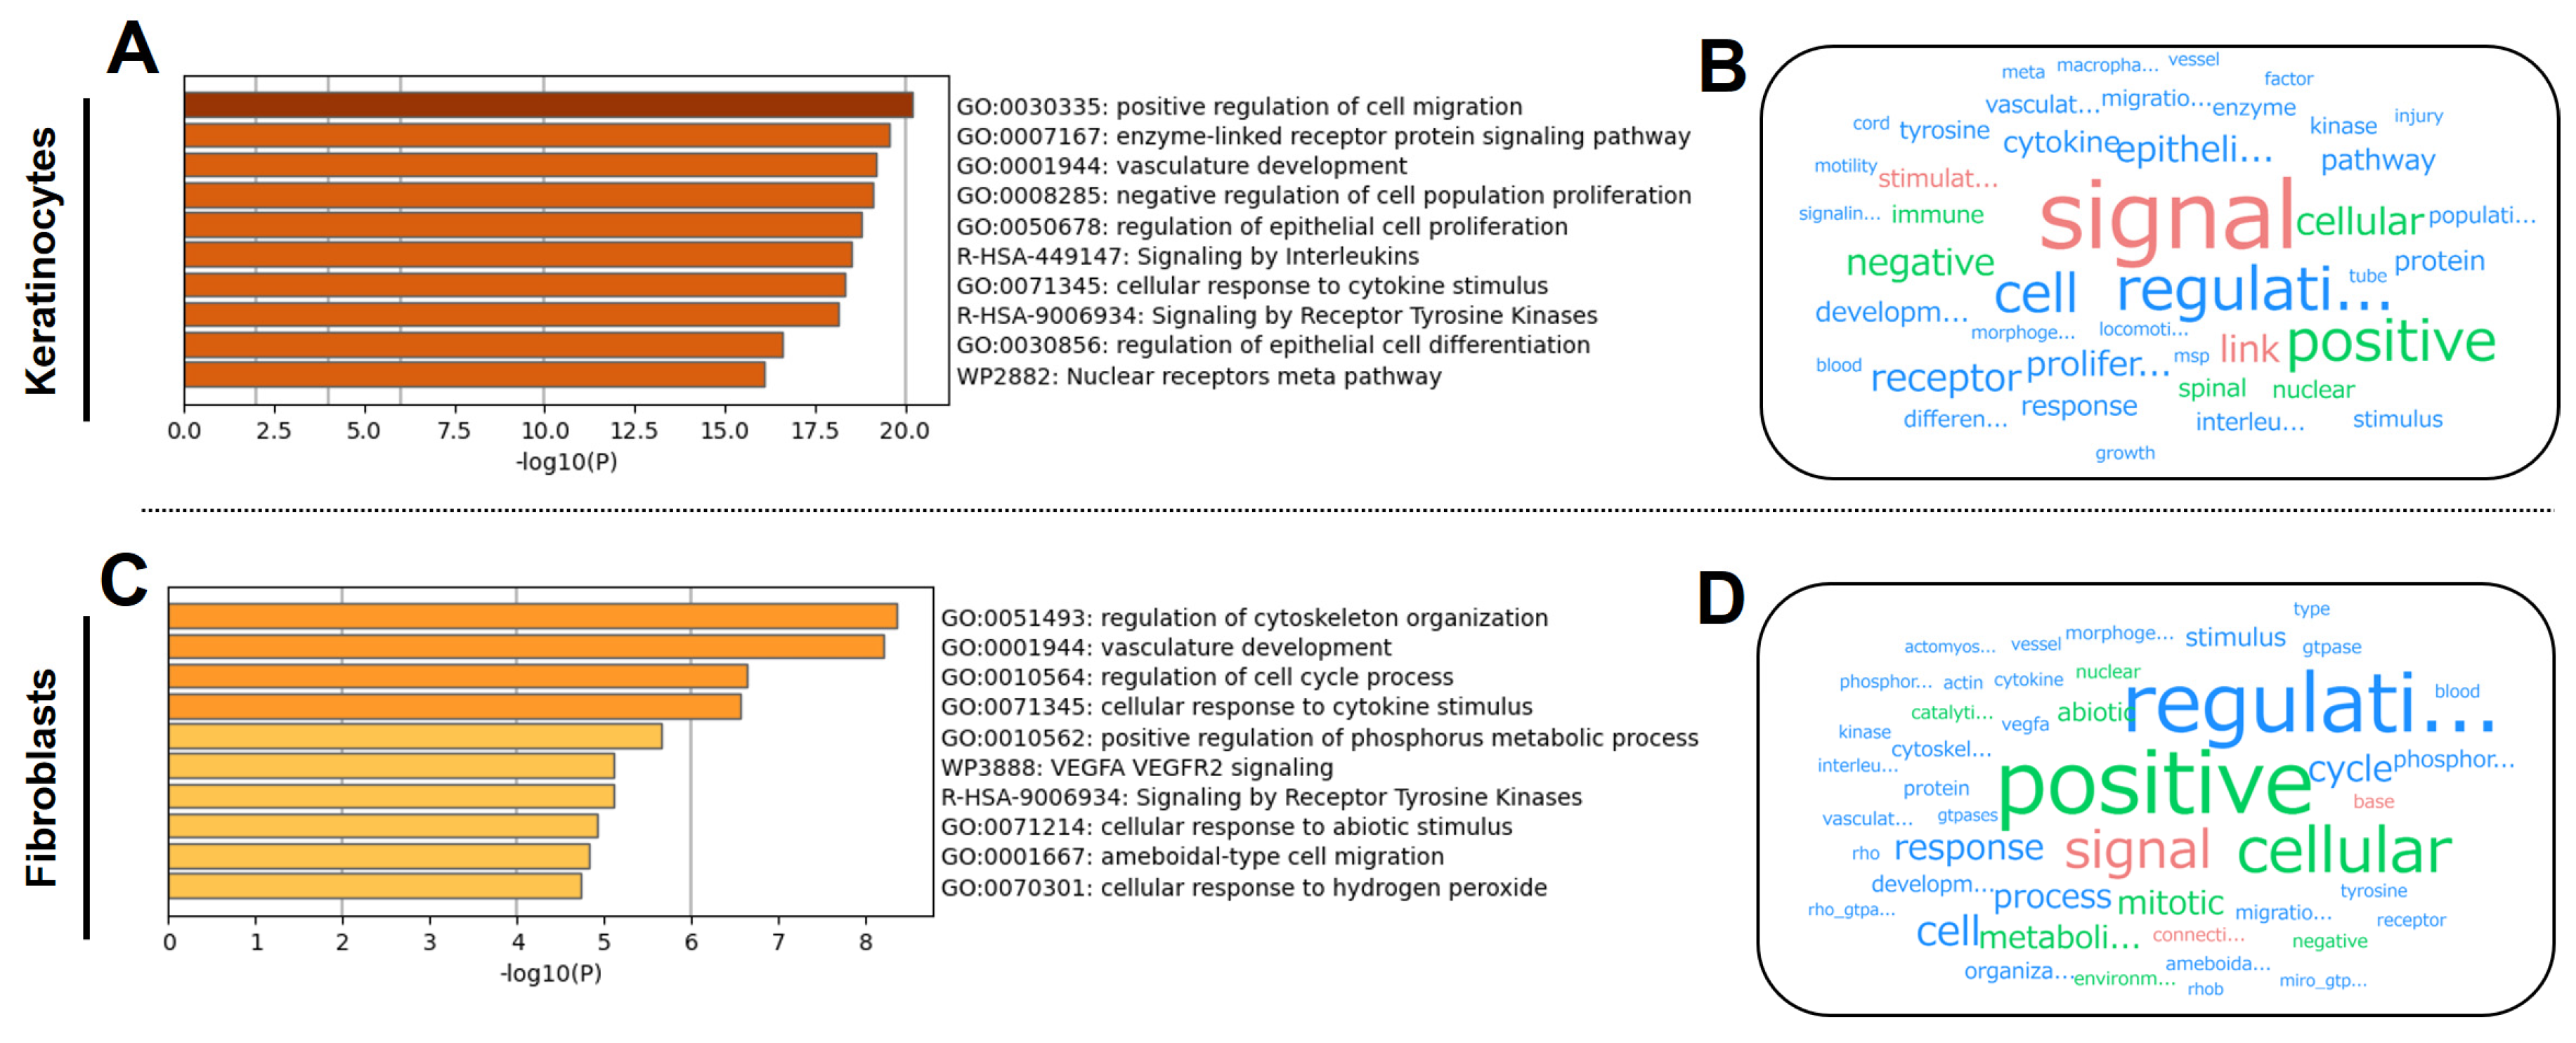
3.2. KTPB Affects Cell Activation

Among the genes which expression in keratinocytes was significantly changed by KTPB, a list of 215 upregulated genes was used for pathway and GO analyses in Metascape [20]. These analyses revealed that these upregulated genes are especially associated with cell migration, signal cascades, and vascular development, representing cell activation (Figure 3A). Furthermore, text mining revealed the emergence of the words “signal” and “regulation” (Figure 3B).
Meanwhile, for the genes with significant KTPB-induced changes in expression in fibroblasts, a list of 71 upregulated genes was used for analysis in the same way. This revealed that these genes are especially associated with cytoskeleton organization, vascular development, and cell cycle process, again representing cell activation (Figure 3C). Furthermore, from the text mining, the word “cellular” emerged, along with “signal” and “regulation” again (Figure 3B). These results suggested that KTPB increases the metabolic activity of these cells.

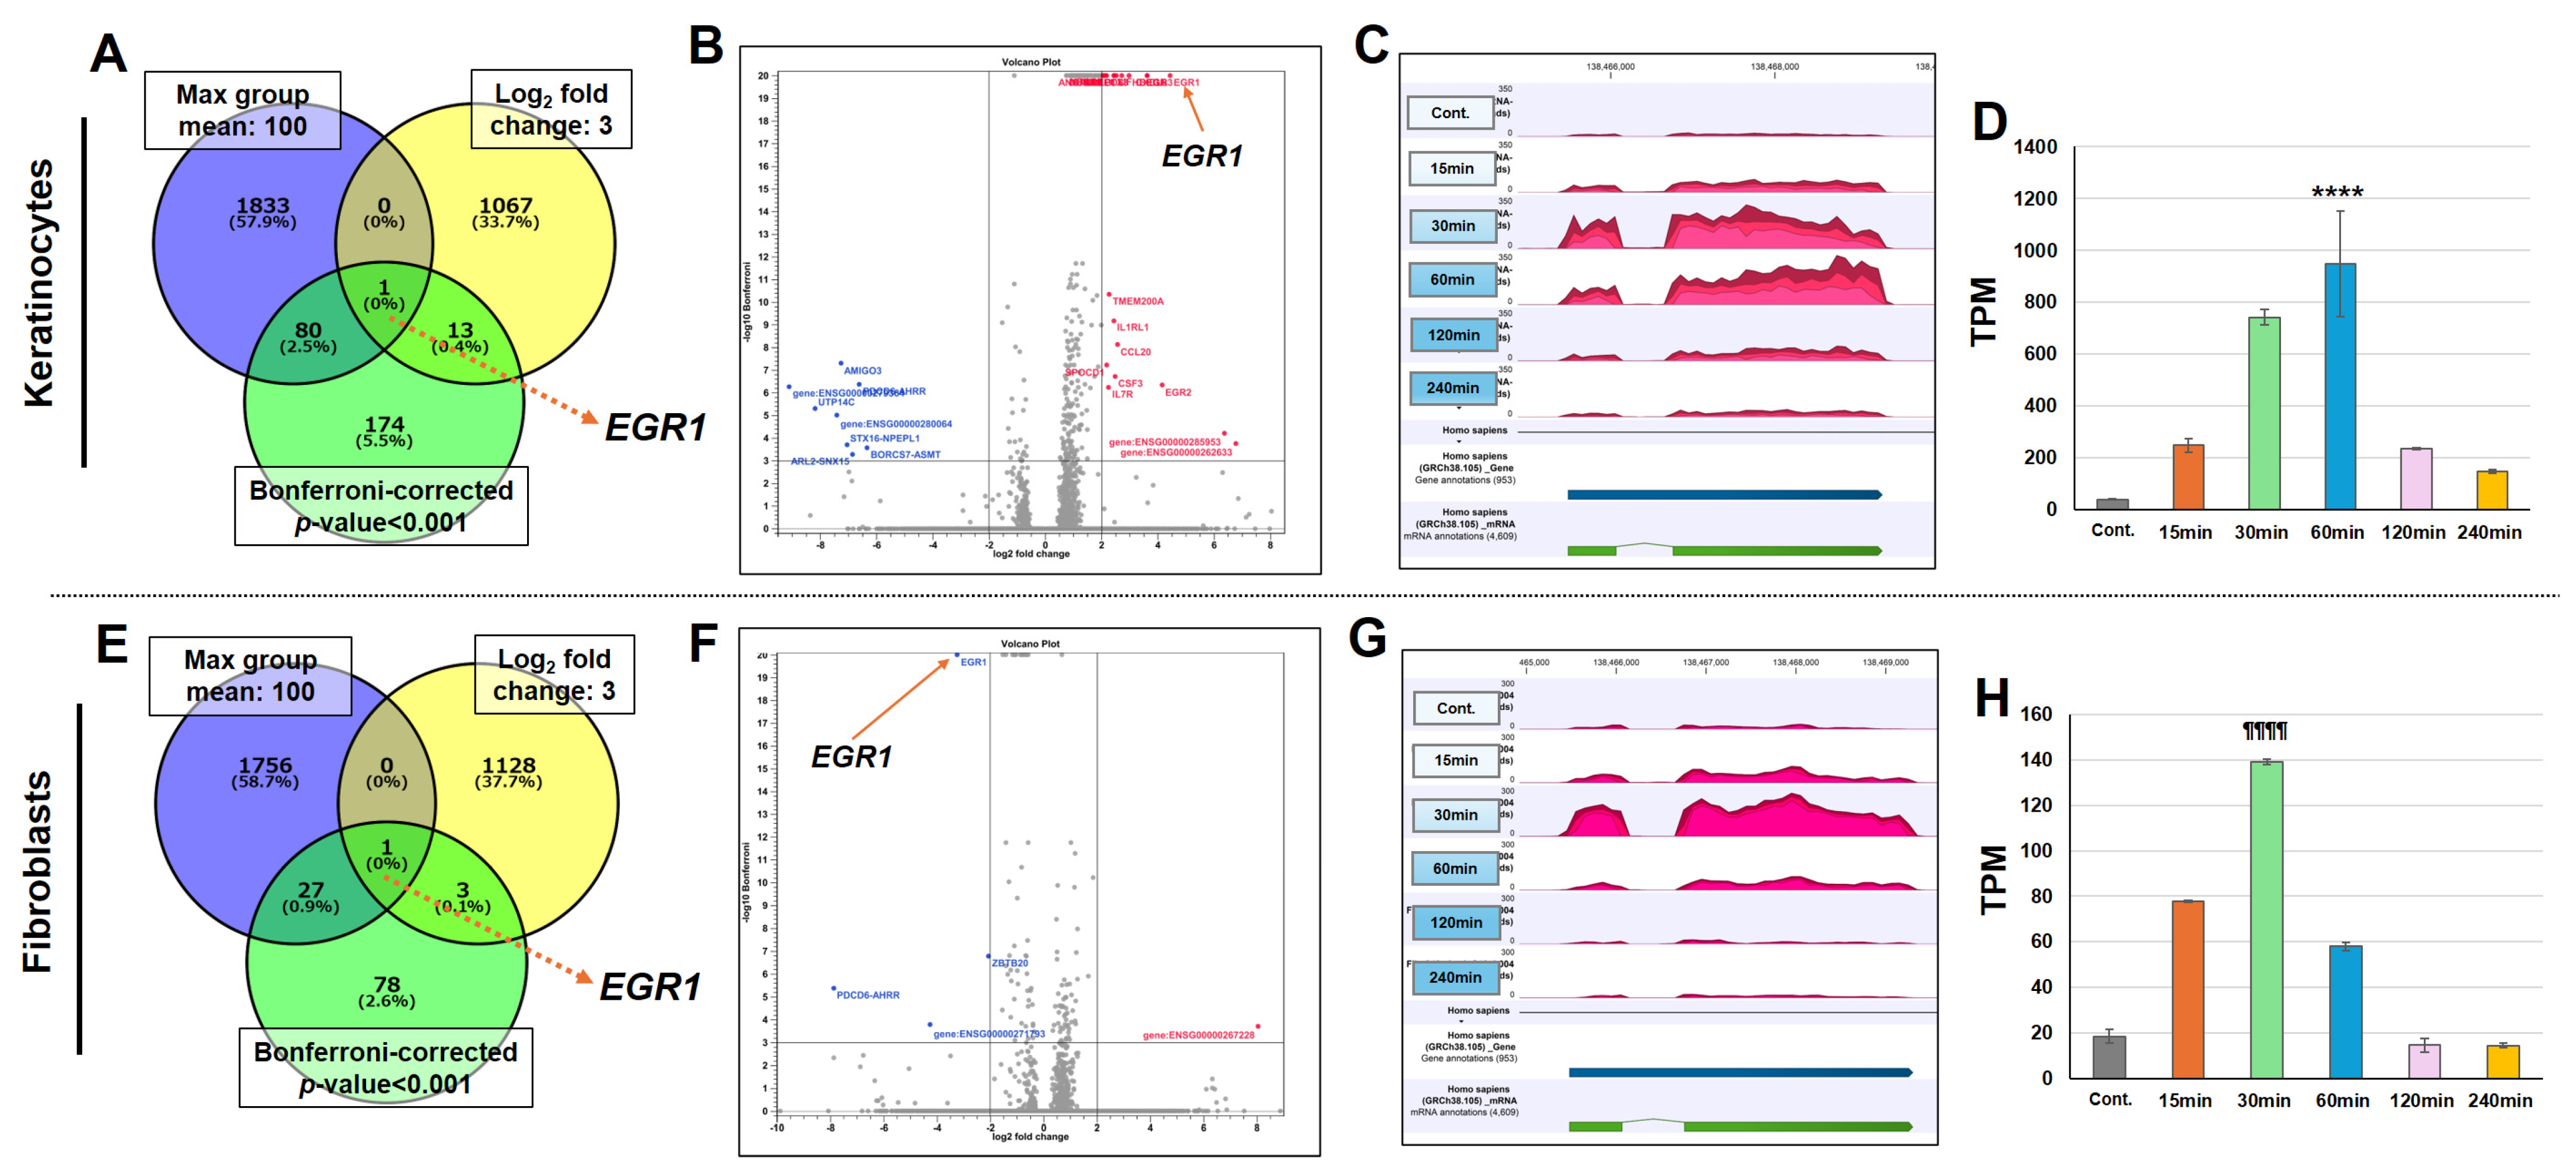
3.3. KTPB Significantly Increases EGR1 Gene Expression

Venn diagram analysis was performed to identify genes with high expression levels and high fold changes relative to those in the absence of KTPB in each cell type. EGR1 (early growth response protein1) emerged as one particularly highly expressed gene in the keratinocytes (Figure 4A). When EGR1 was visualized using a volcano plot, it was confirmed to have high fold change and a very small p-value in these cells (Figure 4B). In addition, the coverage graph that visualized the BAM file showed time-dependent fluctuations in its expression (Figure 4C). The TPM value, reflecting the expression of EGR1 quantitatively, was extracted, and a bar graph was created. The results revealed that, after the addition of KTPB, the TPM value of EGR1 increased over time and then tended to decrease back to the baseline (Figure 4D). Similar results were also obtained in the fibroblasts (Figure 4E–H). In terms of the timing of peak expression, EGR1 expression reached its maximum at 60 min; at which point, it had increased by 23.0-fold on average compared to that in Cont. in the keratinocytes (Figure 4C). In the fibroblasts, it reached its maximum at 30 min; at which point, it had increased by 7.5-fold on average compared to that in Cont. (Figure 4F).
These results suggest that KTPB strongly affects the expression of EGR1 in a manner dependent on the amount of time since its addition.

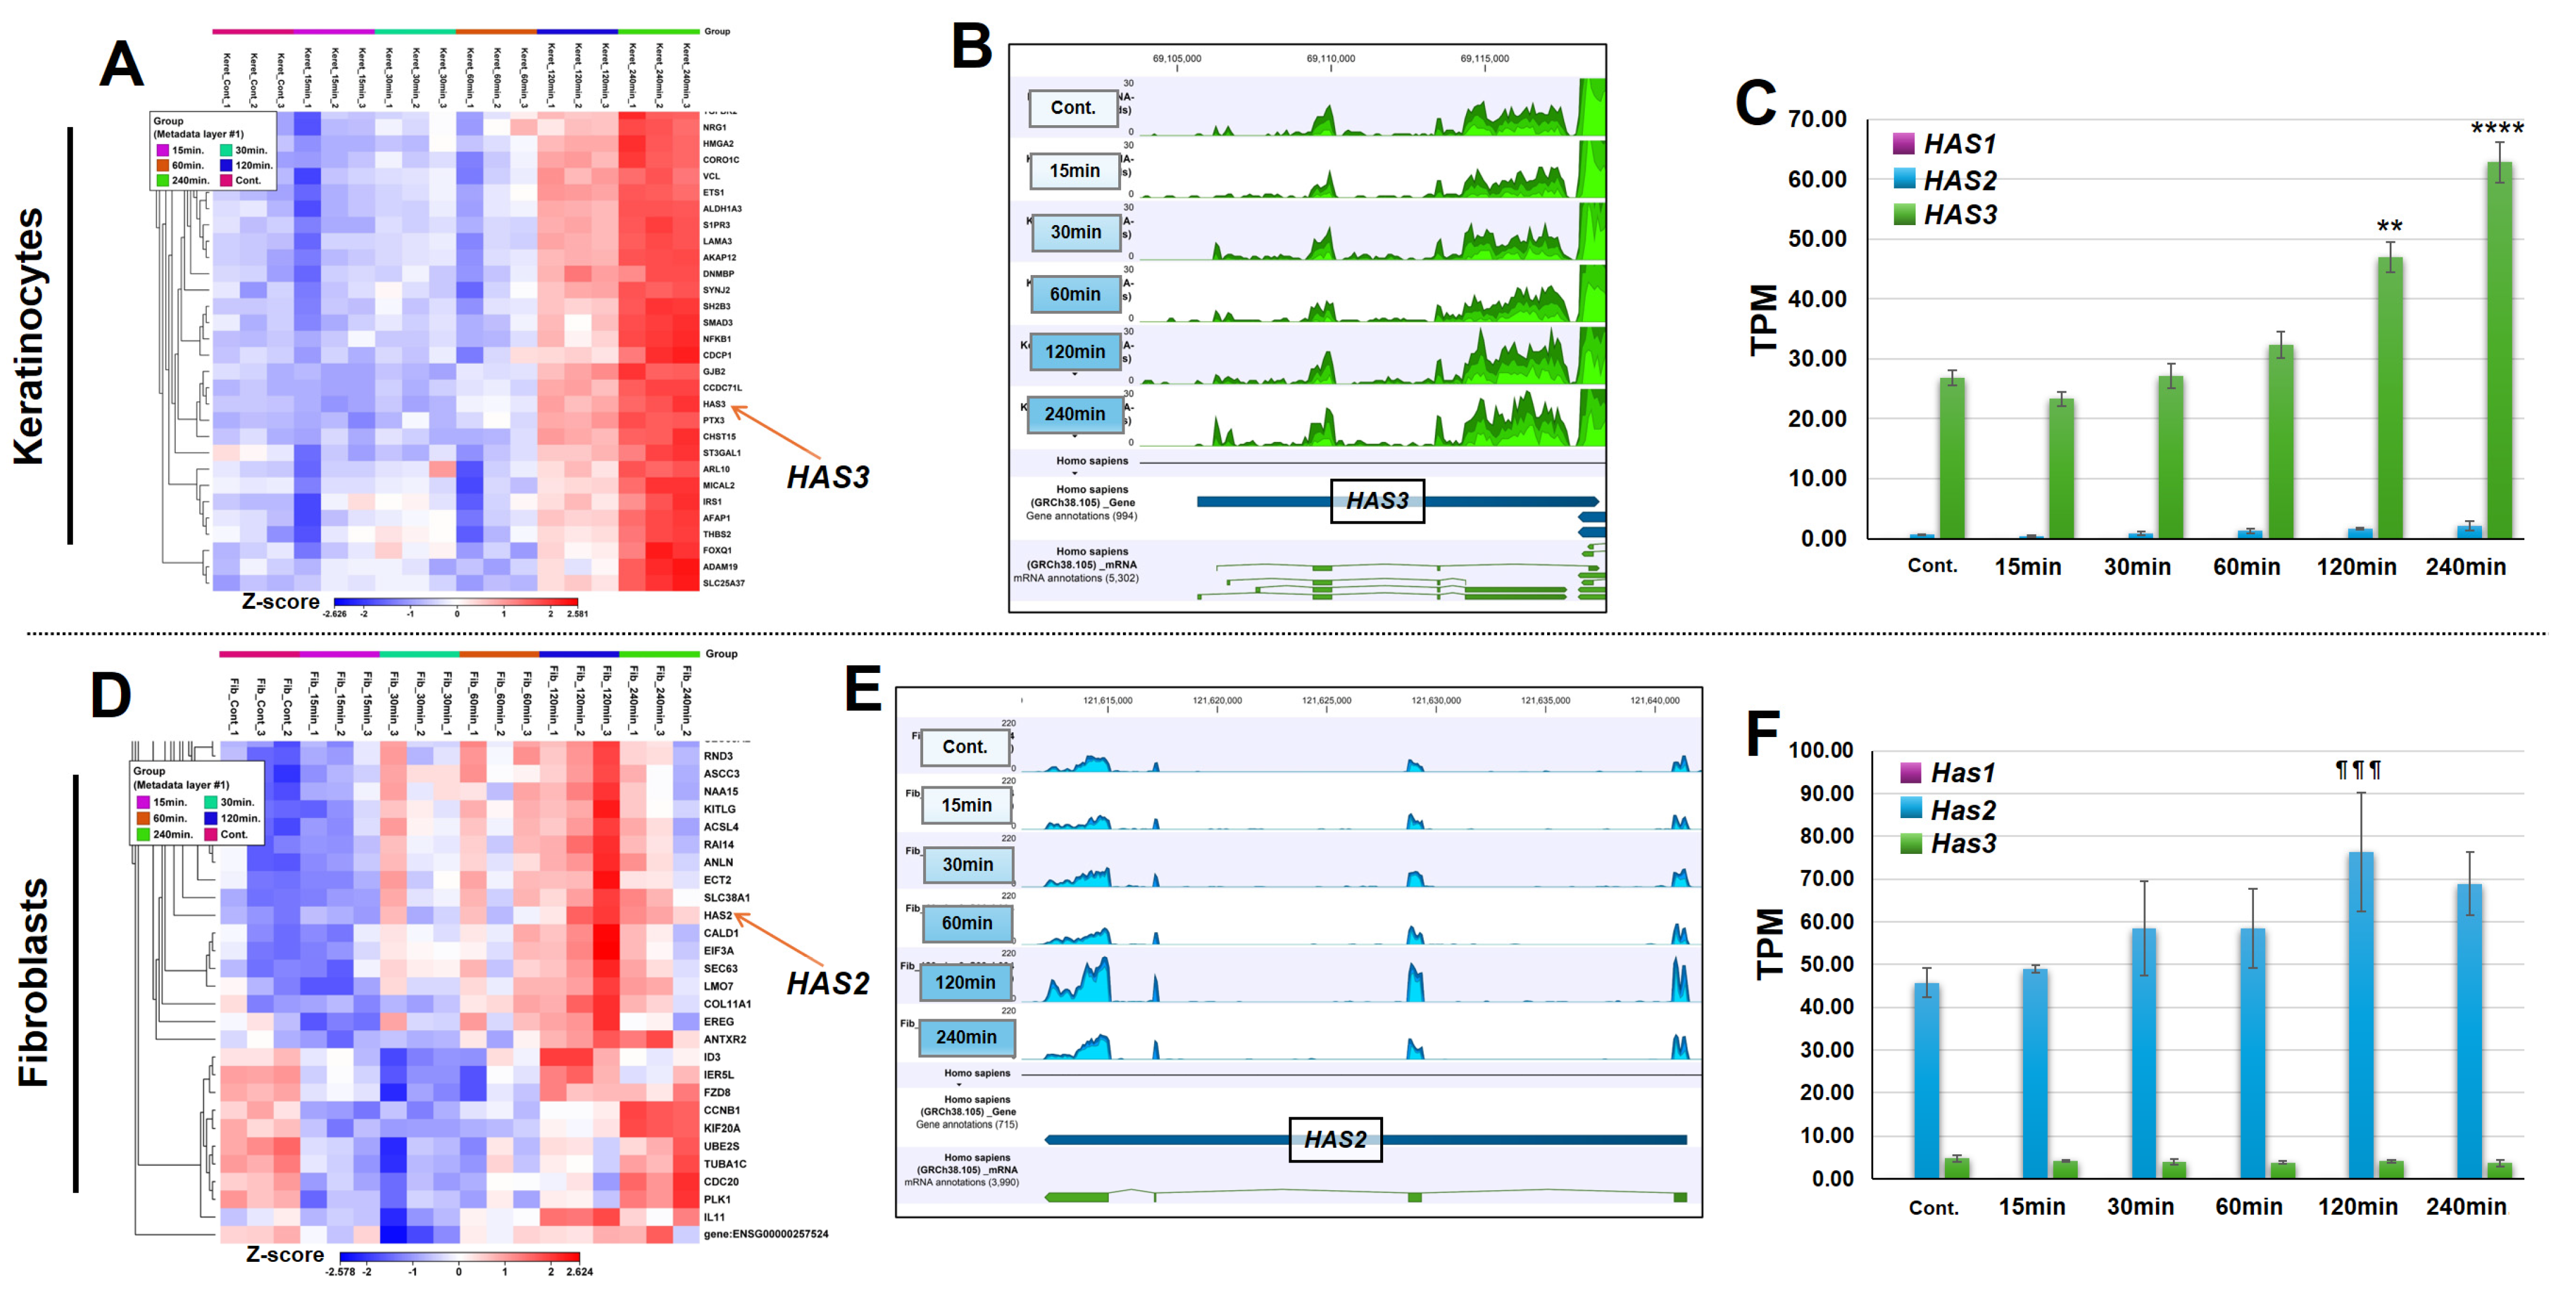
3.4. KTPB Increases the Expression of HASs Without Increasing the Expression of HYLAs

During our heatmap analysis, HAS3 (hyaluronan synthase 3) was identified to demonstrate significant changes in expression in the keratinocytes exposed to KTPB (Figure 5A). The coverage graph showed the same fluctuations as the heatmap, as reflected in the color changes (Figure 5B). Then, the TPM values were extracted for each HAS isoform (HAS1, -2, and -3) to create a bar graph of them. The results confirmed that the HAS3 isoform was significantly expressed in the keratinocytes (Figure 5C). It was also observed that its expression increased over time after adding KTPB (Figure 5C), peaking at 240 min. Meanwhile, for the fibroblasts, significant changes in HAS2 could be confirmed in the heatmap (Figure 5D). The coverage graph showed the same fluctuations as the heatmap, as reflected in the color changes (Figure 5E). In the bar graph, it was observed that the expression of the gene increased over time after the addition of KTPB, peaked at 120 min, and showed a decreasing trend at 240 min (Figure 5F). Meanwhile, there were no changes in the expression of HYLA 14 (hyaluronidases), which degrade HASs, in either cell type at any timepoint (Supplemental Table S2; search for HYLAs in both cells). These results suggest that KTPB increases the expression of HASs without increasing the expression of HYLAs.

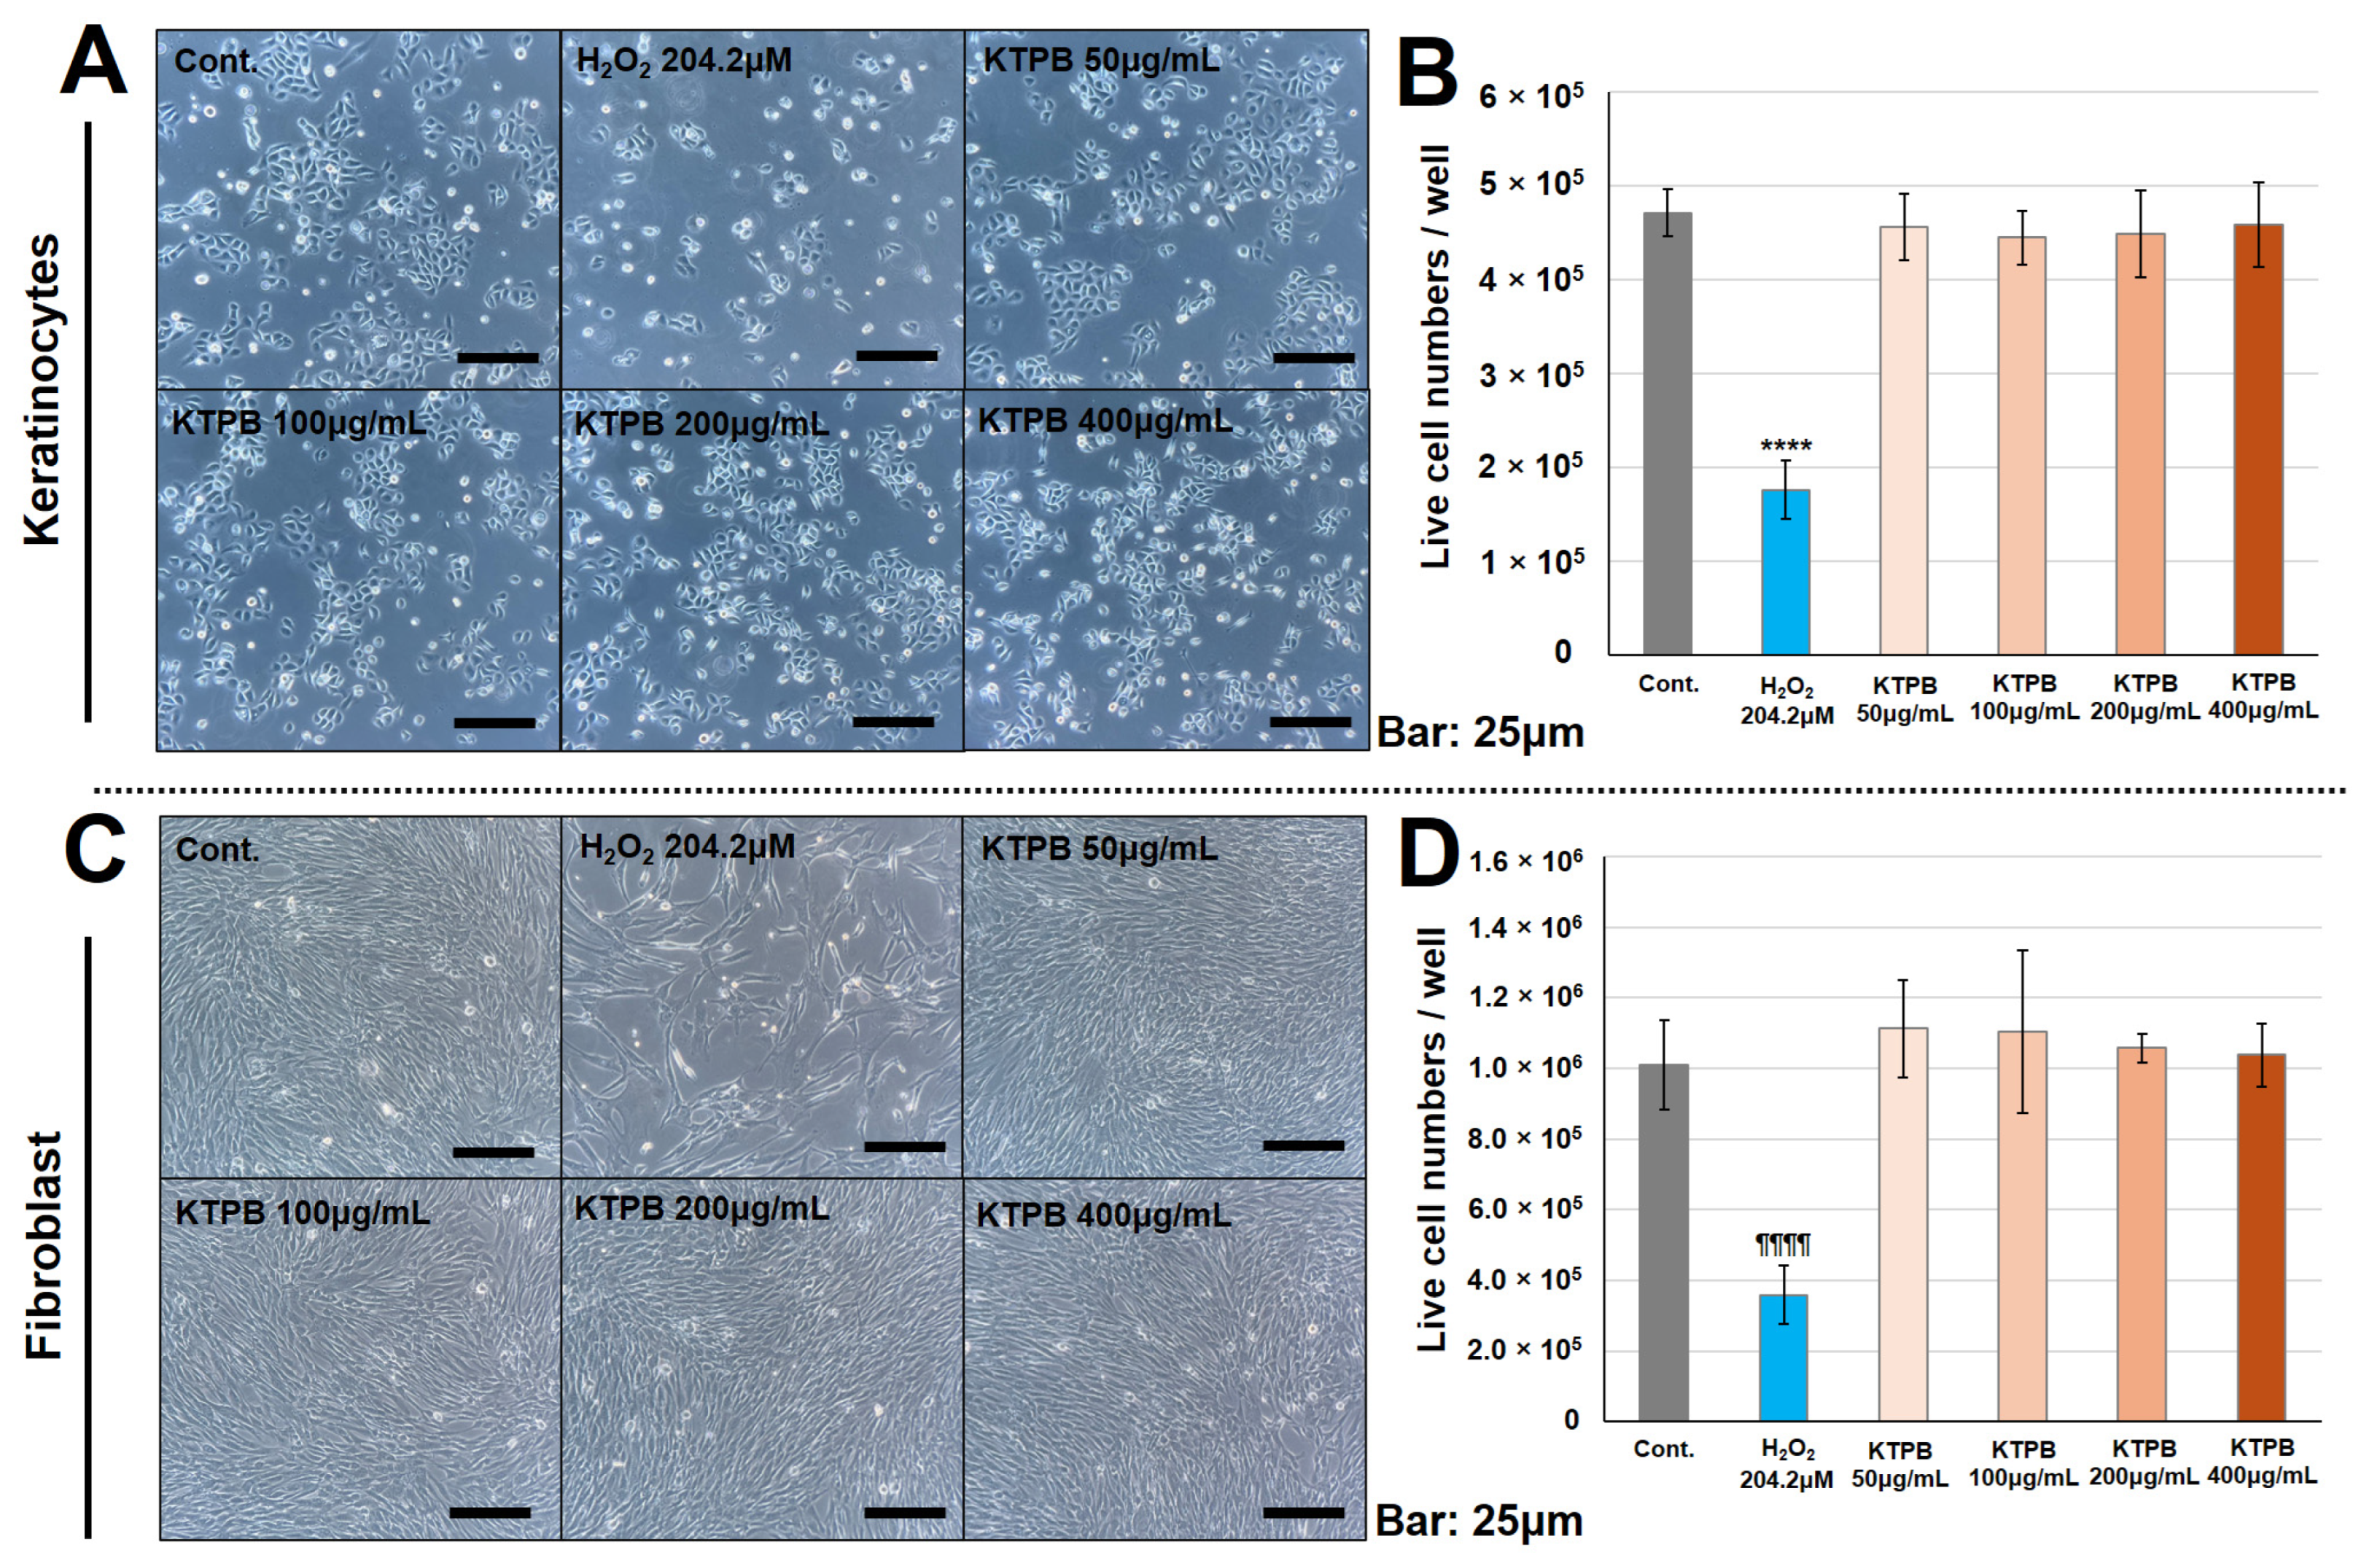
3.5. KTPB Did Not Result in Cytotoxicity

KTPB was added to the cells at final concentrations of 50–400 μg/mL. Twenty-four hours later, cytotoxicity was evaluated under a microscope using the trypan blue assay. In the microscopic observations of the keratinocytes, no changes in morphology or cell density were observed, regardless of the concentration of KTPB added (Figure 6A). In contrast, when H2O2 as a positive control for toxicity was added, a decrease in cell density and morphological changes was observed (Figure 6A). Similarly, in the trypan blue assay, no significant differences between the KTPB-added and Cont. groups were observed, and no toxicity was observed, while H2O2 successfully induced toxicity (Figure 6B). Similar results were also obtained for the fibroblasts (Figure 6C,D). These results suggest that KTPB does not exert any cytotoxicity at any of the concentrations applied in this study.

4. Discussion

To confirm the physiological effects of the bath additive KTPB, this study was the first in the world to apply RNA-seq to KTPB-treated and untreated human keratinocytes and fibroblasts, as major components of the skin. The results confirmed the occurrence of changes in the expression of many genes in both cell types between 15 and 240 min after the KTPB addition. Most of these changes involved increases in expression with the addition of KTPB. Furthermore, enriched GO terms and pathways in both cell types indicated the upregulation of angiogenesis, cell proliferation, and cell signaling by KTPB. Meanwhile, no particularly significant trends were found for the genes with decreased expression. In addition, no cytotoxicity was observed. These results suggested that KTPB had the effect of activating cell metabolism of skin cells through hormesis. In further analysis, when a search was performed for genes showing particularly prominent and significant changes in expression, EGR1 was identified, while the expression of HASs was also significantly increased. The results prove the utility of RNA-seq and the accompanying bioinformatic analysis for studying bath additives.
The wound healing process of skin and other tissues is typically divided into four phases: hemostasis, inflammation, proliferation, and remodeling [23,24,25]. These phases overlap to some extent and progress in a coordinated manner [24,25,26]. After the hemostasis phase, the inflammatory phase begins, accompanied by the infiltration of immune system cells and the removal of tissue containing dead cells [23,27]. The proliferation phase involves the proliferation of vascular endothelial cells, fibroblasts, and keratinocytes to form granulation tissue [27,28,29]. Capillaries are essential for transporting the oxygen and nutrients needed for cell growth, and angiogenesis occurs through the paracrine or autocrine secretion of VEGF from keratinocytes, fibroblasts, and vascular endothelial cells [29]. At the same time, in the proliferation phase, the surviving keratinocytes around the damaged tissue proliferate and infiltrate using the granulation tissue as a scaffold and contribute to re-epithelialization [23,26,27,28,30]. Thus, angiogenesis in the proliferative phase plays an important role in the normal wound healing process. In fact, reports have described that the application of recombinant VEGF to mouse skin wounds promotes their healing [31]. A report has also been published describing that the application of VEGF to skin wounds in diabetic model mice accelerated cell proliferation and halved the number of days required for healing [32]. Another report described that the application of growth differentiation factor 11 (GDF11) to mouse skin wounds promoted their healing by activating the HIF-1α-VEGF/SDF-1α pathway [33].
This experiment identified the gene EGR1 as showing significant fluctuations in expression in a short period of time following the addition of KTPB. This gene encodes a transcription factor which expression is rapidly induced by various growth factors, chemicals, and mechanical stimuli [34,35]. This transcription factor is essential for the wound healing process, and it has been shown that healing is impaired in EGR1 null mice [36]. In addition, research on wound healing using mouse and cell models has suggested that activation of the TGFb1-EGR1 pathway contributes to the promotion of wound healing [37]. In this study, the GO and pathway analyses suggested that terms related to angiogenesis (related to VEGF signaling), cell migration, and the cell cycle were significantly enriched in both cell types in association with KTPB exposure. In keratinocytes, the addition of KTPB also increased the expression of VEGFA (Supplemental Table S2; search for VEGFA). Furthermore, even when a high concentration of KTPB was added, no cytotoxicity was observed. Considering the results of the above previous reports and our findings, it is possible that KTPB acts as a type of cytokine and facilitates the wound healing process without toxicity via hormesis.
Players of sports that involve substantial contact, such as soccer, rugby, basketball, and martial arts, regularly experience skin abrasions, so they may benefit from the use of KTPB in the care of such injuries. Although KTPB was developed for athletes, its uses are not limited to them. For example, in developed countries where the aging of society is increasingly progressing, chronic wounds that are prone to occur in the elderly and diabetic patients are a major healthcare issue [38,39]. Such wounds are characterized by features such as impairments of angiogenesis and epithelial regeneration [38,39]. Given the reduction in quality of life associated with such wounds, the skin benefits of KTPB may be particularly valuable. In summary, KTPB may be useful as a daily skincare product for the elderly.
Glucocorticoids (GCs) are hormones that are involved in the stress response [40] and exert immunosuppressive and anti-inflammatory effects [41]. Various studies have shown that an excess of GCs inhibits wound healing [42,43,44], which is thought to occur via the suppression of keratinocyte proliferation and migration [43,45], although the inhibition of endothelial progenitor cell (EPC) proliferation by glucocorticoids has also been reported to be involved [46]. Various studies have confirmed that the blood and saliva levels of GCs increase in athletes when they perform high-intensity exercise [47,48,49]. In addition, it has been shown that long periods of high-intensity training or competition can increase the risk of upper respiratory tract infections [50,51,52], which is thought to be due to immunosuppression caused by excessive cortisol secretion [50,53]. Taken together, athletes who engage in high-intensity training for long periods of time are at risk of developing an immunosuppressed state, and if they suffer a skin abrasion during sporting activity, its healing may be delayed. On the other hand, this study showed that KTPB may promote wound healing. Given this range of issues facing athletes and KTPB’s promotion of the wound healing process, KTPB could be recommended for use as part of the daily skincare routine by athletes who engage in high-intensity training. It can also be recommended not only to athletes but also to the general public, given the stresses encountered in modern life.
The cells subjected to RNA-seq in this study were exposed to a concentration of KTPB of 100 μg/mL, which is approximately one-fourth to one-half of the concentration recommended for actual use by humans as a bath additive. In experiments using cultured cells, the cells are directly exposed to the compound. On the other hand, the outermost layer of human skin is the stratum corneum, which has a barrier function [54] and is structured in such a way that it is difficult for high molecules to penetrate. Therefore, it was decided that such a concentration would be appropriate, considering the penetration efficiency into actual skin cells. In addition, to investigate the toxicity of KTPB, various concentrations were set, ranging from 50 to 400 μg/mL. The results revealed the absence of cytotoxicity at all concentrations. Therefore, it was suggested that KTPB is extremely safe as a bath additive.
One study attempted to determine whether compounds added to human skin as cosmetics reach the dermis. The results confirmed that all of the compounds studied reached the dermis, although the degree of delivery differed depending on the solvent [55]. Similarly, a recent study performed at a Japanese company revealed that the active ingredients in cosmetics can penetrate to the dermis, as determined by mass spectrometry [56]. These studies clearly confirm the penetration of compounds from the epidermis to the dermis. However, it is well known that electrically charged compounds do not readily penetrate the dermis. Conversely, uncharged hydrophobic compounds tend to easily penetrate the epidermis. KTPB contains not only hydrophilic compounds but also numerous hydrophobic (lipophilic) compounds extracted from Japanese and Chinese herbal ingredients. Therefore, any hydrophobic compound in KTPB can act directly on normal epidermal and dermal cells. In addition, athletes participating in contact sports often suffer from abrasions. Most abrasions are minor wounds, primarily limited to destruction of the epidermal structure [57]. In cases of significant external force, damage to the dermis may also occur [57]. These mechanisms indicate a breakdown in epidermal barrier function, increasing the likelihood of bacterial infection [57]. It is therefore concluded that both the hydrophobic and hydrophilic components of KTPB can directly reach the cells in areas of abrasion. In summary, this in vitro model experiment using cultured cells may reflect the effects of KTPB on normal or damaged skin.
In this study, surprisingly, KTPB significantly increased the expression of HASs in both cell types, while there was no change in the expression of genes encoding hyaluronidases (HYLAs). In particular, there were notable increases in HAS3 expression on the keratinocytes. This strongly suggests that KTPB increased hyaluronic acid (hyaluronan; HA) secretion. HASs are proteins embedded in the cell membrane that catalyze the polymerization reaction of HA and promote its synthesis [58,59]. HA is a representative core ingredient in the fields of cosmetic surgery and cosmetics and is used in a variety of beauty treatments and cosmetics. A decrease in HA in the skin is strongly associated with skin aging. As humans age, the amount of HA in the skin’s extracellular matrix (ECM) decreases, and the skin’s ability to retain moisture weakens. This causes a decrease in skin elasticity and microvascular support, leading to dryness and sagging of the skin [60,61]. In fact, research by a Japanese cosmetics company has shown that wrinkling and sagging are negatively correlated with the amount of HA in the skin [62]. HA-based beauty treatments and cosmetics can reverse such trends and exhibit rejuvenating effects [61,63,64]. Furthermore, HA also plays an important role in the wound healing process. During wound healing and tissue repair, HA is actively produced, providing a framework for the growth of blood vessels and fibroblasts, leading to normal healing [58]. In addition, it has been reported that HA-based treatment of wounds promotes their healing [61]. When we consider the results of previous studies and our findings together, it is possible that KTPB exerts antiaging and wound healing-promoting effects by enhancing the secretion of hyaluronic acid in human skin cells.
This study has several limitations. As mentioned in the Introduction, there are 10 active ingredients in KTPB. All of these have been used previously in bath additives, and we extracted them using market analyses. In this study, we did not test each of these components individually, so we have not determined which components affect HAS gene expression and cell metabolism. In addition, it has not been determined whether they are cell-permeable or have specific receptors. Furthermore, this study focused on RNA expression and did not analyze protein expression. Therefore, future studies should investigate the expression of HAS proteins and the secretion of HA in detail. In addition, the physiological activity of each compound contained in KTPB on cells should be analyzed in detail. This could provide further scientific evidence for bath additives. The results obtained in this study are limited to tests on cultured cells and may not be reproducible in actual, living skin. Therefore, future studies are needed to confirm whether KTPB is effective in human or animal skin.

5. Conclusions

In this study, we used RNA-seq to reveal the effects of KTPB, a newly developed bath additive, in an in vitro assay using keratinocytes and fibroblasts. The results showed that KTPB activates cell metabolism without causing toxicity and increases HAS expression. This work also showed that RNA-seq analysis is useful in the study of the physiological effects of bath additives. The results of this study suggest that KTPB is effective as a daily skincare product for athletes, as well as the general public at any age. In addition, our novel analytical approach using both skin model cells and RNA-seq is expected to greatly advance the study of bath additives in the future.

Supplementary Materials

The following supporting information can be downloaded at https://www.mdpi.com/article/10.3390/cosmetics12030098/s1: Table S1: All the ingredients in KTPB; Table S2: Expression browser for all genes in both cells.

Author Contributions

Conceptualization, N.O., K.D.M.N., and T.S.; methodology, N.O., K.D.M.N., and T.S.; validation, N.O., K.D.M.N., and T.S.; formal analysis, N.O., K.D.M.N., J.W., and T.S.; investigation, N.O., K.D.M.N., and T.S.; data curation, N.O., Y.K., J.W., and T.S.; writing—original draft preparation, N.O. and T.S.; writing—review and editing, N.O., K.D.M.N., Y.K., J.W., and T.S.; supervision, T.S.; project administration, N.O. and T.S.; funding acquisition, N.O. and T.S. All authors have read and agreed to the published version of the manuscript.

Funding

This research was conducted with research funds from the University of Tsukuba (2024; academic year) and expenses from X-PLOSION LLC.

Institutional Review Board Statement

Not applicable.

Informed Consent Statement

Not applicable.

Data Availability Statement

The raw data that formed the basis for Figure 2, Figure 3, Figure 4 and Figure 5 is included in the paper and supplementary materials (Table S2: Expression browser for all genes in both cells). Currently, our research team has performed a secondary analysis on the raw NGS data (FASTQ, BAM, and BCL files). There is a possibility of new discoveries in the future, so we cannot release the data to ensure priority. However, if individual researchers clearly state the purpose of their use, we may distribute the data as needed. In addition, we can distribute KTPB free of charge to researchers who wish to replicate the experiments. Also, KTPB can be freely purchased from various websites in Japan, depending on the researcher’s intention. Further inquiries can be directed at the corresponding author.

Acknowledgments

We would like to express our gratitude to IWAI Chemicals Company Ltd. and Nikkyo Technos Co., Ltd. for performing the work quickly and accurately.

Conflicts of Interest

The first author, Otani, is the chief executive officer (CEO) of X-PLOSION LLC (Yokohama, Japan). This research was conducted to clarify the effects of a bath additive developed by X-PLOSION LLC, using expenses from the company. The other authors in this study declare that they have no conflicts of interest, as they received no funding from X-PLOSION LLC.

References

  1. Bath Salt Market. Available online: https://www.hpc-news.co.jp/media/feature/a1246 (accessed on 17 February 2025).
  2. Bath Salts Market by Product Type. Available online: https://www.360iresearch.com/library/intelligence/bath-salts (accessed on 12 May 2025).
  3. Watanabe, S.; Ishizawa, T.; Tsunakawa, M. The Current State and Prospects of Bath Additive. Jpn. J. Biometeorol. 2020, 56, 121–131. [Google Scholar] [CrossRef]
  4. Kouzuki, M.; Kitao, S.; Kaju, T.; Urakami, K. Evaluation of the Effect of Aroma Oil as a Bath Salt on Cognitive Function. Psychogeriatrics 2020, 20, 163–171. [Google Scholar] [CrossRef] [PubMed]
  5. Web of Science. Available online: https://www.webofscience.com/wos/woscc/basic-search (accessed on 17 February 2025).
  6. PubMed. Available online: https://pubmed.ncbi.nlm.nih.gov/ (accessed on 17 February 2025).
  7. Peinemann, F.; Harari, M.; Peternel, S.; Chan, T.; Chan, D.; Labeit, A.M.; Gambichler, T. Indoor Balneophototherapy for Chronic Plaque Psoriasis: Abridged Cochrane Review. Dermatol. Ther. 2021, 34, e14588. [Google Scholar] [CrossRef] [PubMed]
  8. Gambichler, T.; Rapp, S.; Senger, E.; Altmeyer, P.; Hoffmann, K. Balneophototherapy of Psoriasis: Highly Concentrated Salt Water versus Tap Water—A Randomized, One-Blind, Right/Left Comparative Study. Photodermatol. Photoimmunol. Photomed. 2001, 17, 22–25. [Google Scholar] [CrossRef]
  9. Pagliaro, M.; Pecoraro, L.; Stefani, C.; Pieropan, S.; Piacentini, G.; Pietrobelli, A. Bathing in Atopic Dermatitis in Pediatric Age: Why, How and When. Pediatr. Rep. 2024, 16, 57–68. [Google Scholar] [CrossRef]
  10. Gittler, J.K.; Wang, J.F.; Orlow, S.J. Bathing and Associated Treatments in Atopic Dermatitis. Am. J. Clin. Dermatol. 2017, 18, 45–57. [Google Scholar] [CrossRef]
  11. Sherman, G.; Zeller, L.; Avriel, A.; Friger, M.; Harari, M.; Sukenik, S. Intermittent Balneotherapy at the Dead Sea Area for Patients with Knee Osteoarthritis. Isr. Med. Assoc. J. 2009, 11, 88–93. [Google Scholar]
  12. Sekiya, M.; Kainoh, K.; Sugasawa, T.; Yoshino, R.; Hirokawa, T.; Tokiwa, H.; Nakano, S.; Nagatoishi, S.; Tsumoto, K.; Takeuchi, Y.; et al. The Transcriptional Corepressor CtBP2 Serves as a Metabolite Sensor Orchestrating Hepatic Glucose and Lipid Homeostasis. Nat. Commun. 2021, 12, 6315. [Google Scholar] [CrossRef]
  13. Ronchi, C.; Haider, S.; Brisken, C. EMBER Creates a Unified Space for Independent Breast Cancer Transcriptomic Datasets Enabling Precision Oncology. NPJ Breast Cancer 2024, 10, 56. [Google Scholar] [CrossRef]
  14. Watson, B.R.; Paul, B.; Rahman, R.U.; Amir-Zilberstein, L.; Segerstolpe, Å.; Epstein, E.T.; Murphy, S.; Geistlinger, L.; Lee, T.; Shih, A.; et al. Spatial Transcriptomics of Healthy and Fibrotic Human Liver at Single-Cell Resolution. Nat. Commun. 2025, 16, 319. [Google Scholar] [CrossRef]
  15. Sugasawa, T.; Hirokawa, A.; Otani, N.; Kanki, Y.; Nguyen, K.D.; Takemasa, T.; Watanabe, K.; Takeuchi, Y.; Yahagi, N.; Takahashi, Y. Detection Method for Gene Doping in a Mouse Model Expressing Human Erythropoietin from Adeno-Associated Virus Vector-9. Genes 2024, 15, 709. [Google Scholar] [CrossRef] [PubMed]
  16. Sugasawa, T.; Kanki, Y.; Komine, R.; Watanabe, K.; Takekoshi, K. Identification of RNA Markers in Red Blood Cells for Doping Control in Autologous Blood Transfusion. Genes 2022, 13, 1255. [Google Scholar] [CrossRef] [PubMed]
  17. Sugasawa, T.; Komine, R.; Manevich, L.; Tamai, S.; Takekoshi, K.; Kanki, Y. Gene Expression Profile Provides Novel Insights of Fasting-Refeeding Response in Zebrafish Skeletal Muscle. Nutrients 2022, 14, 2239. [Google Scholar] [CrossRef] [PubMed]
  18. Sugasawa, T.; Nakano, T.; Fujita, S.-I.; Matsumoto, Y.; Ishihara, G.; Aoki, K.; Yanazawa, K.; Ono, S.; Tamai, S.; Manevich, L.; et al. Proof of Gene Doping in a Mouse Model with a Human Erythropoietin Gene Transferred Using an Adenoviral Vector. Genes 2021, 12, 1249. [Google Scholar] [CrossRef]
  19. bcl2fastq2 Conversion Software v2.20. Available online: https://jp.support.illumina.com/sequencing/sequencing_software/bcl2fastq-conversion-software.htmL (accessed on 17 February 2025).
  20. Zhou, Y.; Zhou, B.; Pache, L.; Chang, M.; Khodabakhshi, A.H.; Tanaseichuk, O.; Benner, C.; Chanda, S.K. Metascape Provides a Biologist-Oriented Resource for the Analysis of Systems-Level Datasets. Nat. Commun. 2019, 10, 1523. [Google Scholar] [CrossRef] [PubMed]
  21. AI Text Mining by User Local. Available online: https://textmining.userlocal.jp/ (accessed on 17 February 2025).
  22. Venny ver.2.1.0. Available online: https://bioinfogp.cnb.csic.es/tools/venny/ (accessed on 17 February 2025).
  23. Younesi, F.S.; Miller, A.E.; Barker, T.H.; Rossi, F.M.V.; Hinz, B. Fibroblast and Myofibroblast Activation in Normal Tissue Repair and Fibrosis. Nat. Rev. Mol. Cell Biol. 2024, 25, 617–638. [Google Scholar] [CrossRef]
  24. Akhtari, N.; Ahmadi, M.; Kiani Doust Vaghe, Y.; Asadian, E.; Behzad, S.; Vatanpour, H.; Ghorbani-Bidkorpeh, F. Natural Agents as Wound-Healing Promoters. Inflammopharmacology 2024, 32, 101–125. [Google Scholar] [CrossRef]
  25. Zomer, H.D.; Trentin, A.G. Skin Wound Healing in Humans and Mice: Challenges in Translational Research. J. Dermatol. Sci. 2018, 90, 3–12. [Google Scholar] [CrossRef]
  26. Peña, O.A.; Martin, P. Cellular and Molecular Mechanisms of Skin Wound Healing. Nat. Rev. Mol. Cell Biol. 2024, 25, 599–616. [Google Scholar] [CrossRef]
  27. Gurtner, G.C.; Werner, S.; Barrandon, Y.; Longaker, M.T. Wound Repair and Regeneration. Nature 2008, 453, 314–321. [Google Scholar] [CrossRef]
  28. Hegde, A.; Ananthan, A.S.; Kashyap, C.; Ghosh, S. Wound Healing by Keratinocytes: A Cytoskeletal Perspective. J. Indian Inst. Sci. 2021, 101, 73–80. [Google Scholar] [CrossRef]
  29. Ong, H.T.; Dilley, R.J. Novel Non-Angiogenic Role for Mesenchymal Stem Cell-Derived Vascular Endothelial Growth Factor on Keratinocytes during Wound Healing. Cytokine Growth Factor Rev. 2018, 44, 69–79. [Google Scholar] [CrossRef]
  30. Serra, M.B.; Barroso, W.A.; da Silva, N.N.; Silva, S.d.N.; Borges, A.C.R.; Abreu, I.C.; Borges, M.O.d.R. From Inflammation to Current and Alternative Therapies Involved in Wound Healing. Int. J. Inflam. 2017, 2017, 3406215. [Google Scholar] [CrossRef] [PubMed]
  31. Wise, L.M.; Stuart, G.S.; Jones, N.C.; Fleming, S.B.; Mercer, A.A. Orf Virus IL-10 and VEGF-E Act Synergistically to Enhance Healing of Cutaneous Wounds in Mice. J. Clin. Med. 2020, 9, 1085. [Google Scholar] [CrossRef]
  32. Galiano, R.D.; Tepper, O.M.; Pelo, C.R.; Bhatt, K.A.; Callaghan, M.; Bastidas, N.; Bunting, S.; Steinmetz, H.G.; Gurtner, G.C. Topical Vascular Endothelial Growth Factor Accelerates Diabetic Wound Healing through Increased Angiogenesis and by Mobilizing and Recruiting Bone Marrow-Derived Cells. Am. J. Pathol. 2004, 164, 1935–1947. [Google Scholar] [CrossRef]
  33. Zhang, Y.; Zhang, Y.-Y.; Pan, Z.-W.; Li, Q.-Q.; Sun, L.-H.; Li, X.; Gong, M.-Y.; Yang, X.-W.; Wang, Y.-Y.; Li, H.-D.; et al. GDF11 Promotes Wound Healing in Diabetic Mice via Stimulating HIF-1α-VEGF/SDF-1α-Mediated Endothelial Progenitor Cell Mobilization and Neovascularization. Acta Pharmacol. Sin. 2023, 44, 999–1013. [Google Scholar] [CrossRef]
  34. Woodson, C.M.; Kehn-Hall, K. Examining the Role of EGR1 during Viral Infections. Front. Microbiol. 2022, 13, 1020220. [Google Scholar] [CrossRef]
  35. Havis, E.; Duprez, D. EGR1 Transcription Factor Is a Multifaceted Regulator of Matrix Production in Tendons and Other Connective Tissues. Int. J. Mol. Sci. 2020, 21, 1664. [Google Scholar] [CrossRef]
  36. Wu, M.; Melichian, D.S.; de la Garza, M.; Gruner, K.; Bhattacharyya, S.; Barr, L.; Nair, A.; Shahrara, S.; Sporn, P.H.S.; Mustoe, T.A.; et al. Essential Roles for Early Growth Response Transcription Factor Egr-1 in Tissue Fibrosis and Wound Healing. Am. J. Pathol. 2009, 175, 1041–1055. [Google Scholar] [CrossRef]
  37. Feng, X.; Feng, W.; Ji, Y.; Jin, T.; Li, J.; Guo, J. Transforming Growth Factor-Β1 Negatively Regulates SOCS7 via EGR1 during Wound Healing. Cell Commun. Signal. 2022, 20, 86. [Google Scholar] [CrossRef]
  38. Schilrreff, P.; Alexiev, U. Chronic Inflammation in Non-Healing Skin Wounds and Promising Natural Bioactive Compounds Treatment. Int. J. Mol. Sci. 2022, 23, 4928. [Google Scholar] [CrossRef] [PubMed]
  39. Jiang, M.; Jiang, X.; Li, H.; Zhang, C.; Zhang, Z.; Wu, C.; Zhang, J.; Hu, J.; Zhang, J. The Role of Mesenchymal Stem Cell-Derived EVs in Diabetic Wound Healing. Front. Immunol. 2023, 14, 1136098. [Google Scholar] [CrossRef] [PubMed]
  40. Finsterwald, C.; Alberini, C.M. Stress and Glucocorticoid Receptor-Dependent Mechanisms in Long-Term Memory: From Adaptive Responses to Psychopathologies. Neurobiol. Learn. Mem. 2014, 112, 17–29. [Google Scholar] [CrossRef] [PubMed]
  41. Chourpiliadis, C.; Aeddula, N.R. Physiology, Glucocorticoids. In StatPearls; StatPearls Publishing: Treasure Island, FL, USA, 2025. [Google Scholar]
  42. Tiganescu, A.; Hupe, M.; Uchida, Y.; Mauro, T.; Elias, P.M.; Holleran, W.M. Increased Glucocorticoid Activation during Mouse Skin Wound Healing. J. Endocrinol. 2014, 221, 51–61. [Google Scholar] [CrossRef]
  43. Slominski, A.T.; Zmijewski, M.A. Glucocorticoids Inhibit Wound Healing: Novel Mechanism of Action. J. Investig. Dermatol. 2017, 137, 1012–1014. [Google Scholar] [CrossRef]
  44. Bablok, M.; Gellisch, M.; Brand-Saberi, B.; Morosan-Puopolo, G. Local Glucocorticoid Administration Impairs Embryonic Wound Healing. Biomedicines 2022, 10, 3125. [Google Scholar] [CrossRef]
  45. Jozic, I.; Vukelic, S.; Stojadinovic, O.; Liang, L.; Ramirez, H.A.; Pastar, I.; Tomic Canic, M. Stress Signals, Mediated by Membranous Glucocorticoid Receptor, Activate PLC/PKC/GSK-3β/β-Catenin Pathway to Inhibit Wound Closure. J. Investig. Dermatol. 2017, 137, 1144–1154. [Google Scholar] [CrossRef]
  46. Carolina, E.; Kato, T.; Khanh, V.C.; Moriguchi, K.; Yamashita, T.; Takeuchi, K.; Hamada, H.; Ohneda, O. Glucocorticoid Impaired the Wound Healing Ability of Endothelial Progenitor Cells by Reducing the Expression of CXCR4 in the PGE2 Pathway. Front. Med. 2018, 5, 276. [Google Scholar] [CrossRef]
  47. Hill, E.E.; Zack, E.; Battaglini, C.; Viru, M.; Viru, A.; Hackney, A.C. Exercise and Circulating Cortisol Levels: The Intensity Threshold Effect. J. Endocrinol. Investig. 2008, 31, 587–591. [Google Scholar] [CrossRef]
  48. Popovic, D.; Plecas-Solarovic, B.; Pesic, V.; Petrovic, M.; Vujisic-Tesic, B.; Popovic, B.; Ignjatovic, S.; Ristic, A.; Damjanovic, S.S. How Does Stress Possibly Affect Cardiac Remodeling? Peptides 2014, 57, 20–30. [Google Scholar] [CrossRef]
  49. Ushiki, K.; Tsunekawa, K.; Shoho, Y.; Martha, L.; Ishigaki, H.; Matsumoto, R.; Yanagawa, Y.; Nakazawa, A.; Yoshida, A.; Nakajima, K.; et al. Assessment of Exercise-Induced Stress by Automated Measurement of Salivary Cortisol Concentrations within the Circadian Rhythm in Japanese Female Long-Distance Runners. Sports Med. Open 2020, 6, 38. [Google Scholar] [CrossRef] [PubMed]
  50. Gleeson, M.; Bishop, N.C.; Stensel, D.J.; Lindley, M.R.; Mastana, S.S.; Nimmo, M.A. The Anti-Inflammatory Effects of Exercise: Mechanisms and Implications for the Prevention and Treatment of Disease. Nat. Rev. Immunol. 2011, 11, 607–615. [Google Scholar] [CrossRef] [PubMed]
  51. Knechtle, B.; Nikolaidis, P.T. Physiology and Pathophysiology in Ultra-Marathon Running. Front. Physiol. 2018, 9, 634. [Google Scholar] [CrossRef] [PubMed]
  52. Simpson, R.J.; Kunz, H.; Agha, N.; Graff, R. Exercise and the Regulation of Immune Functions. Prog. Mol. Biol. Transl. Sci. 2015, 135, 355–380. [Google Scholar] [CrossRef]
  53. Nieman, D.C. Exercise Immunology: Nutritional Countermeasures. Can. J. Appl. Physiol. 2001, 26, S45–S55. [Google Scholar] [CrossRef]
  54. Yousef, H.; Alhajj, M.; Fakoya, A.O.; Sharma, S. Anatomy, Skin (Integument), Epidermis. In StatPearls; StatPearls Publishing: Treasure Island, FL, USA, 2025. [Google Scholar]
  55. Hewitt, N.J.; Grégoire, S.; Cubberley, R.; Duplan, H.; Eilstein, J.; Ellison, C.; Lester, C.; Fabian, E.; Fernandez, J.; Géniès, C.; et al. Measurement of the Penetration of 56 Cosmetic Relevant Chemicals into and through Human Skin Using a Standardized Protocol. J. Appl. Toxicol. 2020, 40, 403–415. [Google Scholar] [CrossRef]
  56. Shiseido Co., Ltd. Visualization of the Distribution of Useful Ingredients That Have Penetrated the Skin at the Cellular Level to Accelerate Functionality and Safety. Available online: https://corp.shiseido.com/jp/news/detail.htmL?n=00000000003768 (accessed on 17 February 2025).
  57. Shrestha, R.; Krishan, K.; Ishaq, H.; Kanchan, T. Abrasion. In StatPearls; StatPearls Publishing: Treasure Island, FL, USA, 2025. [Google Scholar]
  58. HAS1 Hyaluronan Synthase 1 [Homo sapiens (human)]-Gene-NCBI. Available online: https://www.ncbi.nlm.nih.gov/gene/3036 (accessed on 17 February 2025).
  59. Matías, F.L. HAS2 (Hyaluronan Synthase 2). Available online: https://atlasgeneticsoncology.org/gene/412/has2-%28hyaluronan-synthase (accessed on 17 February 2025).
  60. Papakonstantinou, E.; Roth, M.; Karakiulakis, G. Hyaluronic Acid: A Key Molecule in Skin Aging. Dermatoendocrinology 2012, 4, 253–258. [Google Scholar] [CrossRef]
  61. Shang, L.; Li, M.; Xu, A.; Zhuo, F. Recent Applications and Molecular Mechanisms of Hyaluronic Acid in Skin Aging and Wound Healing. Med. Nov. Technol. Devices 2024, 23, 100320. [Google Scholar] [CrossRef]
  62. Discovered That the Metabolic Balance of Dermal Hyaluronic Acid Is Disrupted in Wrinkled and Sagging Areas, Kao Corporation. Available online: https://www.kao.com/jp/newsroom/news/release/2017/20170607-001/ (accessed on 17 February 2025).
  63. Zhou, R.; Yu, M. The Effect of Local Hyaluronic Acid Injection on Skin Aging: A Systematic Review and Meta-Analysis. J. Cosmet. Dermatol. 2025, 24, e16760. [Google Scholar] [CrossRef]
  64. Immediate and Long-Term Effects of a Topical Serum with Five Forms of Hyaluronic Acid on Facial Wrinkles and Intrinsic Skin Moisture Content. J. Am. Acad. Dermatol. 2016, 74, AB18. [CrossRef]
Figure 1. An overview of this experiment. (A) Packaging of the KTPB product (Karada Totonou ProBath), (B) RNA-seq experiment, and (C) trypan blue assay.
Cosmetics 12 00098 g001
Figure 2. Effect of KTPB on gene expression. PCA plots, heatmaps, and DEG numbers are shown from the results of the RNA-seq. (AD) The results for the keratinocytes. (EH) The results for the fibroblasts. (A,E) Cluster dendrograms. (B,F) PCA plots. (C,G) Heatmaps based on the expression levels of the DEGs. (D,H) Number of DEGs in the clusters. The heatmaps show the genes on the vertical axis and the time course on the horizontal axis. The control (Cont.; n = 3) is located on the far left. The letter “C” shown on the right of each heatmap stands for cluster.
Cosmetics 12 00098 g002
Figure 3. The results of GO, pathway analysis, and text mining. (A,B) The results for the keratinocytes, and (C,D) the results for the fibroblasts. (A,C) Top 10 terms for the GO and pathway analyses. (B,D) The results of text mining of the top 10 terms and lower-category terms associated with them.
Cosmetics 12 00098 g003
Figure 4. Identification of the gene most affected by KTPB, which was EGR1. The figure shows a Venn diagram followed by volcano plots and coverage graphs followed by bar graphs. (AD) The results for the keratinocytes. (EH) The results for the fibroblasts. (A,E) Venn diagrams. (B,F) Volcano plots. (C,G) Coverage graphs of the EGR1 region. (D,H) Bar graphs of the TPM values of EGR1. The bar graphs show the average and standard deviation (±SD) for n = 3. **** p < 0.0001 (Bonferroni-corrected p-value from the RNA-seq analysis) vs. all other groups in the keratinocytes; ¶¶¶¶ p < 0.0001 (Bonferroni-corrected p-value from the RNA-seq analysis) vs. the other groups apart from 30 min in the fibroblasts.
Cosmetics 12 00098 g004
Figure 5. Effect of KTPB on the expression of HASs. The figure shows heatmaps, coverage graphs, and bar graphs for HASs with significant changes in expression. (AC) The results for the keratinocytes. (DF) The results for the fibroblasts. (A,D) Heatmaps showing the position and expression pattern of HASs. (B,C) Coverage graphs for HAS3 or -2. (C,F) Bar graphs showing the expression levels of HAS13 over time. The bar graphs show the average ± SD for n = 3. **** p < 0.0001; ** p < 0.01 (Bonferroni-corrected p-value) vs. Cont. group in the keratinocytes; ¶¶¶ p < 0.001 (Bonferroni-corrected p-value) vs. Cont. group in the fibroblasts.
Cosmetics 12 00098 g005
Figure 6. The results of the microscopic observations and trypan blue assay. (A,B) The results for the keratinocytes. (C,D) The results for the fibroblasts. (A,C) Microscopic observations. (B,D) Bar graphs of the live cell numbers of each cell type. The bar graphs show the average ± SD for n = 4. **** p < 0.0001 (by the Tukey–Kramer test) vs. all other groups in the keratinocytes; ¶¶¶¶ p < 0.0001 (by the Tukey–Kramer test) vs. all other groups in the fibroblasts.
Cosmetics 12 00098 g006
Disclaimer/Publisher’s Note: The statements, opinions and data contained in all publications are solely those of the individual author(s) and contributor(s) and not of MDPI and/or the editor(s). MDPI and/or the editor(s) disclaim responsibility for any injury to people or property resulting from any ideas, methods, instructions or products referred to in the content.

