Article

A Novel and Reliable Analysis Method Utilizing Hennosides to Improve the Quality Assessment of Lawsonia inermis L. Material Used in Cosmetic Formulations

1
Henkel AG & Co. KGaA, Ruhrstraße 19, 22761 Hamburg, Germany
2
Institute of Organic Chemistry, University of Hamburg, Martin-Luther-King-Platz 6, 20146 Hamburg, Germany
*
Author to whom correspondence should be addressed.
Cosmetics 2025, 12(3), 99; https://doi.org/10.3390/cosmetics12030099
Submission received: 14 April 2025 / Revised: 8 May 2025 / Accepted: 12 May 2025 / Published: 14 May 2025
(This article belongs to the Section Cosmetic Technology)

Abstract

:
Lawsonia inermis L. is renowned for its hair dyeing properties, with henna quality and safety often regulated by restrictions on the lawsone (2-hydroxy-1,4-naphthoquinone) content. In henna leaves, lawsone exists as glycosylated precursors, hennosides A, B, and C. Aqueous maceration revealed the sensitivity of enzymatic lawsone release, while ethanol extraction inhibited β-glucosidase activity, enabling controlled hennoside extraction. Hennoside A was isolated via RP-column chromatography and characterized using ESI-TOF, 1H-/13C-NMR, COSY, NOESY, HSQC, and HMBC. The purified compound proved suitable as an HPLC reference standard. The acidic hydrolysis of hennoside-rich extracts highlighted the limitations of lawsone-based analysis, underscoring glycosylated precursors as more reliable quality markers. Lawsone quantification via enzymatic or acid catalysis demonstrated varying accuracy in quality control. A hennoside-based approach ensures consistency by estimating the maximum releasable lawsone without inducing its formation, providing a more robust metric for a henna quality assessment.

1. Introduction

With the rising awareness of consumers regarding cosmetic ingredients and their environmental impact [1,2,3], hair dye products cannot be neglected. Approximately 50–80% of women in the United States (US) and the European Union (EU) have dyed their hair at least once in their lifetime. In comparison to semipermanent, temporary, and plant-based hair coloration, permanent dyes hold roughly 80% of the market share in the US and EU, respectively [4]. Many aromatic dyes and their precursors used in permanent dye are of fossil raw material-based origins [5]. These dyes and their degradation products have been found to contaminate wastewater and thereby cause potential ecotoxicity [6]. Combined with rising cases of severe allergic reactions to para-phenylenediamine (PPD) [7], a widely used precursor in permanent hair dye, health and environmentally conscious consumers are highly motivated to turn to sustainable and plant-based alternatives.
Plants often used for hair dyeing are henna (Lawsonia inermis L.) and indigo (Indigofera tinctoria L.). Henna is known for its characteristic orange color caused by its natural dye named lawsone (2-hydroxy-1,4-naphthoquinone). The combination of both henna and indigo is used to create different brown to black shades, depending on the ratios of plant powders [8]. There is little to no diversity in terms of the formulation when it comes to hair coloration containing exclusively plant material. Henna as well as indigo dye preparations are standardly available as shredded and finely milled leaves that are either accessible on their own or combined with other plants like senna (Senna alexandrina L.), amla (Phyllanthus emblica L.), or fenugreek (Trigonella foenum graecum L.) [9,10,11].
The limited formulation and shade portfolio concerning plant coloration in the EU is due to safety regulations. The safe usage of henna as a hair dye in the EU is regulated by the Scientific Committee on Consumer Safety (SCCS) and their opinion on Lawsonia inermis from September 2013 [12]. The opinion considers henna powder as safe when it contains less than 1.4% w/w lawsone and is combined with three parts boiling water to one part plant powder before application. It is emphasized that their opinion relies on certain batches of henna powder and their extracts as well as specific analytical quantification—either via UV-spectrometry or HPLC. The literature shows that the lawsone content varies extremely depending not only, but immensely, on the extraction method. A water-soluble extract referenced by the SCCS exhibits a yield of 32.9%, with a lawsone concentration of 1.17% w/w relative to the raw material [12]. Alem et al. analyzed henna raw materials from different parts of Morocco by extraction with ethanol under sonification and quantification via HPLC-MS-MS. They found lawsone contents between 0.1% and 0.6% [13]. These differences are not only based on the varying origins and growing conditions, but immensely on the extraction method, specifically solvent use.
Lawsone is not primarily present as a fully developed dye in the henna shrub, but as mono-glycosylated and reduced precursors often referred to as hennoside A, B, and C [14] as well as a diglycoside named lawsoniaside [15]. Therefore, only a negligible amount of lawsone is present in the dried plant leaves. Lawsone as well as other phytochemical naphthalenes and metabolites can be developed by enzymatic or acidic hydrolysis and following oxidation of these precursors in aqueous medium [16,17,18]. Like other plants known for their dyeing abilities like Indigofera tinctoria L. and Juglans regia L. henna contains a β-D-glucosidase that hydrolyzes its glycosylated precursors, starting the color release [14,19,20]. Since the intended hydrolysis by enzymatic or acidic deglycosylation can only take place in aqueous conditions, an extraction of henna leaves with any kind of organic solvent cannot provide a reliable and accurate source material for total lawsone quantification and a subsequent safety assessment of a raw material.
Lawsone is highly instable in aqueous solution due to its sensitivity to light exposure resulting in decomposition, and secondly, due to its high reaction potential [13,21]. The easily influenced enzymatic hydrolysis as well as the mentioned instability emphasize the need to overthink the analysis protocol for the assessment of the henna raw material used in hair coloration specifically. In the following, a new qualification and quantification method focusing on the glycosylated precursors, explicitly hennoside A (1,2,4-trihydroxynaphthalene-1-O-glucoside, THNG), is proposed avoiding the lawsone release, thereby eliminating potential disruptive factors and sources of error.

2. Materials and Methods

2.1. Chemicals

The reference standard for lawsone (Lawsone, 2-Hydroxy-p-naphthoquinone, 99%, CAS: 83-72-7, Lot: A0435140) was purchased from Thermo Scientific (Geel, Belgium). HPLC-grade solvents were purchased from VWR International GmbH (Darmstadt, Germany). Ultra-pure water (UPW) was freshly provided through an Arium Pro Ultra-Pure Water System by Sartorious AG (Göttingen, Germany). Purity of water was measured by conductivity, with a limiting resistivity of 18.2 MΩ cm. Analytical reagent-grade absolute ethanol ≥99.8% (CAS: 64-17-5) was purchased from Fisher Scientific (Loughborough, UK). Diethyl ether ≥99% (CAS: 60-29-7) was purchased from VWR International GmbH (Darmstadt, Germany). Analytical grade hydrochloric acid (HCl) 37% (CAS: 7647-01-0, Lot: 21G094021) was purchased from VWR International GmbH (Darmstadt, Germany). Formic Acid ≥90% for analytical purposes (CAS: 64-18-6) was purchased from Merck KGaA (Darmstadt, Germany).

2.2. Plant Materials

A total of 50 kg Moroccan henna (Lawsonia inermis L.) crushed leaves (Lot 21-3 MARO, Nov 2021) with a moisture content of <10% and a particle size of 10–18 mesh were purchased through Croda GmbH (Nettetal, Germany). Indian raw material was kindly provided by Indfrag Biosciences Pvt Ltd. (Bengaluru, India), with moisture content of 9.1% and a particle size of 20–30 mesh, and Matha Exports International LLP (New Delhi, India), with moisture content of 0.31% and a particle size of 100–120 mesh.

2.3. Extraction of Lawsonia inermis L. Material

2.3.1. Maceration of Henna Raw Material

Sample of 1 g each of the different henna raw materials was suspended in 100 mL ultra-pure water and ethanol (abs.), respectively (n = 3, each). After 5 min, 30 min, 1 h, 2 h, 4 h, 8 h, and 24 h, 100 µL each were removed and filtrated through 0.2 µm syringe filters (CHROMAFIL® RC-20/15 MS, Macherey-Nagel GmbH and Co. KG, Düren, Germany). A 100-fold dilution with a final volume ratio of 7:3 UPW and ethanol of 10 µL of the filtrated solution was analyzed with HPLC to determine the concentration of 1,2,4-trihydroxynaphthalene-1-O-glucoside (THNG) and lawsone at the given times. The rest of the filtrated solution was transferred back into the maceration system. Time measurement started after full submersion of raw material in solvent.

2.3.2. Ethanolic Extraction of Henna Raw Material for Hennoside Isolation

The extract used for the isolation of hennoside A was completed by extracting 100 g of Moroccan henna raw material with 1 L of absolute ethanol via Soxhlet extraction over 25 cycles and 24 h, at 60 °C and approx. 220 mbar. A 500 mL Soxhlet apparatus was filled with a glass extraction sleeve containing the raw material. Additionally, 150 g of glass beads with a diameter of 3 mm (VWR International GmbH, Darmstadt, Germany) were added into the Soxhlet apparatus to reduce the duration of each cycle. The final volume of ethanol in contact with the raw material towards the end of a cycle amounts to 100 mL. The final extract was dried under vacuum and stored under light exclusion until further processing (28.5% yield). Then, 5 g of the dried extract was combined with 100 mL diethyl ether to remove lipophilic components as well as most of the chlorophyll from the extract. The insoluble residue was filtrated (quantitative filter paper, 434, 2–3 µm, VWR International GmbH) and stored under light exclusion and vacuum on a Schlenk line for 48 h at RT (23 ± 2 °C) until further usage. The filtration yielded a dark green homogenous solution which was discarded. Approximately 2.5% w/w of the total hennoside content is lost during the washing step due to the glycosides’ low solubility in diethyl ether. This loss is acceptable since the washing step yields a beige, processable, and powdery extract low in chlorophylls with a hennoside content of 22.0 ± 0.2% w/w compared to the original Soxhlet extract containing large amounts of chlorophylls and only 17.2 ± 0.6% w/w of hennoside.

2.3.3. Hot Aqueous Extraction of Henna Raw Material for Acidic Hydrolysis

To prepare an aqueous extract (HD) without β-glucosidase activity, 50 g of Moroccan raw material was suspended in 1 L of boiling ultra-pure water. The mixture was stirred with a magnetic stirrer for 5 min before cooling to RT (23 ± 2 °C) on ice. The suspension was filtrated through quantitative filter paper, 434, 2–3 µm (VWR International GmbH, Darmstadt, Germany), and the raw material was extracted a second time with 1 L of boiling ultra-pure water. After the second filtration, the solutions were combined and dried under vacuum with a rotary evaporator to a brown powder (32.9% yield). The extract was stored under vacuum and light exclusion until further usage. An ether wash analogue for preparation of extract for hennoside isolation (Section 2.3.2) was not deemed necessary since aqueous extraction naturally limits the chlorophyll content of the extract as well as the extraction of other lipophilic interfering components due to the solvent’s polarity. Absence of β-glucosidase activity was determined by stability of hennoside in solution. HD was prepared according to protocol with varying temperatures from 75 °C to 100 °C. The solutions were cooled to RT (23 ± 2 °C) and analyzed via HPLC. Temperatures from 90 °C upwards resulted in extracts exhibiting only hennoside and no lawsone. The hennoside staying stable in solution implied the absence of β-glucosidase activity since lawsone did not develop over time and the hennoside quantity did not decrease.

2.3.4. Acidic Hydrolysis of Hennoside in Henna Extract

Acidic hydrolysis of heat-denatured extract (HD) and ethanolic Soxhlet extract (EE) were performed to show the controlled hydrolysis and subsequent oxidation of hennoside to lawsone. For this, 78.0 mg of HD and 36.0 mg of EE were dissolved in 98 mL each of a 7:3 mixture of ultra-pure water and ethanol (abs.). The pH was adjusted to pH 1.0 by adding 2 mL of 37% HCl into the preparations. Hydrolysis was conducted at 100 °C under reflux cooling. Every 20 min a sample of 100 µL was taken and put on ice to quench the hydrolysis. For the HD extract, a 10-fold dilution, for the EE, a 20-fold dilution, were analyzed with HPLC to quantify the amount of hennoside hydrolyzed at the given times. A mixture of ultra-pure water and ethanol (volume ratio of 7:3) was used to dilute the samples. The quantification of hydrolyzed THNG via lawsone release was calculated by quantifying the amount of lawsone present in the system multiplied by the factor 1.94 (Equation (1)). This factor is based on the molar masses of both substances; THNG with a molar mass of 338.1 g mol−1 is 1.94 times heavier than lawsone with 174.03 g mol−1. The amount of hennoside hydrolyzed at time of sample removal (THNGhydrolyzed min x) is thereby calculated by subtracting the lawsone amount originally present in the extract itself (Lawsonemin 0) from the quantified amount in the sample (Lawsonemin x).
THNGhydrolyzed min x(µg mL−1) = (Lawsonemin x(µg mL−1) − Lawsonemin 0(µg mL−1)) × 1.94

2.4. Hennoside Isolation via RP Column Chromatography

For the sample preparation, 1 g of the ethanolic Soxhlet extract washed with diethyl ether (preparation described in detail under Section 2.3.2) was dissolved in 20 mL ultra-pure water and filtrated through a 0.22 µm nylon filter. The isolation was completed by reverse-phase (RP) column chromatography on a puriFlash® XS 520 plus set up by Interchim Deutschland GmbH (Mannheim, Germany). The column used was the PF-C18AQ-F0040, 15 µm Flash column, Batch: X08L42. For the isolation HPLC-grade acetonitrile, isopropyl alcohol from VWR International GmbH (Darmstadt, Germany) and ultra-pure water were used. To isolate hennoside, 2 mL of the sample were applied in liquid state directly onto the column. With a flow rate of 26 mL min−1, the sample was eluted, starting with 90% ultra-pure water (A) and 10% acetonitrile (B) with a gradient to 75% A and 25% B at minute 15. The column was then rinsed with 100% Isopropyl alcohol (IPA) to remove residual compounds still on the column. Fractions were collected and checked with RP thin-layer chromatography (TLC) for hennoside. As a mobile phase, a 1:1 volume ratio of acetonitrile and ultra-pure water was used. The TLC Silica gel 60 RP-18 F254s plates (Merck GmbH, Darmstadt, Germany) were analyzed under UV light at 254 nm and 365 nm, respectively, as well as quickly dipped into a 1000-fold diluted aqueous cellulase preparation (kindly provided by Novonesis, Bagsværd, Denmark) and dried. The enzyme mixture consists of approx. 20% w/w cellulase, 64.5% w/w of water, 15% w/w glucose and sucrose, and small amounts of preservatives (sodium benzoate and potassium sorbate). The assumed hennoside spot on the RP-TLC plate turned orange within 60 s after dipping the TLC plate into the mixture due to hennoside being hydrolyzed by the cellulases in the preparation and oxidizing further to form lawsone. The isolation was repeated 10 times, pure hennoside fractions were collected and frozen until further usage. The combined hennoside fractions were dried, stored under vacuum at −20 °C, and excluded from light until further processing. The combined hennoside fractions yielded 220 mg in total, representing 99% w/w of the overall amount of hennoside present in the initial extract (1 g) used for isolation (THNG content of extract 22.0 ± 0.2% w/w).

2.5. Characterization of Isolated Hennoside Material

2.5.1. ESI-TOF Analysis of Isolated Hennoside Fractions

To confirm the presence of hennoside isomers in the isolated fractions, ESI (+) mass spectrometry was performed using an Agilent 6224 ESI-TOF combined with the Agilent HPLC 1200 Series (Santa Clara, CA, USA). Using an isocratic volume ratio of 1:1 acetonitrile to ultra-pure water with 0.1% v/v formic acid at a flow rate of 0.3 mL min−1, 0.5 µL isolated hennoside sample (10 µg mL−1 in ultra-pure water) was measured for a total run time of 1.5 min. The sample was maintained at 15 °C in the autosampler prior to injection. During ionization, the sample was exposed to temperatures up to 325 °C.

2.5.2. 3D Structural Analysis of Isolated Hennoside by NMR

All NMR experiments were performed by Creative BioStructure (Shirley, NY, USA) using the DD2 500 MHz NMR spectrometer by Agilent Technologies (Santa Clara, CA, USA). A sample of isolated hennoside (50 mM) was dissolved in 99.9% D2O to specify the composition of the sample and to verify which of the three isomers is present.
NMR spectra for 1H (spectral width: 8992.8 Hz) and 13C (spectral width: 31,250.0 Hz) were acquired. For the 1H measurements, 16 scans were collected per free induction decay (FID) with a relaxation delay of 8.1781 s. For 13C measurements, 320 transients were acquired with a relaxation delay of 1 s. Additionally, 2D NMR spectra were obtained using a spectral width of 4085.0 Hz for the directly observed 1H dimension, and 4085.0 Hz, 4085.0 Hz, 23,880.6 Hz, and 28,912.2 Hz for the indirectly observed dimensions in the 1H-1H COSY, 1H-1H NOESY, 1H-13C HSQC, and 1H-13C HMBC experiments, respectively. The 1H-1H COSY experiment utilized a gradient-enhanced COSY pulse sequence (gCOSY), while the 1H-1H NOESY experiment employed a standard phase-sensitive NOESY pulse sequence. The 1H-13C HSQC experiment was carried out with a gradient-enhanced HSQC with amplitude decoupling (gHSQCAD), and the 1H-13C HMBC experiment utilized a gradient-enhanced HMBC with amplitude decoupling (gHMBCAD). The acquisition parameters for the 2D experiments were 512 × 128, 512 × 128, 512 × 128, and 512 × 200 for COSY, NOESY, HSQC, and HMBC, respectively. The NOESY experiment was acquired with a mixing time of 500 ms.
For the prediction of the 3D-moleculare structures of all three hennosides, the OpenChemistry Software Avogadro2 1.100.0 was used as well as Chemdraw 21.0.0 (Revvity, Waltham, MA, USA). The 2D structures were drawn in Chemdraw and transferred to Avogadro2 where the geometry optimization by Merck Molecular Force Field 94 (MMFF94) [22] was applied (energy convergence: 10−6 units, Step limit: 2500 steps).

2.6. Analysis of Lawsonia inermis L. Extracts by High-Performance Liquid Chromatography (HPLC)

2.6.1. Standard Preparation and Method Validation

A stock solution of 300 µg mL−1 of lawsone standard in ethanol was prepared and diluted with a 7:3 mixture (volume ratio) of ultra-pure water and ethanol. Aliquots ranging from 17 µg mL−1 to 0.025 µg mL−1 were used for the final calibration. Lawsone content of different extracts was determined (Equation (2)). The injection volume for all lawsone standards was 100 µL. For detection, the AZURA Detector DAD 2.1L (Knauer GmbH, Berlin, Germany) was used. The response base for the quantification is the area under the peak at 278 nm. To calculate the concentration of lawsone (conc.Lawsone, Equation (2)) in µg mL−1, the response of the lawsone peak area in mAU s (RLPA, Equation (2)) is, therefore, divided by the slope of 538.81331 mAU s µg−1 mL. The coefficient of determination for this calibration is 0.9992 (r2, Equation (2)).
RLPA (mAU s) = 538.81331 (mAU s µg−1 mL) × conc.Lawsone (µg mL−1), r2 = 0.9992
Linearity of the calibration curve was assessed over the concentration range of 0.05–17.0 µg mL−1 by plotting the data and performing a linear regression analysis. A linear response was confirmed (Table 1) for concentrations ranging from 0.05 µg mL−1 to 11 µg mL−1 (Equation (2)). Limit of detection (LOD) and limit of quantification (LOQ) were determined following ICH Q2(R2) [23]. The standard deviation (σ, Equations (3) and (4)) of the response at 278 nm (mAU) for solvent blanks (n = 3) between min 8 and 10 was found to be 0.43 mAU. Using the calibration curve with peak height as the response base (Equation (5), RLPH = response Lawsone peak height in mAU, conc.Lawsone = lawsone concentration in µg mL−1), the LOD was calculated by multiplying the standard deviation of 0.43 mAU by 3.3 and dividing it by the slope (S, Equations (3) and (4)) of 92.53665 mAU μg−1 mL (Equation (5)). Similarly, the LOQ was calculated by multiplying the standard deviation of 0.43 mAU by 10 and dividing it by the slope of 92.53665 mAU μg−1 mL (Equation (5)). The coefficient of determination for this regression is 0.9991 (r2, Equation (5)).
LOD = 3.3 × σ × S−1
LOQ = 10 × σ × S−1
RLPH (mAU) = 92.53665 (mAU μg−1 mL) × conc.Lawsone (µg mL−1), r2 = 0.9991
Recovery was measured by firstly spiking a sample containing a defined amount of lawsone (0.5 ± 0.02 µg mL−1, n = 3) with lawsone standard (6.5 µg mL−1) and calculating according to Equation (6). The measured amount in the unspiked sample (Cun, Equation (6)) is subtracted from the measured amount in µg mL−1 after spiking (Csp, Equation (6)), divided by the defined amount of lawsone added (Cadd, Equation (6)) multiplied by 100.
Recovery = (Csp − Cun) × Cadd−1 × 100%
Precision, given in relative standard deviation (% RSD, Equation (7)) of the presented HPLC method regarding lawsone, was determined by measuring 6 spiked samples with a total lawsone concentration of 6.5 ± 0.05 µg mL−1. The % RSD is calculated by quantifying the samples regarding their lawsone content (µg mL−1). The standard deviation in µg mL−1 (SD, Equation (7)) of the samples is divided by the average lawsone content in µg mL−1 (Mean, Equation (7)) multiplied by 100.
% RSD = SD × Mean−1 × 100
The 1,2,4-trihydroxynaphthalene-1-O-glucoside calibration was established using isolated hennoside A. A stock solution of 500 µg mL−1 of isolated material was prepared in a 7:3 mixture (volume ratio) of ultra-pure water and ethanol. Dilutions with the same solvent mixture of ultra-pure water and ethanol reaching from 20.0 µg mL−1 to 0.1 µg mL−1 were used for the final calibration. The 1,2,4-trihydroxynaphthalene-1-O-glucoside content of different extracts was determined (Equation (8)). The injection volume for all THNG samples was 100 µL. For detection, the AZURA Detector DAD 2.1L (Knauer GmbH, Berlin, Germany) was used. The response base for the quantification is the area under the peak at 236 nm. To calculate the concentration of 1,2,4-trihydroxynaphthalene-1-O-glucoside (conc.THNG, Equation (8)) in µg mL−1, the response of the THNG peak area in mAU s (RTHNG-PA, Equation (8)) is added to the y-intercept of 125.36295 µg mL−1 and divided by the slope of 541.36055 mAU s μg−1 mL. The coefficient of determination for this calibration is 0.9981 (r2, Equation (8)).
RTHNG-PA (mAU s) = 541.36055 (mAU s μg−1 mL) × conc.THNG (µg mL−1) − 125.36295 (µg mL−1), r2 = 0.9981
Linearity of the calibration curve was assessed over the concentration range of 0.2–20.0 µg mL−1 by plotting the data performing a linear regression analysis. Linearity was proven for concentrations ranging from 0.2 µg mL−1 to 12 µg mL−1 (Equation (8)) (Table 2). Limit of detection (LOD) and limit of quantification (LOQ) were determined following ICH Q2(R2) [23]. The standard deviation (σ, Equations (3) and (4)) of the response at 236 nm (mAU) for solvent blanks (n = 3) between min 4.8 and 6.8 was found to be 2.00 mAU. Using the calibration curve with peak height as the response base (Equation (9)), RTHNG-PH = response THNG peak height in mAU, conc.THNG = THNG concentration in µg mL−1), the LOD was calculated by multiplying the standard deviation of 2.00 mAU by 3.3 and dividing it by the slope (S, Equations (3) and (4)) of 107.08938 mAU μg−1 mL (Equation (9)). LOQ was calculated by multiplying the standard deviation of 2.00 mAU by 10 and dividing it by the slope of 107.08938 mAU μg1 mL (Equation (9)). The coefficient of determination for this regression is 0.9987 (r2, Equation (9)).
RTHNG-PH (mAU) = 107.08938 (mAU μg−1 mL) × conc.THNG (µg mL−1) − 16.84944 (µg mL−1), r2 = 0.9987
Recovery was measured by firstly spiking a sample containing a defined amount of THNG (3.9 ± 0.01 µg mL−1, n = 3) with THNG standard (3.75 µg mL−1) and calculating according to Equation (6). The measured amount in the unspiked sample (Cun, Equation (6)) is subtracted from the measured amount in µg mL−1 after spiking (Csp, Equation (6)), divided by the defined amount of THNG added (Cadd, Equation (6)) multiplied by 100.
Precision, given in relative standard deviation (% RSD, Equation (7)) of the presented HPLC method regarding THNG, was determined by measuring 6 spiked samples with a total lawsone concentration of 7.4 ± 0.03 µg mL−1. The % RSD is calculated by quantifying the samples regarding their THNG content (µg mL−1). The standard deviation in µg mL−1 (SD, Equation (7)) of the samples is divided by the average THNG content in µg mL−1 (Mean, Equation (7)) multiplied by 100.

2.6.2. Quantification of Hennoside and Lawsone in Henna Extracts

For the analysis of extracts and quantification of THNG and lawsone contents, 100 µL of each sample was injected into the Knauer AZURA® Analytical HPLC set up with Autosampler AS 6.1L (Knauer GmbH, Berlin, Germany). A column oven (column thermostat AZURA® CT 2.1, Knauer GmbH, Berlin, Germany) and the analytical column (Eurospher II 100-5 C18, 250 × 4.6 mm, 5 µm, 100 Å, Knauer GmbH, Berlin, Germany) were used. As eluents, ultra-pure water with 0.1% v/v formic acid (A) and acetonitrile (B) were used with a continuous flow rate of 1 mL min−1. The same ramp method for hennoside and lawsone quantification was applied (Table 3). Compounds were detected by AZURA Detector DAD 2.1L (Knauer GmbH, Berlin, Germany) at 236 nm, 250 nm, and 278 nm. For lawsone quantification, 278 nm was used, and for hennoside, 236 nm. Hennoside elutes between min 5.3 and 5.7 and lawsone elutes starting at min 8.6–9.3. Representative HPLC profiles of both standard solutions, an aqueous extract containing both hennoside and lawsone as well as a profile for the solvent blank are provided in the Supplementary Material (Figure S1) for reference. Collected data were analyzed with ClarityChrom®9 (Knauer GmbH, Berlin, Germany).

3. Results and Discussion

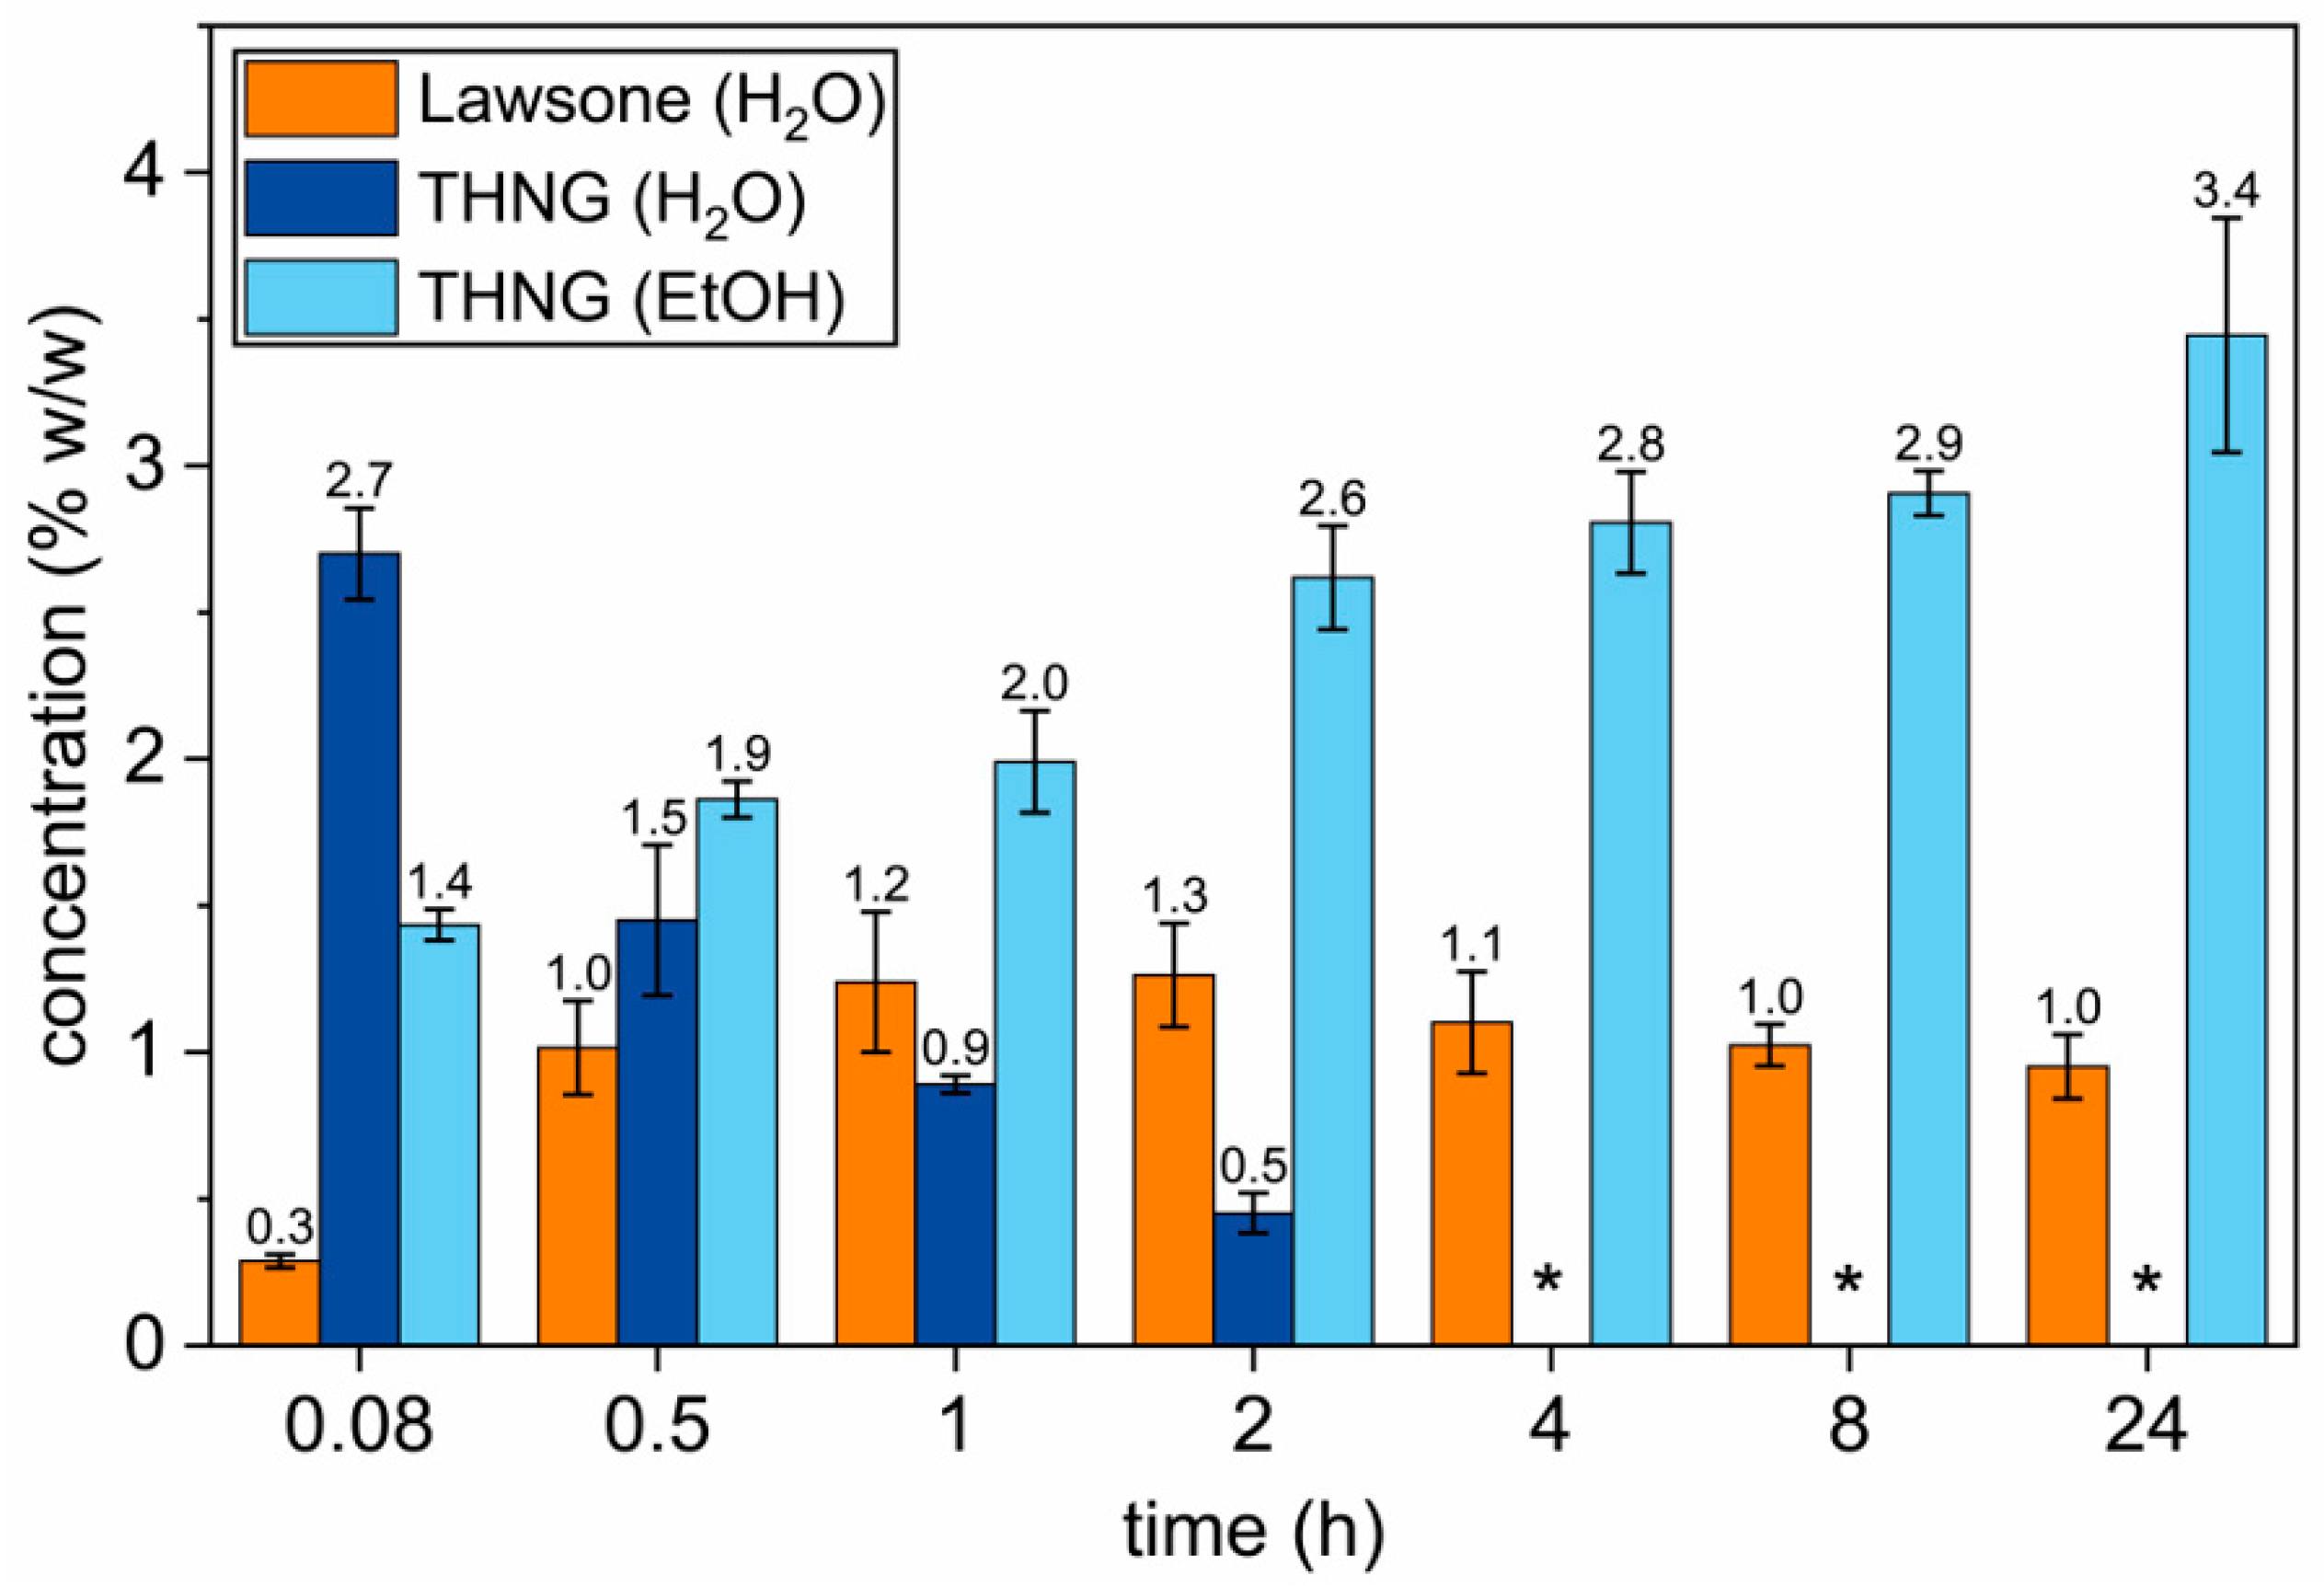
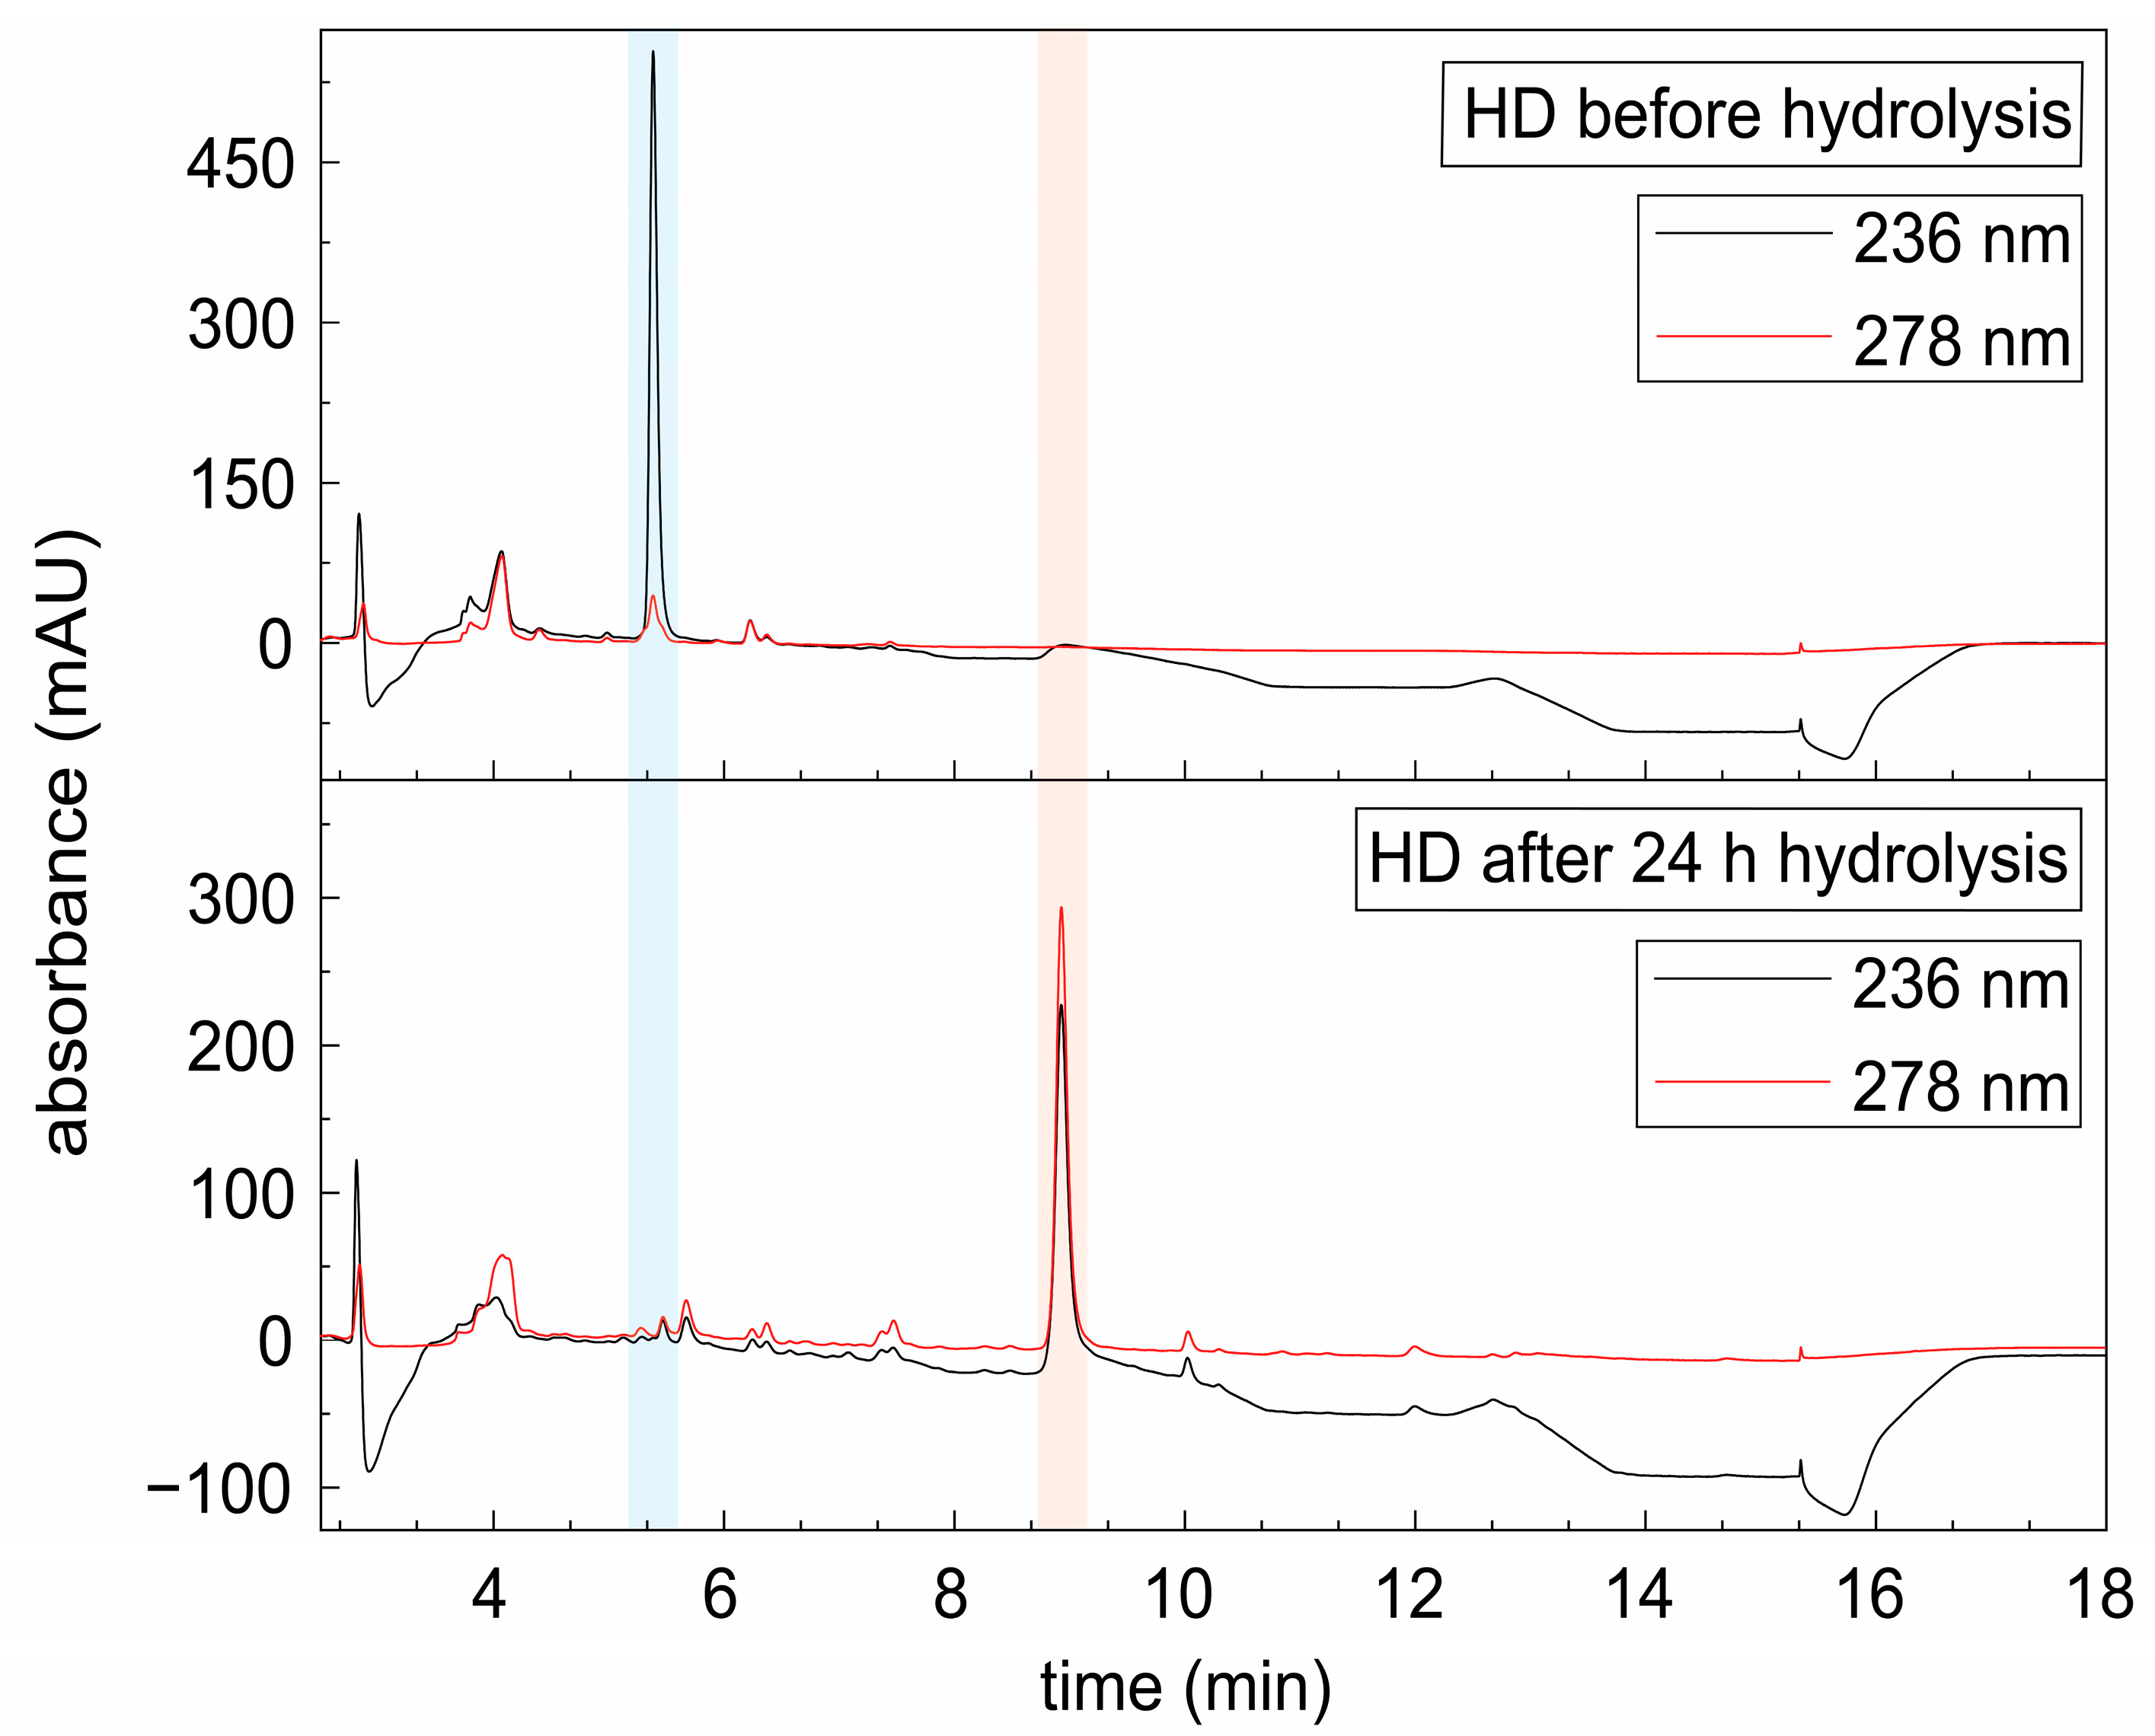
3.1. Sensitivity of Lawsone Release from Lawsonia inermis L. Material

The sensitive and unique progression of a lawsone-centered aqueous maceration emphasizes how error-prone and inconclusive the sole focus on this substance is (Figure 1). The naturally occurring enzymatic hydrolysis of hennosides and subsequent oxidation to lawsone under aqueous conditions takes time and involves several simultaneously proceeding reactions. Firstly, THNG is hydrolyzed, leading to the formation of hydrolawsone. This reaction continued over the time span of 8 h. The amount of THNG decreased with time, but only after 4 h where no amount of THNG could be quantified in the extract (Table 4). While THNG diffuses into the solution and is hydrolyzed, the developed hydrolawsone is oxidized by atmospheric oxygen to form lawsone [24].
In the case of the aqueous maceration (H2O), the amount of lawsone detected is the quantity developed from the extracted THNG at different times related to the raw material in the system. For the ethanolic maceration (EtOH), the THNG and lawsone contents are relative to the amount extracted from the raw material (Figure 1). The lawsone extracted during ethanolic maceration is not considered in Figure 1 due to very low and unquantifiable concentrations. The highest amount of lawsone present in the solution was after 2 h with 1.3% w/w in relation to the extracted raw material. At this time, there was still a significant amount of THNG in the solution that was yet to be hydrolyzed (0.5% w/w). Instead of a steady increase in lawsone until all the THNG is hydrolyzed and the respective hydrolawsone is oxidized, a decrease in the lawsone content was observed after just 4 h of extraction. Similar results have been found by Sankar et al. through examining the lawsone release when henna powder is mixed into a paste. This application-related approach found the highest amount of lawsone after 4 h with a following decline in the orange dye after 6 and 8 h [25].
The discrepancy concerning the timeframe of the highest lawsone content of 4 h by Sankar et al. [25] and 2 h determined in this work can be explained by the difference in the raw material to solvent ratios. It has been found that the larger the ratio of solvent to raw material, the more lawsone can be extracted during an aqueous maceration [26]. Therefore, it is likely that THNG and lawsone diffuse quicker into the solution compared to the paste that Sankar et al. [25] investigated, leading to an overall accelerated reaction process. With the previously reported sensitivity of lawsone to direct sunlight [13,21], the observed decrease in the lawsone content (Figure 1) can be placed into context. The shown maceration was performed at room temperature (RT) without preventing UV light contact. Kavepour et al. detected a drop in the lawsone content by 59% after just 5 h. In this study, a loss of 23% from 2 to 4 h can be seen. The lawsone content after 24 h is comparable to the one after 4 h. These findings underline the vulnerability of the aqueous henna extraction process and show why assessing the raw material exclusively on the basis of the lawsone content does not provide the necessary information to decide upon the safe usage and material quality.
The aforementioned complexity when extracting and analyzing Lawsonia inermis L. can be avoided by choosing a solvent in which the β-glucosidase is neither soluble nor active, but one that dissolves lawsone as well as THNG. By considering these prerequisites, the status quo of the substances in the dried leaves can be recorded without factoring in the naturally occurring hydrolysis of THNG in an aqueous medium. When using ethanol as a solvent, a constant increase in the THNG content can be observed over the span of 24 h (Figure 1), whereas lawsone cannot develop during the process, which explains the undetectable amounts of <0.05% w/w found after 24 h of maceration. Contrary to lawsone, THNG is stable in aqueous and ethanolic solution and does not seem to be affected by auto-oxidation due to atmospheric oxygen or UV-light. The THNG content after 24 h amounts to 3.4 ± 0.40%, which would be equivalent to a lawsone content of 1.8%. This is not only 0.5% w/w more than recorded during the aqueous maceration at the time of the highest lawsone content (1.3% at 2 h), but also 29% more than the specified maximum amount of lawsone that Lawsonia inermis L. material should exhibit for it to be considered safe to use by the SCCS [12].
As shown by the aqueous maceration, it is unlikely that this amount of lawsone would be available all at once, but by changing the temperature, light access, or waiting time before application when forming a paste, the consumer can very easily influence the lawsone release, especially the concentration at the time of application. The SCCS merely states that the paste should be made with boiling water and left to cool before applying [12]. But the time between making and applying the paste is crucial for lawsone to develop, demonstrating the need for a standardized quality control method for the raw material, focusing on hennosides as well as lawsone.

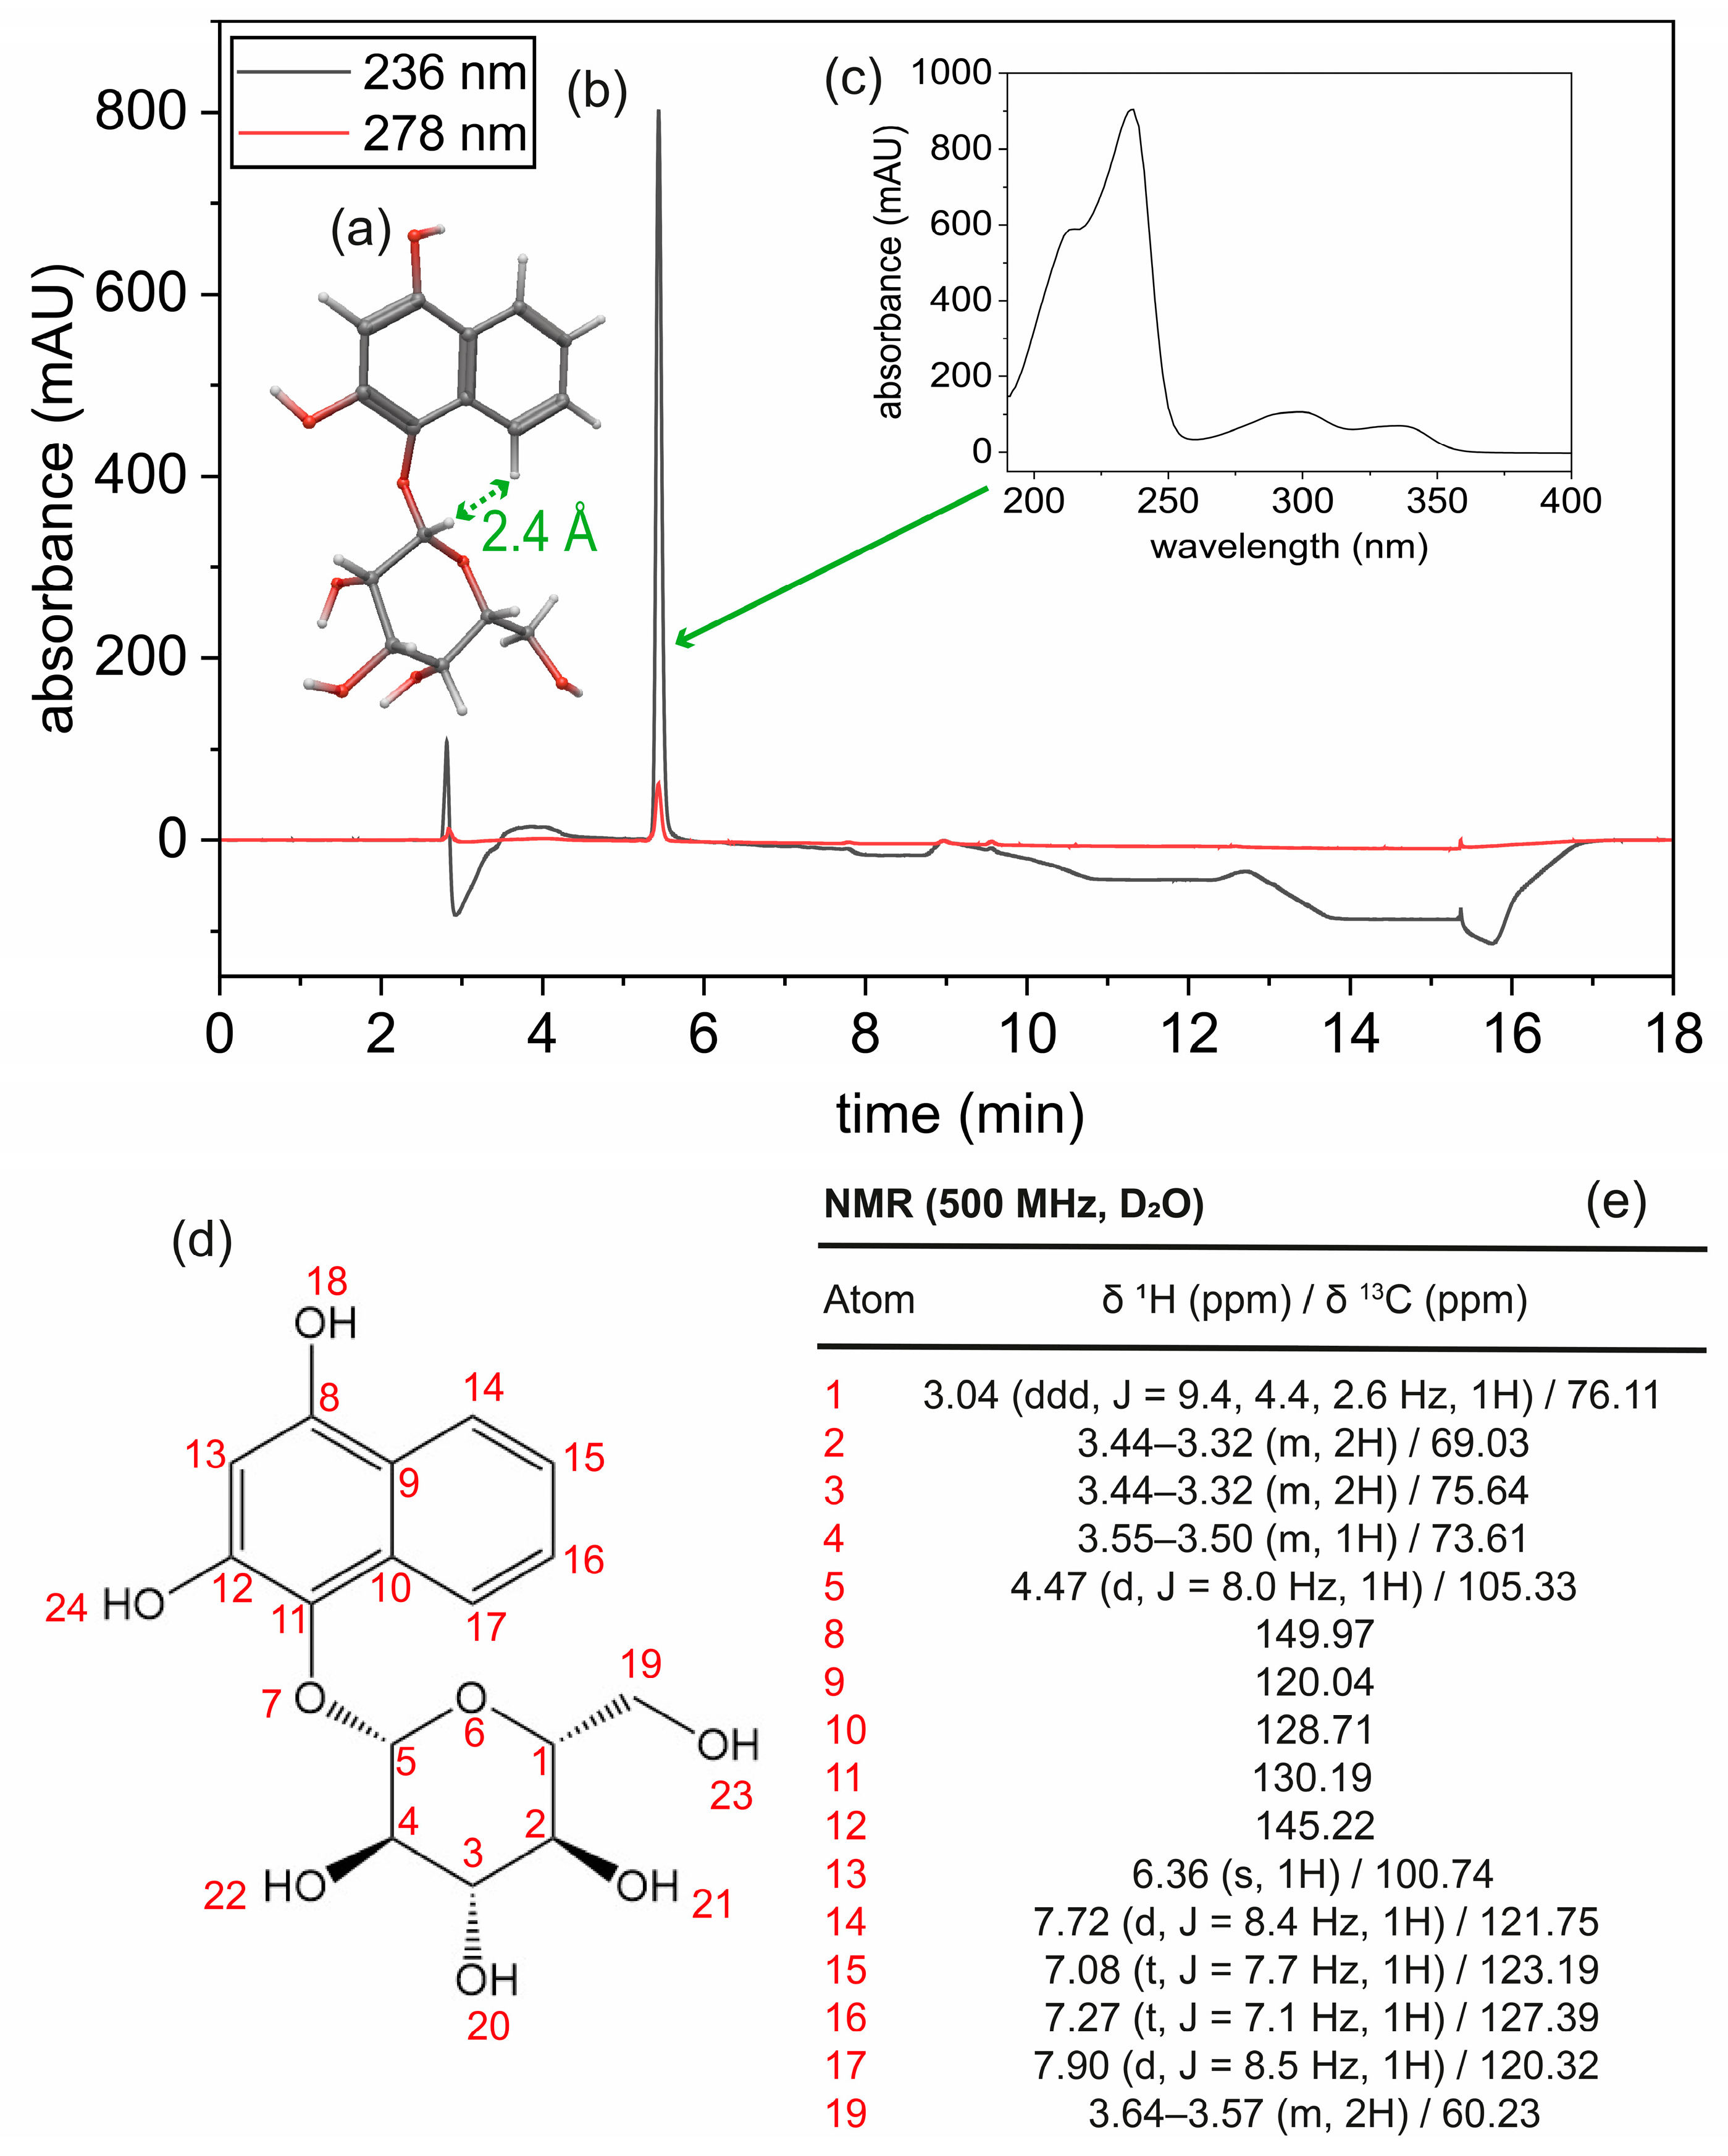
3.2. Structure Determination and Characterization of Isolated Hennoside Sample

The combined hennoside fractions were dried to a beige powder (ESI-TOF m/z 361.093 [M + Na]+). The mass data aligned with previously published findings describing several lawsone derivates in henna, including 1,2,4-trihydroxynaphthalene-1-O-glucoside by HRESIMS (m/z 361.08951 [M + Na]+) [15].
First, 1D NMR data were analyzed by assigning all visible 1H and 13C signals to the three hennosides, respectively (Figures S2 and S3 Supplementary Material). Hydroxy groups such as on position 18 and 24 were not visible in the 1H spectrum due to the usage of deuterated water as a solvent and the consequent exchange of protons. It could be proven that the sample contained a high amount of the expected substance with little to no impurities (Figure 2d,e, Figure S2 Supplementary Material). The 1H results are comparable to findings from Maslovaríc et al. for hennoside A in deuterated methanol [27], where they reported signals for H17 at 8.00 ppm (d, J = 8.1 Hz) and H14 at 7.42 ppm (d, J = 8.1 Hz). The reported signal for H14 in this work is a little further downfield at 7.72 ppm (d, J = 8.4 Hz, 1H) which could be due to the different solvents used. Reported signals by Maslovaríc et al. [27] for H16 (7.22 ppm, t, J = 8.1 Hz) and H15 (7.07, d, J = 8.1 Hz) are very similar to the signals at hand (Figure 2e). Maslovaríc et al. [27] reported the prominent singlet for H13 at 6.48 ppm vs. 6.36 ppm noted in this work. The glucose moieties show similar signals as well: 4.58 ppm (d, J = 6.5 Hz) for H5 and 3.80–3.26 ppm for H1–H4 [27].
1H-13C HSQC and 1H-1H COSY data confirmed the glucose moiety (Figures S4 and S5 Supplementary Material). 1H-1H COSY signals for the aromatic structure (Figure 2d) could prove connectivity without clarifying the composition of the sample. For hennoside A, the HMBC signal due to the interaction of 11C and 17H (Figure 2d, Figure S6 Supplementary Material) was clearly visible. The presence of hennoside B (1,2,4-trihydroxynaphthalene-2-O-glucoside) was ruled out due to a discrepancy between predicted 13C shifts and the observed signals, as well as a missing strong HMBC signal (3-bond) between a carbon and proton in the aromatic structure (Figures S6 and S7 Supplementary Material). Making use of predicted 3D structures for all three hennosides applying energy minimized conformations [22]. HMBC and NOESY results were checked for the predicted signals. By measuring the distance between essential protons (Figure S7 Supplementary Material), the presence of hennoside C (1,2,4-trihydroxynaphthalene-4-O-glucoside) was ruled out. An expected strong-to-medium NOE signal, due to the short distance between a proton in the aromatic structure and the one at C4 (Figure 2d, Figures S7 and S8 Supplementary Material) in the glucose moiety, was absent. The interaction between 5H and 17H of hennoside A and the associated strong NOE signal as well as fitting 1D signals and 1H-13C HMBC results confirm the sole presence of hennoside A in the sample (Figures S6–S8 Supplementary Material).
To further characterize the isolated hennoside A and its suitability as a reliable standard, HPLC data were collected (Figure 2b). The chromatogram shows a strong peak at min 5.4 (236 nm), indicating hennoside presence. Tříska et al. isolated 1,2,4-trihydroxynaphthalene-1-O-glucoside from ethyl acetate extracts of Impatiens glandulifera Royle plants, showing an identical UV-profile to THNG found in the Moroccan henna raw material (Figure 2c) [28]. Small peaks at min 2.5 and 4 are due to the solvent mixture of ethanol and ultra-pure water in which the sample was dissolved before injection. The additional wavelength of 278 nm was chosen to show any lawsone impurities since the dye shows a maximum absorbance at the said wavelength. By using the mentioned HPLC method, lawsone would be detectable at min 8.7 where there was no peak observed (Figure 2b), emphasizing the high purity of the isolated hennoside A. Considering the shown data, it can be assumed that the isolated sample contains a high amount of hennoside A and can, therefore, be used as a standard for all following HPLC analysis.

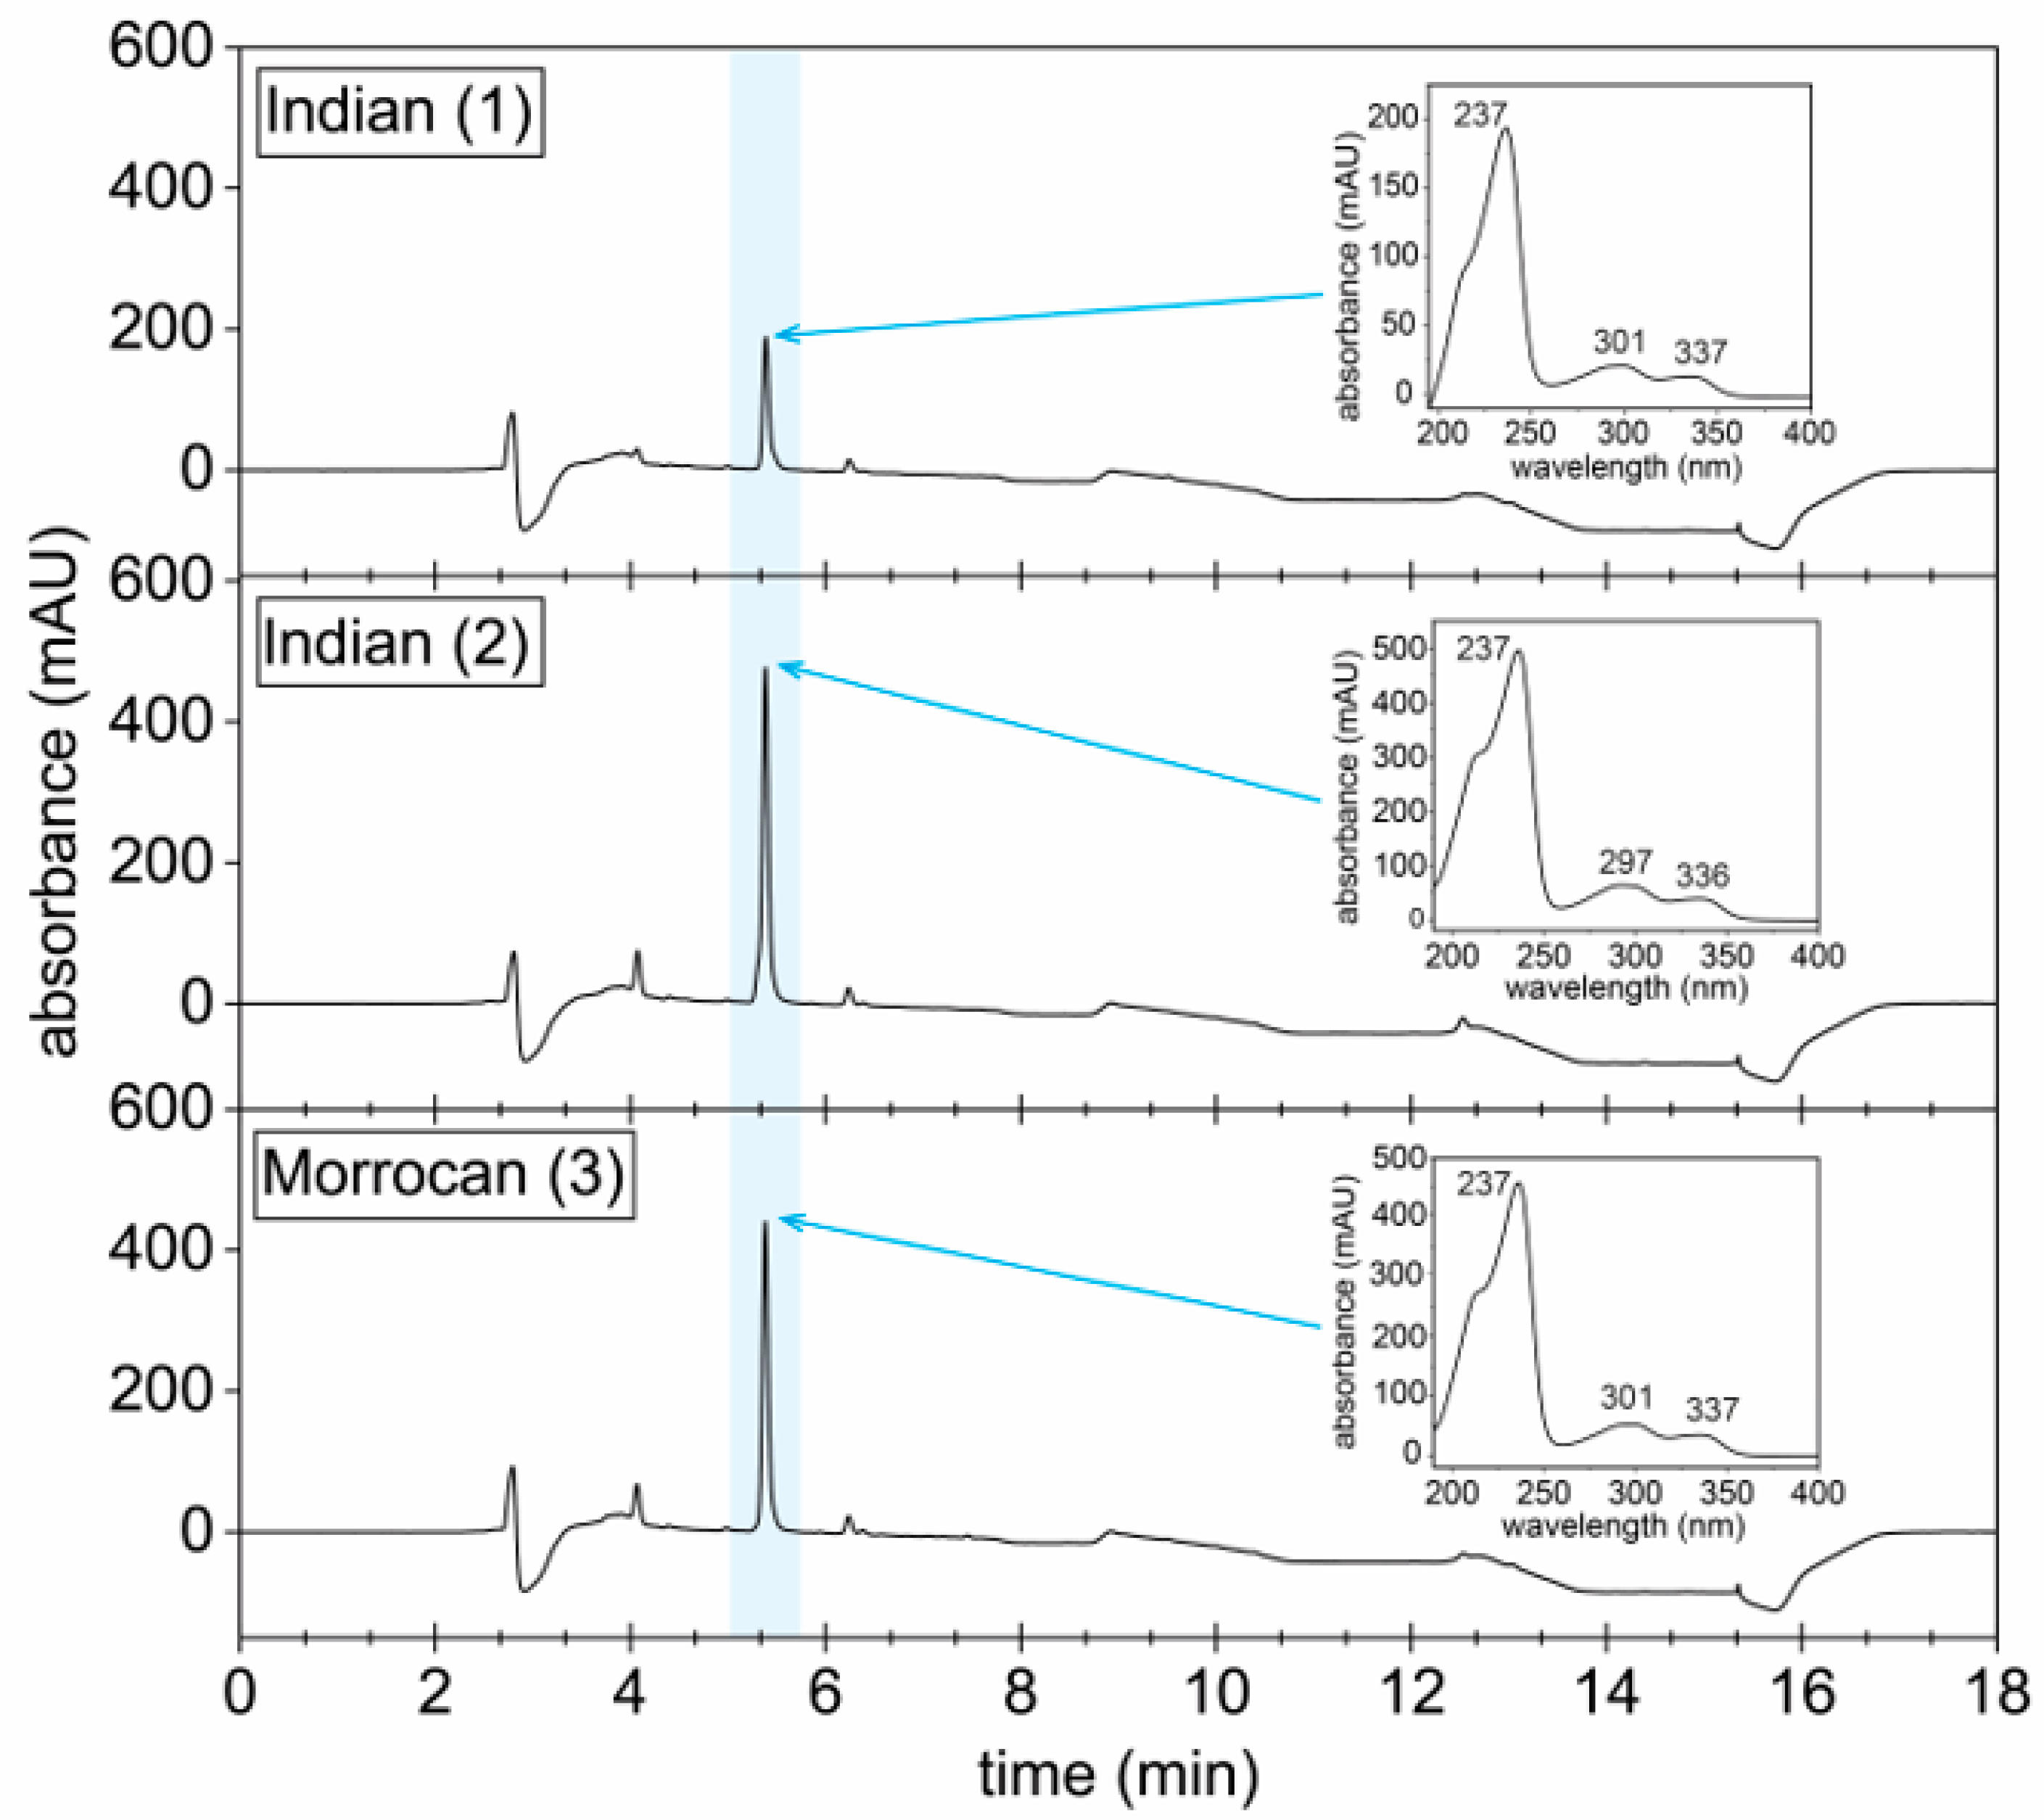
3.3. Development of a Hennoside Quantification Method via HPLC

After 24 h of acidic hydrolysis, almost all hennoside was hydrolyzed, with the majority being converted to lawsone, proving the correct peak assignment for the glycosylated precursor. Exposing the heat-denatured aqueous extract (HD) in a mixture of ultra-pure water, ethanol, and HCl (37%) to 100 °C for 24 h led to the almost complete decomposition of hennoside (Figure 3). The HPLC profile before hydrolysis showed a sharp peak at min 5.4 and no detectable peak at min 8.7, implying the presence of hennoside A and the absence of lawsone. The HPLC profile after 24 h showed a distinct peak at min 8.7, indicating the development of lawsone during the hydrolysis process.
Thus far, the quality and safety assessment of the henna raw material has been heavily based on the lawsone content. Our findings demonstrate that the naturally occurring hennosides, in this case, hennoside A, 1,2,4-trihydroxynaphthalene-1-O-glucoside specifically, are the main sources for developed lawsone and are, thereby, suitable to be used as a reliable alternative for the quality control of the Moroccan henna raw material at hand. This method could be applicable to different raw materials containing hennoside B and C as well as A. The preliminary analyses demonstrated that the Indian henna material containing all three isomers according to the manufacturer (Figure 4, Indian (1)) and another Indian raw material (Figure 4, Indian (2)) exhibited a peak pattern for hennosides similar to hennoside A in the Moroccan raw material (Figure 4, Moroccan (3)). This confirms the successful quantification of all present isomers under a single peak. The UV-profiles of the individual THNG peaks for all raw materials are nearly identical, emphasizing the presence of hennoside. The isomers cannot be distinguished solely by UV-Vis spectroscopy, as the attachment of the glucose moiety to different hydroxyl positions exerts only a minimal influence on the π–electron system of the aromatic naphthalene core. Due to the simplicity and brevity of the proposed method, the total amount of lawsone that could be released can easily be calculated by considering the total hennoside amount found in the raw material regardless of isomerization. Maceration in ethanol over 24 h extracted 1.89 ± 0.05% w/w THNG for the Indian raw material (1), 4.50 ± 0.09% w/w for the Indian raw material (2), and 3.89 ± 0.03% w/w THNG for the Moroccan material. These quantities equate to a maximum of 0.97 ± 0.03% w/w (1), 2.32 ± 0.05% w/w (2), and 2.00 ± 0.02% w/w (3) of lawsone.
Through the controlled acidic hydrolysis of the heat-denatured aqueous extract (HD), we could show that the qualitative analysis of hennoside through lawsone release is possible (Figure 3). Regarding the quantitative analysis, the mentioned aqueous maceration of henna raw material (Figure 1) depicted the limitations and lack of reliability of lawsone as the sole marker. Using acidic hydrolysis to initiate the lawsone release, we could enforce the reaction strategically and compare both approaches over the course of 6 h for HD and ethanolic extract (EE), respectively (Figure 5). Using EE as the source for the hennoside and by eliminating the presence of the enzyme, the possible interaction of newly released lawsone with amino acids of any protein present in solution could be ruled out. Since the orange dye is known to covalently bind to keratin via the Michael addition [24], the interaction between the released lawsone and the proteinaceous material left in the solution was disabled, thereby also avoiding the potential undetectability of lawsone that has covalently bound and is no longer detectable as such through HPLC analysis.
During the acidic hydrolysis of HD, an alignment of both quantification methods was observed. Especially in the beginning stages of the hydrolysis, the amount of hennoside A that was hydrolyzed and quantified by the isolated standard was higher than the amount quantified through the lawsone present in the solution. This phenomenon was more pronounced for the acidic hydrolysis of the ethanolic Soxhlet extract (EE). Within the first hour of hydrolysis, the discrepancy between the two quantification methods was the highest. At min 40, the amount quantified via the THNG standard for hydrolysis of HD was 18.3%, whereas the amount of lawsone present equated to only 14.6% of hydrolyzed THNG. During the hydrolysis of EE, the amount of THNG hydrolyzed and quantified by the THNG standard amounted to 47.1%, whereas the detectable lawsone quantity was equivalent to only 24.4% THNG. Regarding HD hydrolysis, the quantification methods never fully align since the oxidation of hydrolawsone is extremely slow at a low pH and a constant hydrolawsone peak is visible in the HPLC profile of the analyzed aliquots (Figure S9). The hydrolysis of HD proceeded at a steady rate, only leveling off around min 180 where the amount of THNG hydrolyzed and quantified via the THNG standard amounted to 69.2% with 58.3% of THNG hydrolyzed when quantifying via the released lawsone. The difference between the quantification methods decreased with time; at min 320, quantification via the THNG standard showed 76.9% of hydrolyzed THNG, while the lawsone present corresponded to 73.7% of hydrolyzed THNG.
Especially within the first hour of hydrolysis, THNG was quickly hydrolyzed without the associated lawsone development at the same rate. This is due to the oxidation step between deglycosylation and final lawsone formation. The intermediate hydrolawsone seems to oxidize noticeably slower than THNG is hydrolyzed by the enzyme or acidity, explaining the discrepancies between the two approaches of quantification. Even though both quantification methods are comparable after 360 min, there was still over 18% THNG present in the solution which was not yet hydrolyzed. This implies that 6 h of acidic hydrolysis at pH 1 is not enough to release and quantify the total maximum amount of lawsone that can be released from the extract. By acidifying the solution further, we were able to speed up the hydrolysis, but oxidation from hydrolawsone to lawsone could not be sped up. Similar to the extremely decelerated auto-oxidation of polyphenols at a low pH [29], the slowed oxidation of hydrolawsone highlights the limitation of using controlled acidic hydrolysis to analyze the total lawsone content. Harsher reaction conditions might also promote the interaction and reaction of other components in the solution with the released lawsone as well as with each other.
Depending on the total amount of hennoside present in the system, as well as the composition of the extract, the detectable amount of lawsone after 360 min varies (Figure 5). The hydrolysis of HD showed more than 18% THNG left for hydrolysis after 6 h, the hydrolysis of EE only 6%. The ethanolic Soxhlet extract (EE) contained more hennoside and chlorophyll than HD as well as other more lipophilic compounds due to the different solvents and extraction methods. HD extract contained 11.3 ± 0.7% THNG whereas EE showed a THNG content of 17.2 ± 0.6%, measured by isolated THNG as a reference. This essential distinction cannot be made if relying on the amount of lawsone quantified after the alleged termination of hennoside hydrolysis. The acidic hydrolysis of EE clearly shows the limitations of the quantification method via a lawsone release. During the initial stages, THNG undergoes rapid hydrolysis, leading to the formation of hydrolawsone, which is subsequently oxidized at a slower rate to ultimately yield lawsone. As hydrolysis progresses, both quantification methods converge, particularly towards the later stages (after approximately 180 min), when the hydrolysis of hennoside decelerates. At this point, the existing hydrolawsone continues to oxidize to lawsone, while no additional hydrolawsone is generated due to the depletion of THNG. The acidic hydrolysis of two different extracts showed that the quantification of THNG via a lawsone release is possible but flawed. Harsh reaction conditions with a pH of 1 or lower are needed to hydrolyze the hennoside without the addition of enzymatic catalysis. The hydrolysis process could be slowed down to observe the progression, but total hennoside hydrolysis could not be achieved.
Using the quantifiable hennoside to calculate the maximum amount of lawsone that can be released from an extract or raw material, we can shorten the sample preparation and analysis time immensely. Lawsone does not have to be released to be quantified, thereby avoiding the further processing of the extract. Making use of the analytical method relying on the glycosylated pre-cursors naturally present in the raw material allows for the reflection of the composition present in the leaves and could, therefore, improve the quality control of the henna raw material in the future.
Regarding the slowly proceeding formation of lawsone coupled with its sensitivity in aqueous solution and its tendencies to decompose under the influence of light [13], as well as its overall reactivity, it is safe to assume that the amount of lawsone detected in the solution will likely never add up to the initial concentration of THNG present, similar to the findings during the aqueous maceration (Figure 1). Using acidic hydrolysis to slow down the lawsone release as a means to control the process and ensure the total hydrolysis of THNG and subsequent formation of lawsone does not, therefore, lead to the desired outcome. The quantifiable amount of lawsone after stopping the hydrolysis is severely dependent on the starting concentration of hennoside, the oxidation step from hydrolawsone to lawsone, as well as dependent on other constituents in the extract illustrated by the differing hydrolysis progressions for HD and EE, respectively, under identical conditions (Figure 5). The extraction of the henna raw material with the intention of releasing lawsone either via enzymatically catalyzed or acidic hydrolysis does not guarantee the reliable quantification of the maximum amount of lawsone that can possibly be released from the raw material.
When using henna as a paste with plant material that is rich in hennoside, a similar trend can be detected. It is unlikely that all the hennoside present in the leaves is extracted, hydrolyzed, oxidized, and available as lawsone at the time of application. However, the handling of the paste by the consumer between the preparation and application has a significant impact on the final lawsone concentration and, consequently, on the safety of the product. Factors such as light exposure, pH, and temperature can alter the lawsone content, potentially leading to concentrations in the dye mixture that exceed the safety threshold deemed acceptable for consumer use. The limitation of 1.4% w/w lawsone in powder is equivalent to 0.35% w/w in a paste mixed according to the SCCS with a 1:3 weight ratio of powder to water [12].
Finally, to ensure the complete extraction of hennosides and subsequent calculation of the maximum amount of lawsone which can be released from the raw material, we suggest ethanolic extraction, preferably Soxhlet extraction over 25 cycles and 24 h, at 60 °C and approx. 220 mbar. The solvent should be removed via rotary evaporation. The extraction should be repeated two times. Samples of 0.5, 0.7, and 1.0 mg mL−1 of the dried extracts, respectively, are to be dissolved in a mixture of ultra-pure water and ethanol (7:3 volume ratio) and 100-fold dilutions (ultra-pure water-to-ethanol, 7:3, volume ratio) should be analyzed regarding their THNG and lawsone contents. The percentages in % w/w of the two analytes need be calculated with regard to the amount of raw material extracted to ensure that the raw material used for cosmetic formulations cannot release more than 1.4% of lawsone. With the Moroccan raw material at hand, 4.1 ± 0.67% w/w hennoside could be extracted using Soxhlet. This amounts to a maximum concentration of 2.1% lawsone. When extracting with water and making use of the naturally occurring enzymatic hydrolysis, the point of the highest lawsone concentration is, after 2 h, at 1.3% lawsone, which would align with the safety limitation of max. 1.4% lawsone. The highest concentration recorded during aqueous maceration only represents two thirds of the potential total amount of lawsone that could be released when adjusting the extraction conditions, which is why we suggest using hennosides as the markers for future quality and safety assessments.

4. Conclusions

This study highlights the sensitivity of the lawsone release from henna raw material, proposing an analytical method to determine the hennoside concentration and corresponding to the total amount of lawsone that can be released from Lawsonia inermis L. leaf powder to improve the quality assessment of the raw material used in cosmetic formulations. It has been demonstrated that aqueous extraction is not an optimal method for determining the maximum amount of lawsone released from the raw material due to the complexity of the release mechanism, as well as lawsone’s inherent reactivity and instability. Using hennosides as one of the essential markers for quality control, the total potential lawsone release can be determined without dependency on the enzymatic or acid-catalyzed lawsone release and its vulnerability. The proposed method is robust, applicable to various types of henna raw materials, and highly time efficient. By extracting henna with ethanol, the hennosides are removed from the raw material without hydrolyzing and converting to lawsone. Without the lawsone release being initiated, hennosides are very stable in ethanol and water, illustrating their suitability to be used as a marker for quality control and subsequent safety assessments of Lawsonia inermis L. leaf powder in the future.

Supplementary Materials

The following supporting information can be downloaded at: https://www.mdpi.com/article/10.3390/cosmetics12030099/s1, Figure S1: HPLC profiles of a solvent blank (volume ratio of ultra-pure water and ethanol of 7:3) at 236 nm and 278 nm, an aqueous extract containing both hennoside (THNG) and lawsone. The sample was prepared by maceration of 1 g Moroccan raw material in ultra-pure water. After 30 min, a 100-fold dilution (ultrapure-water to ethanol, 7:3 volume ratio) was measured. Lastly, chromatograms of a THNG standard (7.5 µg mL−1) at 236 nm and a lawsone standard (7.5 µg mL−1), both in a volume ratio of ultra-pure water and ethanol of 7:3. Samples were measured via RP-HPLC with ultra-pure water + 0.1% v/v formic acid and acetonitrile as eluents using a RP-C18 column. The gradient is illustrated by the amount of Acetonitrile (ACN) in % throughout the elution; Figure S2: 1H spectrum of the isolated 1,2,4-trihydroxynaphthalene-1-O-glucoside sample, solvent: D2O, 500 MHz, assigned signals, multiplets and integrals are marked; Figure S3: 13C spectrum of the isolated 1,2,4-trihydroxynaphthalene-1-O-glucoside sample, solvent: D2O, 500 MHz; Figure S4: COSY spectrum of the isolated 1,2,4-trihydroxynaphthalene-1-O-glucoside sample, solvent: D2O, 500 MHz; Figure S5: HSQC spectrum of the isolated 1,2,4-trihydroxynaphthalene-1-O-glucoside sample, solvent: D2O, 500 MHz, Figure S6: HMBC spectrum of the isolated 1,2,4-trihydroxynaphthalene-1-O-glucoside sample, solvent: D2O, 500 MHz, missing 3-bond signal expected for interaction between 11C–17H in hennoside B (Figure S4) marked in green. C11–H17 interaction of assigned in hennoside A marked in blue, interaction between C11–H5 assigned in hennoside A marked in purple; Figure S7: predicted three-dimensional structures of all three mono-glycosidic hennosides applying energy minimization according to MMF94 [22], (a) hennoside A, the measured distances between H5 and H17 of 2.4 Å and 5.3 Å between H13 and H4 marked in green; (b) hennoside B, the measured distances between H5 and H17 of 5.9 Å and 5.3 Å between H5 and H13 marked in green (c) hennoside C, the measured distances between H5 and H14 of 2.3 Å and 2.6 Å between H4 and H13 marked in green; two-dimensional structure of hennoside A (d), B (e) and C (f) with consecutively numbered carbons and hydroxy groups in red; Figure S8: NOESY spectrum of the isolated 1,2,4-trihydroxynaphthalene-1-O-glucoside sample, solvent: D2O, 500 MHz, missing predicted NOE signal due to the short distance of 2.6 Å of H4 and H13 in hennoside C marked in green; Figure S9: HPLC profile of a 100-fold dilution of an acidic hydrolysis of an aqueous extract (HD, 78 mg) in 100 mL acidified mixture of ultra-pure water and ethanol (volume ratio of 7:3) and 2 mL 37% HCl after 40 min of hydrolysis. Samples were measured via RP-HPLC with ultra-pure water + 0.1% v/v formic acid and acetonitrile as eluents using a RP-C18 column. Hennoside A (THNG), hydrolawsone and lawsone signals are marked.

Author Contributions

Conceptualization, N.D. and F.S.; methodology, N.D.; software, N.D.; validation, N.D., F.S. and V.V.; formal analysis, N.D.; investigation, N.D.; resources, F.S. and V.V.; data curation, N.D.; writing—original draft preparation, N.D.; writing—review and editing, N.D. and F.S.; visualization, N.D.; supervision, F.S. and V.V.; project administration, F.S. and V.V.; funding acquisition, F.S. All authors have read and agreed to the published version of the manuscript.

Funding

This work was carried out with financial support from HAMBURGISCHE INVESTITIONS- UND FÖRDERBANK (Hamburg, Germany).

Institutional Review Board Statement

Not applicable.

Informed Consent Statement

Not applicable.

Data Availability Statement

The original contributions presented in this study are included in this article/Supplementary Materials. Further inquiries can be directed to the corresponding author.

Acknowledgments

The authors express their gratitude to the Mass Spectrometry team at the University of Hamburg for their valuable support.

Conflicts of Interest

The authors declare no conflicts of interest. The funders had no role in the design of this study; in the collection, analyses, or interpretation of data; in the writing of the manuscript; or in the decision to publish the results.

Abbreviations

The following abbreviations are used in this manuscript:
ACNAcetonitrile
COSYHomonuclear Correlation Spectroscopy
conc.LawsoneLawsone concentration
conc.THNG1,2,4-trihydroxynaphthalene-1-O-glucoside concentration
CspConcentration spiked sample
CunConcentration unspiked sample
CaddFixed Concentration of sample added for sample spiking
EEEthanolic Soxhlet Extract
ESI-TOFElectrospray Ionization-Time of Flight
EtOHEthanol
FIDFree Induction Decay
HClHydrochloric Acid
HDHeat-Denatured Aqueous Extract
HMBCHeteronuclear Multiple-Bond Correlation
HPLC-MS-MSHigh Performance Liquid Chromatography-Tandem Mass Spectrometry
HRESIMSHigh Resolution Electrospray Ionization Mass Spectrometry
HSQCHeteronuclear Single Quantum Coherence
IPAIsopropyl alcohol
LODLimit of Detection
LOQLimit of Quantification
NMRNuclear Magnetic Resonance
NOESYNuclear Overhauser Effect Spectroscopy
RLPAResponse 1,2,4-trihydroxynaphthalene-1-O-glucoside Peak Area
RLPHResponse 1,2,4-trihydroxynaphthalene-1-O-glucoside Peak Height
RP-HPLCReverse Phase-High Performance Liquid Chromatography
RP-TLCReverse Phase-Thin Layer Chromatography
RSDRelative Standard Deviation
SCCSScientific Committee of Consumer Safety
SDStandard Deviation
THNG1,2,4-trihydroxynaphthalene-1-O-glucoside
UPWUltra-Pure Water
UVUltra-Violet

References

  1. Kolling, C.; Ribeiro, J.L.D.; de Medeiros, J.F. Performance of the cosmetics industry from the perspective of Corporate Social Responsibility and Design for Sustainability. Sustain. Prod. Consum. 2022, 30, 171–185. [Google Scholar] [CrossRef]
  2. Ajayi, S.A.; Olaniyi, O.O.; Oladoyinbo, T.O.; Ajayi, N.D.; Olaniyi, F.G. Sustainable Sourcing of Organic Skincare Ingredients: A Critical Analysis of Ethical Concerns and Environmental Implications. Asian J. Adv. Res. Rep. 2024, 18, 65–91. [Google Scholar] [CrossRef]
  3. Pop, R.A.; Saplacan, Z.; Alt, M.A. Social media goes green-the impact of social media on green cosmetics purchase motivation and intention. Information 2020, 11, 447. [Google Scholar] [CrossRef]
  4. Turati, F.; Pelucchi, C.; Galeone, C.; Decarli, A.; La Vecchia, C. Personal hair dye use and bladder cancer: A meta-analysis. Ann. Epidemio.l 2014, 24, 151–159. [Google Scholar] [CrossRef]
  5. Franck, H.G.; Stadelhofer, J.W. Industrial Aromatic Chemistry: Raw Materials Processes Products; Springer: Berlin/Heidelberg, Germany, 2012. [Google Scholar]
  6. Mishra, V.; Sharma, U.; Rawat, D.; Benson, D.; Singh, M.; Sharma, R.S. Fast-changing life-styles and ecotoxicity of hair dyes drive the emergence of hidden toxicants threatening environmental sustainability in Asia. Environ. Res. 2020, 184, 109253. [Google Scholar] [CrossRef]
  7. Mukkanna, K.S.; Stone, N.M.; Ingram, J.R. Para-phenylenediamine allergy: Current perspectives on diagnosis and management. J. Asthma Allergy 2017, 10, 9–15. [Google Scholar] [CrossRef]
  8. Komboonchoo, S.; Bechtold, T. A study on the dyeing characteristics and electrochemical behaviour of lawsone-indigo mixtures. Color. Technol. 2011, 127, 153–158. [Google Scholar] [CrossRef]
  9. Sudheer Kumar, K.; Begum, A.; Shashidhar, B.; Meenu, M.; Mahender, C.; Sai Vamsi, K. Formulation and Evaluation of 100% Herbal Hair Dye. Int. J. Adv. Res. Med. Pharm. Sci. 2016, 1, 1–5. [Google Scholar]
  10. Bhuvaneswari, S.S.; Prabha, T.; Begum, S.S.; Sivakuamr, T.; Saranraj, P.; Manivannan, V.; Kumar, B.A. Formulation and evaluation, comparison of herbal hair dye with marketed formulation. Ann. Phytomed. Int. J. 2021, 10, 175–181. [Google Scholar] [CrossRef]
  11. Patni, P.; Gahtori, A.; Bhandari, P.; Dimri, T.; Ahmad, M. The Herbal Hue: Formulation and Evaluation of Herbal Hair Dye. Pharmacogn. Res. 2024, 16, 294–299. [Google Scholar] [CrossRef]
  12. European Commission. Directorate General for Health & Consumers. In Opinion on Lawsonia inermis (Henna): COLIPA n° C169; European Commission: Brussels, Belgium, 2013. [Google Scholar]
  13. Alem, F.Z.; Gita, S.A.; Cougnaud, L.; Affnar, C.; Nounah, I.; Youssef, B.; de Oliveira, A.L.; Charrouf, Z.; Rhourri-Frih, B. Lawsone quantification in Lawsonia inermis L. by HPLC-MS: How does the temperature and pluviometry affect lawsone concentration? Ind. Crops Prod. 2020, 158, 112960. [Google Scholar] [CrossRef]
  14. Dhouafli, Z.; Ben Jannet, H.; Mahjoub, B.; Leri, M.; Guillard, J.; Saidani Tounsi, M.; Stefani, M.; Hayouni, E.A. 1,2,4-trihydroxynaphthalene-2-O-β-D-glucopyranoside: A new powerful antioxidant and inhibitor of Aβ42 aggregation isolated from the leaves of Lawsonia inermis. Nat. Prod. Res. 2019, 3, 1406–1414. [Google Scholar] [CrossRef] [PubMed]
  15. Hsouna, A.B.; Trigui, M.; Culioli, G.; Blache, Y.; Jaoua, S. Antioxidant constituents from Lawsonia inermis leaves: Isolation, structure elucidation and antioxidative capacity. Food Chem. 2011, 125, 193–200. [Google Scholar] [CrossRef]
  16. Suwama, T.; Watanabe, K.; Monthakantirat, O.; Luecha, P.; Noguchi, H.; Watanabe, K.; Umehara, K. Naphthalene glycosides in the Thai medicinal plant Diospyros mollis. J. Nat. Med. 2018, 72, 220–229. [Google Scholar] [CrossRef]
  17. Van Thanh, N.; Thao, N.P.; Dat, L.D.; Huong, P.T.T.; Lee, S.H.; Jang, H.D.; Cuong, N.X.; Nam, N.H.; Van Kiem, P.; Van Minh, C.; et al. Two new naphthalene glucosides and other bioactive compounds from the carnivorous plant Nepenthes mirabilis. Arch. Pharm. Res. 2015, 38, 1774–1782. [Google Scholar] [CrossRef]
  18. Chen, X.; Quek, S.Y.; Fedrizzi, B.; Kilmartin, P.A. Characterization of free and glycosidically bound volatile compounds from tamarillo (Solanum betaceum Cav.) with considerations on hydrolysis strategies and incubation time. LWT 2020, 124, 109178. [Google Scholar] [CrossRef]
  19. Minami, Y.; Nishimura, O.; Hara-Nishimura, I.; Nishimura, M.; Matsubara, H. Tissue and Intracellular Localization of Indican and the Purification and Characterization of Indican Synthase from Indigo Plants. Plant Cell Physiol. 2000, 41, 218–225. [Google Scholar] [CrossRef]
  20. Duroux, L.; Delmotte, F.M.; Lancelin, J.-M.; Ravis, K.; Jay-Allemand, C. Insight into naphthoquinone metabolism: β-glucosidase-catalysed hydrolysis of hydrojuglone β-D-glucopyranoside. Biochem. J. 1998, 333, 275–283. [Google Scholar] [CrossRef]
  21. Kavepour, N.; Bayati, M.; Rahimi, M.; Aliahmadi, A.; Nejad Ebrahimi, S. Optimization of aqueous extraction of henna leaves (Lawsonia inermis L.) and evaluation of biological activity by HPLC-based profiling and molecular docking techniques. Chem. Eng. Res. Des. 2023, 195, 332–343. [Google Scholar] [CrossRef]
  22. Halgren, T.A. Merck molecular force field. I. Basis, form, scope, parameterization, and performance of MMFF94. J. Comput. Chem. 1996, 17, 490–519. [Google Scholar] [CrossRef]
  23. European Medicines Agency. ICH Q2(R2) Guideline on Validation of Analytical Procedures—Step 5; EMA/CHMP/ICH/82072/2006; Committee for Medical Products for Human Use: London, UK, 2024.
  24. Derksen, G.C.H.; Bechtold, T. Natural Colorants—Quinoid, Naphthoquinoid, and Anthraquinoid Dyes. In Handbook of Natural Colorants, 2nd ed.; Bechtold, T., Mussak, R., Eds.; Wiley-VCH: Weinheim, Germany, 2023; pp. 271–315. [Google Scholar] [CrossRef]
  25. Sankar, J.; Kini, M.; Mhaskar, S.; Sangle, P. Estimation of Lawsone Release from Lawsonia inermis Leaf Powder. Trends Agric. Sci. 2022, 1, 28–34. [Google Scholar] [CrossRef]
  26. Syafaatullah, A.Q.; Setyorini, D.; Ganing, M.; Panjaitan, R.; Azizah, N. Optimization and Kinetics Extraction of Natural Dyes from Henna Leaves (Lawsonia inermis L.) with Ultrasonic Assistance. J. Kim. Sains Apl. 2023, 26, 324–331. [Google Scholar] [CrossRef]
  27. Maslovarić, I.; Ilić, V.; Drvenica, I.; Stančić, A.; Mojsilović, S.; Kukolj, T.; Bugarski, D.; Saso, L.; Nicoletti, M. Insight into the Biological Activity of Hennosides—Glucosides Isolated from Lawsonia inermis (henna): Could They Be Regarded as Active Constituents Instead. Plants 2021, 10, 237. [Google Scholar] [CrossRef] [PubMed]
  28. Tříska, J.; Vrchotová, N.; Sýkora, J.; Moos, M. Separation and identification of 1,2,4-trihydroxynaphthalene-1-O-glucoside in Impatiens glandulifera royle. Molecules 2013, 18, 8429–8439. [Google Scholar] [CrossRef]
  29. Mochizuki, M.; Yamazaki, S.; Kano, K.; Ikeda, T. Kinetic analysis and mechanistic aspects of autoxidation of catechins. Biochim. Biophys. Acta 2002, 1569, 35–44. [Google Scholar] [CrossRef]
Figure 1. Bar chart of hennoside A (THNG) and lawsone concentrations in % w/w of the extracted henna raw material over the span of 24 h comparing 1% w/v aqueous (H2O) (n = 3) and 1% w/v ethanolic (EtOH) (n = 3) maceration. * = concentration of THNG under the LOD (0.05 µg mL−1), error bars show standard deviations of n = 3.
Cosmetics 12 00099 g001
Figure 2. (a) Predicted three-dimensional structure of hennoside A applying energy minimization according to MMF94 [22], with the measured distances between H5 and H17 of 2.4 Å marked in green; (b) HPLC profile of an isolated hennoside A sample (7.5 µg mL−1 in ultra-pure water and ethanol, 7:3) at wavelengths of 236 nm and 278 nm; (c) UV profile of hennoside A with an absorption maximum at 236 nm; (d) two-dimensional structure of hennoside A with consecutively numbered carbons and hydroxy groups in red with the assigned 1H and 13C signals recorded in (e).
Cosmetics 12 00099 g002
Figure 3. HPLC profiles of aqueous heat-denatured henna extract (HD) in solution (780 µg mL−1 in ultra-pure water and ethanol, volume ratio of 7:3) before and after 24 h of acidic hydrolysis at 100 °C, at wavelengths 236 nm (black) and 278 nm (red). Hennoside A peaks are highlighted in blue, lawsone peaks are highlighted in orange. The sample was measured in a mixture of ultra-pure water and ethanol 7:3, with a concentration of 78 µg mL−1 of extract.
Cosmetics 12 00099 g003
Figure 4. HPLC profiles of three different henna raw materials after 24 h of ethanolic macerations at RT (10 mg mL−1). Indian (1) is a henna raw material harvested in October 2022; Indian (2) is an Indian henna raw material harvested in October 2021; Moroccan (3) is the henna raw material from Morocco, harvested before November 2021. Samples were measured via RP-HPLC with a 100-fold dilution in 7:3 ultra-pure water-to-ethanol mixture with ultra-pure water + 0.1% formic acid and acetonitrile as eluents using a RP-C18 column. All profiles exhibit the absorbance at 236 nm, the absorption maximum of hennosides. Hennoside peaks are marked in blue. At the highest point of absorbance, spectra of the full UV-profiles were extracted and shown on the right for each sample, respectively.
Cosmetics 12 00099 g004
Figure 5. Bar chart of the hennoside A (THNG) content in the system in % hydrolyzed over 360 min by acidic hydrolysis at pH 1, 100 °C, comparing two extracts, aqueous heat-denatured extract (HD) and ethanolic Soxhlet extract (EE). Quantification of THNG hydrolyzed completed by using isolated THNG as a standard (via THNG stand.) as well as calculating the amount of THNG hydrolyzed by quantifying the amount of lawsone at the given time (via Lawsone stand.).
Cosmetics 12 00099 g005
Table 1. HPLC method validation parameters for lawsone quantification with the linear range of Table 1. The limit of detection (LOD) (µg mL−1), the limit of quantification (LOQ) (µg mL−1), the recovery (%), and the precision (% RSD).
Linearity in the Range of (µg mL−1)LOD
(µg mL−1)
LOQ
(µg mL−1)
Recovery
(%)
Precision
(% RSD)
0.05–11.00.0150.05930.77
Table 2. HPLC method validation parameters for 1,2,4-trihydroxynaphthalene-1-O-glucoside (THNG) quantification with the linear range of the calibration curve (µg mL−1). The limit of detection (LOD) (µg mL−1), the limit of quantification (LOQ) (µg mL−1), the recovery (%), and the precision (% RSD).
Linearity in the Range of (µg mL−1)LOD
(µg mL−1)
LOQ
(µg mL−1)
Recovery
(%)
Precision
(% RSD)
0.2–12.00.060.2930.54
Table 3. Volume % and flow rate in mL min−1 of the eluents (A) ultra-pure water with the addition of 0.1% v/v formic acid and (B) acetonitrile for the duration of the quantification method for hennoside and lawsone.
minUPW + 0.1% v/v
Formic Acid (A)
Acetonitrile %
(B)
Flow Rate (mL min−1)
080201
560401
660401
840601
1040601
1120801
1320801
13.180201
1880201
Table 4. Lawsone and hennoside A (THNG) contents in % w/w and standard deviation (SD) of the extracted henna raw material over the span of 24 h comparing 1% w/v aqueous (n = 3) and 1% w/v ethanolic maceration (n = 3).
TimeLawsone (% w/w) ± SDTHNG (% w/w) ± SD
Aqueous ExtractEthanolic ExtractAqueous ExtractEthanolic Extract
5 min0.3 ± 0.02<0.052.7 ± 0.161.4 ± 0.05
30 min1.0 ± 0.16<0.051.5 ± 0.261.9 ± 0.06
1 h1.2 ± 0.24<0.050.9 ± 0.032.0 ± 0.17
2 h1.3 ± 0.18<0.050.5 ± 0.072.6 ± 0.18
4 h1.1 ± 0.17<0.05<0.22.8 ± 0.17
8 h1.0 ± 0.07<0.05<0.22.9 ± 0.08
24 h1.0 ± 0.11<0.05<0.23.4 ± 0.40
Disclaimer/Publisher’s Note: The statements, opinions and data contained in all publications are solely those of the individual author(s) and contributor(s) and not of MDPI and/or the editor(s). MDPI and/or the editor(s) disclaim responsibility for any injury to people or property resulting from any ideas, methods, instructions or products referred to in the content.

