1. Introduction
Skin ageing is a complex biological process. It is divided into two different types: chronological ageing, which is an inevitable, time-dependent process driven by genetic programming and the gradual decline of cellular functions; and biological ageing, which is triggered by external factors such as environmental pollution, UV radiation, and lifestyle habits [
1]. These external triggers accelerate cellular damage, oxidative stress, and inflammation, leading to premature skin ageing beyond the natural effects of time [
2]. Being the largest organ in the human body, the skin is divided into three main layers—epidermis, dermis and subcutaneous tissue [
3]. Even though all three layers are accountable for skin ageing, the one that is mostly related to it is the dermis. The dermis is composed of fibroblasts, mast cells, macrophages and lymphocytes. As the main producers of extracellular matrix components (ECM)—collagen, collagen fibres and elastic fibres, fibroblasts are the primary type of skin cells, responsible for skin ageing [
4]. The skin ECM provides elasticity, strength and resilience to it. However, with age, fibroblast function declines, and fibroblasts experience senescence [
5]. As senescent cells are not removed by the adaptive immune system, they begin to secrete senescence-associated secretory phenotype (SASP), which hinders growth factor production and impairs proliferation [
5,
6]. This leads to collagen synthesis reduction, matrix degradation, and compromised wound healing, causing visible signs of ageing like wrinkles, firmness reduction, and damage susceptibility.
Effective anti-ageing therapies require not only products, which demonstrate biological efficacy, but are also biocompatible, safe to use and cause minimal side effects, when applied to human skin. Well-known molecules like retinoids have been extensively used in traditional medicine for their ability to promote fibroblast activity, increase collagen production, and reduce visible wrinkles [
7,
8]. However, these benefits are accompanied by some hard-to-ignore side effects. Topical use of retinoids is often related to severe irritation, manifested by dryness, pruritus, erythema, burning sensation and peeling [
9]. On top of that, systemic use of retinoids has been proven to be a cause of muscle pain, headaches, joint, bone and inflammatory back pain [
10,
11,
12]. This has led the cosmetics industry to seek safer alternatives when it comes to battling skin ageing.
One of the most modern trends in cosmetology is the use of naturally derived bioactive molecules, in particular, polyphenols, as a safer alternative. Polyphenols are a diverse group of plant-derived compounds, which have gained attention for their anti-inflammatory, antioxidant and ECM-preserving properties.
Recent advances have highlighted the potential of whole plant in vitro cultures and plant-derived extracellular vesicles (EVs) as rich, sustainable sources of bioactives for cosmetic applications. Plant cell cultures have been successfully implicated in several cosmetic products. For example, cell cultures from
Gossypium herbaceum L. have been used to produce the so-called Arabian Cotton PRCF, which can be found in skincare formulations, due to its photoprotective properties [
13]. Additionally, PhytoCellTec™ nunatak
®, derived from callus cultures of
Saponaria pumila L., has shown a promising effect in improving skin elasticity and maintaining dermal stem cell viability, following sun damage [
13]. Dermasyr 10—derived from
Syringa vulgaris—has been implemented in treating acne and disorders related to sebum production [
14]. Another successfully implemented product—ReGeniStem Brightening, from cell cultures of
Glycyrrhiza glabra, is being used as a dark spot treatment and for overall brightening of the complexion [
14].
To improve the effectiveness of such active ingredients, various nanocarrier systems are being developed to enhance dermal penetration, stability, and targeted delivery. The cosmetics industry frequently utilizes various nanocarriers like niosomes, liposomes, nanocapsules, solid lipid nanoparticles, dendrimers, micelles, and metal nanoparticles [
15]. However, some of these may pose risks of toxicity or adverse effects like inflammation, activation of the innate immune system, or skin irritation. These effects are influenced by factors such as their particle size, composition and surface charge [
16]. To address these concerns, EVs are rapidly gaining popularity due to their beneficial biological properties. EVs are nano-lipid bilayer-enclosed structures, which are being secreted into the extracellular space. They are very diverse when it comes to content, size, and surface markers. Even though for a long time they have been referred to as just debris, modern research has shown that they play important roles in cellular communication and many biological processes [
17]. Furthermore, they are highly tolerated, easily absorbed by cells and can be specifically targeted for uptake by different tissues. Derived from both plant and mammalian sources, EVs have shown therapeutic potential in enhancing skin health through wound healing improvement, pigmentation correction, wrinkle minimizing and scar tissue prevention [
18]. For example,
Aloe vera peel isolated EVs are a contributor to skin rejuvenation, due to their ability to reduce oxidative stress and promote fibroblast migration [
19]. Similarly, EVs from
Panax ginseng have exhibited anti-senescence and anti-pigmentation effects on human skin cells [
20]. In plants, EVs participate in defence mechanisms against pathogens—bacteria, fungi, and viruses [
21] by releasing enzymes (hydrolases) and protective proteins into the extracellular space [
22].
Despite these advancements, the potential of EVs derived specifically from in vitro plant cultures remains underexplored. In contrast with mammalian EVs, research on plant-released EVs, especially by plant in vitro cultures, is quite scarce [
23,
24]. This represents a novel and exciting direction in cosmetic science.
Our research is directed towards evaluating the effects of plant extracts of
Haberlea rhodopensis in vitro culture, as well as in combination with conditioned media, enriched with extracellular vesicles (EVs), on human dermal fibroblasts.
H. rhodopensis is a well-known medicinal plant, commonly used in folklore medicine, endemic in the Rhodope Mountains on the Balkan Peninsula. Its metabolic profile contains a diverse set of molecules like phenolic acids, flavonoids, carotenoids, polysaccharides, polyols and free sugars [
25]. It has gained popularity due to its resurrection properties, as it is able to withstand prolonged periods of drought [
26]. Studies have shown that
H. rhodopensis possesses high antioxidant properties and stimulates the production of ECM proteins [
27]. Additionally, it has anti-inflammatory and radiation-protective functions [
25,
28].
The current paper focuses on the biosafety and potential anti-ageing properties of H. rhodopensis in vitro culture extracts, in combination with conditioned medium, enriched with EVs. What we have shown is that the studied extracts promote cellular health, enhance mitochondrial function, and upregulate collagen-related genes without inducing genotoxicity.
2. Materials and Methods
2.1. H. rhodopensis In Vitro Culture Extract and Conditioned Medium
The ethanol extract from
H. rhodopensis in vitro culture and the conditioned medium from cultivation have been generously provided by Innova BM Ltd., Bulgaria
https://innovabm.com/ (accessed on 10 March 2025). The extract was evaporated under vacuum (50 °C), and the water residue was freeze-dried (Biobase, BK-FD12S, Jinan Biobase Medical Co., Ltd., Jinan, China) and used for extract preparation.
Sterile-conditioned medium from
H. rhodopensis in vitro culture, cultivated for 30 days on the liquid medium according to conditions described elsewhere [
29], centrifuged at 5000 rpm for 30 min to remove the cell debris, and then the supernatant was filtered by a sterile 0.8 µm syringe filter (Ministar NML, Sartorius Stedim Biotech GmbH, Goettingen, Germany) and used for extract preparation and exosomes isolation.
Two types of extracts, namely Extract 1 and Extract 2, have been prepared. Extract 1 was obtained by dissolving 375 mg
H. rhodopensis in vitro culture dry extract in 100 mL distilled H
2O (corresponding to a myconoside concentration of 550 mg/L, analyzed by HPLC). Extract 2 was prepared by dissolving 125 mg of
H. rhodopensis in vitro culture dry extract in 100 mL conditioned medium (corresponding to a myconoside concentration of 150 mg/L, analyzed by HPLC). Both extracts were filtered by a sterile 0.45 µm syringe filter (Corning, Corning Incorporated, New York, NY, USA) and used for experiments. Myconoside was used as a marker compound for extract standardization because it is the major bioactive substance in the
Haberlea rhodopensis plant and is considered the main molecule responsible for the skin-beneficial effects of extracts from this species [
27].
2.2. Isolation of Extracellular Vesicles (EVs) from Conditioned Medium of H. rhodopensis In Vitro Culture
For the isolation of EVs, 100 mL of H. rhodopensis in vitro culture-conditioned medium was used. The EVs were isolated by using the exoEasy Maxi Kit (Qiagen, Hilden, Germany), following the manufacturer’s protocol. In total, 2 mL of eluate, with a total protein content of 4.12 µg/mL (Bradford BSA assay, Biochrom WPA Biowave DNA spectrophotometer, Harvard Bioscience, Holliston, MA, USA., with BioDrop Ultimate 500 CUVETTE, BioDrop Ltd., Cambridge, UK) has been obtained. The buffer was exchanged by dialysis with 10 kDa MWCO for 24 h (Slide-A-Lyzer, Thermo Fisher Scientific Inc., Waltham, MA, USA), and the exosomes were filtered by sterile 0.45 µm syringe filter (Corning, Corning Incorporated, New York, NY, USA.) and used for experiments. For the analyses of biological activities, the EV fraction was diluted with sterile water to the amounts, corresponding to the EV contents in 2 mL (2%) and 10 mL (10%) H. rhodopensis in vitro culture conditioned medium.
2.3. Dynamic Light Scattering (DLS) Analyses
Dynamic light scattering (DLS) was used to measure the EV size distribution. The isolated EV fraction was measured by Malvern Zetasizer Nano ZS (Malvern Panalytical Ltd., Worcestershire, UK) with λ = 633 nm laser in backscattering mode at 173° scattering angle.
2.4. Transmission Electron Microscopy (TEM)
To visualize EVs, we applied the negative staining technique. Copper grids for electron microscopy (400 mesh) were used. Before sample loading, the grids were pre-coated with a thin Formvar film. A 10 µL suspension of the pre-isolated EVs was loaded onto the grids in multiple replicates. The samples were left for several minutes to allow the vesicles to adsorb onto the grid surface. As the next step, the loaded samples were fixed with 2% glutaraldehyde for approximately 2 min to preserve the native structure of the EVs. After air drying at room temperature, the samples were contrasted with a 1% uranyl acetate solution to enhance contrast and improve visualization of the objects. Observations were carried out using a high-resolution Transmission Electron Microscope (HR STEM JEOL JEM 2100, JEOL Ltd., Tokyo, Japan) operating at 200 kV, equipped with a CCD camera (GATAN Orius 832 SC1000, Gatan GmbH, München, Germany).
2.5. Cell Culture and Experimental Setup
The BJ cell line (CRL-2522) was obtained from the American Type Culture Collection (ATCC, Manassas, VA, USA). BJ cells are normal human fibroblasts, taken from the foreskin of a neonatal male. These types of cells are a good representative of the human dermal skin layer and have been used for the development of bioengineered skin models [
30]. They are commonly used in ageing and toxicology research [
31,
32,
33]. Cells were cultured in Dulbecco’s Modified Eagle Medium (DMEM) supplemented with 10% fetal bovine serum (FBS) and maintained at 37 °C in a 5% CO
2 humidified incubator. Cells were grown to confluence and harvested 2–3 times weekly by trypsinization.
For in vitro experiments, cells were initially plated at 2.5 × 10⁴ density in 24-well culture plates to evaluate cellular morphology, actin organization, mitochondria, lysosomes, and nucleus, and at a density of 1 × 10⁵ cells for FACS and RT-PCR experiments. After seeding, cells were incubated at 37 °C with 5% CO2 for 24 h to allow attachment and to reach confluency. The following day, cells were treated with test substances (plant extracts and extracellular vesicles (EVs)) and incubated under the same conditions for an additional 24 and 72 h prior to experiments.
2.6. Assessment of Morphological Changes
To assess morphological changes induced by the extracts and EV treatment, cells were examined using a phase-contrast microscope (Axiovert 25, Carl Zeiss, Jena, Germany) at 24 and 72 h post-treatment. Images were captured at 20x magnification.
2.7. Visualization of Actin Organization
For actin visualization, cells were seeded on sterile coverslips, cultured, and treated as described above. Actin staining was performed using rhodamine–phalloidin (Invitrogen, Waltham, MA, USA). Briefly, cells were fixed with 4% paraformaldehyde for 10 min, then permeabilized for 5 min with 0.1% Triton X100, followed by 30 min saturation with 1% bovine serum albumin (BSA) at 37 °C and 5% CO2. The cells were then stained with rhodamine–phalloidin (2:50; Invitrogen, USA) for 45 min in a humidified incubator. Finally, the coverslips were mounted, and fluorescence images were taken on a fluorescent microscope (Axiovert 25, Zeiss, Jena, Germany) 51 with a 40× oil immersion objective.
2.8. Fluorescent Microscopy Assessment of Mitochondrial and Nuclear Morphology
Circular glass coverslips were used to cultivate the cells, each of which was put in an individual well of a 24-well plate, with 2 mL DMEM. Cells were washed gently with 1 mL PBS and then filled again with 1 mL PBS, in which the dyes were diluted. The final concentration of BioTracker 488 Green Mitochondria dye (Merck Bulgaria EAD, Sofia, Bulgaria) was 100 nM, and Hoechst 33,342 (Abcam, Cambridge, UK) was added to a final concentration of 2 µM for nuclear staining. After the addition of the dye, cells were incubated at 37 °C in the dark for 10 min. After incubation, the coverslips were carefully removed from the plate well using tweezers, and any excess liquid was absorbed by gently touching the edge of the coverslip to a paper towel or filter paper. The samples were examined using a fluorescent microscope, Carl Zeiss Axiovert 5, equipped with a Colibri3 multicolour LED light source, by applying a tiny droplet of immersion medium.
2.9. Assessment of Lysosomal Mass by Light Microscopy
Following the same protocol for Assessment of Mitochondrial and Nuclear Morphology, described in point 2.5. Lysosomal mass was measured for both 24 and 72 h treatments with the studied compounds of 2% and 10% Extract 1, Extract 2, and EVs. Neutral Red dye (Valerus, Bulgaria) was used at a final concentration of 277 µM. Lysosomal mass was measured according to stain intensity.
2.10. Single Cell Gel Electrophoresis (SCGE), Also Named Comet Assay
The SCGE procedure was performed according to a previously established protocol [
34]. Cells were mixed with 0.7% (
w/
v) low-gelling agarose (Sigma-Aldrich, Darmstadt, Germany) in order to make microgels. This was followed by the use of a lysing solution containing 146 mM NaCl, 30 mM EDTA (pH 7), 10 mM Tris-HCl (pH 7), and 0.1% N-lauroylsarcosine (NLS, Sigma-Aldrich, Germany) for 20 min at 4 °C. Afterwards, the microgels were washed in 0.5xTBE buffer twice. Electrophoresis was then performed under a voltage of 0.46 V/cm for 10 min. For visualization, SYBR green (Molecular Probes, Invitrogen) was used to stain the microgels, which were then examined under a fluorescent microscope. Analysis was performed using the CometScore software 2.0 (TriTek Corp., 2.0; USA).
2.11. Fluorescence Activated Cell Sorting Analysis (FACS)
Cell cycle analysis via FACS was performed at the 24th and 72nd hour of cultivation of BJ cells, post-treatment with Extract 1, Extract 2, and EV extracts, at final concentrations of 2% and 10%. The cells were harvested and fixed using 96% cold ethanol, then stored at −20 °C for 24 h. The following day, cells were collected by centrifugation, then rinsed with PBS buffer, and treated with 100 µg/mL of RNAse A at 37 °C for 30 min. Afterwards, cells were stained for 30 min with 50 µg/mL of PI under dark conditions. Flow cytometry was used for cell counting, with red fluorescence detected at an excitation wavelength of 488 nm. For data analytics, we used FlowJo™ software Version 10 Ashland (Becton, Dickinson and Company; 2019, San Diego, CA, USA).
2.12. Gene Expression Analysis
Universal RNA Purification Kit cat. No E3598 (EURx) was used to isolate total RNA for both treated and control groups for the two time points. In the column, DNAse I treatment was performed to remove any residues of DNA. For the reverse transcription reaction, a total of 280 ng of total RNA was converted into cDNA, using the NG dART RT-PCR kit (EURx). RotorGene 6000 (Corbett LifeScience) and SG qPCR Master Mix 2x (EURx) were used to perform the Real-time qPCR. The data were normalized to a reference gene
ACTB. The sequences of the primers used for the reference gene and the genes of interest,
COL3A1,
COL3A3,
NFE2L2, and
CDKN1, are listed in
Table 1. Results were analyzed using Rotor-Gene 6000 Series software and calculated by the delta-delta Ct (2
−ΔΔCt) method [
35]. We considered a value as significant when it had a 2 or above fold difference.
3. Results and Discussion
The biological ageing of the skin involves cellular and molecular changes that impair fibroblast function and extracellular matrix integrity. Botanical extracts and extracellular vesicles (EVs) have shown promise in counteracting these processes by promoting collagen synthesis, preserving mitochondrial function, and mitigating oxidative stress [
36]. In this study, we evaluate the effects of
H. rhodopensis in vitro culture extracts, both native and conditioned medium-enriched, as well as the EVs fraction from conditioned medium, on fibroblast morphology and key cellular pathways related to skin health.
3.1. Characterization of H. rhodopensis In Vitro Culture EVs
Extracellular vesicles were isolated from culture medium (conditioned medium) obtained after cultivation of H. rhodopensis in vitro culture for 30 days under submerged conditions. The isolated EVs yielded a 2 mL fraction with a total protein of 4.12 µg/mL, corresponding to 82.4 µg/L conditioned medium.
In general, plant-derived EVs can be isolated from various plant parts, including roots, aerial tissues, pollen, and sap [
24,
37,
38]. There is evidence of their antioxidant, anti-inflammatory, and anti-tumour properties [
39,
40]. Studies on the composition of plant-derived EVs confirm the presence of lipids, proteins, mRNA, and other biomolecules [
41,
42].
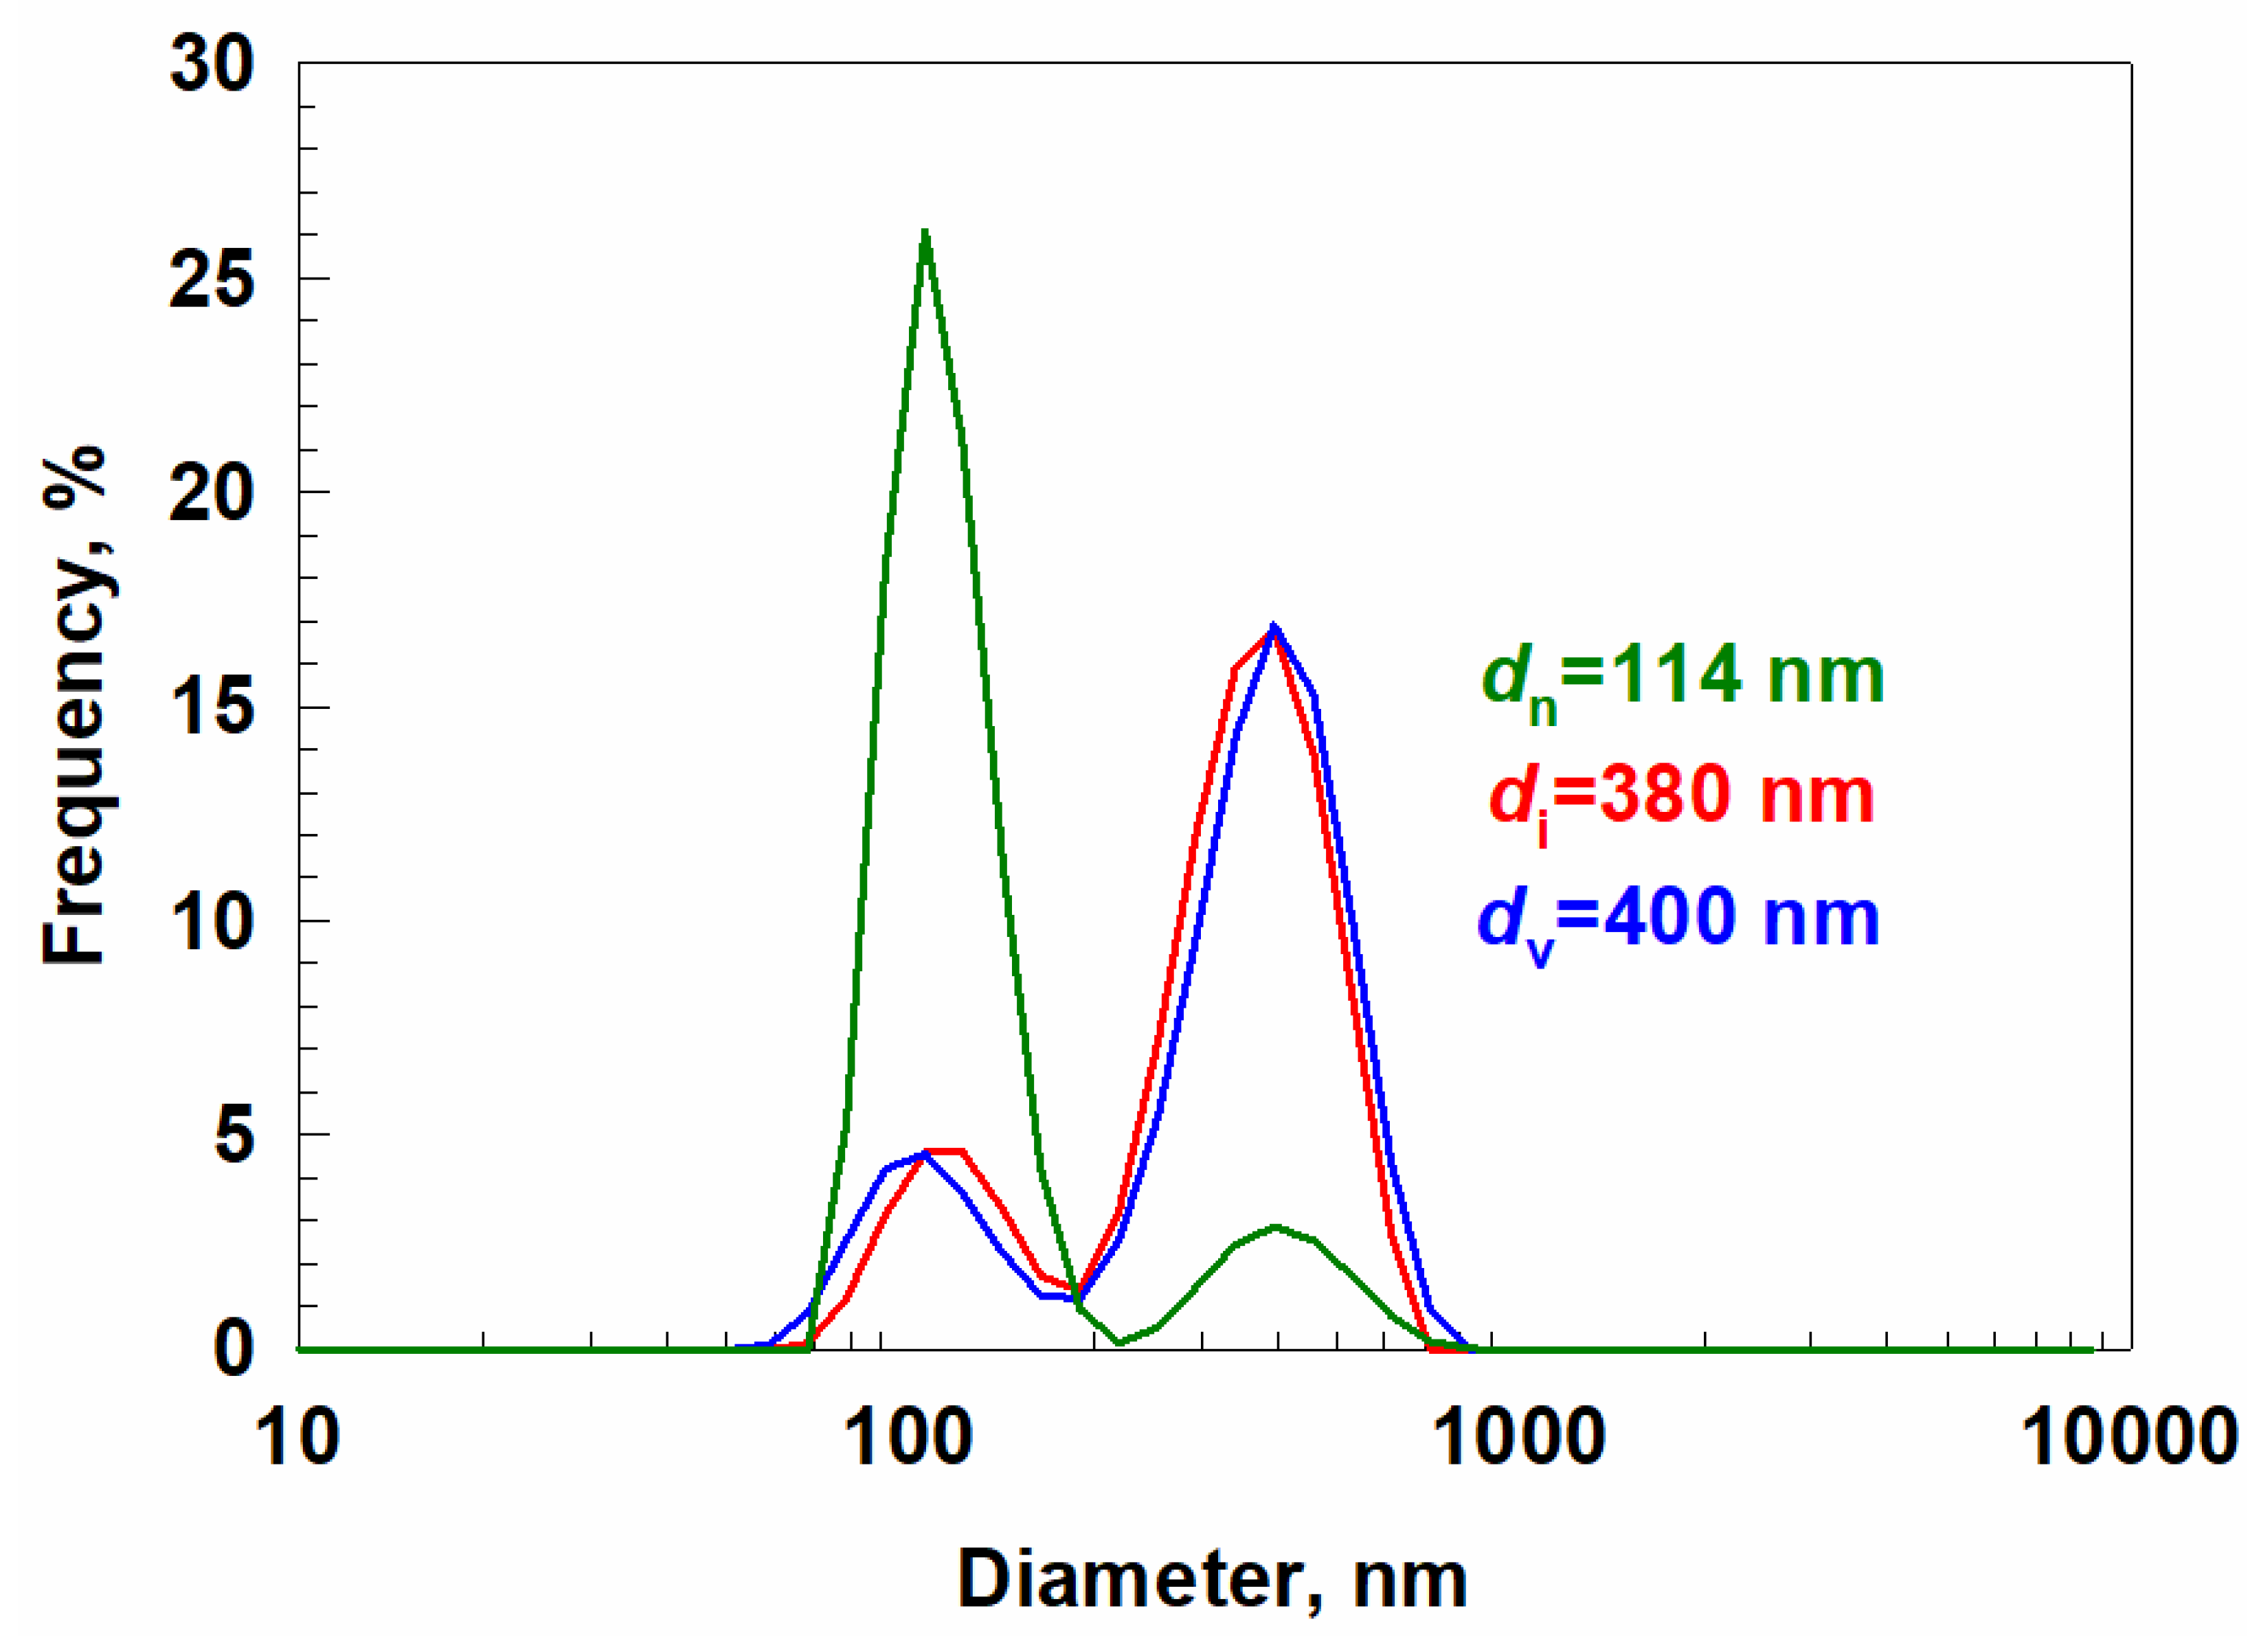
The analyses with Dynamic light scattering (DLS) showed that the isolated EVs fraction consists of particles of two sizes: one with an average diameter of around 100 nm and a second, large fraction with an average diameter of 400 nm (
Figure 1). The measured Z-potential was ζ= −4.3 ± 1.9 mV, which suggests fast coagulation of nanoparticles. Similar instability has been reported in EVs from
Arabidopsis thaliana callus culture (ζ= −23.8 ± 1.3 mV) [
24]. The size of plant EVs can vary tremendously. For example, EVs isolated from the root exudate of tomato (
Solanum lycopersicum cv. ‘Crovarese’) showed an average diameter of around 70 nm [
23], and EVs isolated from
Arabidopsis thaliana callus culture showed an average size of 222.8 nm [
24]. However, the precise measurement of the particle size at the nanoscale could be complicated by different analytical methods.
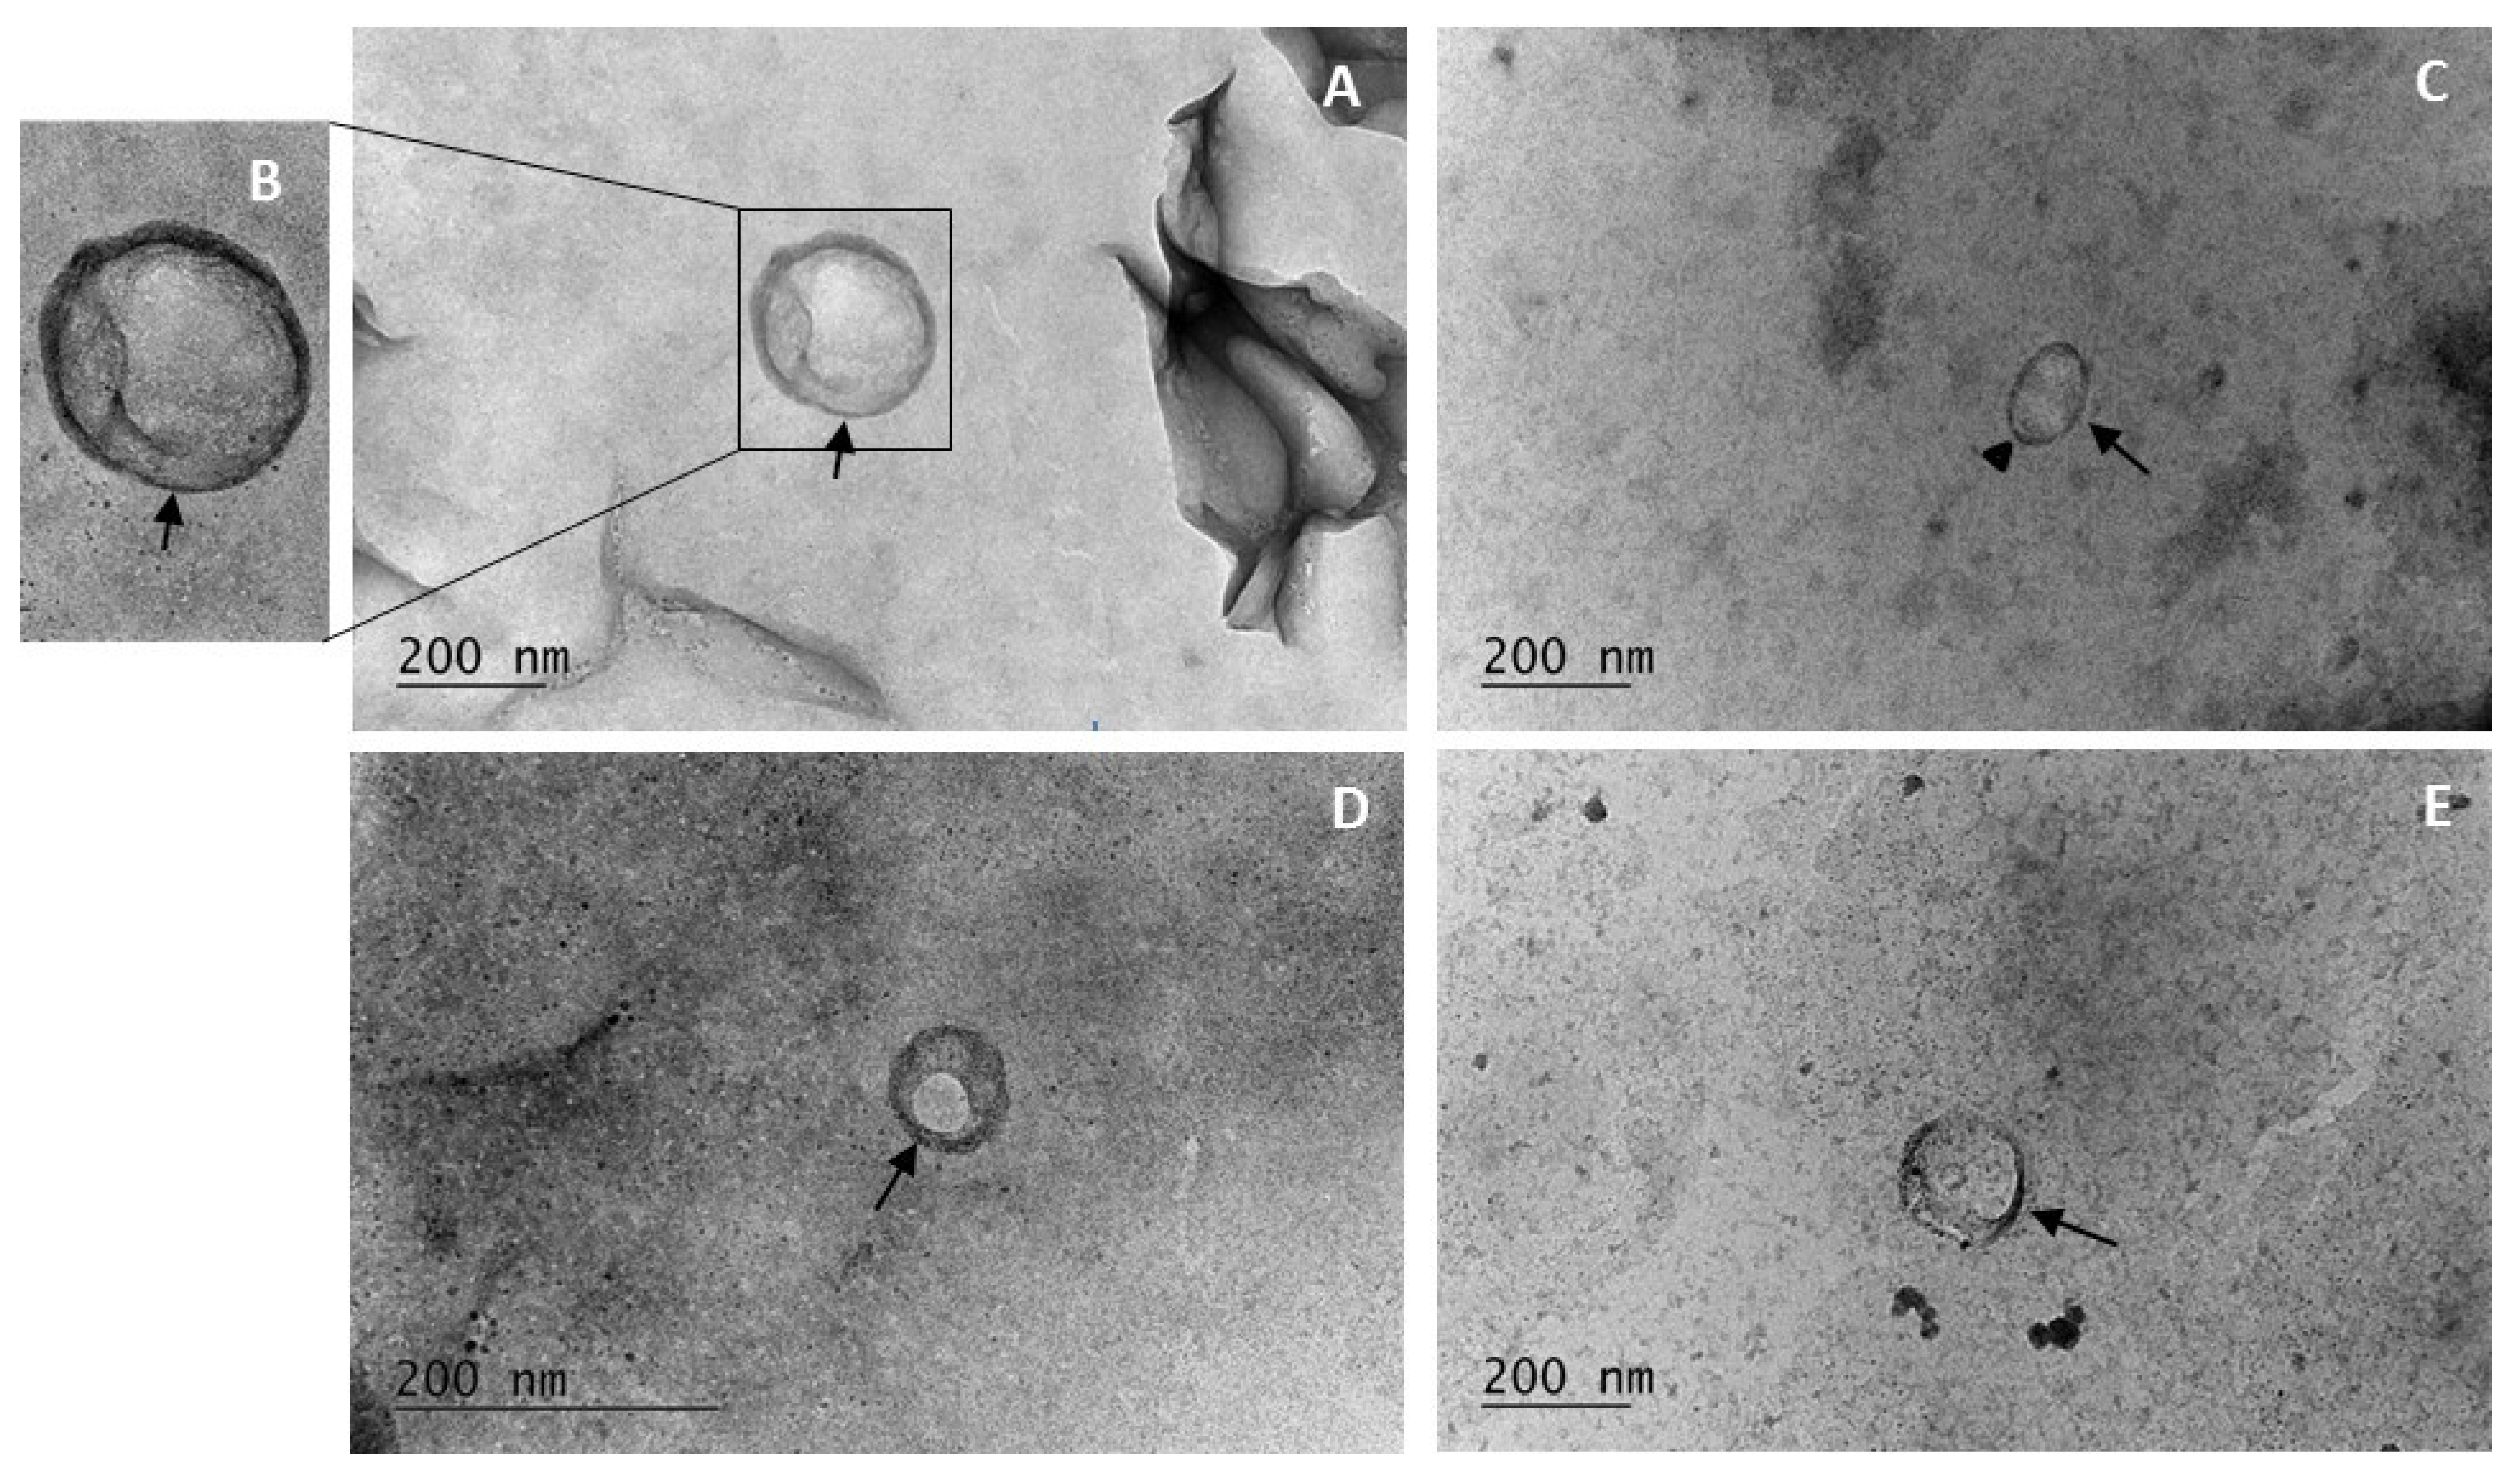
Transmission electron microscopy is a technique that allows the observation of nanoscale objects such as EVs. Due to the high resolution of the electron microscope, the results of this study provide information on the shape, size, and some morphological characteristics of the observed objects. The electron microscopy images reveal the presence of spherical EVs with heterogeneity in size, ranging from 50 to 200 nm (
Figure 2). The morphological characteristics of the EVs include symmetrically formed round shapes, although in isolated cases, oval-shaped vesicles were also observed (
Figure 2C—black triangle), without any ruptures in their structure.
Regarding structural characteristics, the observed objects have a clearly distinguishable bilayer membrane, which in some areas appears thicker and in others thinner (
Figure 2, black arrows). Studies on isolated EVs from
Sorghum bicolor and
Arabidopsis thaliana indicate that these membranes have a lipid composition [
24]. Furthermore, some of the observed samples contained EVs with electron-dense regions within their interior, which could be due to the presence of various molecules such as proteins, RNA, or other biomolecules within EVs.
The TEM visualization provides extensive information on the shape, size, and structural composition of EVs isolated from H. rhodopensis in vitro culture-conditioned medium which expands our knowledge of their distribution in culture liquids.
3.2. Impact of H. rhodopensis Extracts and EVs on BJ Fibroblast Morphology
Cell morphology is a crucial indicator of cellular health and viability. In this study, we examined the effects of two extracts (Extract 1 and Extract 2) and extracellular vesicles (EVs) on BJ fibroblast morphology using phase-contrast microscopy. Cells were treated with 2% and 10% concentrations for 24 and 72 h to assess potential morphological changes (
Figure 3). This analysis provides valuable insights into the biocompatibility and potential effects of these compounds on skin cell function, which is essential for evaluating their suitability in skin health applications. At the 24 h mark, BJ cells treated with 2% concentrations of Extract 1, Extract 2, and EVs maintained their typical elongated fibroblast morphology, similar to the untreated control. The cells remained well adhered to the culture plate, with no visible signs of stress, such as cytoplasmic granulation, vacuolization, or nuclear distortions.
In contrast, cells treated with the higher 10% concentration of all three compounds exhibited a slight increase in size. This change may indicate enhanced metabolic activity or early signs of cellular adaptation, potentially linked to increased proliferation or responsiveness to the compounds. However, no significant deviations from normal morphology were observed, suggesting that the treatment was well tolerated.
By the 72 h time point, BJ cells treated with both 2% and 10% concentrations of Extract 1, Extract 2, and EVs reached confluency, displaying a dense monolayer similar to the untreated control group. The spindle-shaped fibroblast morphology was maintained across all conditions, with no evidence of cellular damage or structural abnormalities. The absence of cytoplasmic granulation, vacuolization, or nuclear changes further supports the non-toxic nature of the tested compounds at both concentrations.
The results indicate that both concentrations of Extract 1, Extract 2, and EVs are biocompatible with BJ fibroblasts over the tested time points. The minor increase in cell size at 24 h for the 10% concentration may suggest enhanced cellular activity [
43], but by 72 h, all treated cells exhibited normal morphology and confluency. These findings support the potential application of these compounds in skin health and anti-ageing research, as they do not appear to compromise fibroblast viability or structural integrity.
3.3. Modulation of Actin Cytoskeletal Organization by H. rhodopensis In Vitro Culture Extracts and EVs
Actin filaments are crucial components of the cytoskeleton that regulate cell shape, motility, and division [
44]. They play a key role in maintaining skin integrity, regeneration, and the skin’s response to environmental stress [
45]. Age-related changes in actin dynamics can impair these functions, leading to dry, thinner skin with reduced elasticity and diminished ability of skin cells to adapt to stress [
46,
47]. To assess the impact of Extract 1, Extract 2, and EVs on actin organization, BJ fibroblasts were treated for 24 h with 2% and 10% concentrations of each compound. Actin filaments were visualized using TRITC-labelled phalloidin and examined via fluorescence microscopy (
Figure 4).
In control BJ cells, F-actin was well organized, forming prominent stress fibres extending throughout the cytosol. These fibres were clearly associated with the plasma membrane, contributing to the maintenance of cell shape and structural integrity. In treated cells, actin filament organization largely remained intact across all conditions. Cells treated with 2% and 10% concentrations of Extract 1 and Extract 2 displayed well-defined stress fibres, comparable to the control group, suggesting that these compounds did not significantly disrupt cytoskeletal integrity. However, BJ cells treated with 2% EVs exhibited subtle changes in actin distribution compared to the control. Stress fibres were reduced, and F-actin appeared more concentrated at the cell periphery, accompanied by a decrease in overall fluorescence intensity. This redistribution may indicate minor cytoskeletal rearrangements, possibly linked to alterations in cell adhesion, motility, or intracellular signalling.
At the higher 10% EV concentration, actin structures remained largely similar to the control condition, suggesting that the observed cytoskeletal response at 2% might be an adaptive, transient effect rather than a sign of cytotoxicity. Slight increases in cell size and changes in cytoskeletal dynamics could be indicative of an enhanced cellular response, such as increased metabolic activity or growth-related signalling pathways.
3.4. Enhancement of Mitochondrial Mass and Integrity Following Treatment with H. rhodopensis In Vitro Culture Extracts and EVs
Mitochondria are key players in cellular energy production. Regarding skin health, their proper function is essential for collagen synthesis, cellular repair and tissue homeostasis [
48]. However, with ageing, mitochondrial efficiency declines due to accumulated oxidative stress, mitochondrial DNA (mtDNA) mutations, and impaired biogenesis [
49]. The accumulation of reactive oxygen species (ROS), due to impaired mitochondria, damages cellular components and accelerates skin ageing by promoting inflammation, ECM degradation, and fibroblast dysfunction [
50]. Therefore, mitochondrial dynamics is a main target when it comes to identifying potential interventions to maintain skin health and function [
48,
51].
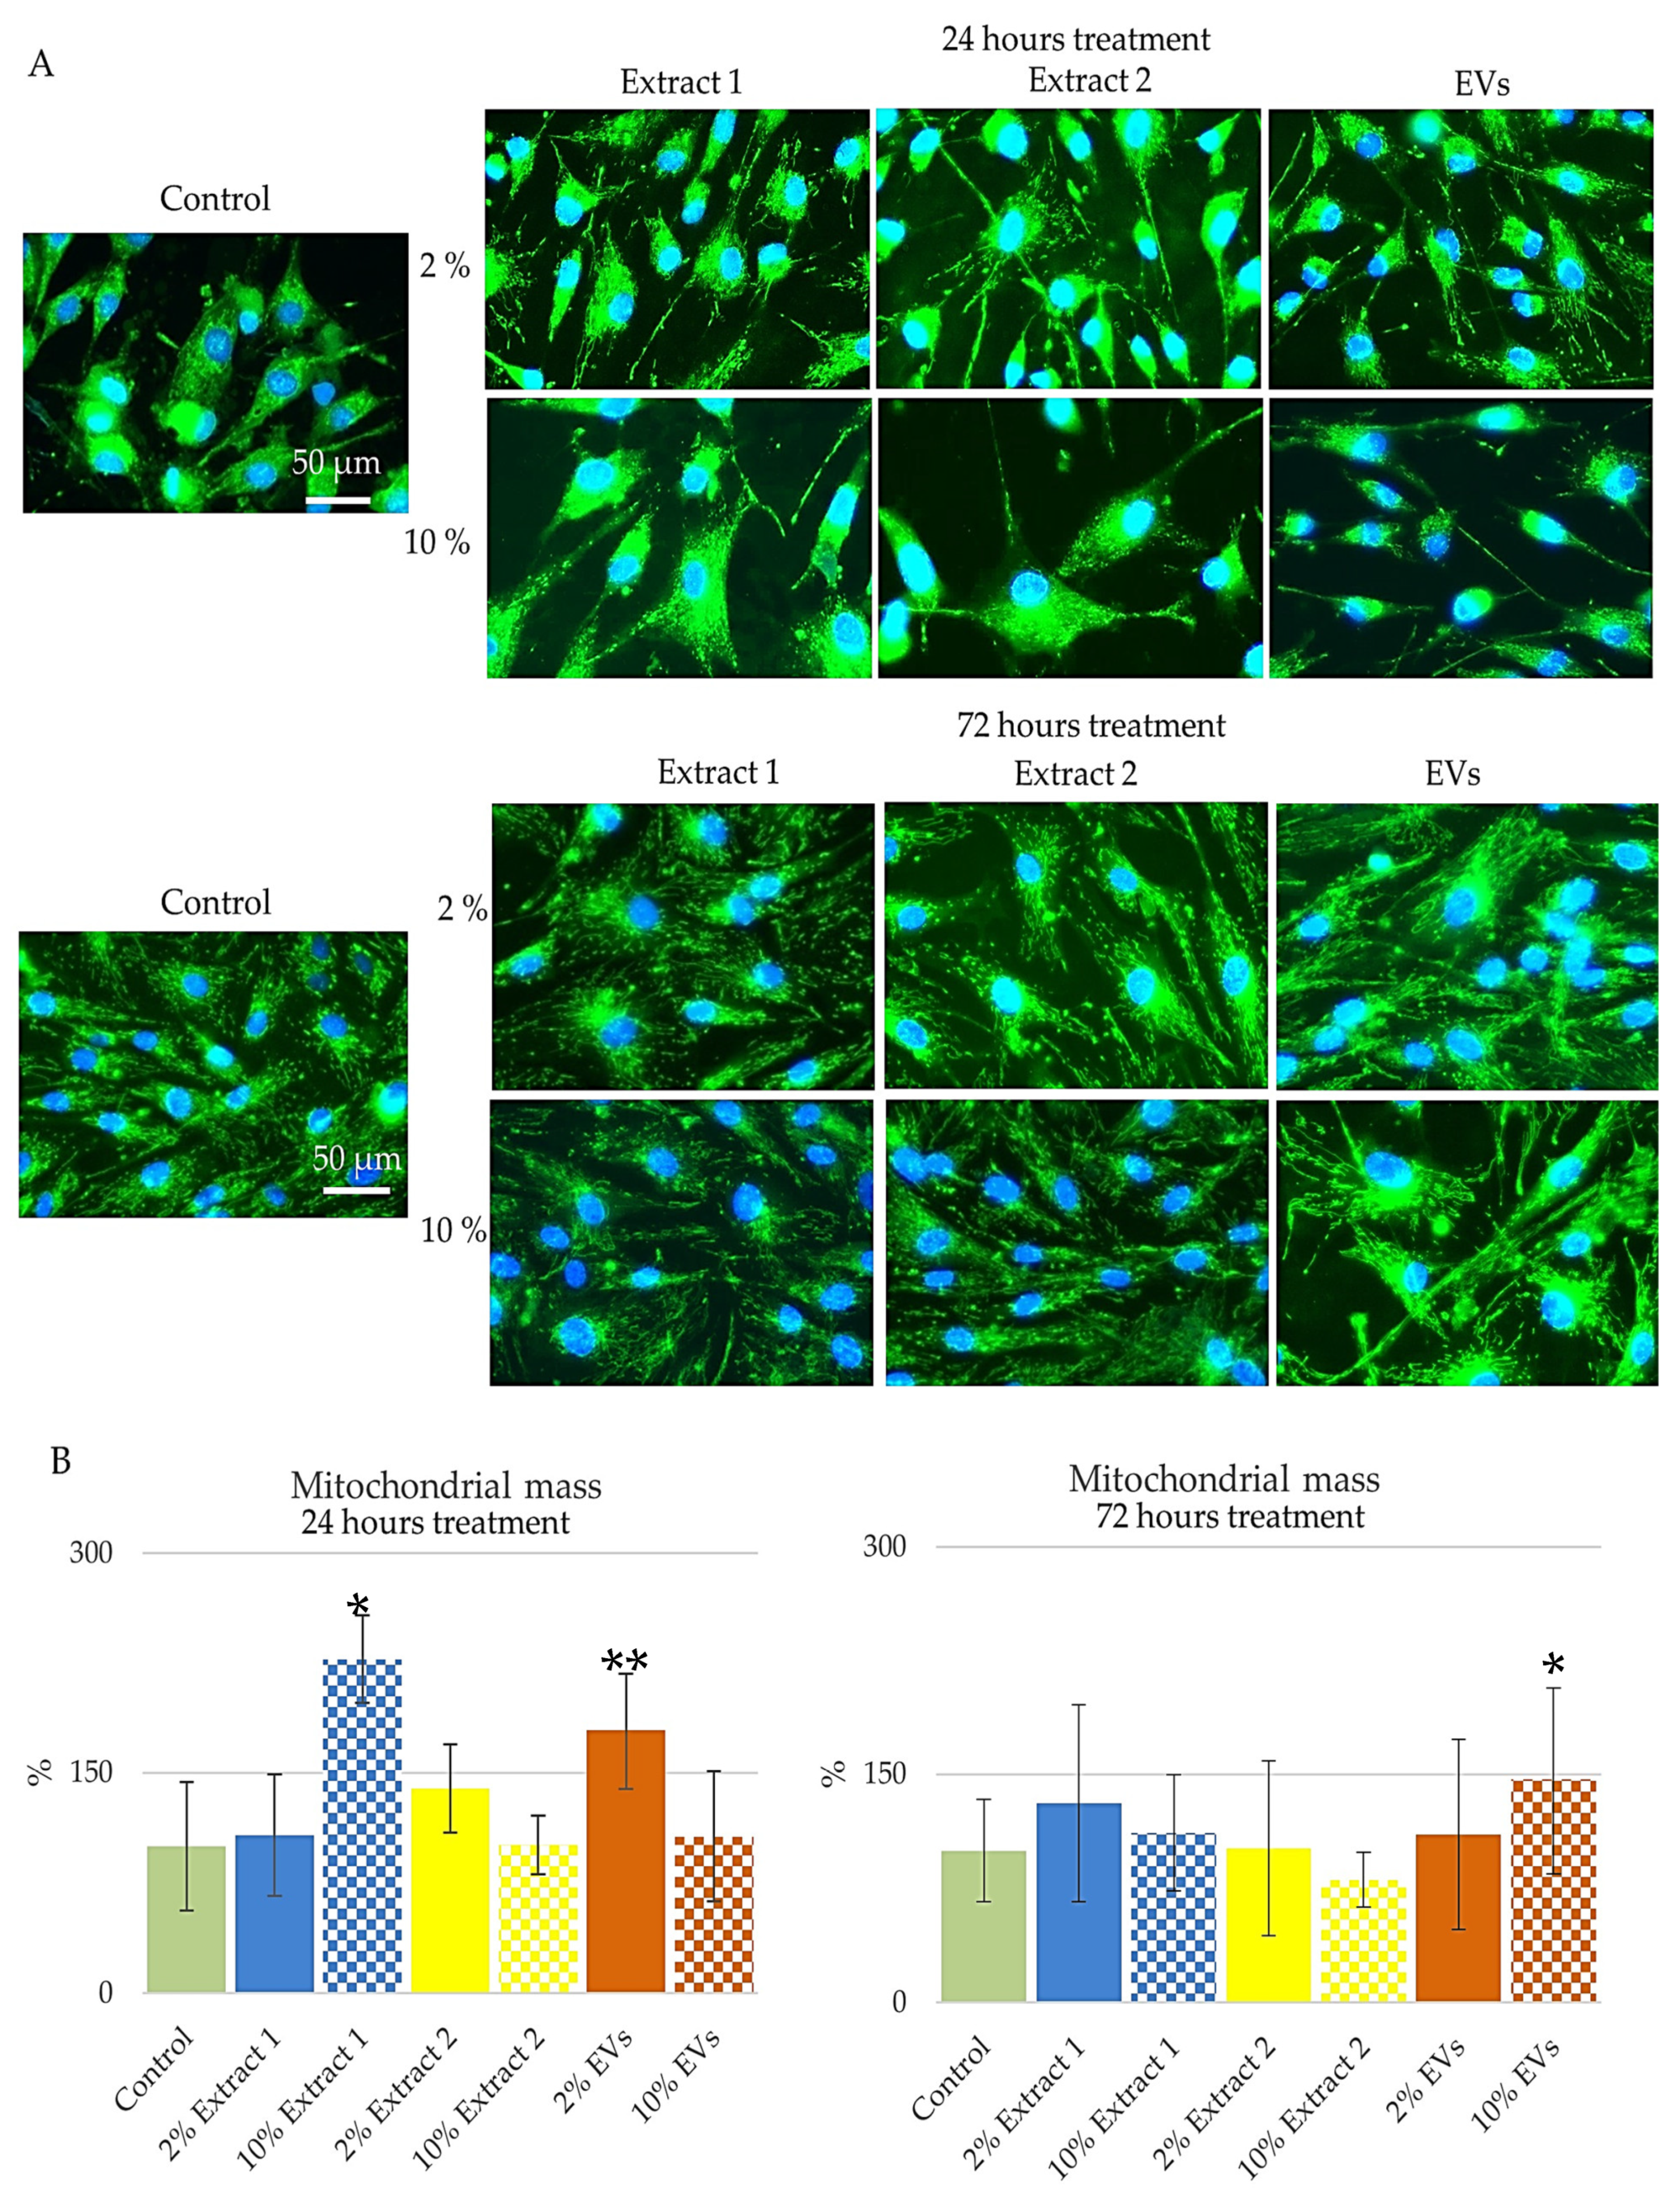
In this study, BJ cells were subjected to dual staining after 24 and 72 h of treatment with 2% and 10% concentrations of Extract 1, Extract 2, and EV compounds. Biotracker 488 was used to visualize mitochondrial integrity through epi-fluorescent microscopy, while Hoechst 33,342 was employed for nuclear staining as part of the dual-staining procedure. Results were analyzed using the software—ImageJ 1.54f [
52]. Representative images are presented in
Figure 5A. Quantitative analysis of mitochondrial mass after 24 h of treatment revealed distinct changes compared to the control group, set at 100% (
Figure 5B, 24 h). Treatment with 2% Extract 1 resulted in a mitochondrial mass of 107.75%, reflecting a 1.08-fold increase, whereas the 10% concentration exhibited a more pronounced effect, with a 2.27-fold increase. Extract 2 at 2% led to a 1.39-fold increase in mitochondrial mass, while the 10% concentration showed a minimal change at 1.01-fold. For the EV compound, cells treated with 2% displayed a mitochondrial mass of 178.89%, representing a 1.79-fold increase, whereas the 10% concentration led to a more modest increase of 1.07-fold.
Interestingly, after 72 h of treatment, mitochondrial mass exhibited further variation across the different compounds and concentrations (
Figure 5B, 72 h). Extract 1 at 2% led to a 1.31-fold increase, while the 10% concentration resulted in a more moderate enhancement of 1.11-fold. Extract 2 at 2% produced only a slight increase of 1.01-fold, whereas the 10% concentration resulted in a reduction to 0.81-fold, suggesting a potential adverse effect on mitochondrial integrity. In contrast, the EV compound demonstrated a different trend, with the 2% concentration yielding a 1.11-fold increase and the 10% concentration leading to a substantial enhancement of 1.46-fold, indicating a robust effect on mitochondrial function.
These findings highlight the potential of Extract 1 and EV compounds in supporting mitochondrial health, particularly at lower concentrations, which appear to promote stability and enhancement of mitochondrial mass. The pronounced increase in mitochondrial mass with the 10% EV compound suggests strong stimulation of mitochondrial biogenesis or activity, which could be beneficial for maintaining cellular energy levels [
53]. Conversely, the decline in mitochondrial mass observed with the 10% Extract 2 treatment raises concerns about its impact on mitochondrial function, potentially leading to cellular stress or impaired energy production. The observed trends provide valuable insights into the biological activity of these compounds, emphasizing their potential role in modulating mitochondrial dynamics and maintaining cellular function.
3.5. Lysosomal Response to H. rhodopensis In Vitro Culture Extracts and EVs: Influence on Cellular Homeostasis
Lysosomes play a crucial role in cellular homeostasis and are involved in the degradation of damaged organelles and macromolecules. Their functionality is closely linked to ageing processes. As cells age, lysosomes may undergo changes that impair their ability to maintain cellular health [
54,
55].
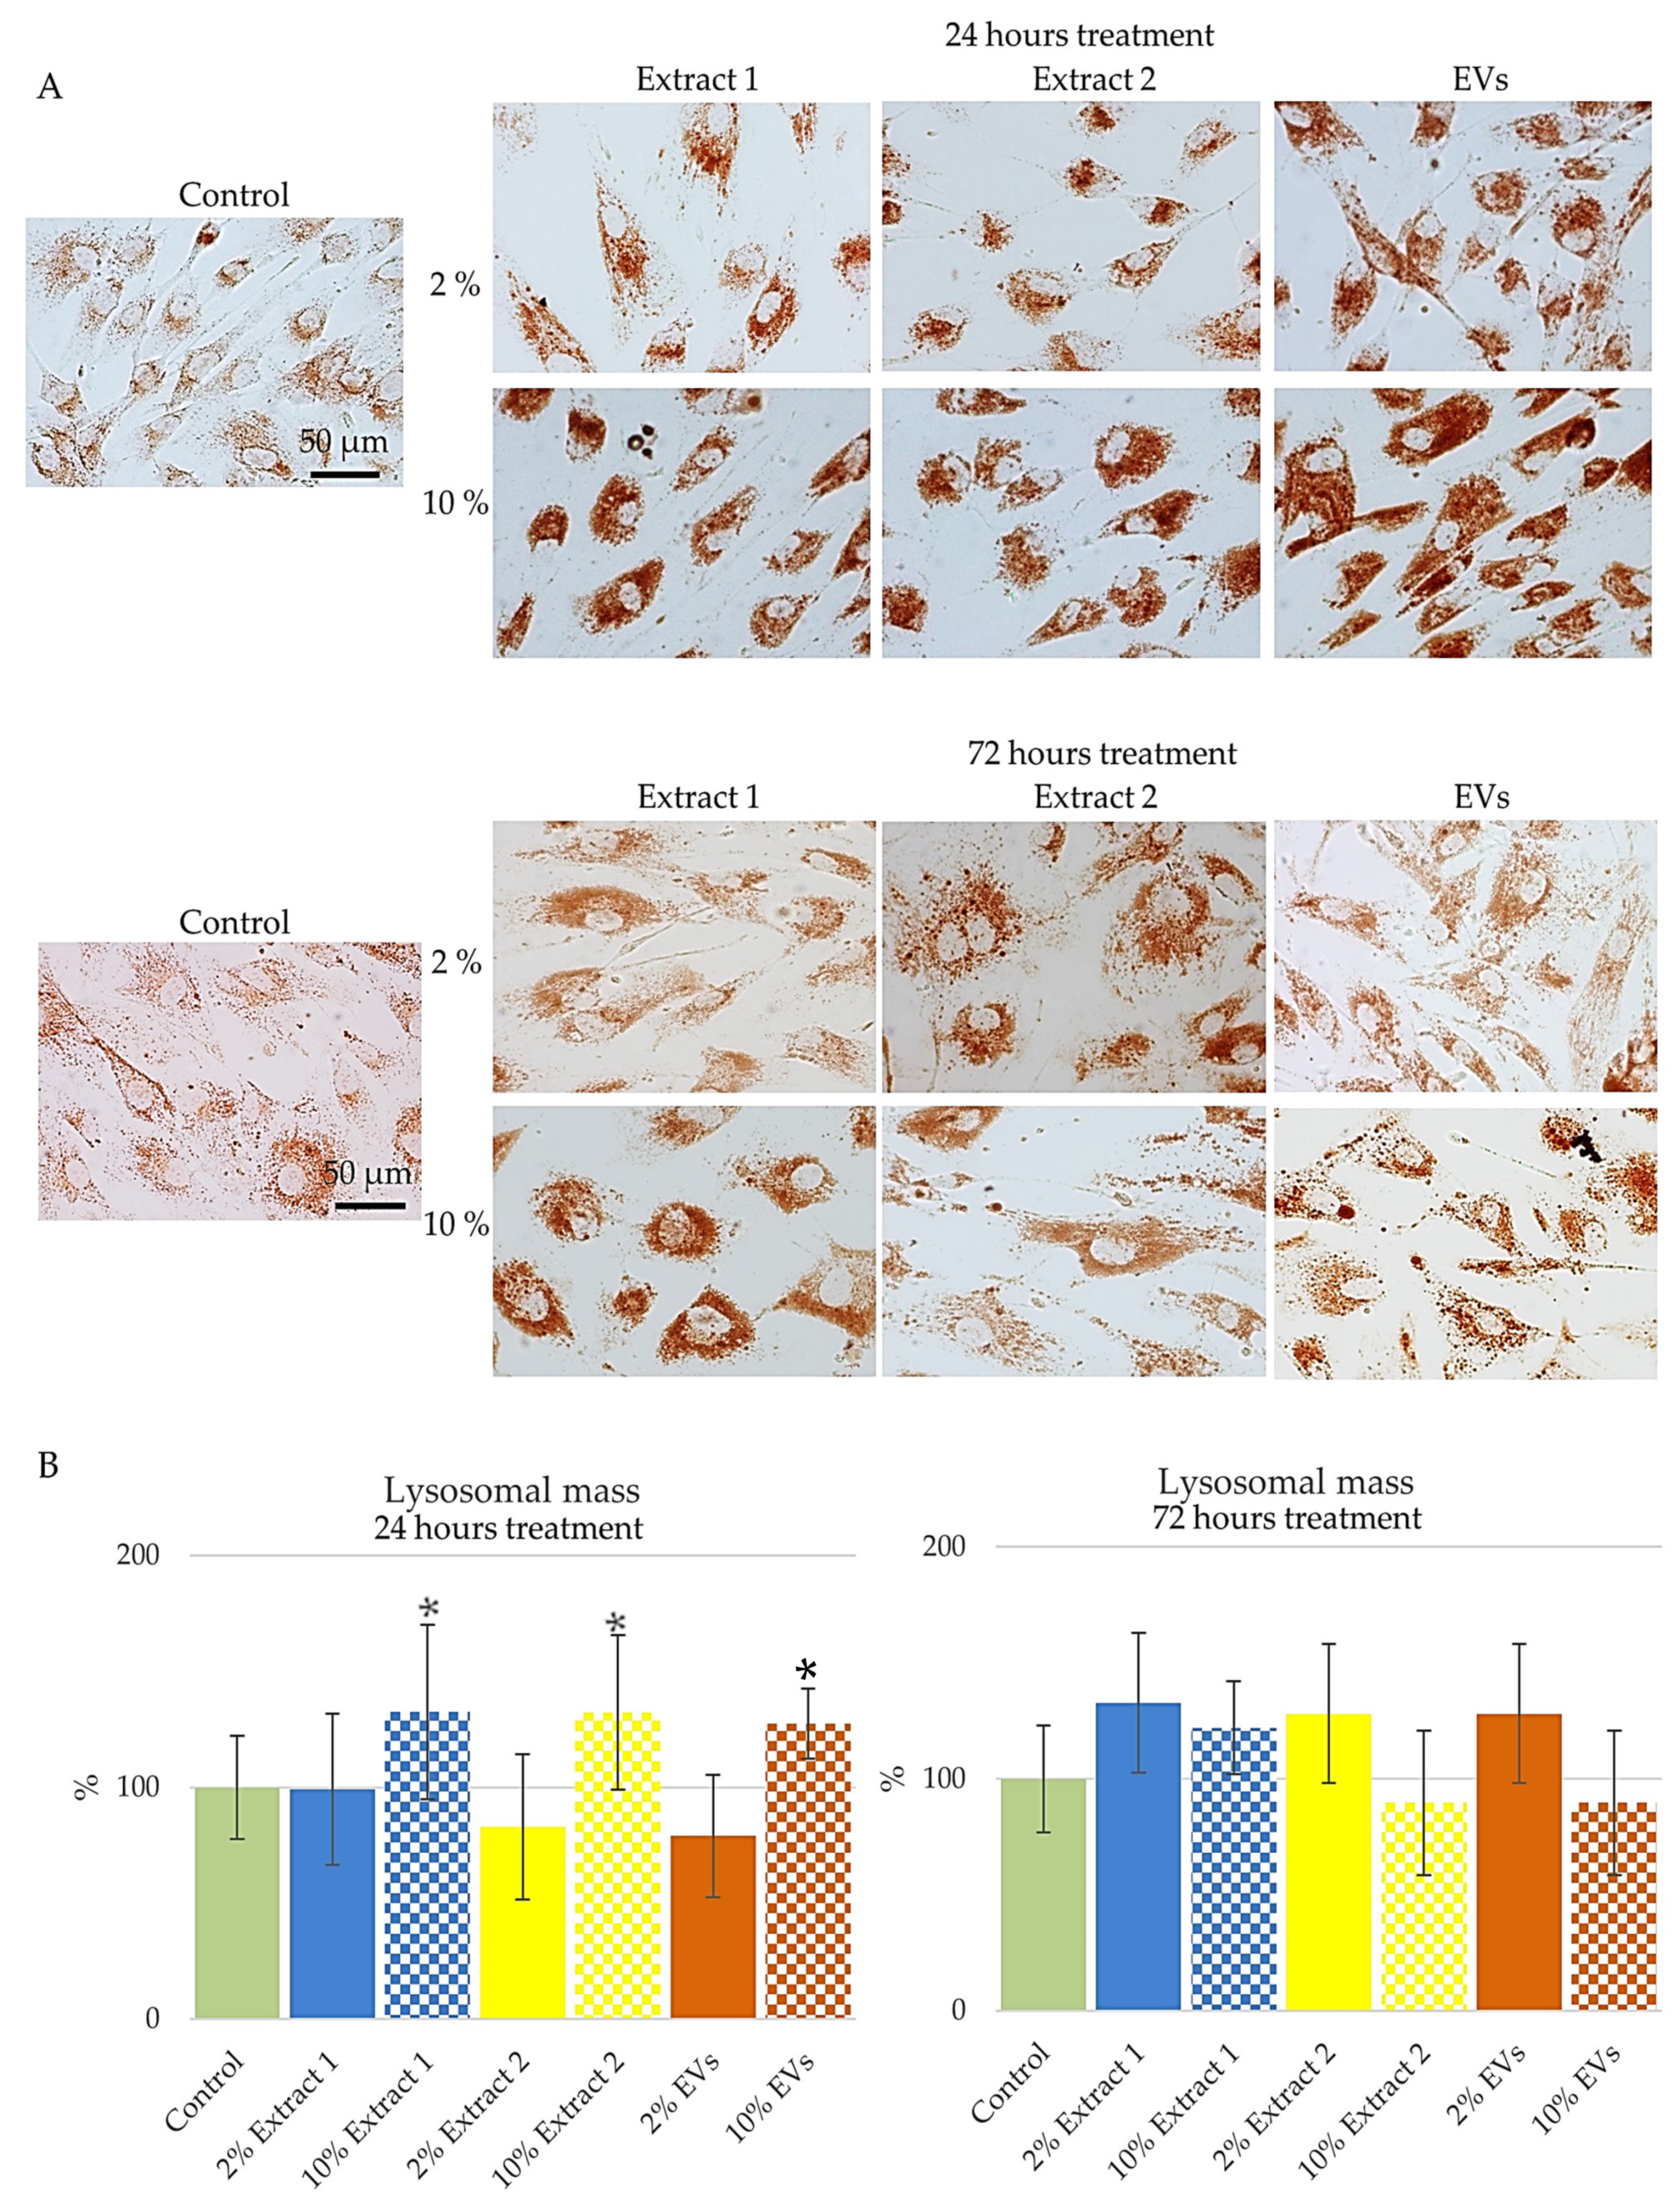
In this study, BJ cells were treated with the tested compounds—Extract 1, Extract 2, and EVs, in two different concentrations of 2% and 10%, for 24 and 72 h, and lysosomal staining with neutral red dye was assessed through qualitative and quantitative analysis (
Figure 6). Results were analyzed using the software—ImageJ 1.54f [
52].
Figure 6A presents representative images of lysosomal staining in BJ cells following treatment with the tested compounds, while
Figure 6B illustrates the quantitative analysis of lysosomal mass, highlighting treatment-dependent variations.
After 24 h of treatment, distinct changes in lysosomal mass were observed. Cells treated with 2% Extract 1 maintained lysosomal mass close to the control levels, indicating minimal impact at this concentration (
Figure 6B, 24 h). However, exposure to 10% Extract 1 resulted in a notable increase in lysosomal mass, suggesting enhanced lysosomal activity or biogenesis at higher concentrations. Similarly, the 10% Extract 2 condition also led to a significant elevation in lysosomal mass, implying a potential stimulatory effect on lysosomal function. In contrast, cells treated with 2% Extract 2 and 2% EVs exhibited a decline in lysosomal mass, pointing to a possible impairment in lysosomal function at these lower concentrations. This reduction could indicate a diminished ability to degrade cellular components efficiently, which might lead to the accumulation of damaged organelles and increased cellular stress. Interestingly, treatment with 10% EVs resulted in a moderate increase in lysosomal mass, suggesting that at higher concentrations, EVs may enhance lysosomal function rather than impair it.
Following 72 h of treatment, a shift in lysosomal mass dynamics was observed. Both 2% and 10% Extract 1 treatment continued to promote lysosomal function, with increased lysosomal mass suggesting sustained enhancement of lysosomal activity over time (
Figure 6B). The response to Extract 2, however, was concentration-dependent. While the 2% Extract 2 treatment showed a significant increase in lysosomal mass, indicating improved lysosomal function compared to the 24 h time point, the 10% concentration led to a reduction in lysosomal mass. This suggests that prolonged exposure to higher concentrations of Extract 2 may have adverse effects on lysosomal health.
Overall, these findings highlight the differential effects of the tested compounds on lysosomal mass and function. While higher concentrations of Extract 1 consistently promoted lysosomal activity, Extract 2 exhibited a more complex response, with potential benefits at lower concentrations but detrimental effects at higher doses over time. EVs, on the other hand, showed a stabilizing effect, with an overall trend toward improved lysosomal function, particularly at higher concentrations. These observations suggest that modulating lysosomal function through specific compounds could be a potential strategy for maintaining cellular health and counteracting age-related declines in cellular clearance mechanisms [
56]. The findings provide valuable insights into the role of these compounds in regulating lysosomal dynamics, which is crucial for cellular longevity and stress resistance.
3.6. Effects of H. rhodopensis In Vitro Culture Extracts and EVs on Cell Cycle Progression
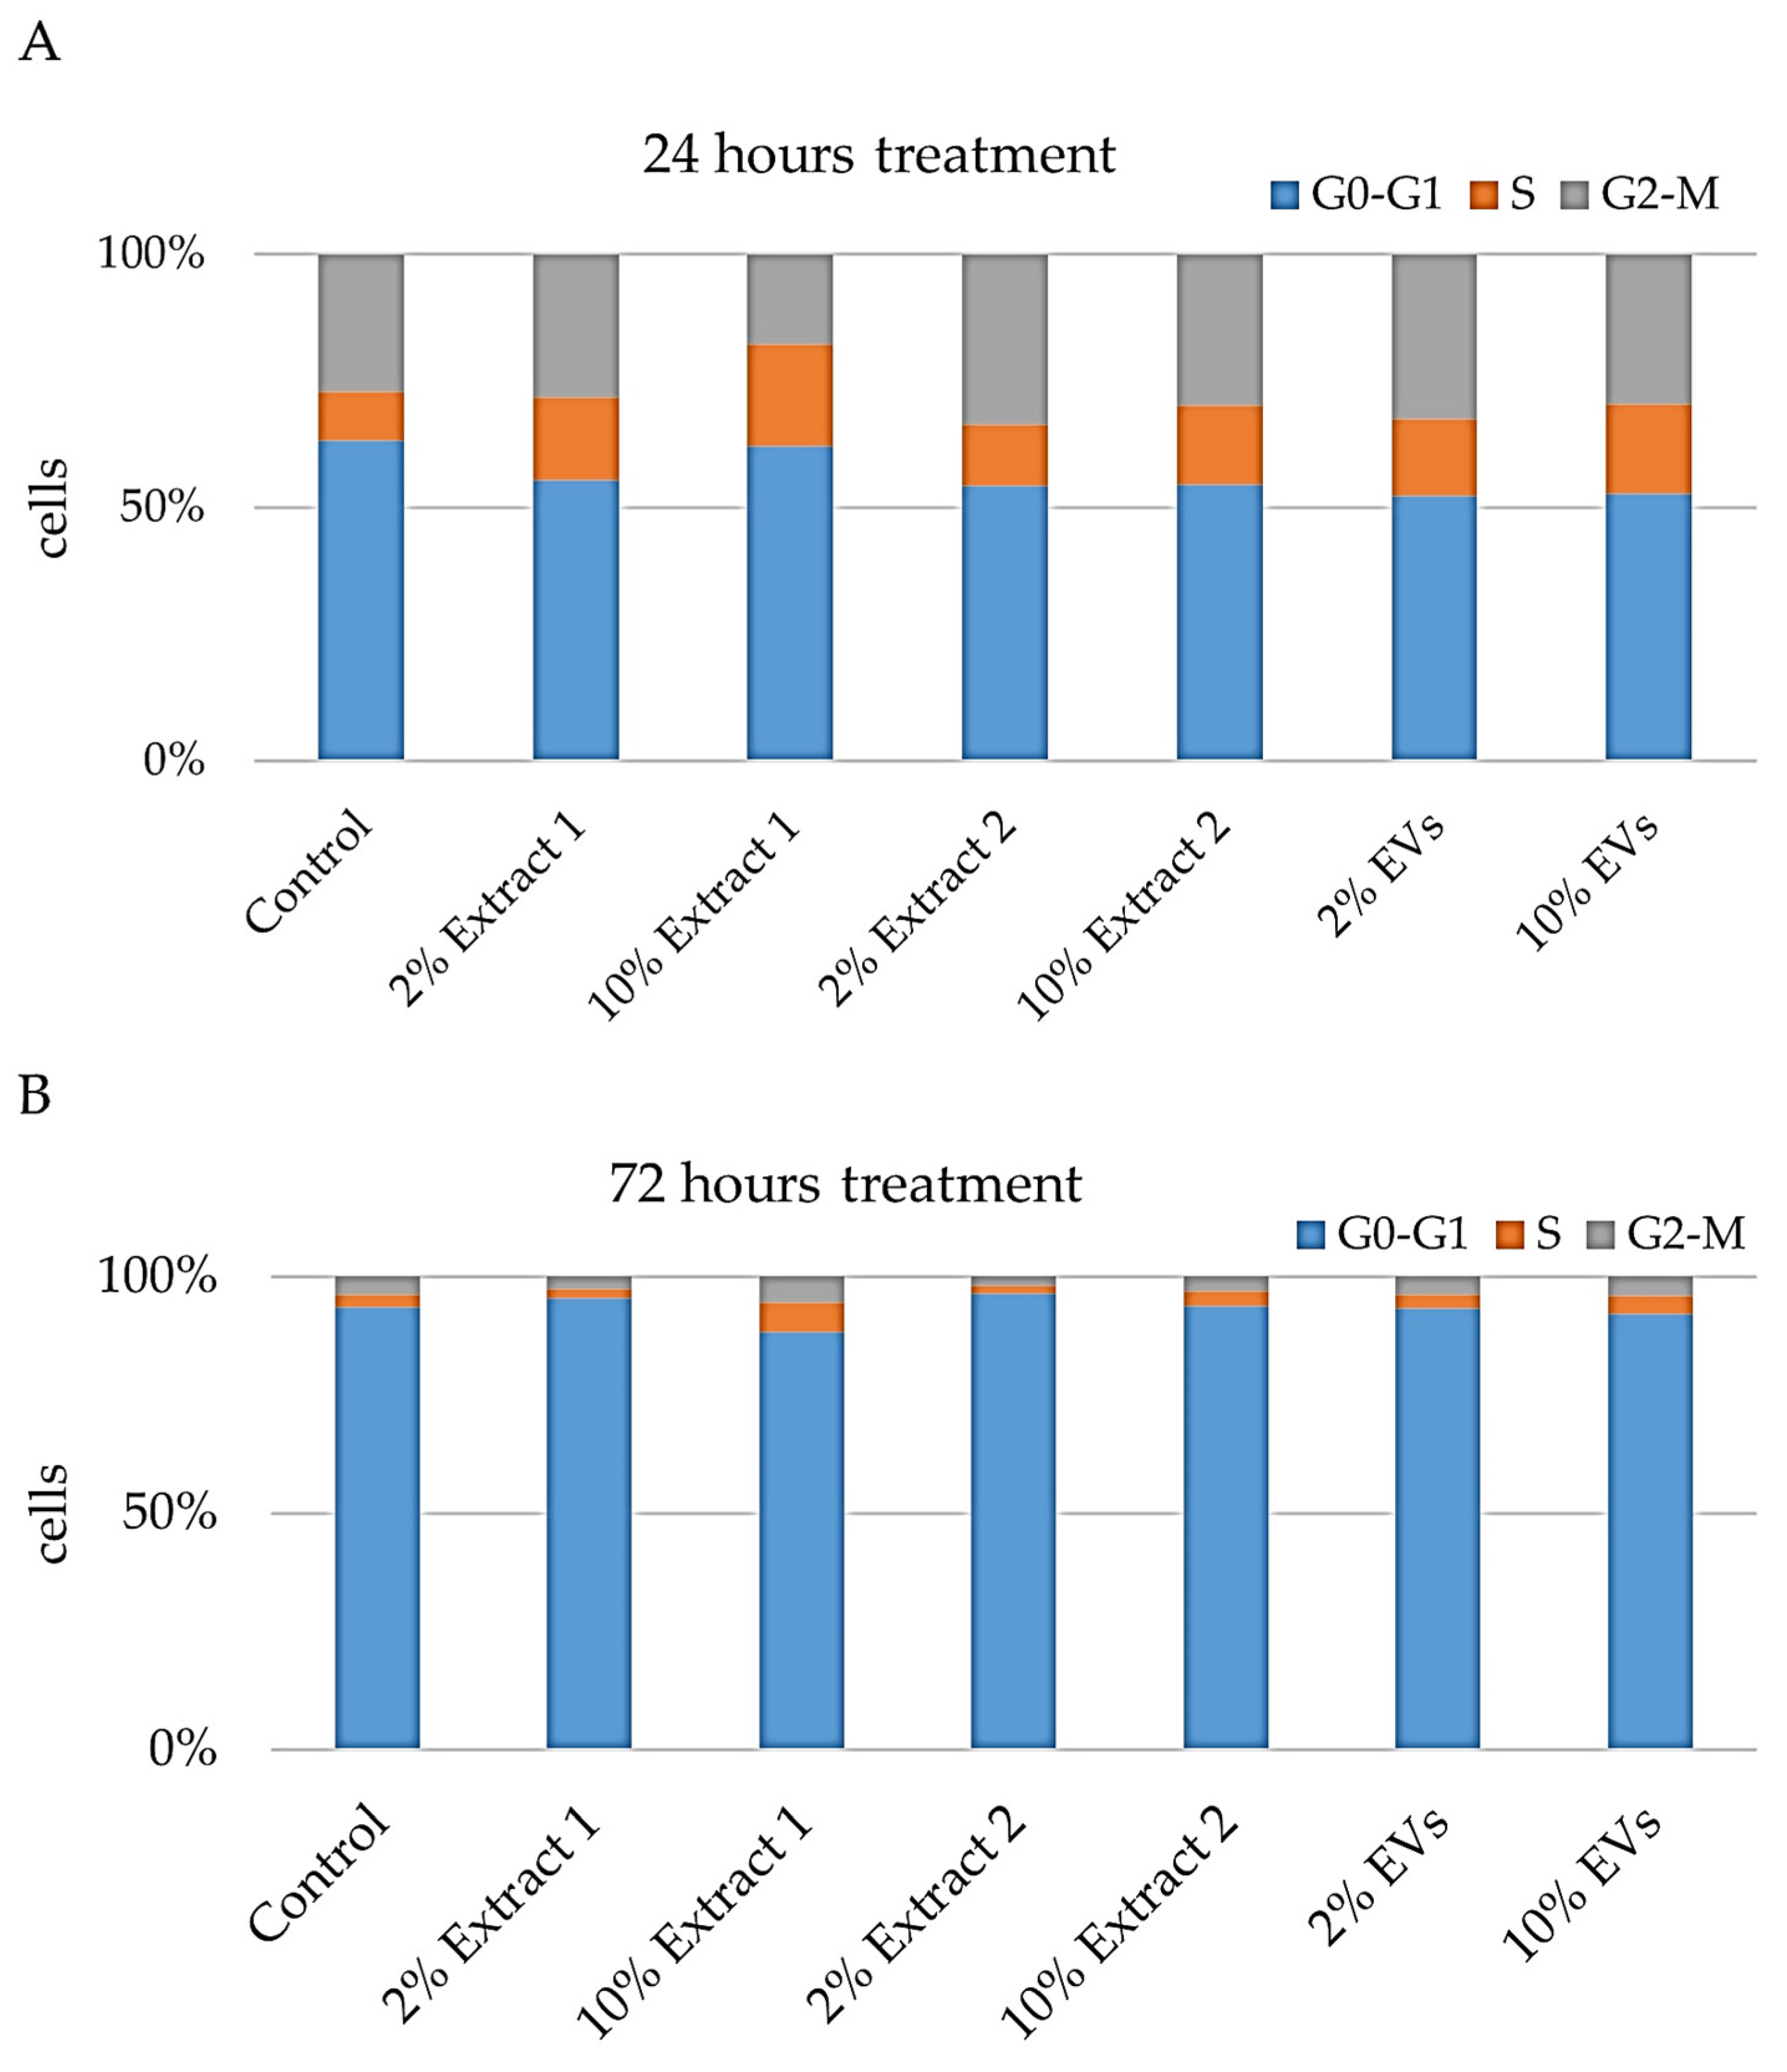
Flow cytometry-based cell cycle analysis was performed to evaluate the impact of the tested compounds—Extract 1, Extract 2, and EVs—on cellular BJ proliferation and progression through the cell cycle. By utilizing Propidium Iodide (P.I.) staining, which binds to DNA, we were able to determine the percentage of cells in the G0–G1, S, and G2-M phases after treatment with the compounds at 2% and 10% concentrations for 24 and 72 h (
Figure 7).
Following 24 h of exposure, notable changes in the cell cycle distribution were observed across the different treatment groups (
Figure 7A). In the G0–G1 phase, the control cells exhibited a distribution of 63.33%. Treatment with 2% Extract 1 led to a reduction in the G0–G1 population to 55.52%, indicating a decrease of approximately 12.8%. A similar trend was observed with 2% Extract 2, which reduced the G0–G1 population to 54.23%, and 10% Extract 2, which resulted in a decrease to 54.60%. The most pronounced reduction was seen with the 2% EVs treatment, which lowered the G0–G1 population to 52.27%, marking a 17.9% decrease, while 10% EVs resulted in a comparable decrease to 52.83%. Interestingly, the 10% Extract 1 concentration had a more moderate effect, reducing the G0–G1 phase only slightly to 62.08%.
The S phase, associated with DNA replication, showed an increase in response to treatment. The control group exhibited an S phase population of 9.57%, while treatment with 2% Extract 1 elevated it to 16.26%, and 10% Extract 1 led to an even greater increase to 20.05%. The same trend was observed with Extract 2, where the 2% concentration resulted in an S phase increase to 12.24%, and the 10% concentration further elevated it to 15.66%. EV treatment also promoted S phase accumulation, with 2% EVs increasing the population to 15.34% and 10% EVs raising it to 17.65%.
Regarding the G2-M phase, the control cells had a baseline distribution of 27.09%. The 2% Extract 1 slightly increased the proportion of cells in this phase to 28.22%, whereas the 10% Extract 1 significantly reduced it to 17.87%, suggesting an arrest or delay in earlier phases of the cell cycle. On the other hand, 2% Extract 2 treatment increased the G2-M population to 33.52%, representing a 24% rise, while 10% Extract 2 showed a smaller increase to 29.74%. The 2% EVs treatment also promoted G2-M accumulation, raising it to 32.39%, while 10% EVs resulted in a more moderate increase to 29.52%.
After 72 h of treatment, cell cycle dynamics shifted further (
Figure 7B). In the G0-G1 phase, the control group had a significantly higher percentage of cells (93.72%) compared to the 24 h time point, indicating a general slowing of proliferation. The 2% Extract 1 treatment slightly increased the G0–G1 population to 95.41%, while the 10% Extract 1 decreased it to 88.30%. Extract 2 at 2% led to a further increase in G0–G1 to 96.53%, while the 10% concentration slightly reduced it to 93.89%. EV treatment had a minor effect, with 2% EVs resulting in a slight reduction to 93.40% and 10% EVs further decreasing it to 92.07%.
Unlike at 24 h, the S phase remained relatively low across all groups. The control group exhibited an S phase population of 2.45%, which was slightly reduced by 2% Extract 1 to 2.14%. However, the 10% Extract 1 concentration significantly increased the S phase to 6.20%, suggesting a delayed or prolonged DNA replication phase. In contrast, the 2% Extract 2 treatment reduced the S phase population to 1.59%, while the 10% Extract 2 increased it to 3.12%. EV treatment generally led to a mild increase in S phase distribution, with 2% EVs raising it to 2.84% and 10% EVs further increasing it to 3.99%.
The G2-M phase, which was more prominently affected at 24 h, showed milder changes after 72 h. The control group had 3.84% of cells in this phase. The 2% Extract 1 treatment decreased it to 2.45%, while 10% Extract 1 increased it to 5.50%, suggesting possible mitotic arrest at higher concentrations. Similarly, the 2% Extract 2 decreased the G2-M population to 1.88%, whereas the 10% concentration increased it to 2.99%. EVs treatment at 2% had little effect, slightly reducing G2-M to 3.76%, while the 10% EVs slightly increased it to 3.95%.
Overall, these findings suggest that while lower concentrations of the tested compounds support cell cycle progression in the short term, higher concentrations—especially of Extract 1—may induce cell cycle arrest over prolonged exposure, possibly as a protective response to cellular stress [
57].
3.7. Genotoxicity Assessment: Evaluating the Safety Profile of H. rhodopensis In Vitro Culture Extracts and EVs
Single-cell gel electrophoresis (SCGE), commonly called the Comet Assay, is a sensitive and versatile method for detecting DNA damage at the single-cell level [
58]. The neutral version of this assay, specifically tailored to detect double-stranded DNA breaks, was utilized in our study to assess the genotoxic effects of various treatments on BJ cells. Double-stranded DNA breaks are critical markers of genotoxic stress, often associated with apoptosis and other forms of cell death. The SCGE assay’s ability to detect even subtle changes in DNA integrity makes it a valuable tool in toxicology and pharmacology research, where it is frequently used to evaluate the impact of chemical and physical agents on cellular DNA across different experimental conditions [
59]. Given its application in human biomonitoring studies as a reliable biomarker for DNA damage [
60], the SCGE assay was chosen as the primary method to quantify the genotoxicity induced by Extract 1, Extract 2, and EVs, in concentrations of 2% and 10%, after 24 and 72 h of treatment.
Results for the 24 h treatment are represented in
Figure 8A. The control group exhibited a baseline level of DNA damage, with relatively low migration values. In contrast, the 2% Extract 1 showed a significant increase in DNA damage, indicating potential genotoxic effects. The 10% Extract 1 demonstrated even higher levels of DNA damage, suggesting that this concentration may have a more pronounced genotoxic impact on the cells. The 2% Extract 2 resulted in elevated levels of DNA damage, while the 10% Extract 2 exhibited decreased values, indicating a cellular defensive mechanism against genotoxicity at this concentration. The 2% EVs displayed lower levels of DNA damage compared to both Extracts 1 and 2, indicating a potentially protective effect or lower genotoxicity. However, the 10% EVs had a decrease in DNA damage, suggesting that higher concentrations may induce stress or damage response mechanisms.
For the 72 h treatment, results are represented in
Figure 8B. The control group again exhibited a baseline level of DNA damage, while the 2% Extract 1 showed a moderate increase in DNA migration, suggesting some level of genotoxicity, but not as pronounced as other treatments. The 10% Extract 1 demonstrated a more significant elevation in DNA damage, indicating a higher potential for genotoxic effects at this concentration. The 2% Extract 2 indicated notable DNA damage, which was similar to the 10% Extract 2, suggesting that this compound may have a strong potential for inducing genotoxicity at higher concentrations. The 2% EVs exhibited the highest level of DNA damage among the tested groups, suggesting that this treatment may induce substantial genotoxic effects on fibroblast cells. In contrast, the 10% EVs showed a decrease in DNA damage compared to their 2% counterpart, indicating that while EVs can have genotoxic effects, higher concentrations may lead to a saturation point or activation of cellular protective mechanisms.
3.8. Regulation of Skin-Ageing Related Genes by H. rhodopensis In Vitro Culture Extracts and EVs
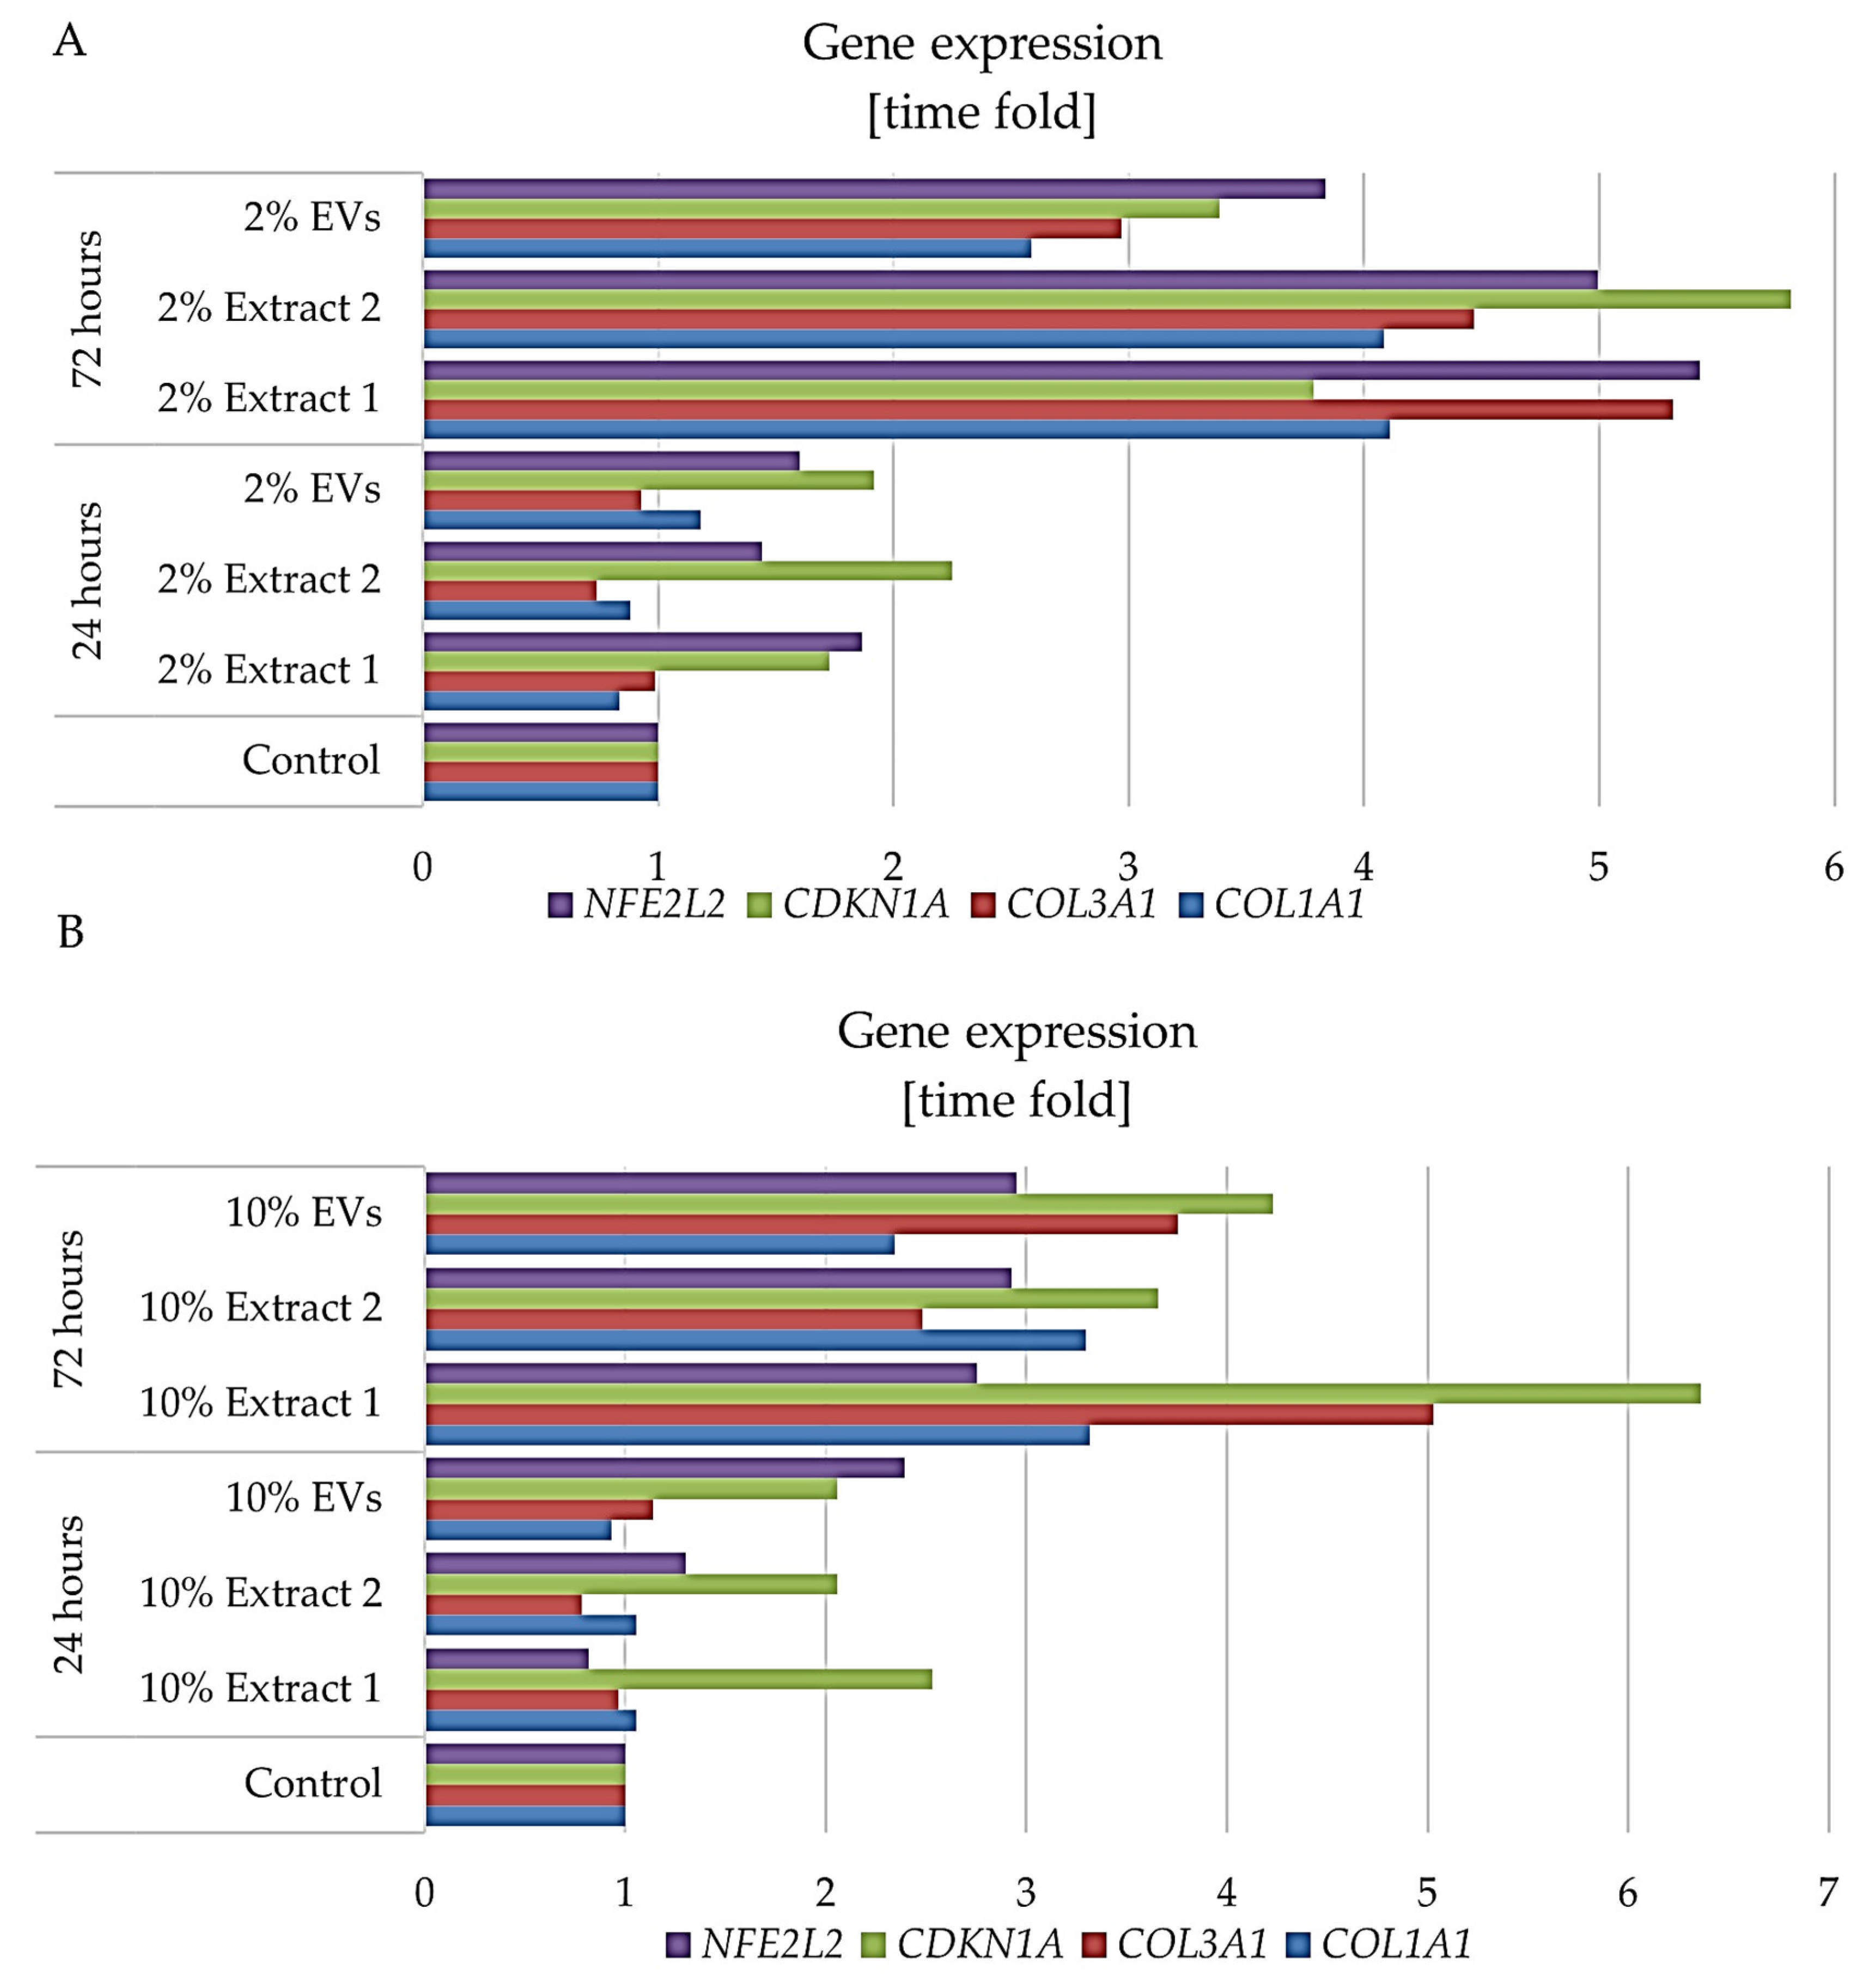
The regulation of key genes involved in extracellular matrix (ECM) maintenance, oxidative stress response, and cellular senescence plays a crucial role in skin ageing. To assess the impact of
H. rhodopensis in vitro culture extracts and extracellular vesicles (EVs) on these processes, we analyzed the expression of
COL1A1 and
COL3A1,
NFE2L2, and
CDKN1A in BJ fibroblasts after 24 and 72 h of treatment with 2% and 10% concentrations of the tested compounds (
Figure 9). We selected these specific genes because they represent critical pathways involved in skin ageing and fibroblast function.
COL1A1 and
COL3A1 encode type I and type III collagen, respectively—two essential components of the extracellular matrix (ECM) that provide structural integrity, elasticity, and strength to the skin, a key structural component of the extracellular matrix (ECM) that maintains skin elasticity and integrity, both of which decline with age [
61,
62].
NFE2L2 (
NRF2) is a master regulator of the cellular antioxidant response, playing a vital role in protecting fibroblasts from oxidative stress, a major contributor to skin ageing [
63].
CDKN1A (
p21) is a well established marker of cellular senescence and is involved in cell cycle regulation, providing insights into how the tested compounds influence fibroblast ageing and proliferation [
64]. By evaluating these genes, we aimed to determine whether Haberlea rhodopensis extracts and EVs can modulate ECM preservation, oxidative defence, and cellular longevity, all of which are crucial for maintaining youthful and functional skin.
At 24 h, treatment with 2% Extract 1 resulted in a slight decrease in
COL1A1, while significantly increasing
CDKN1A, suggesting activation of cellular stress response mechanisms. In contrast, 2% Extract 2 maintained
COL1A1 stability but led to a reduction in
COL3A1, accompanied by an upregulation of
CDKN1A, indicating a possible adaptation to stress. Treatment with 2% EVs enhanced
COL1A1 expression, maintained
COL3A1 levels, and strongly upregulated
NFE2L2, suggesting enhanced oxidative stress protection and fibroblast resilience (
Figure 9A). By 72 h, gene expression patterns became more pronounced. The 2% Extract 1 significantly upregulated all tested genes, particularly
COL1A1 and
COL3A1, indicating robust stimulation of collagen synthesis and ECM maintenance. Extract 2 also promoted increases in
COL1A1 and
CDKN1A, reinforcing its role in enhancing stress resilience. Similarly, EV treatment resulted in strong upregulation of
COL3A1 and
CDKN1A, suggesting improved collagen synthesis and cellular protective responses. Notably,
NFE2L2 was consistently upregulated across all treatments, further supporting the antioxidant defence mechanisms in fibroblasts (
Figure 9A).
At 24 h, treatment with 10% Extract 1 led to a slight increase in
COL1A1 and a notable elevation of
CDKN1A, similar to the effects observed with the 2% concentration, but with stronger activation of stress-related pathways. Extract 2 at 10% maintained
COL1A1 stability but reduced
COL3A1, while moderately increasing
CDKN1A, indicating potential senescence-associated changes. Treatment with 10% EVs, in contrast, resulted in a decrease in
COL1A1 but an increase in
COL3A1, alongside significant upregulation of both
CDKN1A and
NFE2L2, suggesting a protective cellular response against oxidative stress (
Figure 9B). By 72 h, gene expression changes became more pronounced across all treatments. Extract 1 at 10% led to substantial upregulation of
COL1A1,
COL3A1, and
CDKN1A, confirming its role in stimulating collagen synthesis and skin structure maintenance. Extract 2 exhibited similar effects, with increased
COL1A1 and
CDKN1A, reinforcing its role in fibroblast resilience and stress adaptation. EVs at 10% showed strong upregulation of
COL3A1 and
CDKN1A, indicating enhanced ECM support and a protective effect on fibroblast function (
Figure 9B).
The gene expression analysis reveals that H. rhodopensis in vitro culture extracts and EVs exert a dynamic influence on fibroblast function, with concentration- and time-dependent effects. At lower concentrations (2%), the treatments primarily supported ECM maintenance, as seen in the upregulation of COL1A1 and COL3A1, while also enhancing oxidative stress resilience through NFE2L2 activation. The increase in CDKN1A at 24 h suggests a temporary stress response, which appears to shift toward cellular adaptation by 72 h, particularly in Extract 1- and EV-treated groups. Higher concentrations (10%) exhibited a more complex response, with a stronger induction of COL1A1 and COL3A1, indicative of collagen synthesis stimulation, but also a pronounced upregulation of CDKN1A, suggesting possible senescence-associated mechanisms. The consistent activation of NFE2L2 across treatments underscores the antioxidant potential of these bioactive compounds, which could contribute to fibroblast protection against age-related oxidative stress. These findings suggest that H. rhodopensis in vitro culture extracts and EVs may serve as effective agents for promoting skin regeneration, balancing collagen synthesis, and mitigating oxidative damage, with an optimal concentration range needed to maximize benefits while avoiding excessive stress responses.


 ,
, 


