Abstract
Humans are exposed to pollutants daily through various routes, including skin contact. A key concern is the presence of endocrine-disrupting chemicals, which means they can mimic, block or interfere with the body’s natural hormones, in many everyday items, among which are personal care products. We set up a chromatographic method to simultaneously assess the occurrence of nine endocrine disruptors and to verify the compliance with mandatory regulations concerning the potential fraudulent additions of preservatives. A total of twenty-six haircare products were collected and analyzed. The limits of detection ranged from 0.052 μg mL−1 to 1.744 μg mL−1, while the limits of quantification ranged from 0.175 μg mL−1 to 5.815 μg mL−1, respectively. Analyte recovery was between 66% and 87%, demonstrating the accuracy of the method in these target formulations. Even if the recovered quantity of parabens did not exceed the legal limits, the analysis detected bis(2-ethylhexyl) phthalate (DEHP) in 2 real samples and dibutyl phthalate (DBP) in all 26 samples, with concentrations ranging from 151.01 μg/100 g to 1042.58 μg/100 g. Although the European Union regulates the quantity of potentially harmful compounds in consumer goods, repeated use of certain products, such as haircare formulations, could result in chronic exposure to several endocrine disruptors.
1. Introduction
Humans are exposed daily to various pollutants through the diet, air and skin contact. Although the skin is not the primary route of exposure, it can still offer as a significant pathway for contaminants to enter the human body, due to its large surface area, as skin is the largest organ in the human body. In recent years, increasing attention has been paid to Contaminants of Emerging Concern (CECs), particularly those exhibiting endocrine-disrupting activity and, therefore, classified as endocrine-disrupting chemicals (EDCs). EDCs encompass a structurally diverse group of chemicals, including both natural and synthetic compounds widely used in industrial sectors. Industrial solvents and lubricants, polychlorinated biphenyls (PCBs), plastic monomers such as bisphenol A (BPA) and its analogs and plasticizers like phthalates are only some human-made chemicals, with over 1000 potential endocrine disruptors identified by the Endocrine Society [1]. EDCs are commonly found in everyday products, including cosmetics and personal care products (PCPs), raising public health concerns. PCPs primarily expose individuals to EDCs through skin contact [2]. Ingredients such as parabens, UV filters and fragrances can penetrate the skin barrier and reach the systemic circulation, posing significant health risks [3]. EDCs are chemicals that mimic or interfere with natural hormonal functions, impacting the endocrine homeostasis and thus contributing to diseases, such as thyroid disorders, reproductive issues and even cancer, for women, men and offspring. Research also suggests that EDCs may be transferred via the placenta to the fetus [4]. Nowadays, PCPs are used not only by women but also increasingly by men, who have expanded their use beyond traditional lotions. The European Union has taken significant actions to address the risks posed by EDCs, particularly in the cosmetics sector [5]. The EU regulatory framework manages these substances through risk assessment conducted by the Scientific Committee on Consumer Safety (SCCS) [6] and applies the precautionary principle to enable protective measures. Despite efforts to reduce exposure, several challenges persist, including restrictive criteria for identifying EDCs, incomplete data and limitations such as the ban on animal testing, which complicate the identification of new chemicals with endocrine activity [7]. Furthermore, reliance on industry-provided data undermines transparency and public trust. While some EDCs have been identified and restricted, many remain unregulated, leading to criticism that the framework fails to fully protect public health and the environment. Stakeholders advocate for broader definitions of EDCs, better testing methods and more public engagement in decision-making to address these gaps and enhance safety measures. To date, much attention has been focused on skin exposure as a route for EDC absorption, while limited studies have investigated potential absorption through the scalp using dedicated products [8,9,10]. The scalp exhibits a unique structure compared to other skin areas. Its anatomy is quite complex and is made up of five distinct layers, each differing in structure, function and cellular composition [11]. These fine membranes and connective tissues house a detailed network of blood vessels, nerves and hair follicles, along with other elements. All of this exists within a tissue layer that is only 5–10 mm thick, surrounding the skull and the brain. Furthermore, the scalp is characterized by a high density of hair follicles [9], sebaceous glands and a thinner epidermal barrier in certain regions [10]. These features may enhance the absorption of lipophilic and low-molecular-weight compounds [10]. Furthermore, frequent use of haircare products such as shampoos, conditioners and masks can result in prolonged exposure to potentially harmful substances, with the scalp serving as an overlooked but significant entry point for EDCs. Identifying EDCs in PCPs—particularly in haircare items—can help establish a robust framework for determining the potential risks, or lack thereof, associated with daily use. This approach is crucial in assessing the long-term effects of such exposure and ensuring the safety of consumer products. In this work, we focused on nine assessed and/or suspected EDCs belonging to various chemical classes: parabens (PBs), phthalates (PHTs) and triclosan (TCS). PBs have long been considered harmless and are widely used as preservatives in many consumer goods to prevent the growth of microorganisms. However, over the last two decades, a debate has been ongoing about their safety, primarily due to their estrogenic activity, as it was demonstrated that they can bind to estrogenic receptors of cells and therefore disrupt the hormonal balance [12]. The EU established specific concentration limits for authorized PBs, namely, methylparaben (MP), ethylparaben (EP), propylparaben (PrP) and butylparaben (BuP), requiring that each PB does not exceed 0.4% when used individually, or a total of 0.8% when used in combination. PHTs, which are esters of phthalic acid, have been included in this research because certain congeners, such as Bis(2-ethylhexyl) phthalate (DEHP) and dibutyl phthalate (DBP), are used to dissolve other substances and/or as plasticizers. PTHs can be employed in the manufacturing of some haircare products primarily to ensure that fragrances last longer, hidden as “fragrance” or “parfum” on the label, according to the INCI (International Nomenclature of Cosmetic Ingredients). Finally, we included in the set of chemicals under our investigation TCS, an antibacterial and antifungal banned by the US Food and Drug Administration in some PCPs but allowed in the EU by the Scientific Committee on Consumer Safety (SCCS) (UE 2024/996). Despite several studies having been published, they typically address a smaller number of analytes than those examined in our study, or—when the number of analytes is comparable—they focus on compounds within a single structural class [13]. The aim of this research was to verify the correct amounts of several compounds declared on the label, and at the same time, to assess the possible fraudulent use of those forbidden—isopropyl 4-hydroxybenzoate (iPrP), benzyl 4-hydroxybenzoate (BzP) and isobutyl 4-hydroxybenzoate (iBuP)—validating a routinely and easy-to-perform method. All the chemicals under investigation are reported in Figure 1 as chemical structures.
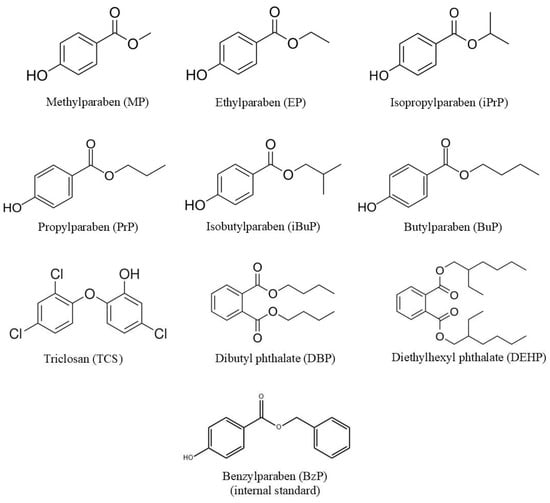
Figure 1.
Chemical features of investigated EDCs, and of BzP used as internal standard (IS).
2. Materials and Methods
2.1. Chemicals and Materials
All the reagents used in this study were commercially available and of analytical grade. Acetonitrile (ACN), methanol (MeOH) and trifluoracetic acid (TFA) (minimum purity ≥ 98.0%) were purchased from Sigma Aldrich (Milan, Italy). Bis(2-ethylhexyl) phthalate (DEHP; minimum purity ≥ 98.0%), dibutyl phthalate (DBP; minimum purity ≥ 99.0%) and triclosan (TCS; minimum purity ≥ 97.0%) were purchased from Sigma-Aldrich (Dorset, UK). Methyl 4-hydroxybenzoate (MP), ethyl 4-hydroxybenzoate (EP), propyl 4-hydroxybenzoate (PrP) and butyl 4-hydroxybenzoate (BuP) were purchased from Merck & Co. (Poole, UK). Isopropyl 4-hydroxybenzoate (iPrP) was purchased from Fluorochem (Hadfield, UK), benzyl 4-hydroxybenzoate (BzP) was purchased from Sigma Aldrich (Milan, Italy) and isobutyl 4-hydroxybenzoate (iBuP) was purchased from J&K Scientific (San Jose, CA, USA). The purity of all PBs was equal to or higher than 98%.
2.2. Instrumentation and Conditions
Milli-Q water was produced in-house, and its conductivity was 0.055 μS cm−1 at 25 °C (resistivity equals 18.2 MΩ·cm). The chromatographic system consisted of a quaternary gradient pump (Jasco PU-2089 Plus), a 7725 Rheodyne injection valve fitted with a 20 μL loop and a multi-wavelength detector (PDA) (Jasco MD-2010-Plus). The analyses were performed on a reverse-phase LC column Kinetex phenyl-hexyl 100 Å (Phenomenx, Torrance, CA, USA), 150 × 4.6 mm, 5.0 μm particle size, at room temperature (20 ± 2 °C).
2.3. Optimized Final Methods
The haircare products were selected based on their labels. Ingredients of all the analyzed PCPs are reported in Table S1 in the Supplementary Material section. We selected 26 PCPs, among which there were 19 hair masks, 2 shampoos and 2 hair conditioners, choosing samples commercially available in Italy regardless of brands and claims, but from different countries. BzP was chosen as the internal standard (IS) after the analysis of each sample as a preliminary step to determine a possible its fraudulent addition despite being banned. Samples were extracted as follows: 25 mg of each hair product was analytically weighted, and we added 500 µL of BzP 1 mg mL−1 in EtOH, vortexed for 1.0 min and then sonicated for 15 min. Next, 25.0 mL of extraction solvent (60:40 (v/v) EtOH:n hexane mixture) was added to each sample and again vortexed for 1 min and centrifuged for 15 min, 6000 g (LLG-uniCFUGE2). All real samples were filtered before the analysis with a 0.45 μm syringe filter. We analyzed two procedural blanks for all target compounds (MP, EP, iPrP, PrP, iBuP, BuP, TCS, DBP and DEHP) and we did not detect trace levels of any compounds under analysis. The chromatographic analysis was performed as follows: the mobile phase was 0.01% TFA Milli Q (A): ACN (B), the flow rate was set to 1.0 mL min−1 and, for the best precision, the sample loop was overfilled with a minimum of three times the sample loop volume in a “full-loop” injection mode (60 μL). The gradient program was as follows: 0 min 30.0% B; 10 min: 35% B; 25 min 95% B; 30 min 95% B; 30.1 min 30% B; and 40 min 30% B. All mobile phases were vacuum filtered through 0.45 μm nylon membranes (Millipore, Burlington, MA USA). Data acquisition and integration were accomplished by Chrompass software, (Version v1.7) performed with a multiwavelength detector at λ 220 nm for DEHP, DBP and TCS and λ 254 nm for PBs, respectively. Each sample was injected three times to test the instrument repeatability. Calibration curves were obtained by plotting peak areas against concentrations of the analytes. Some analytes investigated in this research can be released from plastic labware; therefore, care was taken by the analyst using glassware materials, washed using only organic solvents and water, or if necessary, we properly treated plastic equipment to avoid possible background contamination, by keeping the plastic labware in contact with a solution of 50:50 n hexane–tetrahydrofuran for 3 h before use [14].
2.4. Method Validation Results
The validation parameters determined are described in the ICH Q2a [15]. Specificity was assessed through injection of a procedural blank, not containing the matrix, but which underwent the entire measurement process like a test sample, to verify any contamination or interference caused by reagents or sample tubes or introduced during any part of the measurement procedure; procedural samples were spiked with IS to verify the occurrence of interfering peaks, eluting at the same retention time. Linearity was assed, through the set-up of calibration curves ranging from 1.0 to 30.0 µg mL−1 by plotting the average peak areas against the analyte concentrations. Linear regression analysis was performed, and the correlation coefficient, slope and intercept were calculated using the least squares regression line, using Microsoft Excel® 2021 software. Accuracy and precision, i.e., the closeness of the test results to the true or theoretical value and the degree of scatter between replicate measurements of the same sample under the same conditions, respectively, were evaluated. Recovery rates were reported as a percentage of the concentration of IS; precision was assessed by analyzing ten replicates of the sample on the same day and across two different days to capture both intra-day and inter-day variability, with results expressed as relative standard deviation (RSD). Repeatability was tested using a nominal concentration of 1.0 μg mL−1 of all investigated analytes. The limit of quantitation (LOQ) and limit of detection (LOD), the lowest amount of an analyte that can be quantitated with suitable accuracy and precision and the lowest amount of an analyte that can be detected, respectively, were estimated as follows: LOD = (SD∙3)/S and LOQ = (SD∙10)/S, where SD represents the standard deviation of the intercept with the y-axis from the calibration curves, and S is the slope of the calibration curve. To that end, a standard solution with all investigated analytes in pure solvent was tested ten times to ensure it fell within the appropriate range. Figure S1 (Supplementary Material) shows a chromatogram of a real sample spiked with all analytes at 5 µ mL−1. The matrix effect was determined by calculating the ratio of the peak area in a spiked real sample to the peak area in a pure solution. The spiking was executed at 20.0 μg mL−1.
Robustness, the reliability of an analysis with respect to deliberate variations in different batches and grades of solvents (ACN, EtOH), reagents (TFA, water) and equipment, was determined, as well as adjusting sonication and centrifugation times. Furthermore, robustness was tested by two analysts on two days and two reverse stationary phases. System suitability testing (SST), defined by the ICH as “the checking of a system to ensure the performance of the system”, was also performed. It was an integral part of our analytical procedures, based on the concept that the equipment, analytical operations and samples constitute an integral system that can be evaluated as such, which was carried out through the assessment of resolution (R), column efficiency (N), tailing factor (T) and retention factor (k), relative standard deviation (RSD) of peak response, h (HETP) (corresponding to the length of the column (L) divided by the number of theoretical plates (N)) and retention time, to confirm that the analytical method was appropriate for its intended purpose.
3. Results
3.1. Method Validation
Due to the complex composition of the haircare products investigated, extraction procedures were adopted before the chromatographic analysis. The influence of solvents with different polarities, such as MeOH, ACN, ethyl acetate and isopropyl alcohol, was tested and the extraction trials were carried out using solvents alone or mixtures in various ratios and volumes (for instance, 50:50 EtOH: n hexane, and 60:40 isopropyl alcohol: n hexane), with and without sonication and modifying its duration. Although BzP belongs to PBs’ class, it has been forbidden in PCPs; however, it was chosen as IS, because it is an analog and it has a Log p value of 3.6 (Chemspider), which is a value higher than its structural analogs but lower than the other analyzed chemicals. The results showed a good recovery yield for almost all the analytes, demonstrating that a straightforward mixture of solvents is enough for an exhaustive extraction, without additional clean-up steps or further time-consuming sample preparation.
The method was proven to be selective; because each compound had a distinct retention time, there was no chromatographic peak overlap in the analysis of procedural blanks and real samples. To assess method linearity, standard curves for the nine analytes were analyzed, and the results were plotted as the peak area response ratio against the standard concentration (µg mL−1); the regression analysis for all analytes demonstrated linearity, within the tested concentration range of 1–30 µg mL−1. The coefficient of determination (R2) ranged between 0.9794 and 0.9976, and the regression model was significant (p-value < 0.001). Analyte recoveries ranged from 66% to 87%, demonstrating the method’s accuracy in target formulations. Precision values ranged from 2.61% to 9.90%. Assay robustness results were within 5% (relative), confirming the method’s robustness. LOD values ranging from 0.052 μg mL−1 to 1.744 μg mL−1, while LOQ values were from 0.175 μg mL−1 to 5.815 μg mL−1, demonstrating a good sensitivity of the method. Indeed, LOQ ranges were aligned with the amounts allowed in cosmetics and PCPs according to EU law [16], indicating that the method provides the required sensitivity to assess compliance with European regulations. Overall, these results suggest that the method is accurate and precise across the entire working range. SST was performed every time, just before or alongside the analysis of the real samples. For the SST to be considered reliable, the instrument needed to be properly qualified in advance, and the method must have been previously validated. All validation parameters are reported in Table 1, while SST parameters are listed in Table 2. The resolution was >1.5 for BuP and iPrP (0.79 and 1.08 values, respectively) but resolved for more than 50%. The number of theoretical plates (N) of the column for separation, the tailing factor (T) and the retention factors (k) for all compounds showed that the peaks were perfectly symmetrical and that the method has good reproducibility.

Table 1.
Analytical method validation parameters.
Table 2.
System suitability parameters. N, Number of theoretical plates per column; h, Height equivalent to one theoretical plate, mm; h, Reduced plate height.; k, Retention factor; R, Resolution; T, Tailing factor.
3.2. Application to Real Samples
The validated method was applied to twenty-six PCPs for haircare, to (a) check the suitability of the method for the analysis of the EDC selected panel, (b) verify a possible fraudulent addition of the forbidden PBs and (c) evaluate the concentrations of the investigated analytes for compliance with current European legislation. Figure 2 shows chromatograms of a calibration standard (30 µg mL−1) and two real samples, positive for at least one of the investigated chemicals.
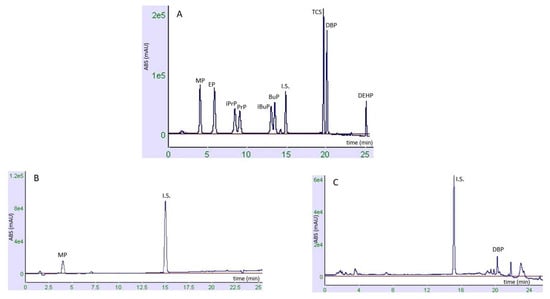
Figure 2.
(A) Chromatogram of a calibration standard (30 μg mL−1). (B) Real sample n.1, containing methylparaben as a preservative, acquired at λ 254 nm. (C) Real sample n.4, containing MP, EP, PrP and BuP as preservatives, found at values < LOQ, and DPB as a contaminant, acquired at λ 220 nm (C).
The well-defined peaks of the analytes suggest that the analytical method was adequate both for the extraction procedure and the analysis, indicating the applicability of the method in monitoring commercial samples. Table 3 summarizes the results: out of the twenty-six analyzed real samples, ten samples showed the occurrence of at least one PB on their labels. The analysis revealed that the detected quantities were within the legal limits: below 0.4% when present alone (ranging from 0.10% to 0.28%) and <0.8 when present in mixtures (ranging from 0.21% to 0.52%). The remaining sixteen samples did not report any PBs on their labels, and our analysis confirmed their absence. TCS was not detected in any of the real samples, while DEHP was found in two samples. DBP, however, was found in all 26 samples, with concentrations ranging from 151.01 μg/100 g to 1042.58 μg/100 g.
Table 3.
Concentrations found in real samples analyzed. For PBs, the concentration is expressed as w/w %; for TCS, DBP and DEHP, the concentration is reported as μg in 100 g of matrix. * For legal limits, refer to Annex V in Regulation (EC) No. 1223/2009 of EU (Union, 2014). nd: not detected. na: not applicable; since some values are <LOQ, the sum is not precisely calculable.
4. Discussion
4.1. EDCs and Transdermal Permeation Through the Scalp
Emerging research indicates the occurrence of EDCs in several human biological matrices, including the selected compounds of the present work [17,18,19,20]. EDCs have been shown to act at very low doses and may exert synergistic effects [21]. In this context, even small aliquots of EDCs eventually crossing the scalp skin, below the concentration values causing acute toxicity, can cause multiple and chronic exposure. For example, exposure to PBs has been associated with reduced fertility and adverse effects on the development of both male and female reproductive systems. Their interference with estrogens has also raised concerns regarding an increased risk of estrogen-dependent tumors, such as breast cancer, particularly following the topical exposure of PB-containing cosmetics in the underarm area [22]. Although the mechanism by which PBs act as xenoestrogens is not yet fully understood, one hypothesis suggests that their biological activity may be related to the inhibition of the enzyme 17β-hydroxysteroid dehydrogenase type 2, at micromolar concentrations, which could increase the conversion of estradiol into the weaker estrone [23].
Another hypothesis proposes that PBs can inhibit aromatase, a key enzyme in steroidogenesis, at much lower concentrations than those needed to induce proliferation of human breast cancer MCF-7 cells, suggesting a potentially more pronounced anti-estrogenic effect. Additionally, PBs can cause allergic reactions and contact dermatitis, and they have been detected in various human tissues, confirming that exposure to these substances is unavoidable in daily life [24]. Because the hair shaft lacks metabolism or excretion processes, EDCs can also accumulate in the hair fiber structure from exogenous sources over long periods [25]. Indeed, hair can accumulate PBs, as demonstrated by studies conducted by Li et al. in Northeast China [26] and by Gonkowski et al. [27]. In addition, TCS has been detected in hair samples collected from 60 adults, with 71% of the samples testing positive, followed by MP in 17% of the samples [28].
Molecular permeation across the skin occurs through several pathways, such as the transcellular route, i.e., directly through corneocytes, encountering low-lipid regions within the cytoplasm, which may facilitate the crossing [29]. In contrast, the intercellular pathway requires molecules to navigate dense lipid layers and fatty acids. These layers feature both hydrophilic and lipophilic regions, creating a highly resistant barrier to permeation, particularly when aided by sebum or interactions with the follicular epithelium. Alternatively, several molecules can diffuse via the appendageal route [30]. The interplay between pathways, particularly the lipoidal diffusion of the target molecule, highlights the complexity of the permeation. Even when PCPs’ labels comply with current regulations, several studies have detected unauthorized EDCs, either added intentionally or leached from packaging materials [13,31].
Although all the real samples analyzed in this study, aiming to assess the suitability of the validated method, showed PB concentrations—whether individually or in mixtures—below the legal limits and consistent with the declared label, it is important to emphasize that hair PCPs are not the only route of exposure to these chemicals. Furthermore, since PBs share common features, they can exert an additive effect. For instance, the sample n.11 in Table 3 contains more than one PB, with a total concentration of 0.51%, showing a value below the legal limit of 0.8% for mixtures, but slightly exceeding the maximum limit of 0.4% for a single substance.
European law regulates the amount of TCS, which is currently listed under entry 25 of Annex V to Regulation (EC) No. 1223/2009. TCS is permitted as a preservative in cosmetic products at a maximum concentration of 0.3% in items such as toothpastes, hand soaps, body soaps/shower gels, deodorants (non-spray), face powders and blemish concealers, and in nail products used for cleaning before the application of artificial nail systems, with a maximum concentration of 0.2% in mouthwashes [16]. We did not find TCS in any of the real samples, while 2 samples showed DEHP levels, but surprisingly, we found DBP in all 26 samples. DBP is, historically, the primary phthalate used in cosmetic products as a plasticizer, and PTHs have been detected in the human urine [32], even if they are banned in European PCPs by Annex XIV of REACH, due to their disrupting potential for human endocrine system. Nevertheless, they can migrate from packaging, where they are added as plasticizers, or be present hidden under the “perfumes and fragrances” wording. Especially if low-molecular-weight, they are quickly absorbed by the skin and have been demonstrated to affect several functions [24].
Louzau et al. [33] analyzed the concentration levels of different PTHs in various PCPs, among which were hair products marketed in France and Spain. They found that DBP was the second most frequently detected phthalate, followed by DEHP, and Huaijun et al. [34] found a detection frequency of 98.2% DBP among 56 analyzed face masks. This demonstrates that DBP occurs in several PCPs, where it is either present as a raw material or originates from packaging migration.
4.2. Implications Concerning Regulatory Limits
Despite the safety and quality required according to current regulations, cosmetics and PCPs can contain EDCs, which may not be deliberately added but rather migrate from plastic packaging. Even if in the EU and China, PTHs are not allowed or severely restricted, in the USA, there is no formal prohibition of their use in cosmetics. Therefore, the monitoring and assessment of exposure are critical to ensuring consumer safety, mostly for PCPs imported from non-EU countries. The development of rapid and precise analytical methods to detect and quantify the most common EDCs in products is essential. Although numerous methods have been developed for detecting PBs [35], PHTs [36] and TCS [37] in various matrices [38,39,40], none have yet been officially regulated for use in cosmetics, a gap that needs to be addressed [13]. Our proposed method can offer a simple, rapid and easy-to-perform approach for assessing the most frequent EDCs in hair PCPs with diverse ingredients in their formulations.
5. Conclusions
Several endocrine-disrupting chemicals have been restricted or banned in cosmetics and personal care products due to the considerable health risks associated with their use. These substances have been linked to hormonal imbalances and other long-term health concerns, prompting stricter regulatory actions worldwide. As a result, there is a growing and urgent need to investigate as much as possible analytes belonging to different chemical classes in real-world settings. Routine detection and quantification of these compounds in cosmetic formulations may ensure consumer safety and enable a more comprehensive assessment of human exposure. In response to this need, the present study proposes an analytical method for the separation of nine suspected or proven EDCs in hair cosmetic products according to established analytical guidelines. The proposed method is time-efficient, requires only small amounts of sample and organic solvents and is well-suited for routine applications in quality control and safety monitoring. Although the method is adequate to assess the amounts of the permitted analytes, more sensitive techniques such as mass spectrometry could be more suitable to detect contaminants in traces. Moreover, a significant challenge remains: the substitution of hazardous EDCs with safer, environmentally friendly alternatives. The identification and implementation of “green” substitutes that maintain product performance, while eliminating health risks, is a crucial next step in improving the safety of cosmetic and personal care products.
Supplementary Materials
The following supporting information can be downloaded at https://www.mdpi.com/article/10.3390/cosmetics12030116/s1, Figure S1: Real sample spiked with all analytes at concentration of 5 µg mL−1; Table S1: INCI of cosmetic products under analysis.
Author Contributions
L.G. and S.L. conceptualization, writing original draft; I.N. validation, formal analysis, investigation; T.D.S. data curation; G.R. visualization; R.D.L. validation, formal analysis, supervision. All authors have read and agreed to the published version of the manuscript.
Funding
This research received no external funding.
Institutional Review Board Statement
Not applicable.
Informed Consent Statement
Not applicable.
Data Availability Statement
Data available on request.
Conflicts of Interest
The authors declare no conflicts of interest.
References
- Endocrine Society. Common EDCs and Where They Are Found. Available online: https://www.endocrine.org/topics/edc/what-edcs-are/common-edcs (accessed on 11 May 2025).
- Kalofiri, P.; Biskanaki, F.; Kefala, V.; Tertipi, N.; Sfyri, E.; Rallis, E. Endocrine Disruptors in Cosmetic Products and the Regulatory Framework: Public Health Implications. Cosmetics 2023, 10, 160. [Google Scholar] [CrossRef]
- Archer, C.B. Functions of the Skin. In Rook’s Textbook of Dermatology; Wiley: Hoboken, NJ, USA, 2010; pp. 1–11. [Google Scholar]
- Li, A.; Zhuang, T.; Song, M.; Cao, H.; Gao, Y.; Zheng, S.; Liang, Y.; Jiang, G. Occurrence, placental transfer, and health risks of emerging endocrine-disrupting chemicals in pregnant women. J. Hazard. Mater. 2023, 459, 132157. [Google Scholar] [CrossRef] [PubMed]
- Regulation (EC) No. 1223/2009 of the European Parliament and of the Council of 30 November 2009 on Cosmetic Products. Off. J. Eur. Union. 2009, L342, 59–209.
- Bodin, L.; Rogiers, V.; Bernauer, U.; Chaudhry, Q.; Coenraads, P.J.; Dusinska, M.; Ezendam, J.; Gaffet, E.; Galli, C.L.; Granum, B.; et al. Opinion of the Scientific Committee on Consumer Safety (SCCS)—Final Opinion on propylparaben (CAS No 94-13-3, EC No 202-307-7). Regul. Toxicol. Pharmacol. 2021, 125, 105005. [Google Scholar] [CrossRef]
- Berggren, E. Current trends in safety assessment of cosmetics ingredients. Regul. Toxicol. Pharmacol. 2022, 134, 105228. [Google Scholar] [CrossRef]
- Siquier-Dameto, G.; Boisnic, S.; Verdú, E. Revitalizing Effect on the Scalp After Injection with a Mechanically Stabilized Hyaluronic Acid Complex in Subjects with Androgenetic Alopecia. J. Clin. Med. 2024, 13, 6878. [Google Scholar] [CrossRef]
- Gu, Y.; Bian, Q.; Zhou, Y.; Huang, Q.; Gao, J. Hair follicle-targeting drug delivery strategies for the management of hair follicle-associated disorders. Asian J. Pharm. Sci. 2022, 17, 333–352. [Google Scholar] [CrossRef] [PubMed]
- Ogiso, T.; Shiraki, T.; Okajima, K.; Tanino, T.; Iwaki, M.; Wada, T. Transfollicular drug delivery: Penetration of drugs through human scalp skin and comparison of penetration between scalp and abdominal skins in vitro. J. Drug Target. 2002, 10, 369–378. [Google Scholar] [CrossRef]
- Ellis, H.; Mahadevan, V. The surgical anatomy of the scalp. Surgery 2014, 32, e1–e5. [Google Scholar] [CrossRef]
- Fransway, A.F.; Fransway, P.J.; Belsito, D.V.; Yiannias, J.A. Paraben Toxicology. Dermatitis 2019, 30, 32–45. [Google Scholar] [CrossRef]
- Martín-Pozo, L.; Gómez-Regalado, M.d.C.; Moscoso-Ruiz, I.; Zafra-Gómez, A. Analytical methods for the determination of endocrine disrupting chemicals in cosmetics and personal care products: A review. Talanta 2021, 234, 122642. [Google Scholar] [CrossRef] [PubMed]
- Olivieri, A.; Degenhardt, O.S.; McDonald, G.R.; Narang, D.; Paulsen, I.M.; Kozuska, J.L.; Holt, A. On the disruption of biochemical and biological assays by chemicals leaching from disposable laboratory plasticware. Can. J. Physiol. Pharmacol. 2012, 90, 697–703. [Google Scholar] [CrossRef] [PubMed]
- European Union Guidelines. ICH Guideline Q2(R2) on Validation of Analytical Procedures; European Medicines Agency: Amsterdam The Netherlands, 2022. [Google Scholar]
- European Union. Amending Annex V to Regulation (EC) No 1223/2009 of the European Parliament and of the Council on Cosmetic Products; No 1003/2014; European Union: Brussels, Belgium, 2014. [Google Scholar]
- Song, S.; He, Y.; Zhang, T.; Zhu, H.; Huang, X.; Bai, X.; Zhang, B.; Kannan, K. Profiles of parabens and their metabolites in paired maternal-fetal serum, urine and amniotic fluid and their implications for placental transfer. Ecotoxicol. Environ. Saf. 2020, 191, 110235. [Google Scholar] [CrossRef]
- Hines, E.P.; Mendola, P.; von Ehrenstein, O.S.; Ye, X.; Calafat, A.M.; Fenton, S.E. Concentrations of environmental phenols and parabens in milk, urine and serum of lactating North Carolina women. Reprod. Toxicol. 2015, 54, 120–128. [Google Scholar] [CrossRef]
- Yang, D.; Kong, S.; Wang, F.; Tse, L.A.; Tang, Z.; Zhao, Y.; Li, C.; Li, M.; Li, Z.; Lu, S. Urinary triclosan in south China adults and implications for human exposure. Environ. Pollut. 2021, 286, 117561. [Google Scholar] [CrossRef]
- Gao, Q.; Song, Y.; Jia, Z.; Huan, C.; Cao, Q.; Wang, C.; Mao, Z.; Huo, W. Association of exposure to a mixture of phenols, parabens, and phthalates with altered serum thyroid hormone levels and the roles of iodine status and thyroid autoantibody status: A study among American adults. Ecotoxicol. Environ. Saf. 2024, 282, 116754. [Google Scholar] [CrossRef]
- Vandenberg, L.N. Chapter Five—Low-Dose Effects of Hormones and Endocrine Disruptors. In Vitamins & Hormones; Litwack, G., Ed.; Academic Press: Cambridge, MA, USA, 2014; Volume 94, pp. 129–165. [Google Scholar]
- Neri, I.; MacCallum, J.; Di Lorenzo, R.; Russo, G.; Lynen, F.; Grumetto, L. Into the toxicity potential of an array of parabens by biomimetic liquid chromatography, cell viability assessments and in silico predictions. Sci. Total. Environ. 2024, 917, 170461. [Google Scholar] [CrossRef]
- Engeli, R.T.; Rohrer, S.R.; Vuorinen, A.; Herdlinger, S.; Kaserer, T.; Leugger, S.; Schuster, D.; Odermatt, A. Interference of Paraben Compounds with Estrogen Metabolism by Inhibition of 17β-Hydroxysteroid Dehydrogenases. Int. J. Mol. Sci. 2017, 18, 2007. [Google Scholar] [CrossRef] [PubMed]
- Sree, C.G.; Buddolla, V.; Lakshmi, B.A.; Kim, Y.-J. Phthalate toxicity mechanisms: An update. Comp. Biochem. Physiol. Part C Toxicol. Pharmacol. 2023, 263, 109498. [Google Scholar] [CrossRef]
- Tang, B.; Zheng, J.; Xiong, S.-M.; Cai, F.-S.; Li, M.; Ma, Y.; Gao, B.; Du, D.-W.; Yu, Y.-J.; Mai, B.-X. The accumulation of organic contaminants in hair with different biological characteristics. Chemosphere 2023, 312, 137064. [Google Scholar] [CrossRef]
- Li, Y.; Zheng, N.; Sun, S.; Wang, S.; Li, X.; Pan, J.; Li, M.; Lang, L.; Yue, Z.; Zhou, B. Exposure estimates of parabens from personal care products compared with biomonitoring data in human hair from Northeast China. Ecotoxicol. Environ. Saf. 2023, 267, 115635. [Google Scholar] [CrossRef] [PubMed]
- Gonkowski, S.; Tzatzarakis, M.; Kadyralieva, N.; Vakonaki, E.; Lamprakis, T. Exposure assessment of dairy cows to parabens using hair samples analysis. Sci. Rep. 2024, 14, 14291. [Google Scholar] [CrossRef]
- Tian, X.; Huang, K.; Liu, Y.; Jiang, K.; Liu, R.; Cui, J.; Wang, F.; Yu, Y.; Zhang, H.; Lin, M.; et al. Distribution of phthalate metabolites, benzophenone-type ultraviolet filters, parabens, triclosan and triclocarban in paired human hair, nail and urine samples. Environ. Pollut. 2023, 333, 122083. [Google Scholar] [CrossRef]
- Yu, Y.-Q.; Yang, X.; Wu, X.-F.; Fan, Y.-B. Enhancing Permeation of Drug Molecules Across the Skin via Delivery in Nanocarriers: Novel Strategies for Effective Transdermal Applications. Front. Bioeng. Biotechnol. 2021, 9, 646554. [Google Scholar] [CrossRef]
- Fore, J. A review of skin and the effects of aging on skin structure and function. Ostomy Wound Manag. 2006, 52, 24–35, quiz 36–37. [Google Scholar]
- van der Schyff, V.; Suchánková, L.; Kademoglou, K.; Melymuk, L.; Klánová, J. Parabens and antimicrobial compounds in conventional and “green” personal care products. Chemosphere 2022, 297, 134019. [Google Scholar] [CrossRef] [PubMed]
- Pagoni, A.; Arvaniti, O.S.; Kalantzi, O.-I. Exposure to phthalates from personal care products: Urinary levels and predictors of exposure. Environ. Res. 2022, 212, 113194. [Google Scholar] [CrossRef]
- Aldegunde-Louzao, N.; Lolo-Aira, M.; Herrero-Latorre, C. Phthalate Esters in Different Types of Cosmetic Products: A Five-Year Quality Control Survey. Molecules 2024, 29, 4823. [Google Scholar] [CrossRef]
- Huaijun, X.; Wenjing, H.; Qing, X.; Tong, X.; Minghua, Z.; Jingwen, C. Face mask—A potential source of phthalate exposure for human. J. Hazard. Mater. 2022, 422, 126848. [Google Scholar] [CrossRef]
- Ocaña-González, J.A.; Villar-Navarro, M.; Ramos-Payán, M.; Fernández-Torres, R.; Bello-López, M.A. New developments in the extraction and determination of parabens in cosmetics and environmental samples. A review. Anal. Chim. Acta 2015, 858, 1–15. [Google Scholar] [CrossRef]
- Dural, E. Determination of Selected Phthalates in Some Commercial Cosmetic Products by HPLC-UV. Comb. Chem. High. Throughput Screen. 2020, 23, 1010–1022. [Google Scholar] [CrossRef] [PubMed]
- Lee, J.D.; Lee, J.Y.; Kwack, S.J.; Shin, C.Y.; Jang, H.J.; Kim, H.Y.; Kim, M.K.; Seo, D.W.; Lee, B.M.; Kim, K.B. Risk Assessment of Triclosan, a Cosmetic Preservative. Toxicol. Res. 2019, 35, 137–154. [Google Scholar] [CrossRef] [PubMed]
- Kaur, R.; Heena; Kaur, R.; Rani, S.; Malik, A.K. Simple and rapid determination of phthalates using microextraction by packed sorbent and gas chromatography with mass spectrometry quantification in cold drink and cosmetic samples. J. Sep. Sci. 2016, 39, 923–931. [Google Scholar] [CrossRef] [PubMed]
- Labat, L.; Kummer, E.; Dallet, P.; Dubost, J.P. Comparison of high-performance liquid chromatography and capillary zone electrophoresis for the determination of parabens in a cosmetic product. J. Pharm. Biomed. Anal. 2000, 23, 763–769. [Google Scholar] [CrossRef]
- Esmaeili Nasrabadi, A.; Ramavandi, B.; Bonyadi, Z.; Farjadfard, S.; Fattahi, M. Landfill leachates as a significant source for emerging pollutants of phthalic acid esters: Identification, occurrence, characteristics, fate, and transport. Chemosphere 2024, 356, 141873. [Google Scholar] [CrossRef]
Disclaimer/Publisher’s Note: The statements, opinions and data contained in all publications are solely those of the individual author(s) and contributor(s) and not of MDPI and/or the editor(s). MDPI and/or the editor(s) disclaim responsibility for any injury to people or property resulting from any ideas, methods, instructions or products referred to in the content. |
© 2025 by the authors. Licensee MDPI, Basel, Switzerland. This article is an open access article distributed under the terms and conditions of the Creative Commons Attribution (CC BY) license (https://creativecommons.org/licenses/by/4.0/).