Article

Anti-Inflammatory Effects of Nephelium lappaceum Peel Extract and Geraniin on External Skin Stimulation

1
Department of Genetics & Biotechnology, Graduate School of Biotechnology, College of Life Sciences, Kyung Hee University, Yongin 17104, Gyeonggi-do, Republic of Korea
2
Invivotec Co., Ltd., Seongnam 13449, Gyeonggi-do, Republic of Korea
3
R&D Center, ACTIVON Co., Ltd., 46-5 Dureungyuri-ro, Ochang-eup, Cheongwon-gu, Cheongju-si 28104, Chungcheongbuk-do, Republic of Korea
*
Authors to whom correspondence should be addressed.
These authors contributed equally to this work.
Cosmetics 2025, 12(3), 117; https://doi.org/10.3390/cosmetics12030117
Submission received: 7 April 2025 / Revised: 8 May 2025 / Accepted: 30 May 2025 / Published: 4 June 2025
(This article belongs to the Section Cosmetic Dermatology)

Abstract

:
Geraniin is the major compound in Nephelium lappaceum peel and exhibits significant immunomodulatory effects. So, this study aimed to evaluate the anti-inflammatory effects of Nephelium lappaceum peel extract and geraniin through in vitro experiments and clinical trials. In vitro, inflammatory responses were induced using UV, IR, SDS, LPS, and RA, followed by treatment with the Nephelium lappaceum peel extract and geraniin. The results demonstrated significant reductions in inflammatory cytokines, indicating potent anti-inflammatory properties. Based on these promising results, clinical trials were conducted to assess the effects of the Nephelium lappaceum peel extract on skin barrier function using various irritants, including IR, UV, SDS, Retinol, and tape stripping. Measurements of transepidermal water loss and erythema were performed to evaluate the extract’s protective effects. The results indicated that Nephelium lappaceum peel extract effectively mitigated skin barrier damage and reduced erythema, confirming its potential as a skin-soothing and anti-inflammatory agent. This study suggests that Nephelium lappaceum peel extract, rich in bioactive compounds such as geraniin, can be utilized in the development of cosmetic products aimed at reducing skin inflammation and protecting against environmental irritants.

1. Introduction

Skin is the largest organ of the human body, making up about 15% of the body’s weight [1]. First, its function is to prevent the loss of moisture and fluids inside the body. It also protects against physical and chemical damage and biological factors such as viruses and bacteria. Finally, it regulates body temperature by sensing sensations such as touch, cold, and heat [2,3]. When the skin barrier function is damaged due to various external stimuli, transepidermal water loss (TEWL), inflammation, and chronic skin diseases may occur [4,5].
Retinol, also known as vitamin A1, is a member of the fat-soluble retinoid group, which includes retinol, retinal, and retinyl esters. It is commonly found in foods and used as a dietary supplement. It is one of the most discussed factors in the cosmetic industry recently. Retinol stimulates collagen synthesis, inhibits MMP activity, reduces oxidative stress, regulates gene expression, and improves both intrinsic and extrinsic signs of aging such as wrinkles, fine lines, and uneven pigmentation [6,7]. However, topical application of retinoids often causes severe local irritation, resulting in sensations of burning, itching, erythema, peeling, or dryness [8]. Although the mechanisms causing retinoid side effects are not fully understood, retinoic acid (RA) therapy has been demonstrated to impair barrier function as assessed by TEWL measurements [9]. Other external irritants such as UV radiation and sodium lauryl sulfate (SLS) could also induce skin inflammation by stimulating the nuclear factor kappa B (NF-κB) pathway, leading to the secretion of cytokines such as tumor necrosis factor-alpha (TNF-α), interleukin-1 alpha (IL-1α), and IL-6, IL-8 [10,11]. UV-B exposure of the skin leads to the production of reactive oxygen species (ROS) and reactive nitrogen species (RNS). The increased production of ROS has been shown to phosphorylate Jun N-terminal kinases (JNKs) and p38 mitogen-activated protein kinases (MAPKs). That activates the transcription factors NF-kB and activator protein 1 (AP-1). These transcription factors regulate the release of cytokines such as TNF-a, IL-6, and IL-8, which contribute to cell inflammation and cell apoptosis [12,13,14,15,16,17]. SLS is one of the most irritating surfactant ingredients with strong cleansing and degreasing abilities. SLS is used in detergents, shampoos, shower gels, etc. However, due to its strong degreasing power, it disrupts the barrier function of the stratum corneum, inducing the infiltration of epidermal inflammatory cells and releasing cytokines such as TNF-α, IL-1α, and IL-8, causing skin inflammation [18,19]. Infrared is an electromagnetic wave with a wavelength of 780 nm to 1000 nm that primarily transmits heat and because it penetrates deep into the skin, it has multiple effects [20]. Excessive exposure to heat can increase heat damage, photoaging, and oxidative stress, and can result in increased TEWL and inflammatory cytokines due to damage to the skin barrier [20,21]. Lipopolysaccharides (LPS) mediate an inflammatory response by binding to Toll-like receptor 4 (TLR4) and activating the transcription factor NF-κB or the MAPK signaling pathway, and the process induces inflammatory cytokines, including TNF-α, the IL-1 family, and IL-6, resulting in a strong immune response [22].
Madecassoside is a major triterpenoid component derived from Centella asiatica that is well known for its anti-inflammatory and skin barrier-strengthening properties [23]. In previous studies, madecassoside has been reported to reduce skin inflammation and support regeneration through mechanisms such as inhibition of the NF-κB pathway, reduction of cytokines (TNF-α, IL-1β), and stimulation of collagen synthesis [24,25].
Prolonged exposure to a variety of physical and chemical irritants, such as masks, UV radiation, particulate matter, and surfactants, can lead to persistent skin inflammation that not only causes cosmetic stress but can also worsen into chronic inflammation [26,27]. Therefore, cosmetics that can relieve skin irritation by using natural compounds such as madecassoside are increasing recently [28,29].
Nephelium lappaceum, also known as rambutan, is a medium-to-large tropical fruit of the Sapindaceae family, native to Southeast Asia. In addition to Southeast Asia, it is grown in many other countries, including India, Sri Lanka, Africa, Central America, and Indonesia. The fruit has a hairy and stiff outer shell that contains white, translucent flesh about 3 to 5 cm long [30]. Nephelium lappaceum peel extract, rich in polyphenolic compounds such as ellagitannins, has been shown to possess strong antioxidant, antipyretic, and antidiabetic activities [31,32,33,34]. Geraniin, a major dehydro-ellagitannin found in Nephelium lappaceum peel, exhibits significant immunomodulatory effects, suppressing TNF-α and NF-κB activation in various in vitro and in vivo models [35,36]. Although Nephelium lappaceum peel is often discarded as waste, it is rich in ellagitannins, including geraniin. Therefore, we considered that it could be a cost-effective ingredient for cosmetic formulations. To date, the anti-inflammatory potential of Nephelium lappaceum peel has not been well documented. Based on this, we hypothesized that Nephelium lappaceum peel may exert anti-inflammatory effects against various stimuli. We subsequently investigated the efficacy of Nephelium lappaceum peel extract and geraniin as novel natural anti-inflammatory agents with skin-protective properties comparable to madecassoside through both in vitro and clinical studies.

2. Materials and Methods

2.1. Materials

Retinoic acid, sodium lauryl sulfate, lipopolysaccharides (O55:B5) were purchased from Sigma-Aldrich (St. Louis, MO, USA). Geraniin was purchased from Cayman Chemical. Retinol was obtained from Invivotec Co., Ltd. (Seongnam-si, Republic of Korea). Standard geraniin (Aktin Chemicals, Inc., Chengdu, China), corilagin (GLPBIO, Montclair, CA, USA), ellagic acid (Thermo Fisher Scientific, Waltham, MA, USA), gallic acid (Sigma-Aldrich, St. Louis, MO, USA), demineralized water (Duksan, Ansan-si, Republic of Korea), and ethanol (Daejung, Siheung-si, Republic of Korea), betaine (Danisco, Copenhagen, Denmark), glycerin (Missy Woman, Seongnam-si, Republic of Korea), xylitol (Bubblebank, Dong-gu, Daegu, Republic of Korea), 1,2-Propanediol (Bubblebank, Republic of Korea), sorbitol (Bubblebank, Republic of Korea), L-Proline (Wuxi Jinghai Amino Acid, Wuxi, China), acetonitrile (Daejung, Republic of Korea), HPLC water (Daejung, Republic of Korea), phosphoric acid (Duksan, Republic of Korea) were obtained.

2.2. Preparation of Extracts

2.2.1. Extraction of Nephelium lappaceum Peel

The peel of Nephelium lappaceum was manually separated from the flesh, washed thoroughly with distilled water, dried completely, and pulverized into fine powder using a laboratory blender. For conventional extraction, 100 mg of the peel powder was mixed with 10 mL of either 50% ethanol or distilled water and subjected to ultrasonic-assisted extraction at 80 °C for 1 h. The extract was then filtered and used for further analysis.

2.2.2. Preparation of Natural Deep Eutectic Solvents (NADESs)

Natural deep eutectic solvents (NADESs) were prepared by combining betaine (a hydrogen bond acceptor, HBA) with 1,3-propanediol (a hydrogen bond donor, HBD) at a molar ratio of 1:2. The mixture was heated and sonicated at 80 °C until a homogeneous transparent liquid was obtained. Distilled water was then added to the NADESs at a 1:1 (v/v) ratio, resulting in a final water content of 50%. For extraction, 100 mg of peel powder was added to 10 mL of the diluted NADESs and sonicated at 80 °C for 1 h. The extract was then filtered and used for ellagitannin quantification.

2.2.3. Ellagitannin Quantification by HPLC

Ellagitannin quantification was conducted using a modified HPLC method based on the protocol [37]. Samples (100 μL) were mixed with 900 μL of 0.5% phosphoric acid in water: acetonitrile (97:3, v/v), vortexed, and filtered through a 0.45 μm syringe filter. A 10 μL aliquot was injected into the HPLC system equipped with UV detection at 270 nm. The mobile phase consisted of solvent A (0.5% phosphoric acid in water) and solvent B (acetonitrile) at a flow rate of 1 mL/min. The gradient was as follows: 97% A and 3% B (0–2 min), 86% A and 14% B (2–5 min), 87% A and 13% B (5–30 min), with isocratic elution at 87% A and 13% B from 30 to 60 min. Geraniin, corilagin, gallic acid (10–1000 μg/mL), and ellagic acid (1–500 μg/mL) were used as external standards for quantification. The geraniin, corilagin, gallic acid, and ellagic acid contents in the extract were determined by comparing the area under curve (AUC) with standards. The linear regression equations were obtained and used to calculate geraniin, corilagin, gallic acid, and ellagic acid in each extract, as follows:
(1)
For geraniin content: Y = 37122X + 50,051 (with R2 = 0.999);
(2)
For corilagin content: Y = 32631X + 76,360 (with R2 = 0.999);
(3)
For gallic acid content: Y = 31305X + 121,233 (with R2 = 0.999);
(4)
For ellagic acid content: Y = 73567X + 138,411 (with R2 = 0.999).

2.3. In Vitro

2.3.1. Preparation and Storage of Reagents

Retinoic acid (RA) was dissolved in chloroform and stored at −20 °C. Sodium lauryl sulfate (SLS) was dissolved in distilled water and stored at room temperature (RT). Lipopolysaccharide (LPS) was dissolved in distilled water and stored at 4 °C. Geraniin was dissolved in dimethyl sulfoxide (DMSO) and stored at −20 °C until use.

2.3.2. Cell Culture

Human HaCaT keratinocytes were cultured in a DMEM medium supplemented with 10% fetal bovine serum (FBS), 100 U/mL penicillin, 100 μg/mL streptomycin (p/s; Welgene, Republic of Korea) at 37 °C in a humidified atmosphere 5% CO2.

2.3.3. Cell Viability Assay

Ez-Cytox assay kit (Daeil Lab Servie Co Ltd., Seoul, Republic of Korea) was used to assess cell viability. A 96-well plate was seeded with HaCaT keratinocytes. At 24 h following sample treatment, cell viability was measured. After adding 10 μL of Ez-Cytox solution to each well, the 96-well plates were incubated in a 5% CO2 incubator for 1 h at 37 °C. Cell viability was measured at 490 nm (Tecan, Mannedorf, Switzerland). By expressing the cell viability as a percentage, relative cytotoxicity was calculated. All experiments were performed in triplicate.

2.3.4. Sample Treatment

HaCaT cells were seeded at a density of 2.5 × 10⁵ cells per well in 2 mL of 10% DMEM in 6-well plates. The cells were then washed with DPBS and incubated in serum-free (0%) DMEM for 24 h (1 mL/well) to induce starvation. Subsequently, each sample was serially diluted in 2% DMEM (2 mL/well) and applied to the cells in triplicate. For the control group, each solvent used to dilute the samples was added to 2% DMEM and applied to the cells.

2.3.5. Quantitative Real-Time PCR (qPCR)

To precipitate RNA, HaCaT cells were lysed using RNAiso Plus (TRIzol; Takara, Shiga, Japan). The precipitated RNA was measured by NanoDrop2000 (TECAN) to determine the purity and amount. For cDNA synthesis, the precipitated RNA was mixed with Oligo d(T)15 (ELPIS Biotech Inc., Daejeon, Republic of Korea), RevertAid Reverse Transcriptase (Thermo Fisher Scientific Inc.) and dNTP Mix, 2 mM each (Thermo Fisher Scientific Inc.). For measurement of mRNA expression levels, CFX Connect Real-Time PCR Detection System (Bio-Rad, Hercules, CA, USA) and TOPreal SYBR Green qPCR PreMIX were used. The primers used were 5′-CACAGTGAAGTGCTGGCAAC-3′ (Forward) and 5′-ACATTGGGTCCCCCAGGATA-3′ (Reverse) for TNF- α , 5′-TGAAACCTCTAAAACATCCAAGCTT-3′ (Forward) and 5′-TTCAGAACCTTCCCGTTGGT-3′ (Reverse) for IL-1 α , 5′-CCGCAAGGAACCATTCTCACT-3′ (Forward) and 5′-ATCAGGAAGGCTGCCAAGAG-3′ (Reverse) for IL-8, 5′-GCTGTGATCTTCAAGACCATTGTG-3′ (Forward) and 5′-TGGAATCCTGAACCCACTTCTG-3′ (Reverse) for MCP-1, 5′-GAAGGTGAAGGTCGGAGTC-3′ (Forward) and 5′-GAAGATGGTGATGGGATTTC -3′ (Reverse) for GAPDH.

2.4. Clinical Trial

2.4.1. Study Design and Participants

The study period was from 23 December 2024 to 10 January 2025 (IRB Number: MDSRC-2400 PR-183, 14). This study selected a minimum of 20 healthy male or female participants who met the selection criteria. The purpose, methodology, expected benefits, and potential adverse reactions of the study were explained to the selected participants. Those who agreed to participate provided written informed consent before enrolling in the study. All evaluations were conducted after participants cleansed the measurement sites and remained in a stable, controlled environment for 30 min under constant temperature and humidity conditions (22 ± 2 °C, 50 ± 5%) with no airflow or direct sunlight and under consistent lighting. The measurement sites were randomly assigned to the left and/or right cheek, forearm, or upper arm. The experimental group (treated group) was treated with 2% Nephelium lappaceum peel extract, while the control group did not receive the extract. The non-treated group was not exposed to any sample.
The criteria for selecting participants were as follows:
  • Healthy male or female volunteers aged 19 to 60 years without facial flushing and without wounds or scars on the forearm or upper arm.
  • Volunteers without a history of photosensitivity or tape allergies.
  • Individuals who have received a thorough explanation from the researcher regarding the study’s purpose, content, and potential adverse reactions, have been given sufficient time for consideration, and have voluntarily provided written informed consent for participation.
  • Individuals who agree to avoid activities that may environmentally or physically affect the test area (e.g., sauna, scrubbing, swimming) during the study period.
  • Individuals who can visit at designated times and are available for follow-up during the study period.

2.4.2. Induction of Skin Damage

Skin damage induced by external infrared radiation was performed using an infrared irradiator (INFRALUX-300, Dae-kyung Co., Pocheon-si, Republic of Korea). The left and right facial areas of each participant were designated as the test and control groups, respectively. With the eyes protected by safety goggles, infrared radiation was applied to the test area from a fixed distance of approximately 30 cm for 15 min to induce skin damage. (2) Skin damage caused by physical irritation was induced using the tape stripping method with cellophane tape (3M Scotch™ Multi-Purpose Tape, 3M Co., St. Paul, MN, USA). Three areas on the inner forearm (left or right) of each participant were designated as the test group, control group, and non-treated group. The stratum corneum was damaged by repeated stripping with cellophane tape. (3) For chemical irritation-induced skin damage, three areas on the inner forearm (left or right) of each participant were designated as the test group, control group, and non-treated group. A 20 μL solution of 1.5% SLS (sodium lauryl sulfate) was applied and occlusively patched for 24 h. After removing the patch, the area was washed with warm water, and after 30 min, skin damage was assessed under constant light conditions. For evaluating protection against chemically induced skin damage, the same procedure was applied after 14 days of product use. (4) Skin damage induced by UV radiation was performed using an artificial UV irradiation device (Multiport UV Solar Simulator (601–300 W; Solar Light Co., Philadelphia, PA, USA)). Based on literature research and previous internal studies, the average minimal erythema dose (MED) for Korean participants was determined to be 30.1 mJ/cm2. Three areas on the inner upper arm (left or right) of each participant were designated as the test group, control group, and non-treated group. A UV dose corresponding to 2MED (60.2 mJ/cm2) was applied to the test area. Skin irritation was confirmed by assessing erythema reactions 16 to 24 h post-irradiation. (5) Skin damage induced by external chemical stimulation (retinol) was conducted using 1% retinol (provided by INVIVOTECH Co., Ltd. (Seongnam-si, Republic of Korea) with 15% retinol stock solution). Three areas on the inner forearm (left or right) of each participant were designated as the test group, control group, and non-treated group. A 20 μL solution of 1% retinol was applied and occlusively patched for 24 h. After removing the patch, the area was washed with warm water, and after 30 min, skin damage was assessed under constant light conditions.

2.4.3. Transepidermal Water Loss (TEWL) Assessment

Transepidermal water loss (TEWL) refers to the amount of water evaporating through the skin. TEWL was measured using the Vapometer® (Delfin, Kuopio, Finland), which calculates TEWL (unit: g/m2·h) based on the relative humidity (RH) increase within the probe, utilizing the principle of water diffusion. TEWL was measured once at each assessment time point on the test site of each participant. Skin barrier images were captured using the Visioscan® VC20 Plus.

2.4.4. Skin Redness Image Analysis (a* Value Analysis)

Skin redness (a* value) was evaluated using the ANTERA 3D® CS (Miravex, Ireland), a non-contact three-dimensional skin analysis device based on optical and mathematical algorithms. This device extracts and quantifies data from 3D images to observe skin changes over time. It also measures various skin parameters, including roughness, fine wrinkles, and wrinkle depth and width. Furthermore, multispectral analysis allows for the quantification of melanin and hemoglobin levels. Images were captured using the Visioscan® VC20 Plus at each assessment time point and a designated analysis area was selected. Filters were applied to analyze the a* value, representing skin redness.

2.5. Statistical Analysis

All data were analyzed for statistical significance using the SPSS® Package Program ver. 20 (IBM, Armonk, NY, USA). The Paired t-test, One-way ANOVA, and Tukey HSD post hoc test were used to determine between-group differences. Statistical analyses were conducted based on normality assumptions for comparisons before and after treatment and between groups. Normality was assessed using the Shapiro–Wilk test and Kurtosis/Skewness. Normality was used to select specific statistical significance test: when the data showed positive normality, we used the paired Student t-test, Repeated Measures Analysis of Variance (RM-ANOVA), Independent t-test, One-way ANOVA, and Tukey HSD post hoc test; and when the data showed negative normality, we applied the Friedman test, Mann–Whitney U test, and Kruskal–Wallis rank sum test. Differences were considered statistically significant when the p value was <0.05.

3. Results

3.1. Quantification of Geraniin, Corilagin, Gallic Acid, and Ellagic Acid in Nephelium lappaceum Peel Extracts Using NADESs

The concentrations of geraniin, corilagin, gallic acid, and ellagic acid in Nephelium lappaceum peel extract were determined by HPLC following extraction with a natural deep eutectic solvent (NADES) composed of betaine and 1,3-propanediol at a molar ratio of 1:2, with 50% water content. As shown in Table 1, all four compounds were detected and quantified. Among them, geraniin showed the highest concentration, followed by ellagic acid, corilagin, and gallic acid.

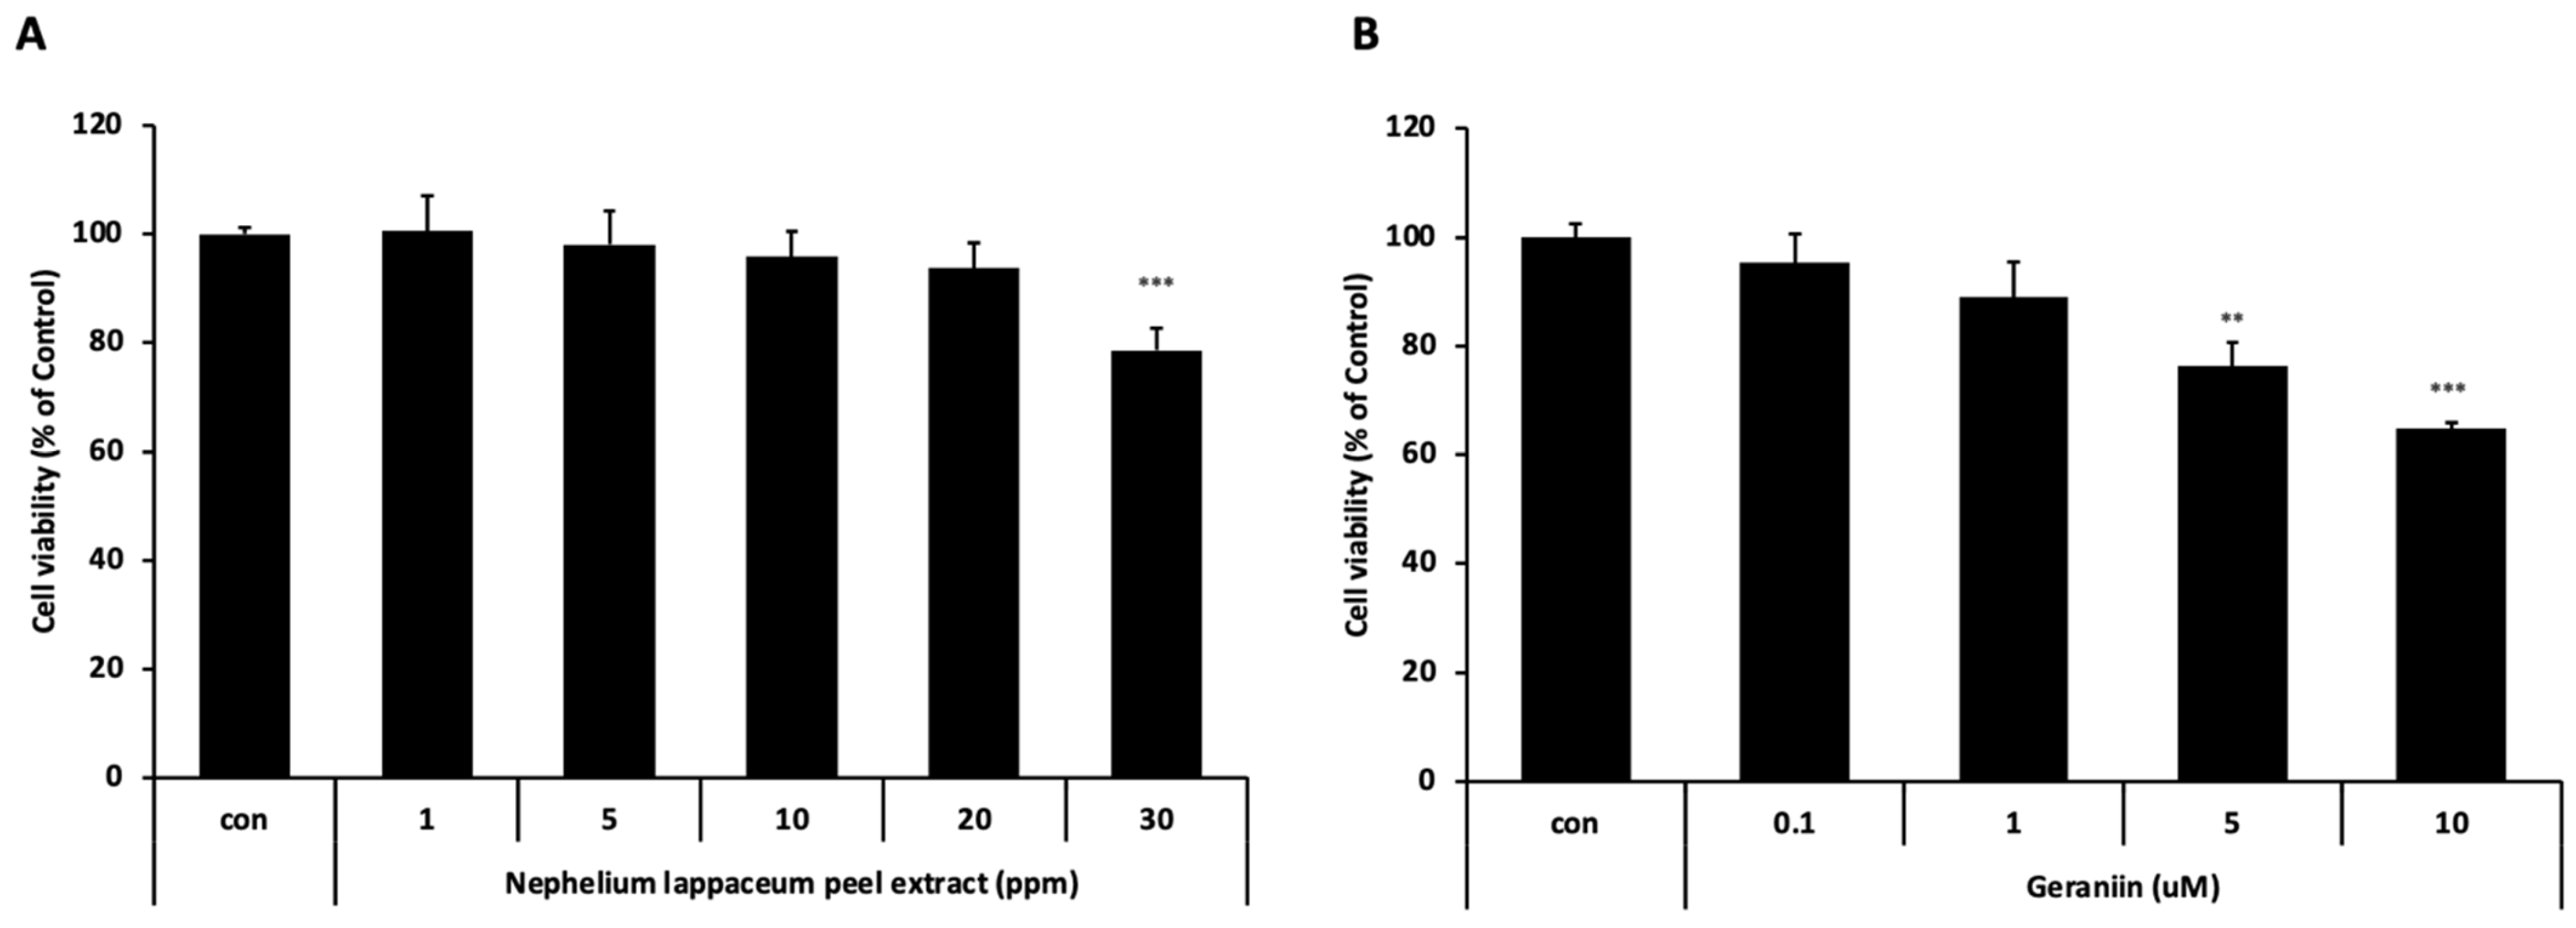
3.2. Cytotoxicity Evaluation of Nephelium lappaceum Peel Extract and Geraniin on HaCaT Cells

We measured a cell viability assay to evaluate the cytotoxicity of Nephelium lappaceum peel extract and geraniin on HaCaT cells. When these substances were treated on HaCaT cells for 24 h, Nephelium lappaceum peel extract reduced cell viability by approximately 78% at a concentration of 30 ppm (Figure 1A). Geraniin reduced cell viability by 76% at 5 μM and 64% at 10 μM (Figure 1B). Both substances showed a dose-dependent decrease in cell viability. Based on these results, the final concentrations for further experiments were set at 20 ppm for Nephelium lappaceum peel extract and 1 μM for geraniin.

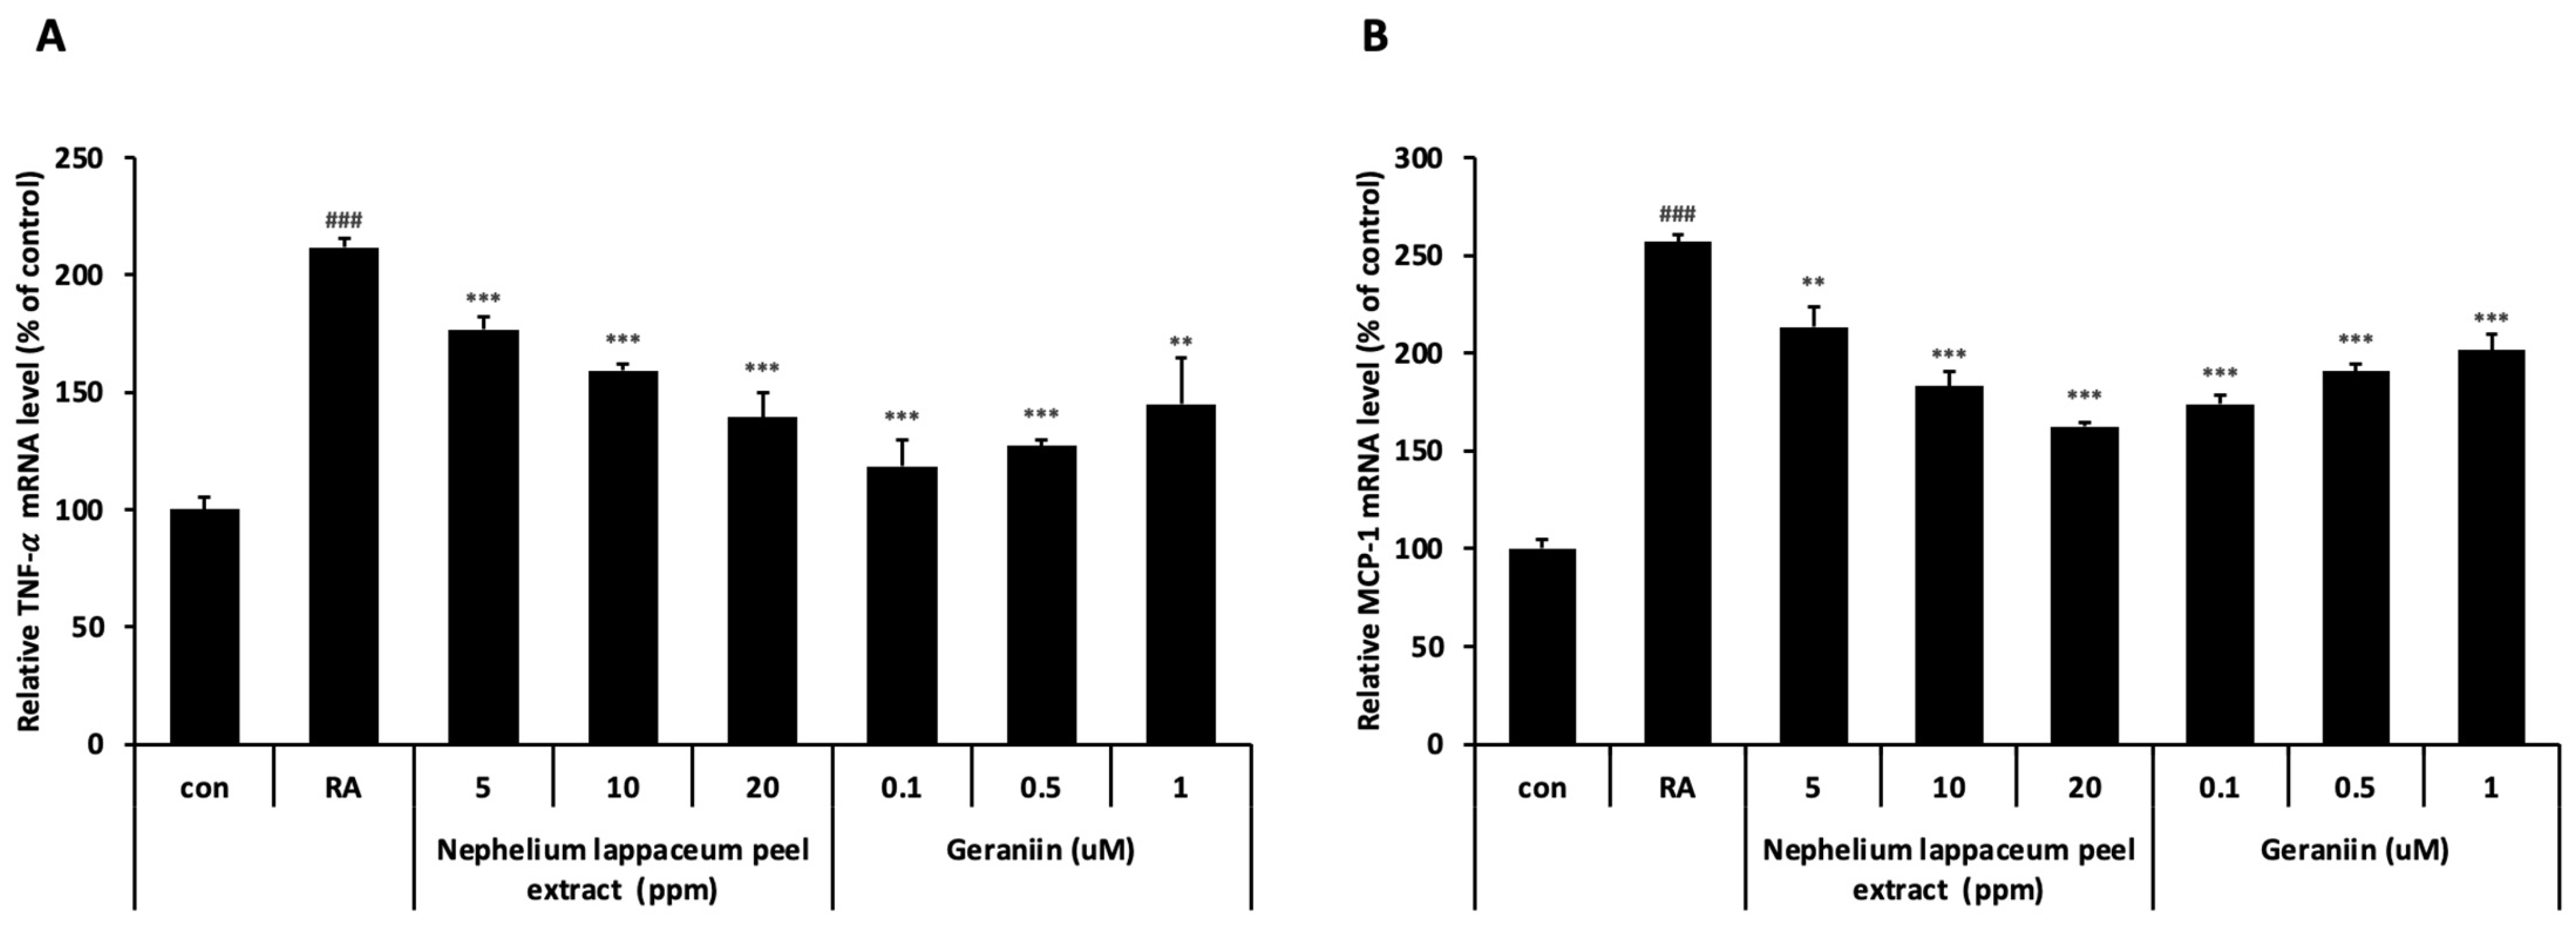
3.3. Nephelium lappaceum Peel Extract and Geraniin Inhibit RA-Induced TNF- α and MCP-1 Expression

To assess the extent to which each stimulus induced cytokine expression and how effectively Nephelium lappaceum peel extract and geraniin suppressed this expression, we performed q-RT PCR. Treatment of HaCaT cells with RA significantly increased the expression of TNF- α and MCP-1 (Figure 2A,B). When cells were pre-treated with RA for 3 h followed by treatment with Nephelium lappaceum peel extract, cytokine expression was suppressed in a dose-dependent manner. Although geraniin also showed a significant inhibitory effect, it did not show a dose-dependent manner.

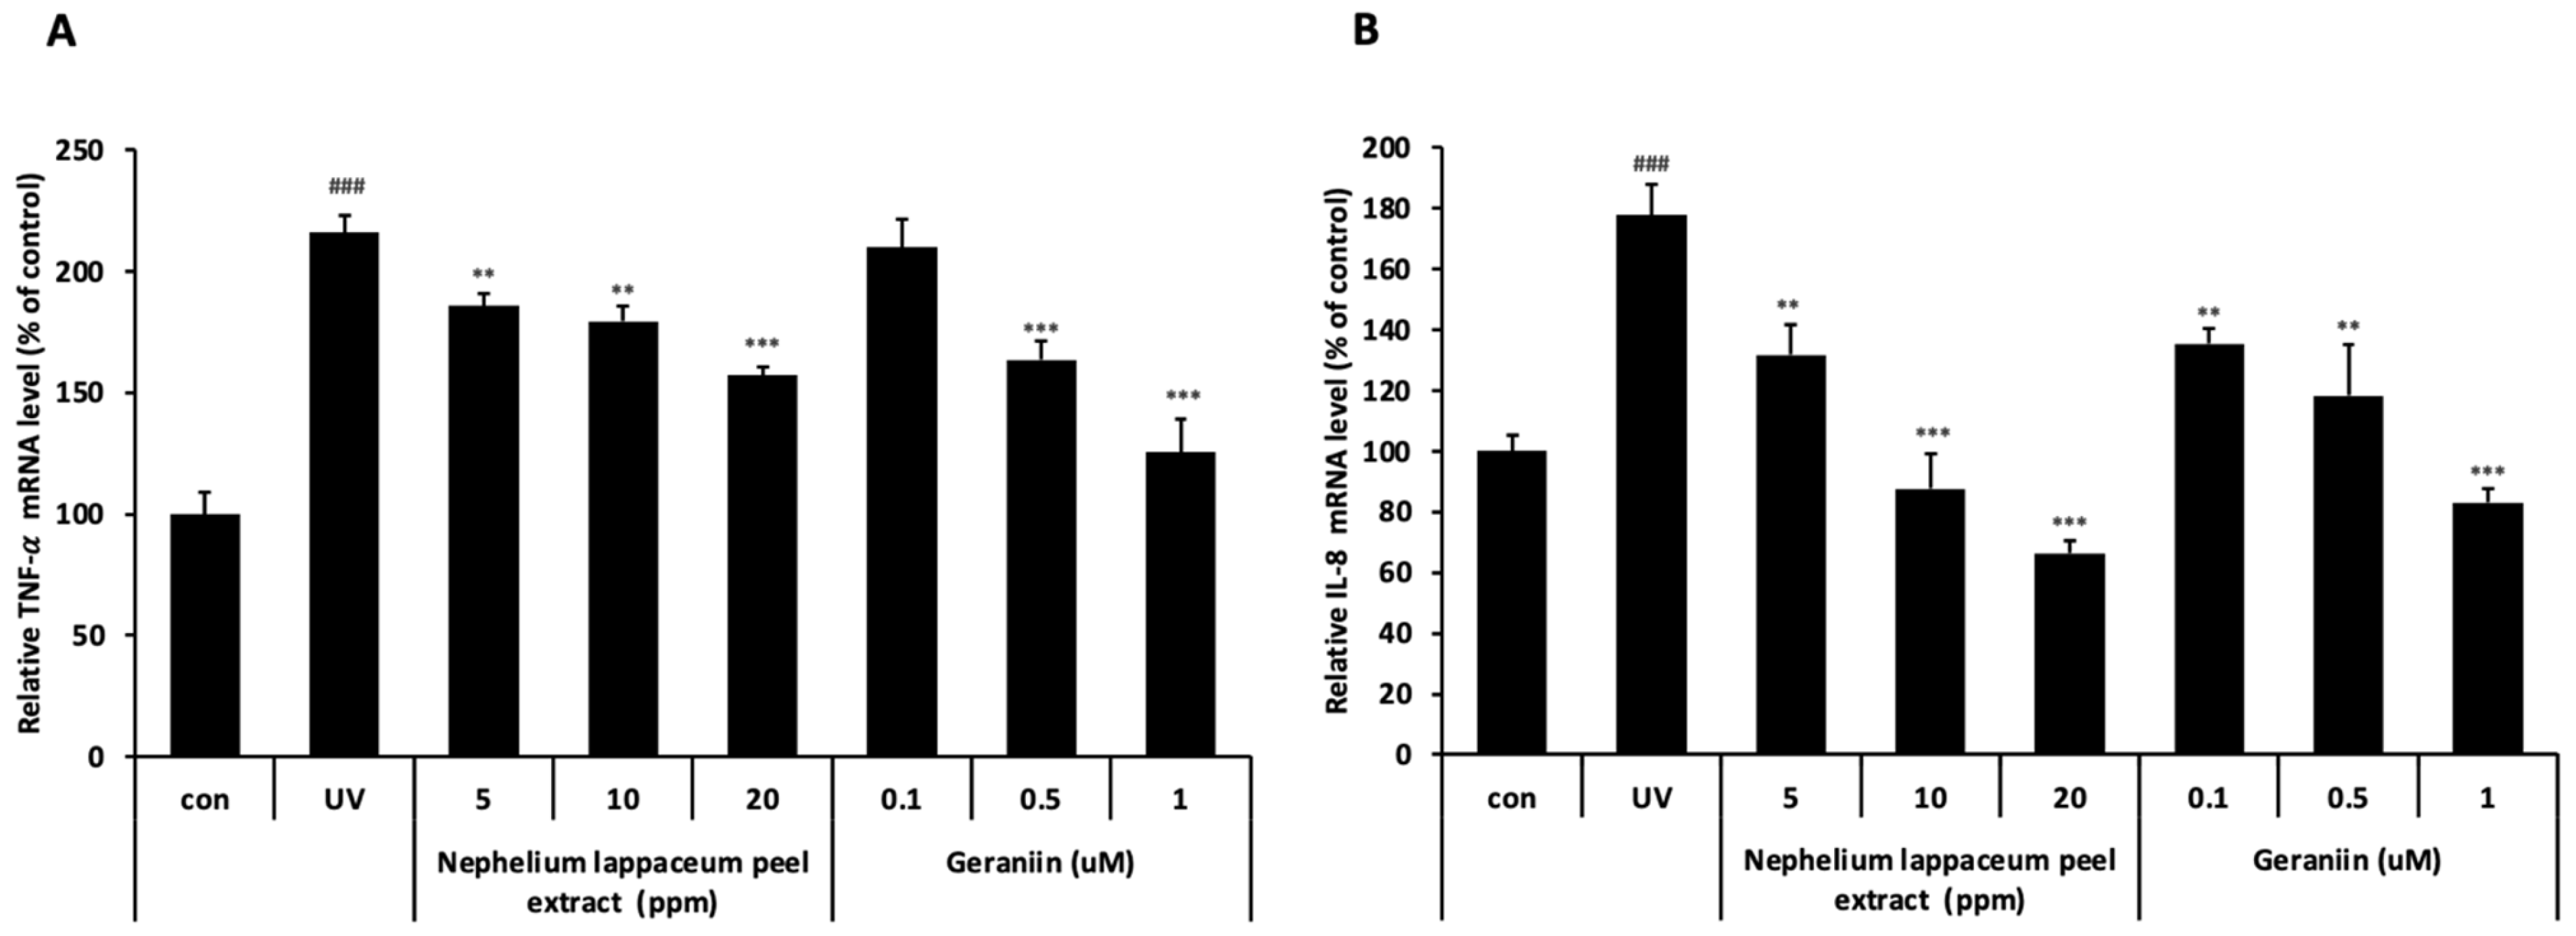
3.4. Nephelium lappaceum Peel Extract and Geraniin Inhibit UV-Induced TNF- α and IL-8 Expression

UV-B has a wavelength of 280–320 nm and is primarily absorbed by the epidermis, causing DNA damage and oxidative stress, which subsequently leads to inflammation [38]. This process results in the release of cytokines such as TNF-α, IL-6, and IL-8. Therefore, we investigated the extent of cytokine induction when HaCaT cells were exposed to UV-B. HaCaT cells were treated with 50 mJ of UV-B for 24 h, resulting in the induction of TNF-α, IL-6, and IL-8 (Figure 3). Nephelium lappaceum peel extract and geraniin dose-dependently inhibited TNF-α after 3 h of UV-B pretreatment (Figure 3A). For IL-8, Nephelium lappaceum peel extract showed a greater inhibitory effect than geraniin (Figure 3B). These results suggest that Nephelium lappaceum peel extract may have anti-inflammatory potential comparable to or greater than that of geraniin.

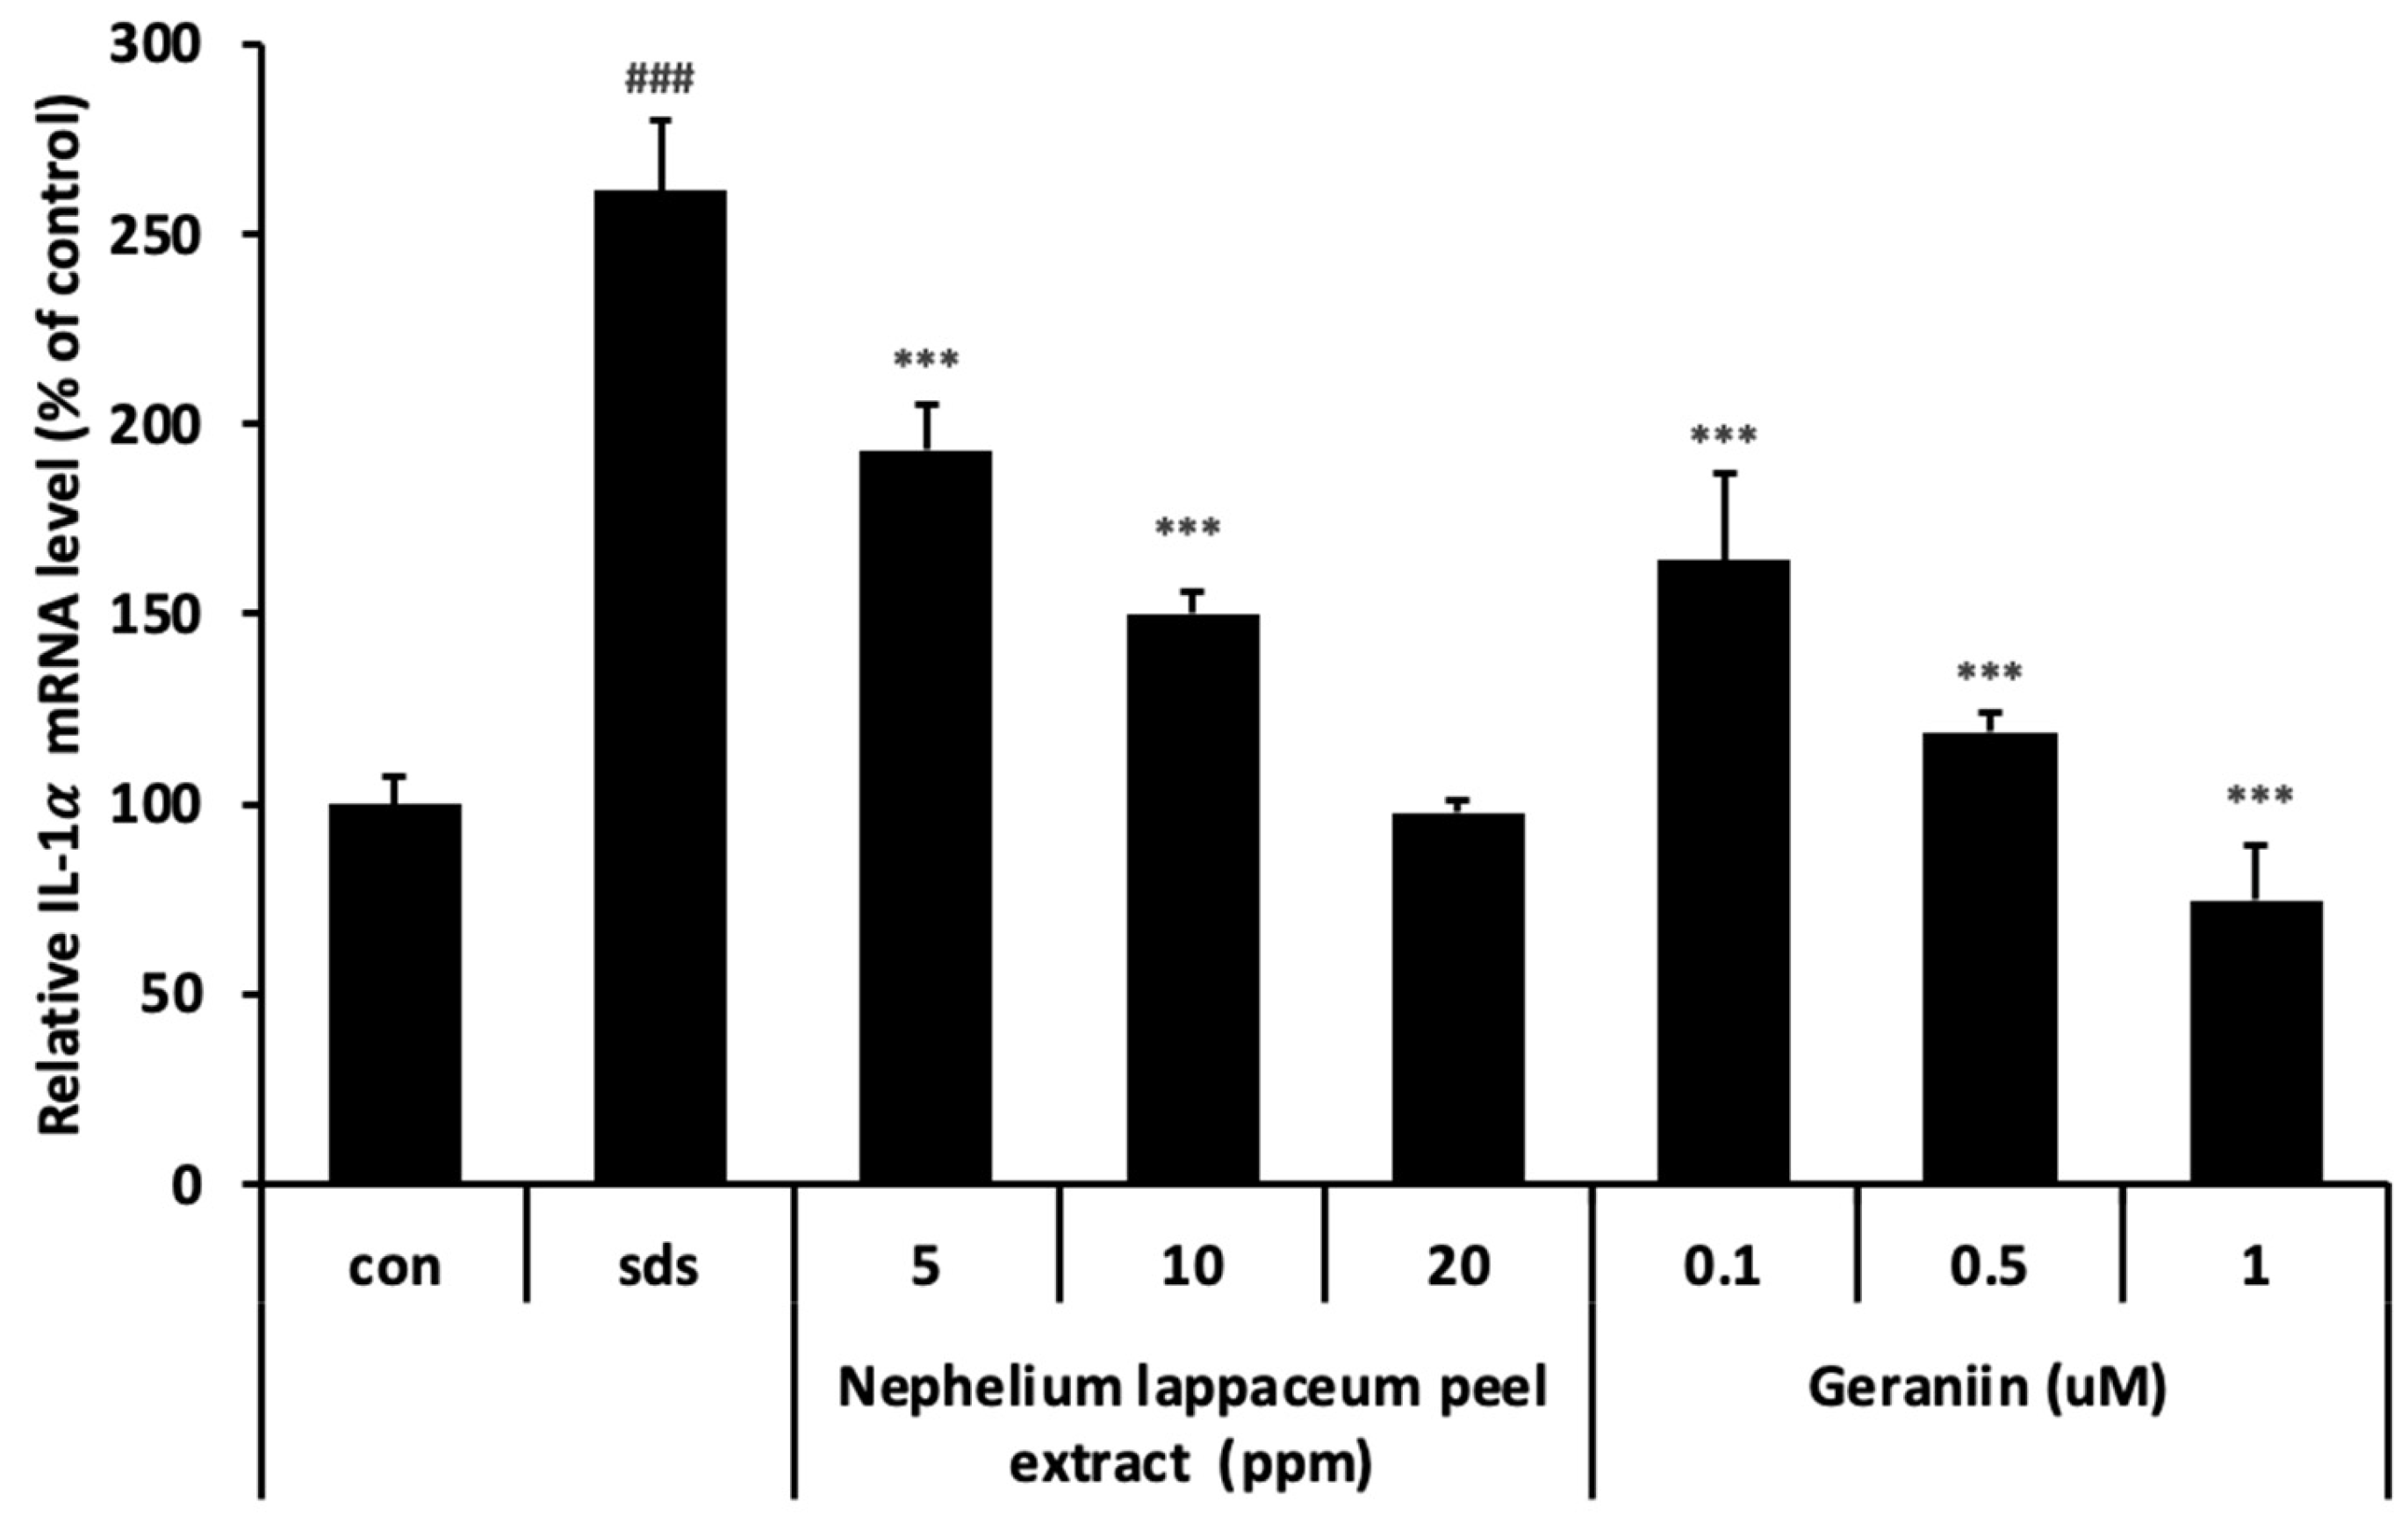
3.5. Nephelium lappaceum Peel Extract and Geraniin Inhibit SDS-Induced IL-1 α Expression

We treated HaCaT cells with 10 μg/mL of SDS for 24 h to induce the release of IL-1α and evaluated the inhibitory effects of Nephelium lappaceum peel extract and geraniin. After pre-treatment with SDS for 3 h, it was confirmed that Nephelium lappaceum peel extract and geraniin inhibited the expression of IL-1α in a dose-dependent manner (Figure 4). Notably, at the highest concentrations of both Nephelium lappaceum peel extract and geraniin, the levels of IL-1α released were lower than those of the control group.

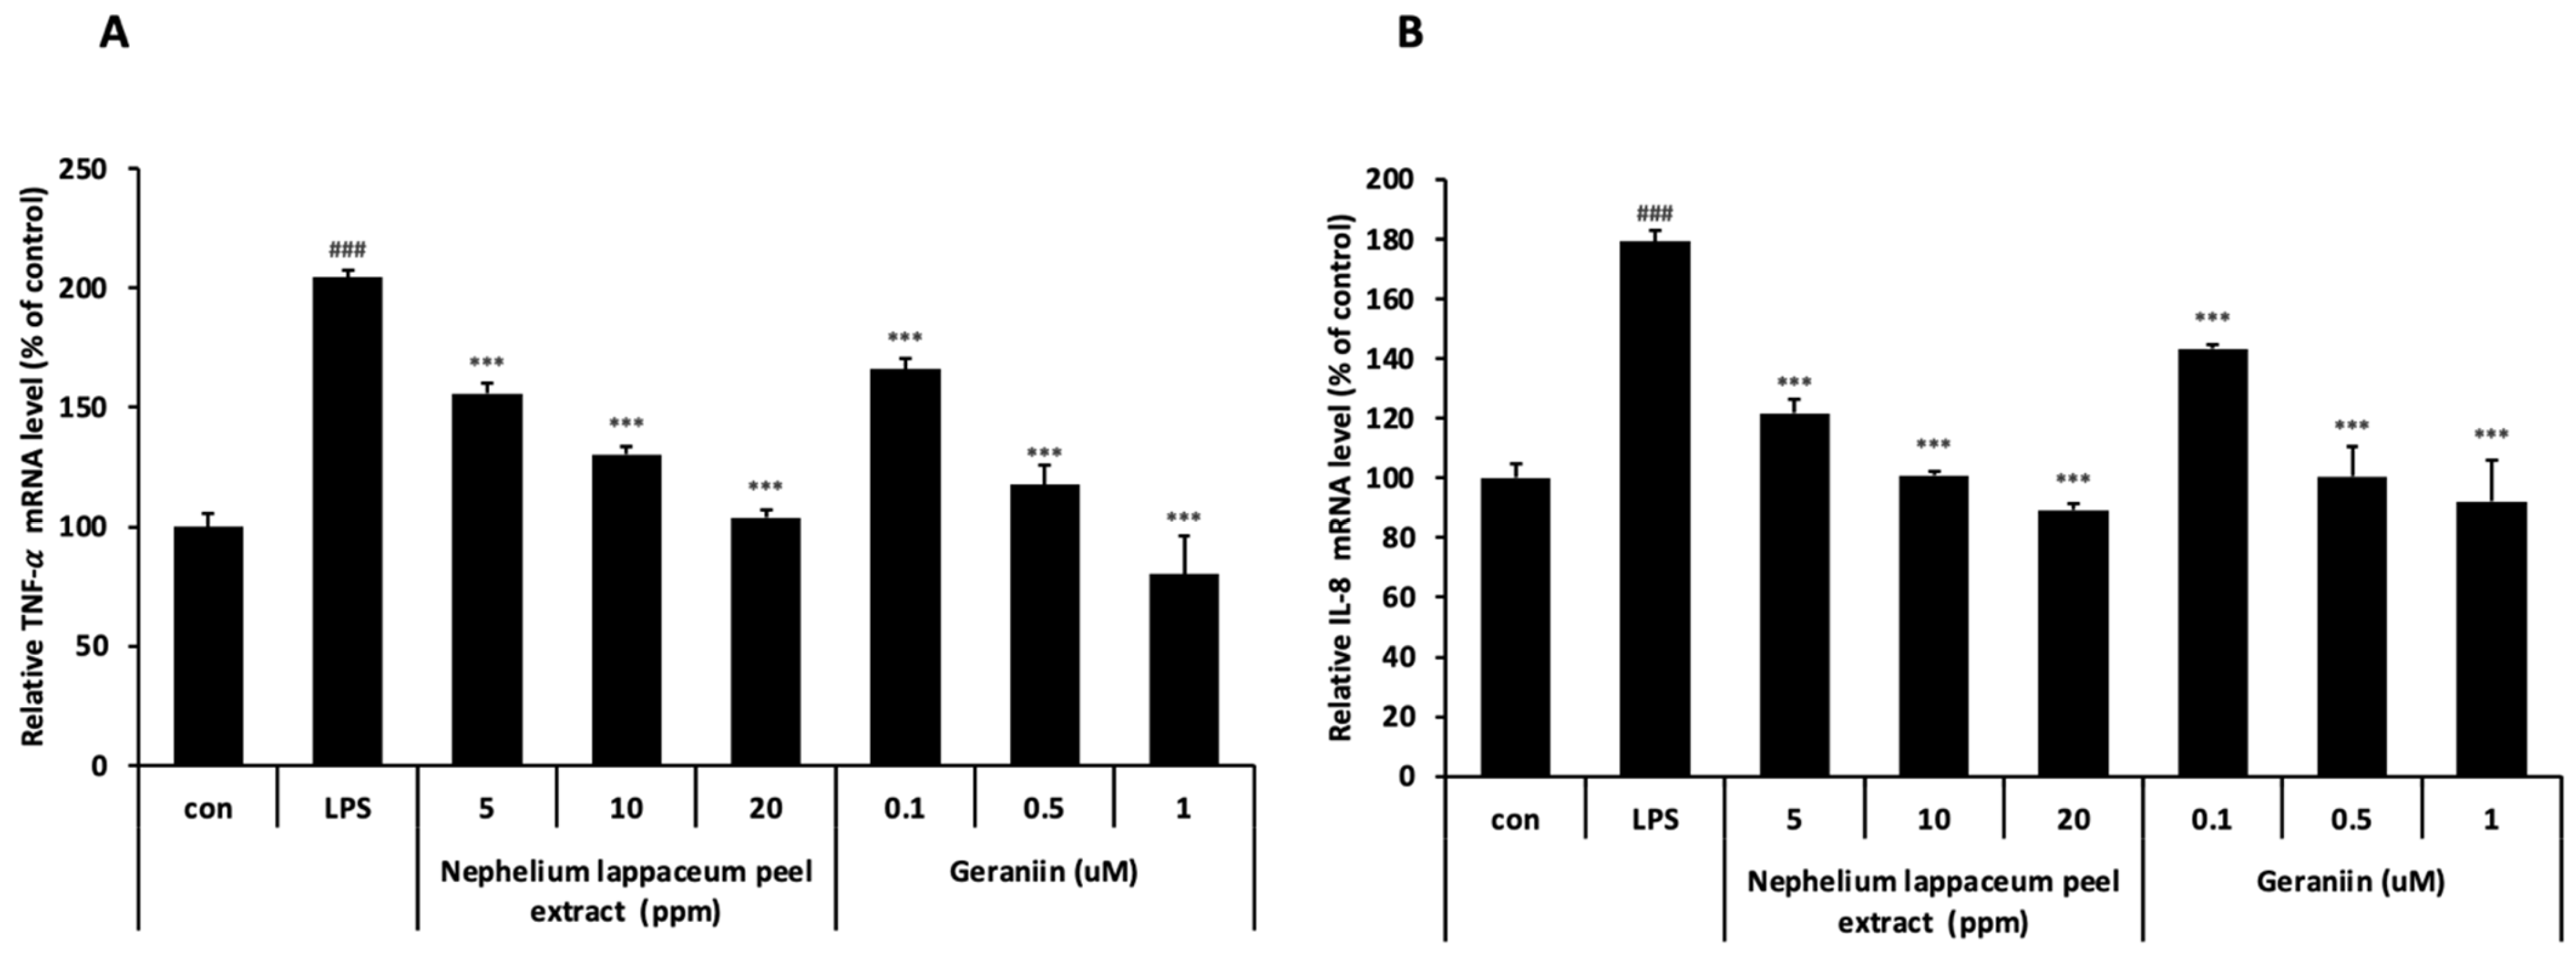
3.6. Nephelium lappaceum Peel Extract and Geraniin Inhibit LPS-Induced TNF-α and IL-8 Expression

We evaluated the expression of TNF-α and IL-8 after HaCaT cells were treated with LPS for 3 h, followed by treatment with Nephelium lappaceum peel extract and geraniin. Both TNF-α and IL-8 expression levels were suppressed in a dose-dependent manner (Figure 5A,B), and a significant inhibitory effect on cytokines was observed even at the lowest concentration. These results suggest that Nephelium lappaceum peel extract may have anti-inflammatory potential comparable to or greater than that of geraniin. The in vitro results showed that both Nephelium lappaceum peel extract and geraniin exhibited anti-inflammatory effects against various external stimuli. To further validate these findings, we conducted clinical trials to assess their efficacy in real-world application.

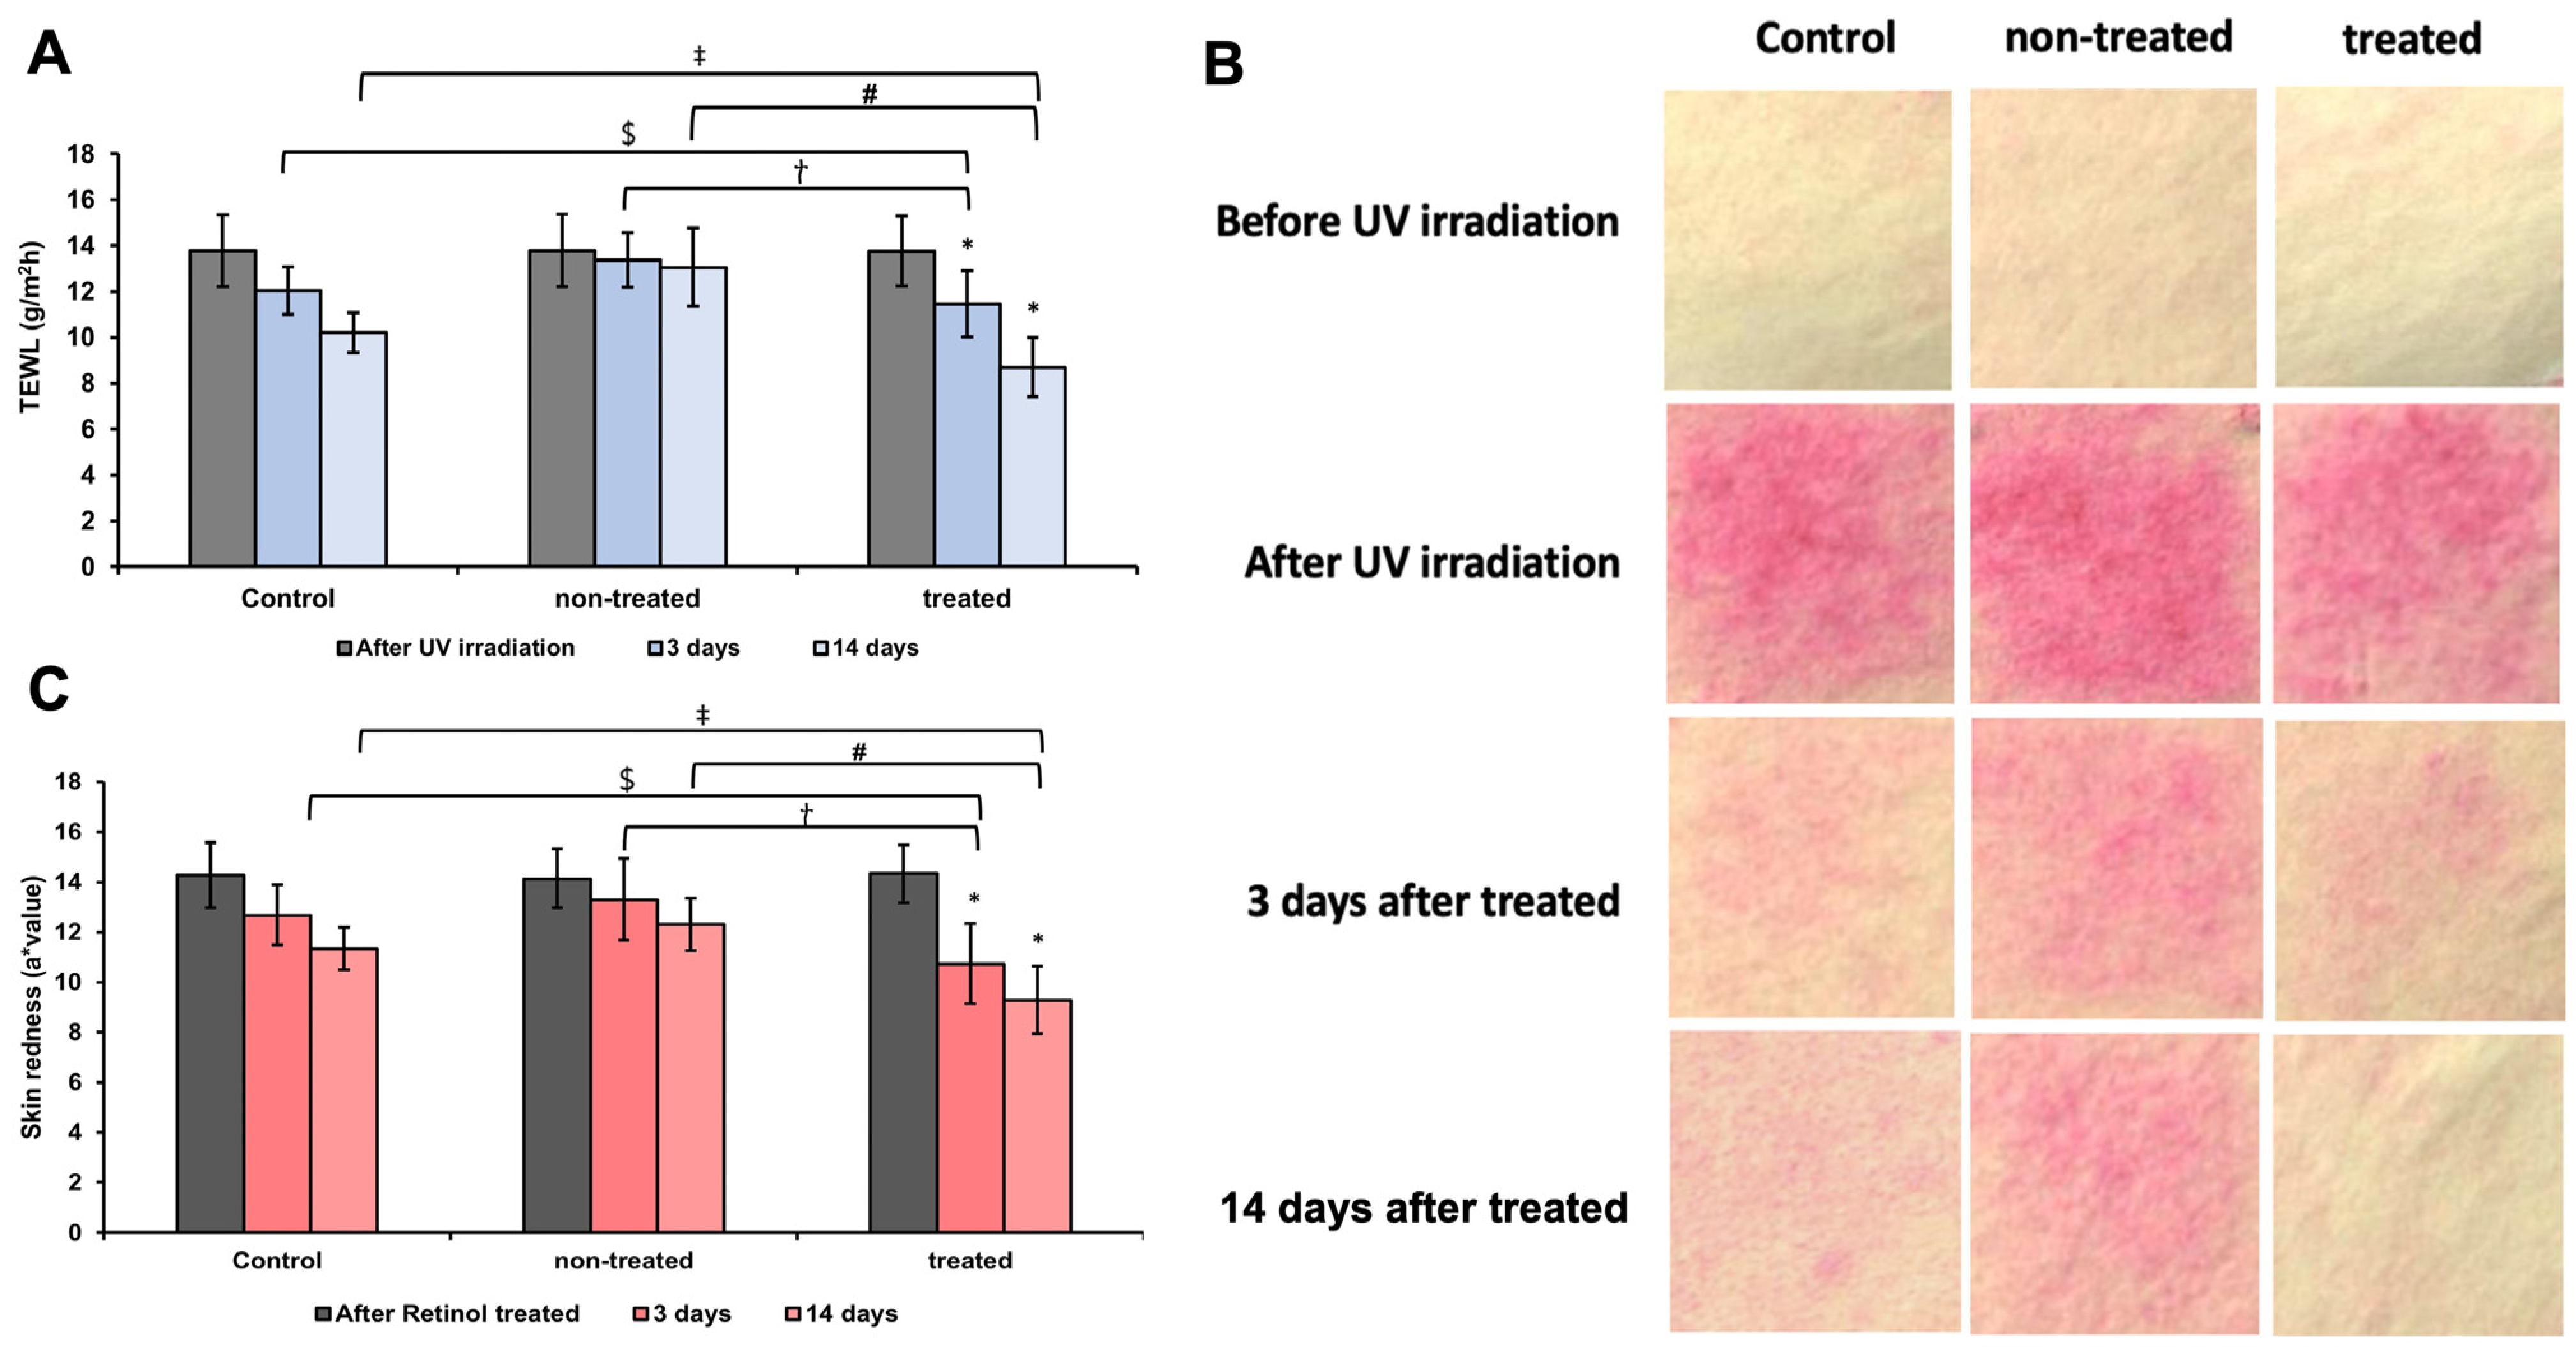
3.7. Analysis of TEWL and Redness Assessment of UV-Induced Damaged Skin Barrier

When compared to the after-UV irradiation condition, the product application for 3 days and 14 days significantly reduced TEWL compared to the control group and the non-treated groups (Figure 6A). TEWL decreased in a dose-dependent manner with longer application periods of 3 days and 14 days. In the non-treated group, TEWL after UV irradiation was 13.79, which decreased to 13.38 after 3 days and 13.06 after 14 days, showing an improvement rate of 2.97% after 3 days and 5.29% after 14 days. In the control group, TEWL after UV irradiation was 13.79, which decreased to 12.05 after 3 days and 10.22% after 14 days, with improvement rates of 12.62% and 25.89%, respectively. In the treated group, TEWL after UV irradiation was 13.77, which decreased to 11.47 after 3 days and 8.71 after 14 days, showing significant improvement rates of 16.7% after 3 days and 36.75% after 14 days. In terms of skin redness, the treated group showed a significant reduction compared to the control and non-treated groups. This is an image of the change in redness (a* value) of skin damaged by external stimuli (UV light) due to product use (Figure 6B). In the non-treated group, skin redness after UV irradiation was 12.37, decreasing to 11.68 after 3 days and 11.44 after 14 days, with improvement rates of 5.58% and 7.52%, respectively (Figure 6C). In the control group, skin redness after UV irradiation was 12.49, decreasing to 11.34 after 3 days and 10.71 after 14 days, with improvement rates of 9.21% and 14.25%. In the treated group, skin redness after UV irradiation was 12.33, decreasing to 10.39 after 3 days and 9.84 after 14 days, resulting in improvement rates of 15.73% and 20.19%, respectively.

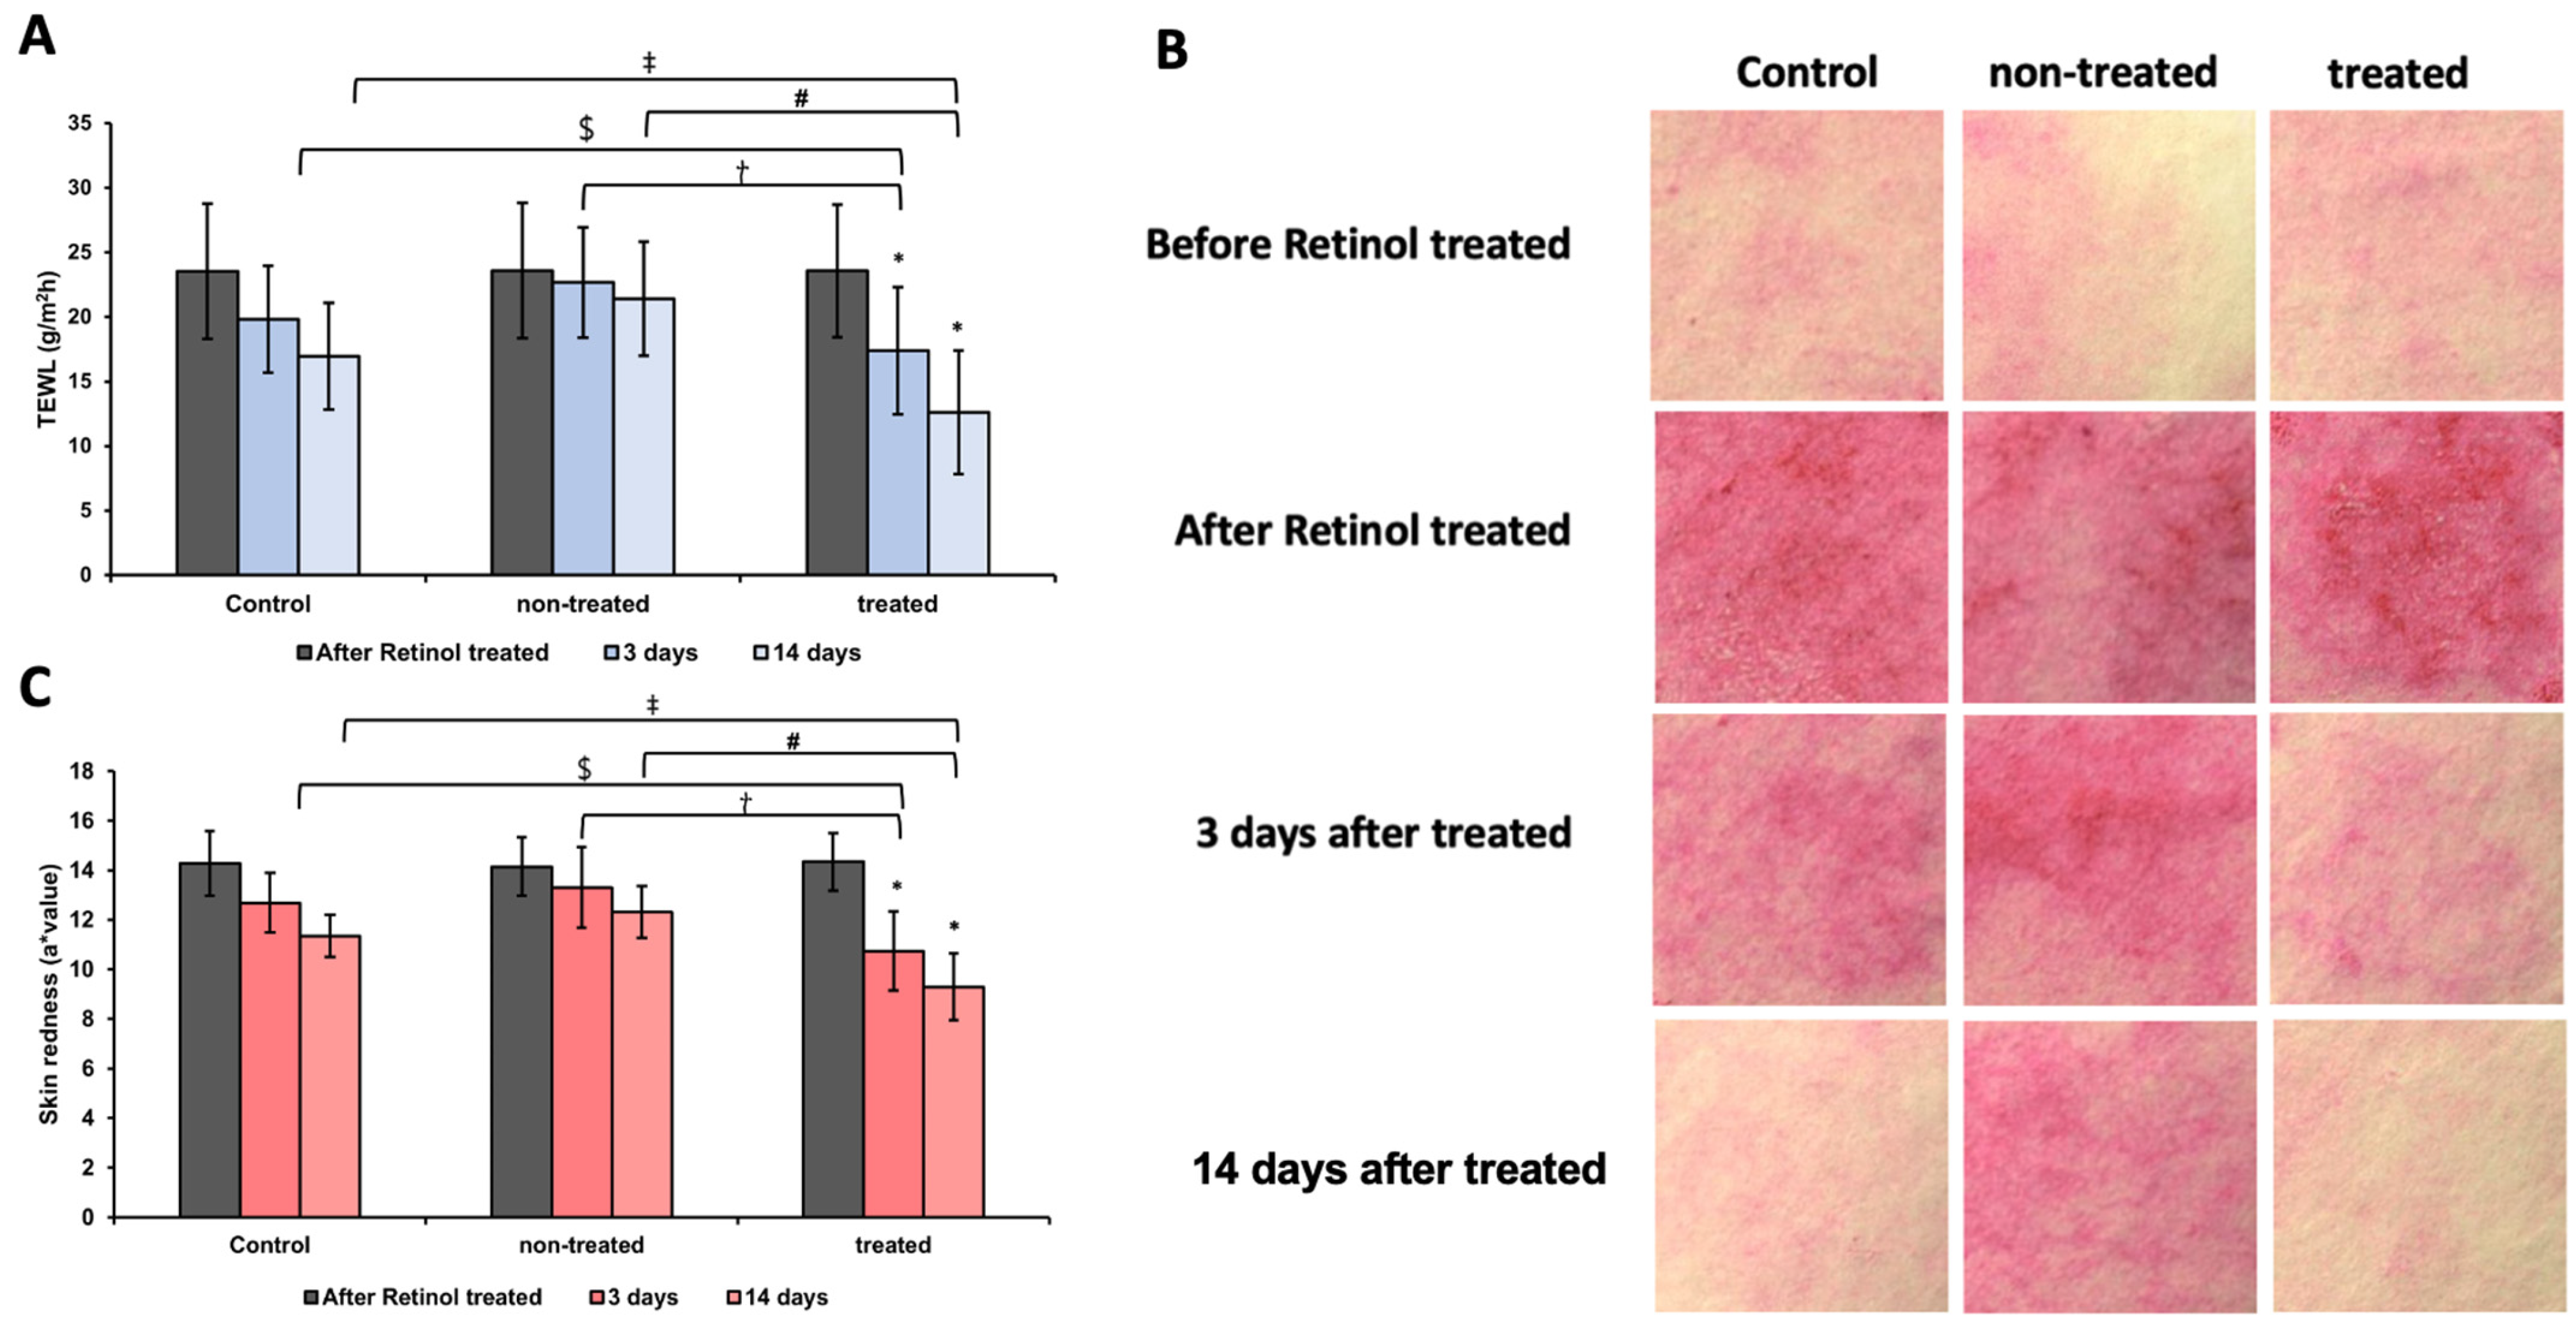
3.8. Analysis of TEWL and Skin Redness After Retinol Patch Application

Next, TEWL and skin redness were evaluated after application of retinol to the skin. After retinol patch application and product use for 3 and 14 days, all groups showed a dose-dependent decrease in TEWL (Figure 7A). The treated group showed a significant reduction in TEWL compared to both the non-treated and control groups. The highest rates of improvement after 14 days of product use were observed in the treated group (46.52%), followed by the control group (27.95%) and the non-treated group (9.21%). In addition to TEWL, skin redness was also assessed and changes in skin redness are visualized (Figure 7B). The treated group showed a significantly greater reduction in skin redness compared to the non-treated and control groups (Figure 7C). The maximum improvement rates in skin redness after 14 days of product application were 35.22% for the treated group, 20.53% for the control group, and 13.01% for the non-treated group. These results indicate a significant improvement after 14 days of product use.

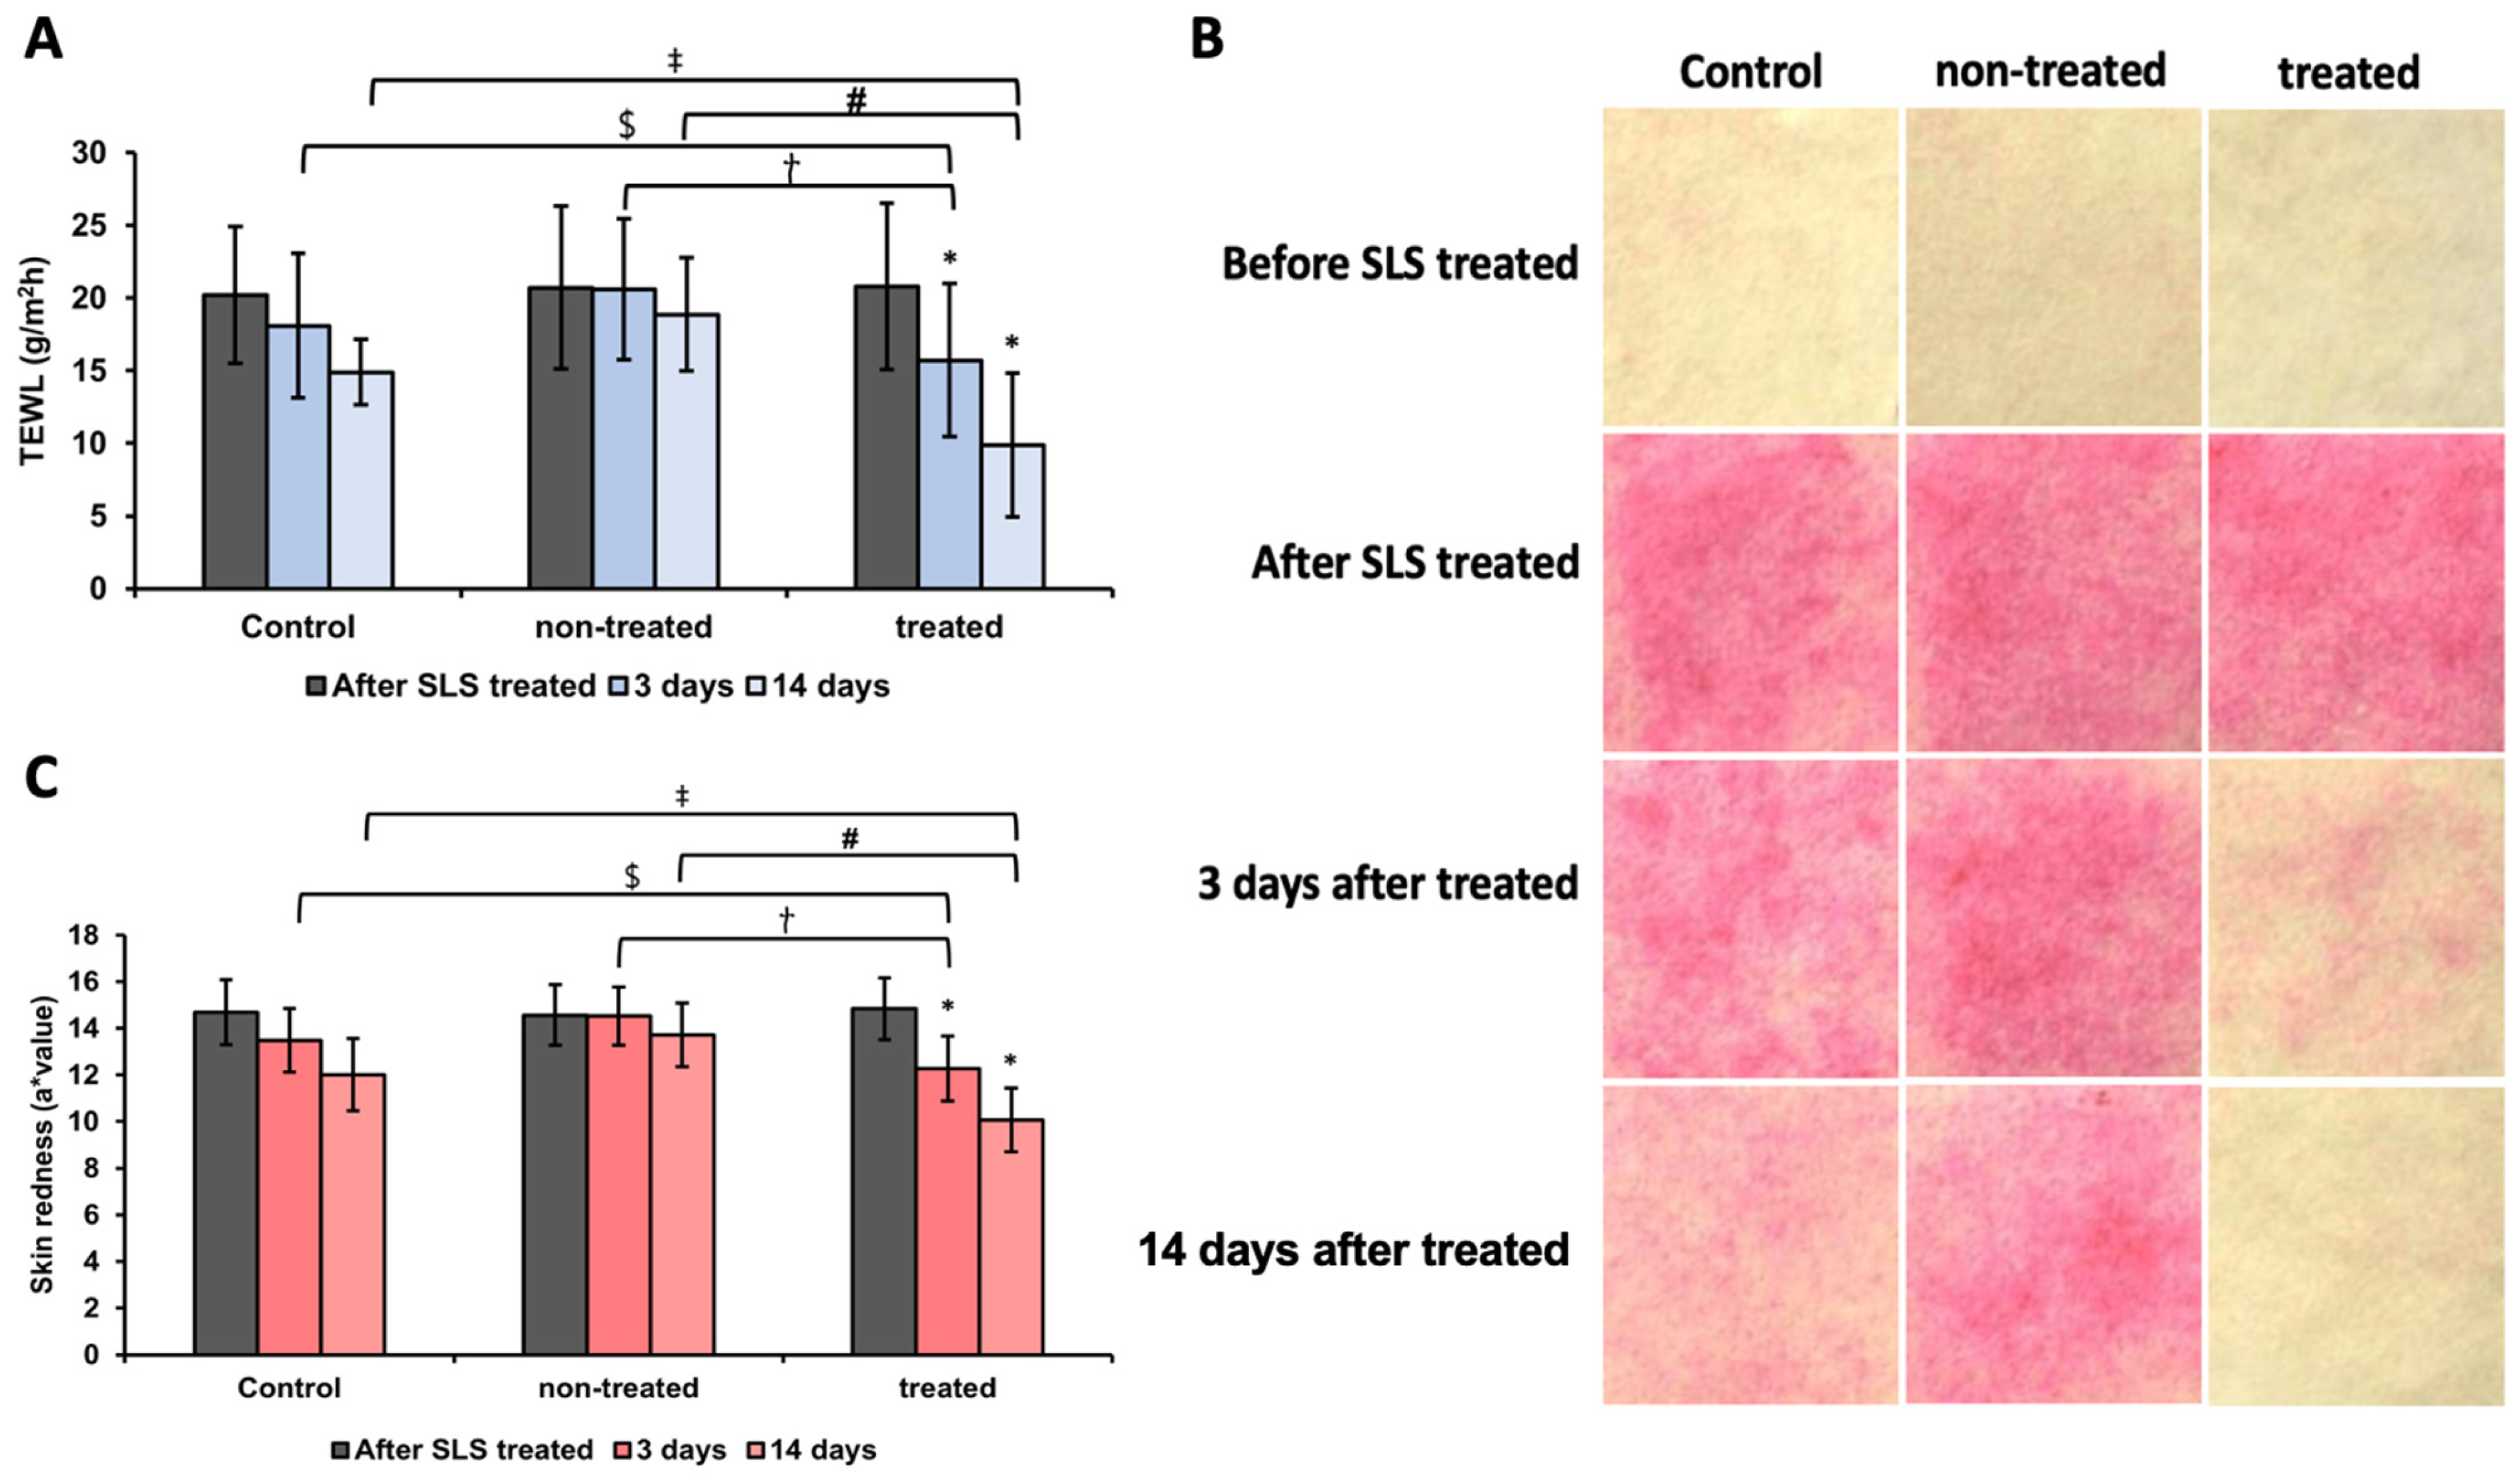
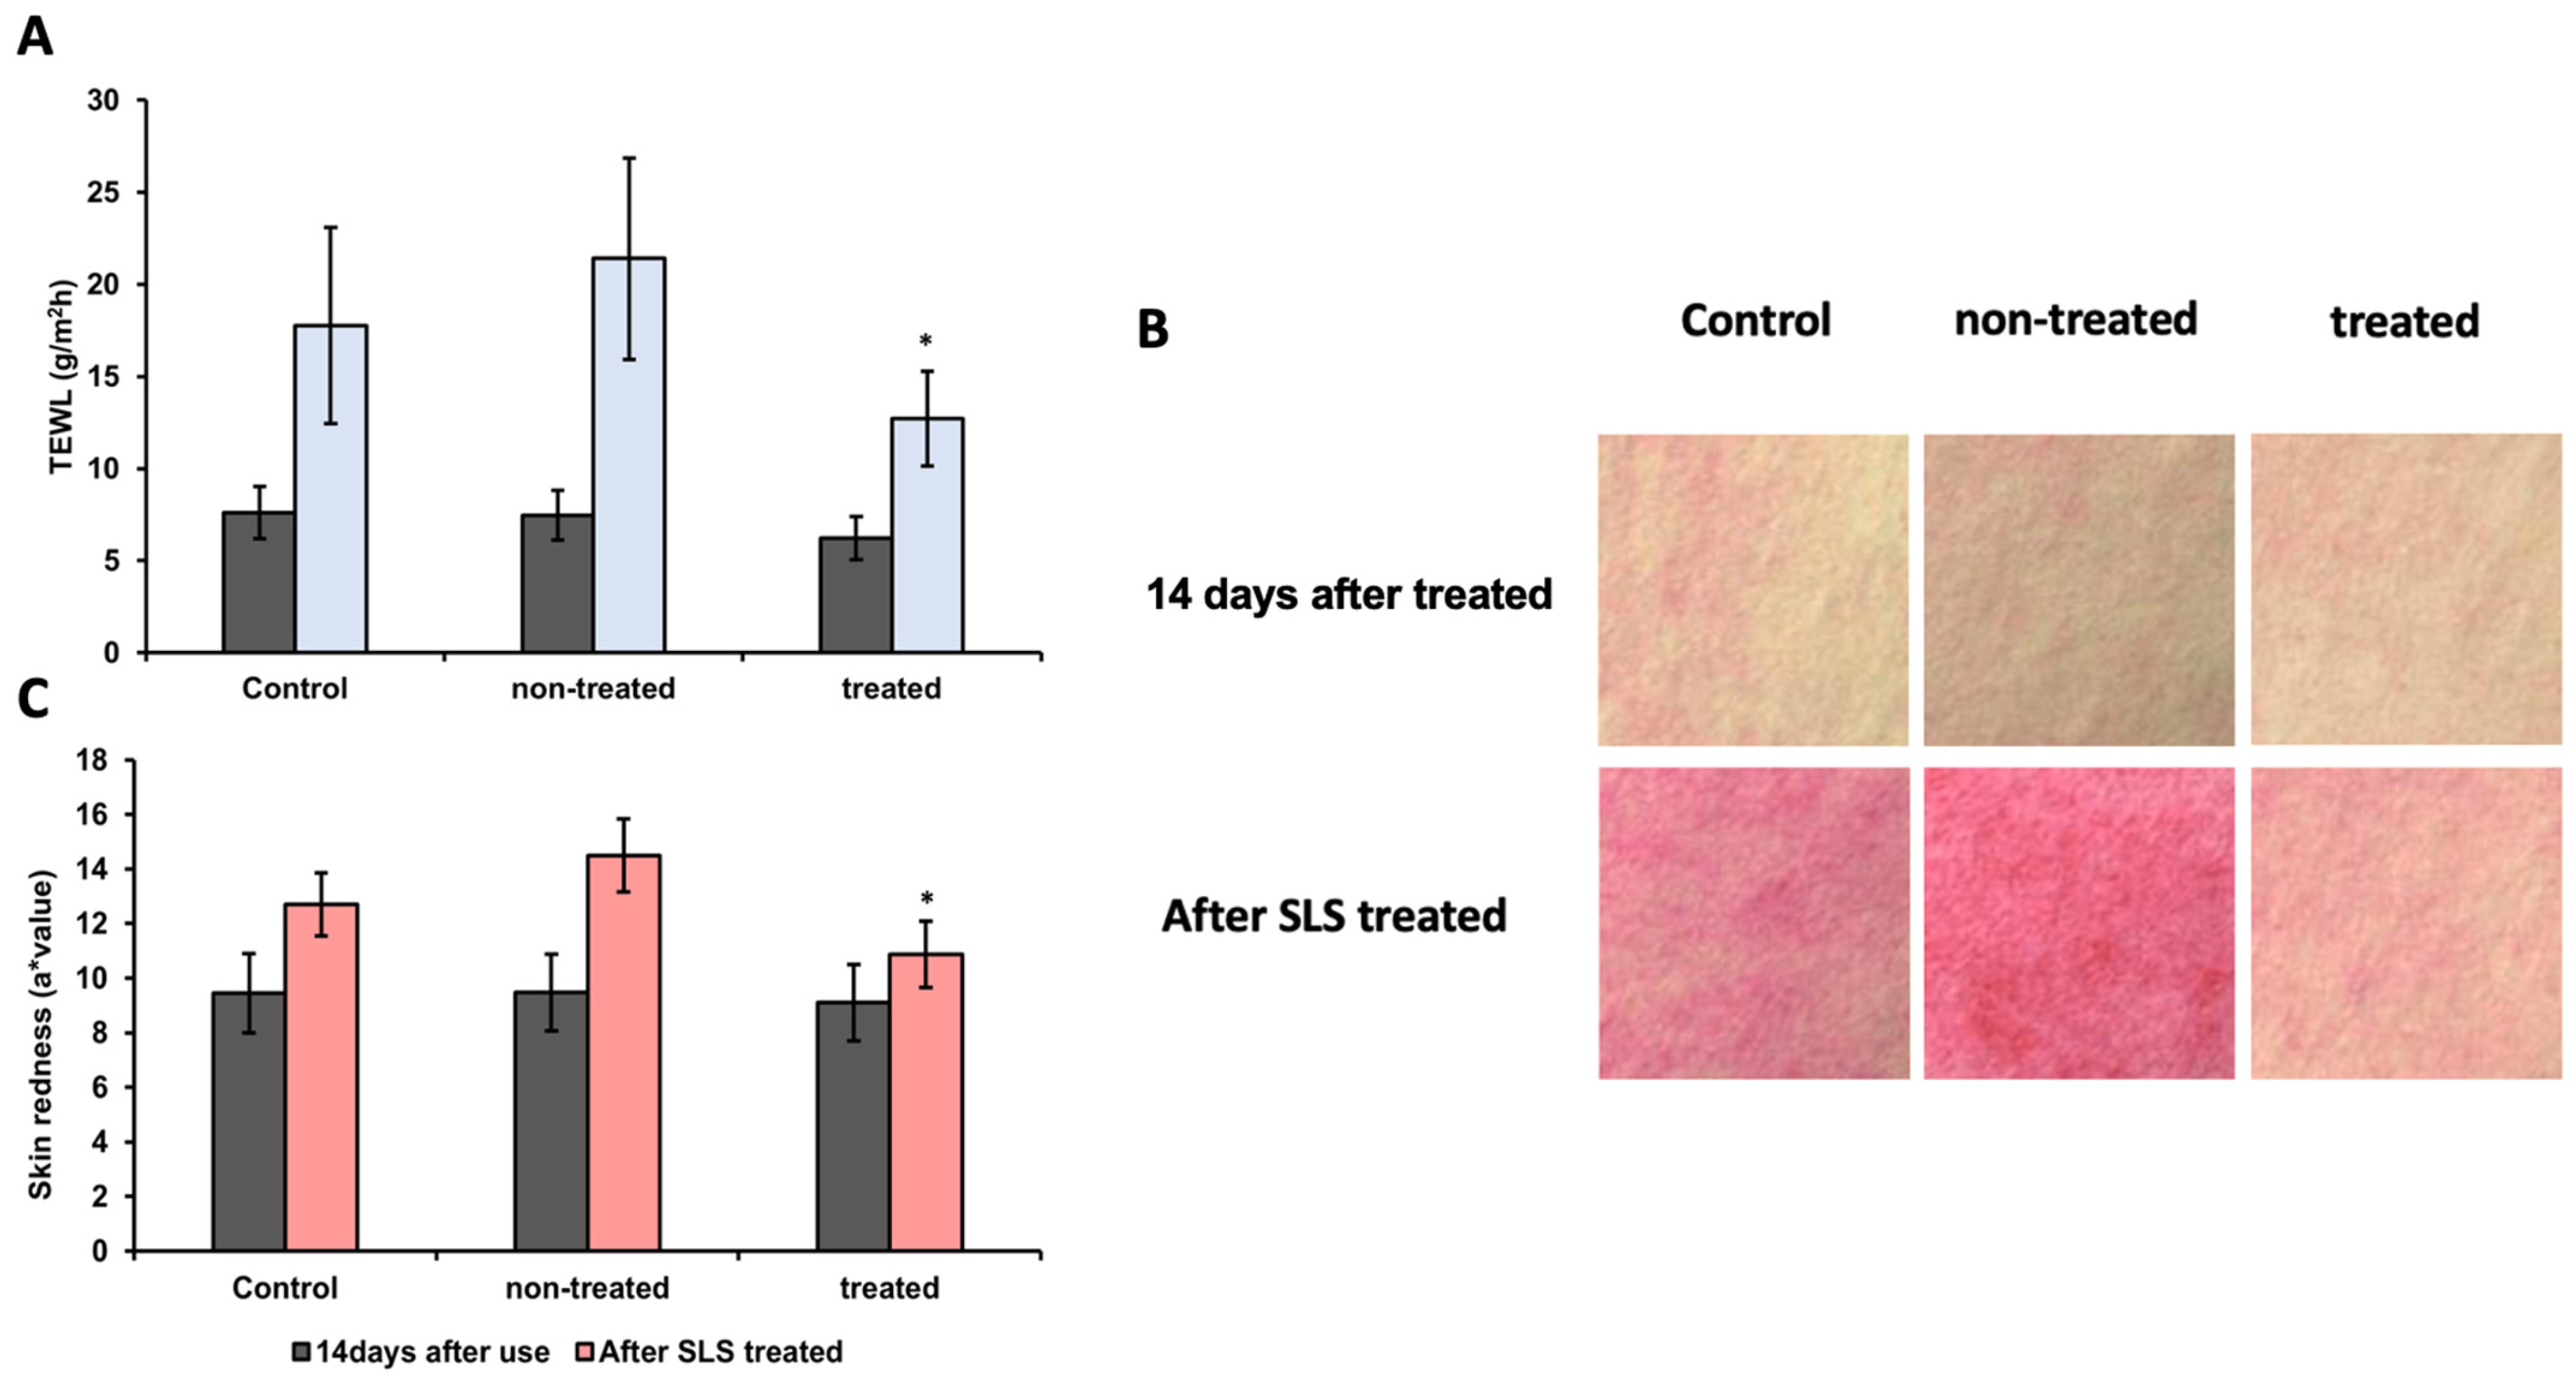
3.9. Analysis of TEWL and Skin Redness After SLS Patch Application

SLS-induced irritation was evaluated using two different methods. First, TEWL and skin redness were assessed after applying SLS patches followed by product use for 3 and 14 days. The highest improvement rates in TEWL after 14 days of product use were observed in the treated group (52.52%), followed by the control group (26.32%) and the non-treated group (8.88%) (Figure 8A). The treated group showed a significant reduction in TEWL compared to the control and non-treated groups, with a dose-dependent decrease observed in all groups. Next, skin redness was assessed, and representative images of SLS patch application are shown (Figure 8B). Skin redness values were analyzed before and after product use for 3 and 14 days. The maximum improvement rates for each group were 32.1% in the treated group, 18.18% in the control group, and 5.84% in the non-treated group (Figure 8C).

3.10. Analysis of Skin Damage Protective Effects and Redness Assessment Against SLS

The second method for evaluating SLS-induced irritation involved assessing the protective effects of the product after 14 days of use, followed by SLS application. The analysis revealed a significant increase in TEWL at the time of SLS patch application after 14 days of product use (Figure 9A). The increase in TEWL was highest in the non-treated group (186.1%), followed by the control group (133.51%) and the treated group (103.85%). In addition to TEWL, skin redness was also evaluated. See image of a representative patient who applied SLS 14 days after product application (Figure 9B). A significant increase in skin redness was observed in all groups, with the highest increase in the non-treated group (53.12%), followed by the control group (34.39%) and the treated group (19.45%) (Figure 9C). These results suggest that Nephelium lappaceum peel extract strengthens the skin barrier and reduces the damage caused by irritants such as SLS.

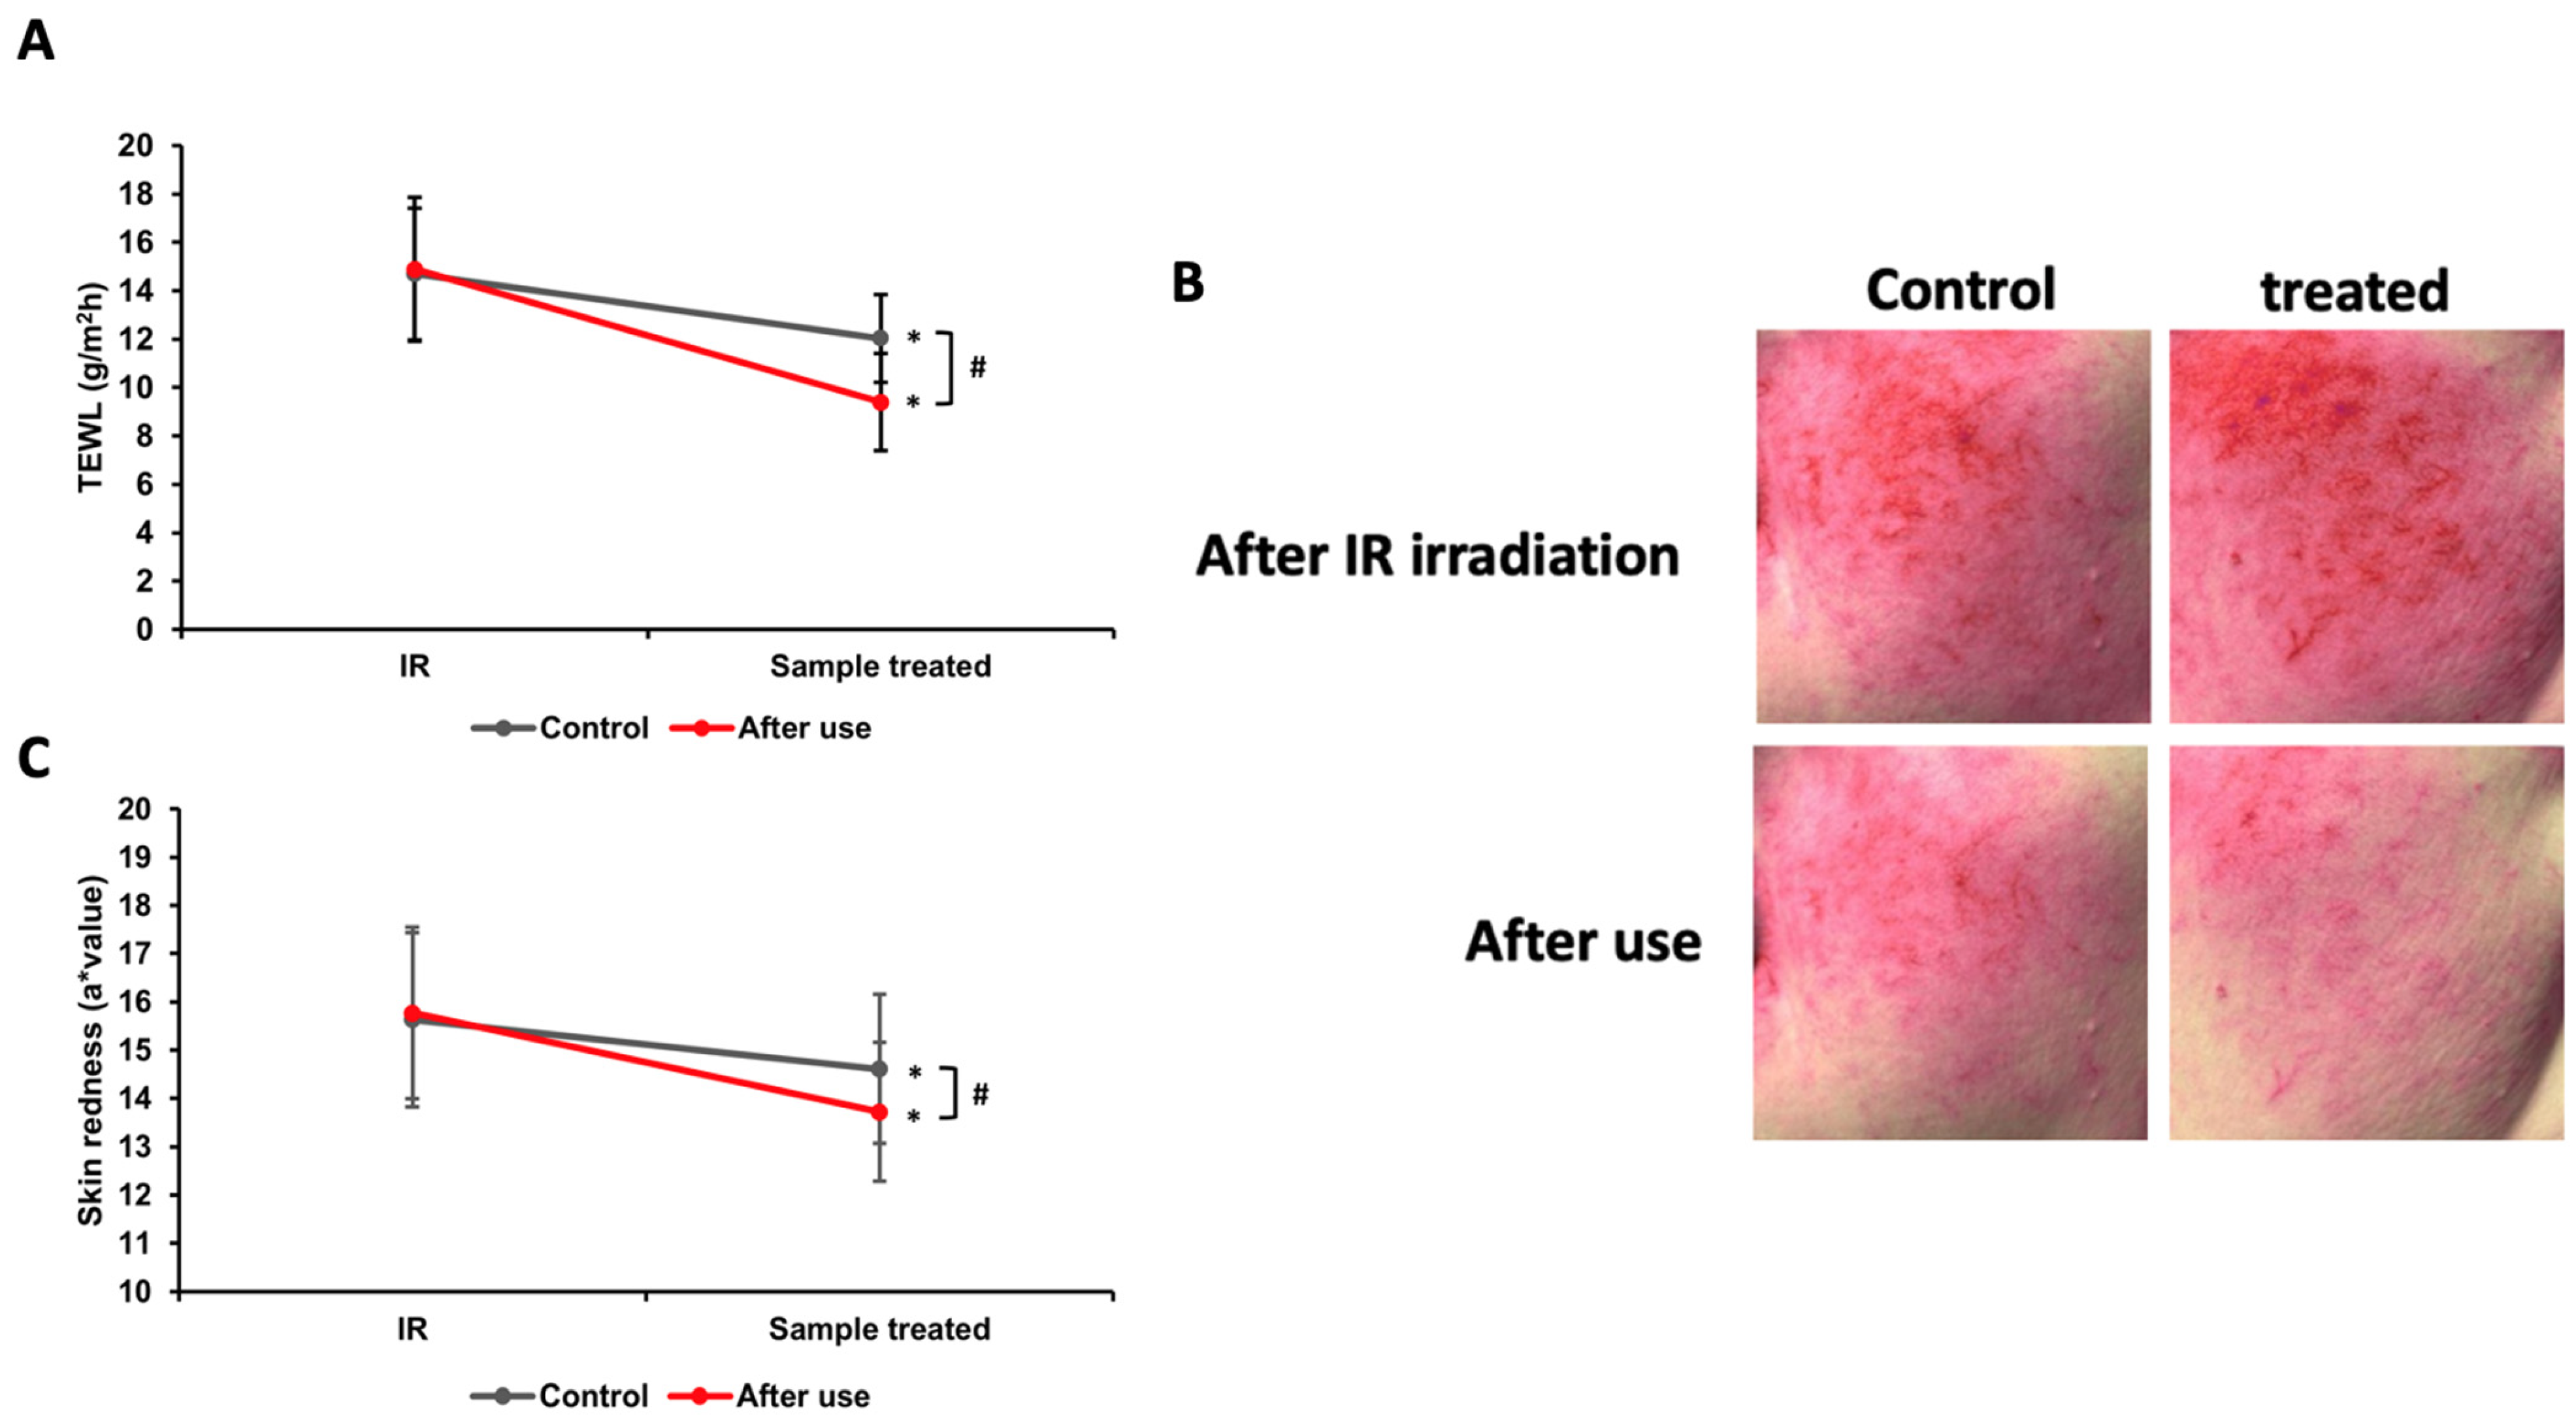
3.11. Analysis of TEWL and Skin Redness After Infrared Heating

The infrared experiment analyzed TEWL and skin redness in the control and treated groups when infrared heating was applied and the product was used once. After infrared heating, the TEWL of the treated group was 14.89, while that of the control group was 12.03. After a single product application, the TEWL of the treated group decreased to 9.4, whereas the control group’s TEWL remained at 12.03 (Figure 10A). Both values significantly decreased, with the treated group showing an improvement rate of 36.87% and the control group 18.11%, approximately twice the improvement observed in the control group. The skin redness experiment also demonstrated a significant difference between the control and treated groups. A visible improvement was observed, as seen in the representative patient’s photo, where the redness in the treated group was further reduced (Figure 10B). Skin redness was significantly reduced in both groups, with an improvement rate of 13% in the treated group and 6.53% in the control group (Figure 10C).

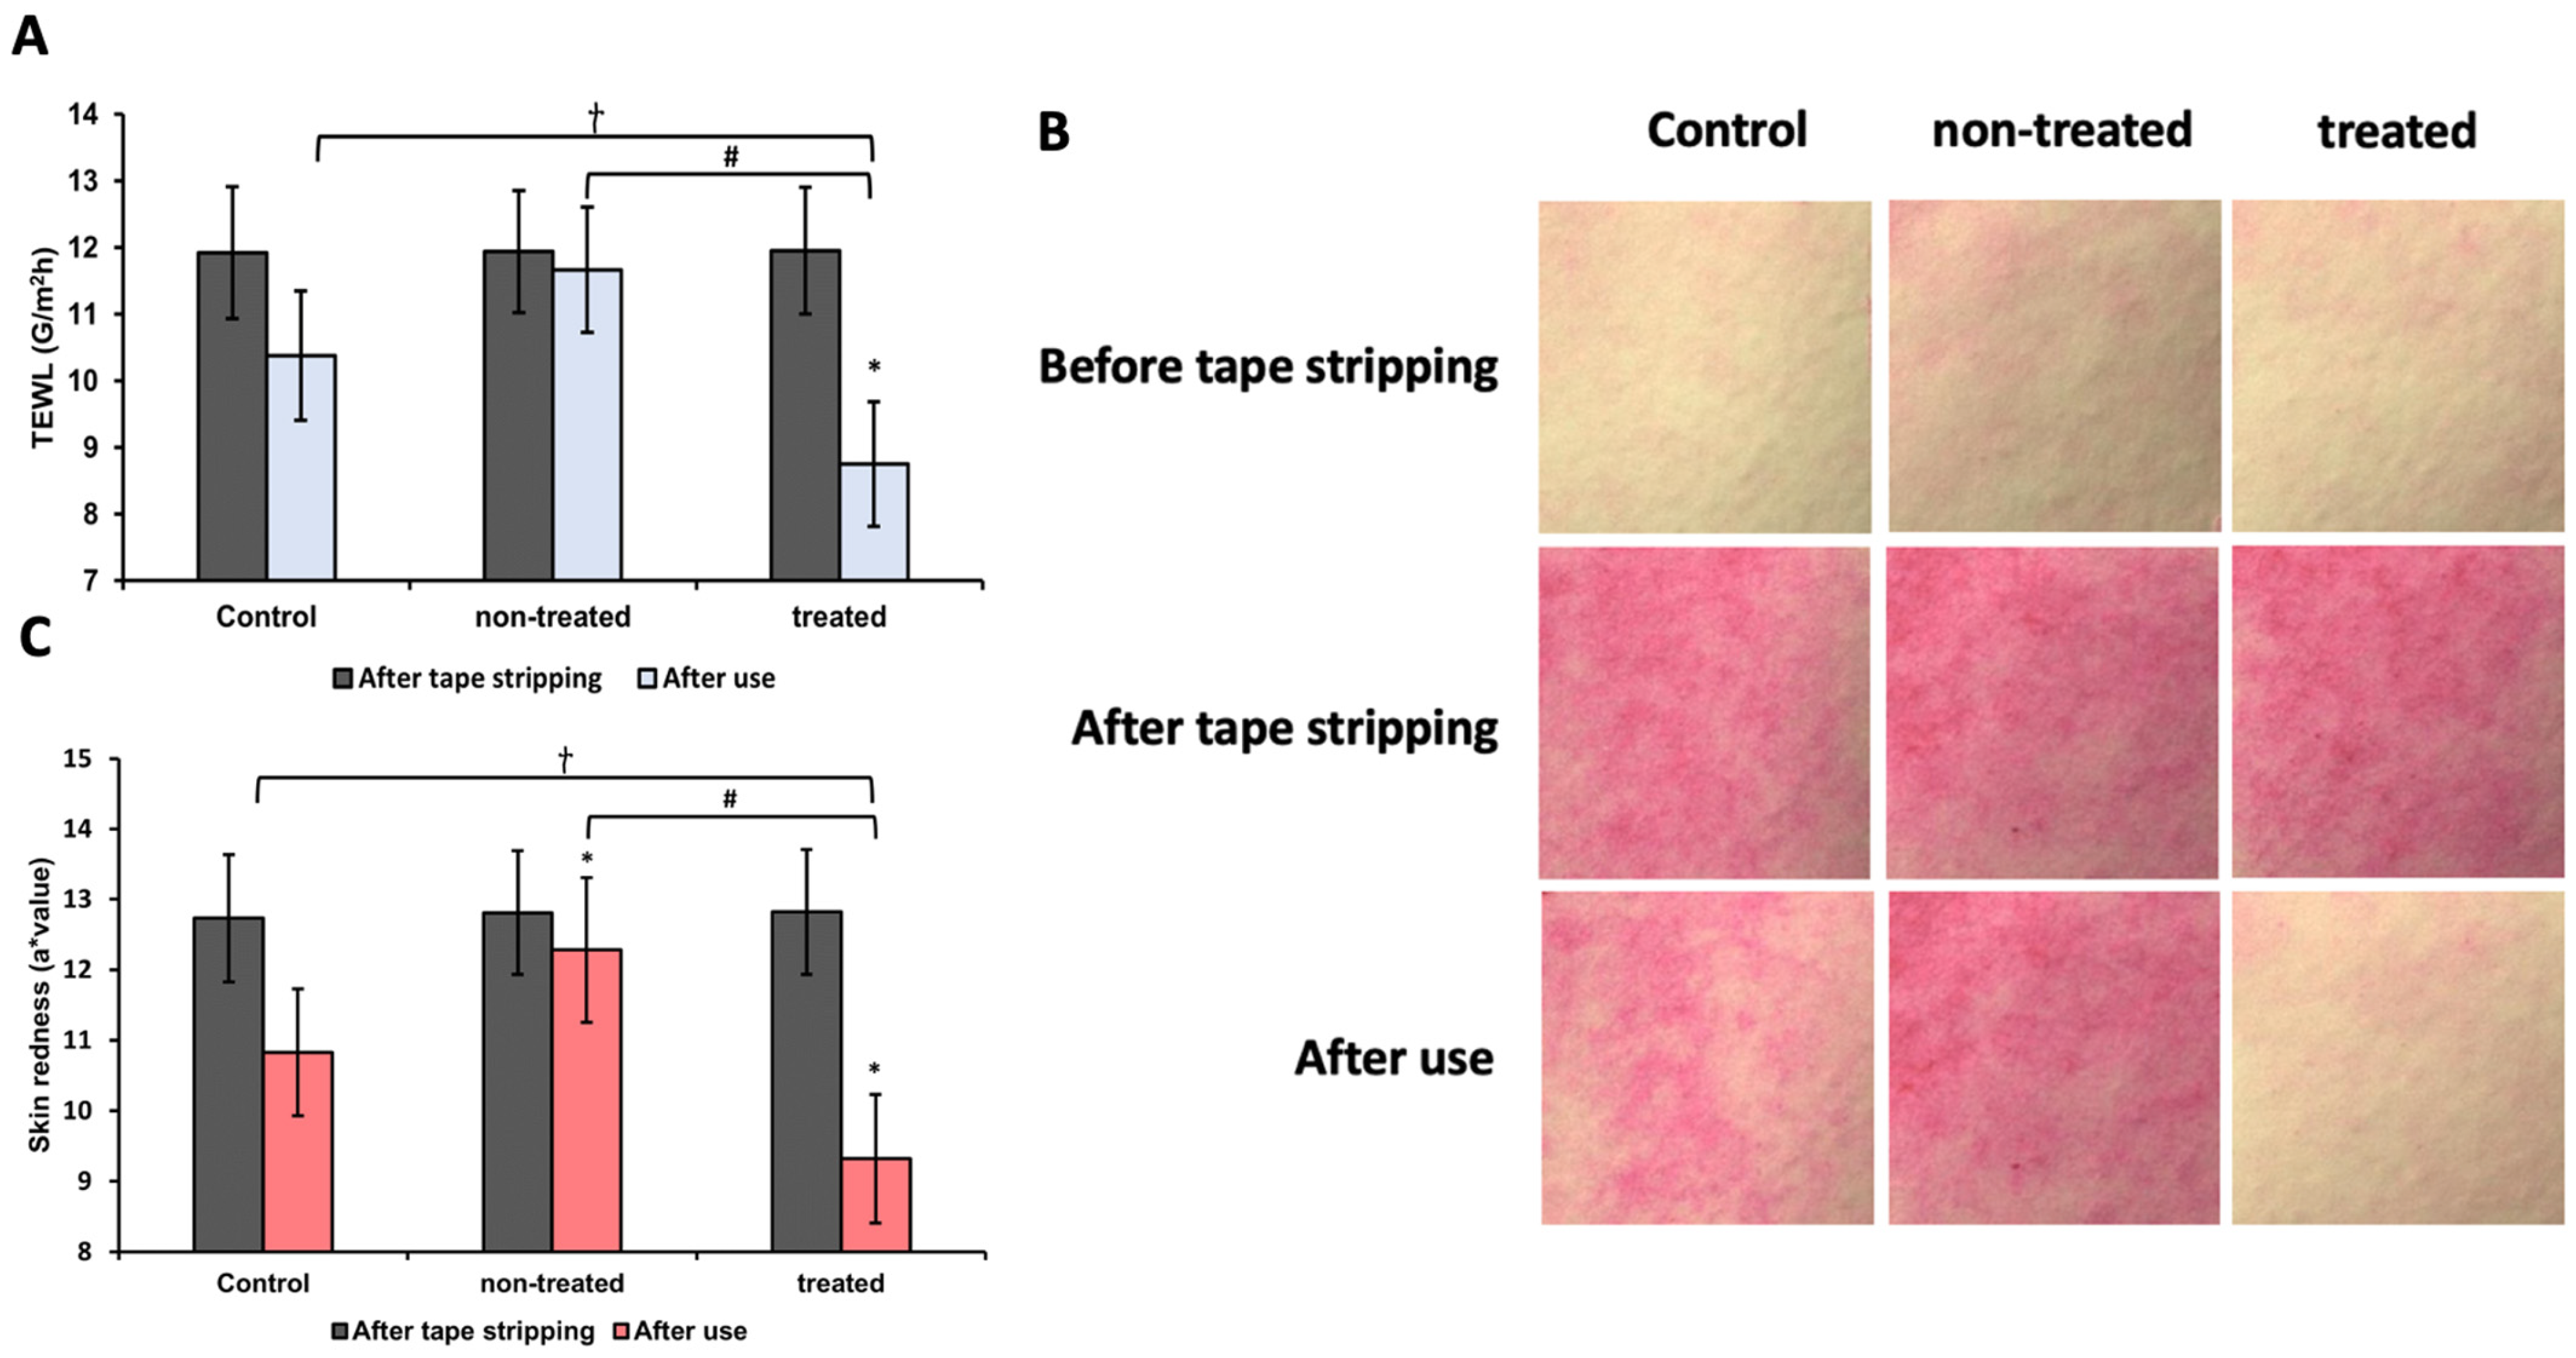
3.12. Analysis of TEWL and Skin Redness Induced by Tape Stripping

To induce physical external irritation to the skin, tape stripping was performed to damage the stratum corneum. After tape stripping, it was divided into three groups: non-treated, control, and treated groups. The extent to which TEWL decreased following a single application of the product was measured (Figure 11A). Compared to post-tape stripping levels, TEWL significantly decreased in all groups, with improvement rates ranked as follows: treated group (26.78%) > control group (12.92%) > non-treated group (2.26%). Next, skin redness was assessed by comparing images taken before and after tape stripping and after product application (Figure 11B). A significant reduction in skin redness was observed in all groups, with improvement rates ranked as follows: treated group (27.3%) > control group (14.93%) > non-treated group (4.14%) (Figure 11C). By integrating all clinical trial data, these findings suggest that a single or repeated application of a product containing 2% Nephelium lappaceum peel extract reduces TEWL and skin redness in response to physical and chemical external stimuli, thereby strengthening the skin barrier. These results indicate that Nephelium lappaceum peel extract is an effective ingredient for anti-inflammatory, irritation-soothing, and skin barrier-enhancing applications.

4. Discussion

Inflammation is a key response to external stressors, mediated by pro-inflammatory cytokines such as TNF-α, IL-1α, and IL-8 [26,39]. The activation of NF-κB and MAPKs plays a critical role in the inflammatory response induced by environmental stressors [40]. Previous studies have demonstrated that SLS, UV radiation, LPS, and RA can activate these inflammatory pathways, contributing to skin barrier dysfunction [41,42,43,44].
In recent years, natural compounds with anti-inflammatory and antioxidant properties have gained attention as potential therapeutic agents for maintaining skin homeostasis [45]. This study demonstrates the potential of Nephelium lappaceum peel extract and geraniin as effective anti-inflammatory agents for mitigating skin barrier damage induced by various environmental stressors. It is known that HaCaT cells exposed to SDS, UV radiation, LPS, and RA exhibited significant upregulation of pro-inflammatory cytokines, including TNF-α, IL-1α, and IL-8. However, treatment with Nephelium lappaceum peel extract and geraniin effectively suppressed the expression of these cytokines, suggesting that these compounds inhibit inflammatory signaling pathways (Figure 2, Figure 3, Figure 4 and Figure 5). This aligns with previous reports highlighting geraniin’s ability to modulate NF-κB and MAPK pathways [35].
In the clinical trial, TEWL measurements and skin redness evaluations further supported the protective role of Nephelium lappaceum peel extract and geraniin. Exposure to UV, IR, SDS, Retinol, and tape stripping resulted in significant increases in TEWL and erythema, indicative of skin barrier disruption and inflammatory responses [46]. However, topical application of Nephelium lappaceum peel extract and geraniin led to a notable reduction in both TEWL and skin redness, suggesting that these compounds enhance skin barrier integrity and alleviate inflammation (Figure 6, Figure 7, Figure 8, Figure 9, Figure 10 and Figure 11).
These results suggest that the protective effects of Nephelium lappaceum peel extract and geraniin are likely attributed to their potent antioxidant and anti-inflammatory properties. By scavenging ROS generated by UV and IR radiation, these compounds may prevent oxidative stress-mediated damage to skin cells. Additionally, their ability to downregulate inflammatory cytokines and modulate NF-κB activity suggests that they can mitigate inflammatory responses triggered by chemical and mechanical irritants.
Despite these findings, several limitations must be considered. The in-vitro experiments were conducted using HaCaT cells, which, while widely used as a keratinocyte model, do not fully replicate the complexity of in vivo skin responses. Additionally, while the clinical trial provided valuable insights into the efficacy of Nephelium lappaceum peel extract and geraniin, further studies with larger sample sizes and long-term assessments are necessary to confirm their benefits and mechanisms of action.
This study provides compelling evidence that Nephelium lappaceum peel extract and its major active component, geraniin, can effectively mitigate inflammation and restore skin barrier function following exposure to environmental stressors. Consequently, the results suggest that Nephelium lappaceum-derived compounds have potential applications in dermatological formulations aimed at protecting the skin from irritants and enhancing its resilience against environmental damage.

Author Contributions

Conceptualization, S.-M.A. and J.-S.H.; methodology, Y.-H.N.; software, Y.-H.N.; validation, J.-S.H., Y.-K.C. and M.-D.K.; formal analysis, E.-J.L.; investigation, E.-J.L.; resources, M.-D.K.; data curation, B.-N.H.; writing—original draft preparation, C.-S.J.; writing—review and editing, C.-S.J.; visualization, Y.-K.C.; supervision, J.-S.H.; project administration, B.-N.H. and S.-M.A. All authors have read and agreed to the published version of the manuscript.

Funding

This research was supported by a grant of the Korea Health Technology R&D Project through the Korea Health Industry Development Institute (KHIDI), funded by the Ministry of Health and Welfare, Republic of Korea (grant number: RS-2023-KH141725).

Institutional Review Board Statement

This study was conducted in accordance with the Declaration of Helsinki, and approved by the Institutional Review Board of Mariedm Skin Research Center (protocol code MMV-24158-1, 24159-1 and date of approval 23 December 2024–10 January 2025) for studies involving humans.

Informed Consent Statement

Informed consent was obtained from all subjects involved in the study.

Data Availability Statement

The original contributions presented in this study are included in the article. Further inquiries can be directed to the corresponding authors.

Conflicts of Interest

Authors Soo Mi Ahn, Youn Hee Nam, and Bin Na Hong were employed by the company Invivotec Co., Ltd., and Myo-Deok Kim and Younki Cho were employed by the company ACTIVON Co., Ltd. The remaining authors declare that the research was conducted in the absence of any commercial or financial relationships that could be construed as potential conflicts of interest.

Abbreviations

TEWLTransepidermal water loss
RARetinoic acid
SLSSodium lauryl sulfate
NF-κBNuclear factor kappa B
TNF-αTumor necrosis factor-alpha
IL-1αInterleukin-1 alpha
IL-6Interleukin-6
IL-8Interleukin-8
ROSReactive oxygen species
RNSReactive nitrogen species
JNKsJun N-terminal kinases
MAPKsMitogen-activated protein kinases
AP-1Activator protein 1
LPSLipopolysaccharides
TLR4Toll-like receptor 4
IRInfrared radiation
NADESsNatural deep eutectic solvents

References

  1. Rauma, M.; Boman, A.; Johanson, G. Predicting the absorption of chemical vapours. Adv. Drug Deliv. Rev. 2013, 65, 306–314. [Google Scholar] [CrossRef] [PubMed]
  2. Dąbrowska, A.K.; Spano, F.; Derler, S.; Adlhart, C.; Spencer, N.D.; Rossi, R.M. The relationship between skin function, barrier properties, and body-dependent factors. Ski. Res. Technol. 2018, 24, 165–174. [Google Scholar]
  3. Dąbrowska, A.K.; Rotaru, G.; Derler, S.; Spano, F.; Camenzind, M.; Annaheim, S.; Stämpfli, R.; Schmid, M.; Rossi, R.M. Materials used to simulate physical properties of human skin. Ski. Res. Technol. 2016, 22, 3–14. [Google Scholar] [CrossRef]
  4. Alexander, H.; Brown, S.; Danby, S.; Flohr, C. Research Techniques Made Simple: Transepidermal Water Loss Measurement as a Research Tool. J. Investig. Dermatol. 2018, 138, 2295–2300.e1. [Google Scholar] [CrossRef] [PubMed]
  5. Hänel, K.H.; Cornelissen, C.; Lüscher, B.; Baron, J.M. Cytokines and the skin barrier. Int. J. Mol. Sci. 2013, 14, 6720–6745. [Google Scholar]
  6. Kafi, R.; Kwak, H.S.R.; Schumacher, W.E.; Cho, S.; Hanft, V.N.; Hamilton, T.A.; King, A.L.; Neal, J.D.; Varani, J.; Fisher, G.J. Improvement of naturally aged skin with vitamin A (retinol). Arch. Dermatol. 2007, 143, 606–612. [Google Scholar]
  7. Quan, T. Human skin aging and the anti-aging properties of retinol. Biomolecules 2023, 13, 1614. [Google Scholar] [CrossRef]
  8. Geria, A.N.; Lawson, C.N.; Halder, R.M. Topical retinoids for pigmented skin. J. Drugs Dermatol. JDD 2011, 10, 483–489. [Google Scholar]
  9. Effendy, I.; Kwangsukstith, C.; Lee, J.Y.; Maibach, H.I. Functional changes in human stratum corneum induced by topical glycolic acid: Comparison with all-trans retinoic acid. Acta. Derm. Venereol. 1995, 75, 455–458. [Google Scholar]
  10. Lee, H.Y.; Stieger, M.; Yawalkar, N.; Kakeda, M. Cytokines and chemokines in irritant contact dermatitis. Mediat. Inflamm. 2013, 2013, 916497. [Google Scholar] [CrossRef]
  11. Matsusaka, T.; Fujikawa, K.; Nishio, Y.; Mukaida, N.; Matsushima, K.; Kishimoto, T.; Akira, S. Transcription factors NF-IL6 and NF-kappa B synergistically activate transcription of the inflammatory cytokines, interleukin 6 and interleukin 8. Proc. Natl. Acad. Sci. USA 1993, 90, 10193–10197. [Google Scholar] [CrossRef] [PubMed]
  12. Rosette, C.; Karin, M. Ultraviolet light and osmotic stress: Activation of the JNK cascade through multiple growth factor and cytokine receptors. Science 1996, 274, 1194–1197. [Google Scholar] [CrossRef] [PubMed]
  13. Bode, A.M.; Dong, Z. Mitogen-activated protein kinase activation in UV-induced signal transduction. Sci. STKE 2003, 2003, re2. [Google Scholar] [CrossRef]
  14. Heck, D.E.; Gerecke, D.R.; Vetrano, A.M.; Laskin, J.D. Solar ultraviolet radiation as a trigger of cell signal transduction. Toxicol. Appl. Pharmacol. 2004, 195, 288–297. [Google Scholar] [CrossRef] [PubMed]
  15. Svobodova, A.; Walterova, D.; Vostalova, J. Ultraviolet light induced alteration to the skin. Biomed. Pap. Palacky Univ. Olomouc 2006, 150, 25. [Google Scholar] [CrossRef]
  16. Halliday, G.M. Inflammation, gene mutation and photoimmunosuppression in response to UVR-induced oxidative damage contributes to photocarcinogenesis. Mutat. Res. /Fundam. Mol. Mech. Mutagen. 2005, 571, 107–120. [Google Scholar] [CrossRef]
  17. Jaisin, Y.; Ratanachamnong, P.; Wongsawatkul, O.; Watthammawut, A.; Malaniyom, K.; Natewong, S. Antioxidant and anti-inflammatory effects of piperine on UV-B-irradiated human HaCaT keratinocyte cells. Life Sci. 2020, 263, 118607. [Google Scholar] [CrossRef]
  18. Wang, C.; An, Q.; Zhao, D.; Li, M.; Zheng, H.; Zhang, J.; Liu, J.; Yang, L.; Su, N. Insight into the mechanism of SDS irritation on human skin keratinocytes by examination of changes in gene expression. Am. J. Biomed. Sci. 2016, 8, 311–321. [Google Scholar] [CrossRef]
  19. Salomon, G.; Giordano-Labadie, F. Surfactant irritations and allergies. Eur. J. Dermatol. 2022, 32, 677–681. [Google Scholar] [CrossRef]
  20. Tsai, S.; Hamblin, M.R. Biological effects and medical applications of infrared radiation. J. Photochem. Photobiol. B Biol. 2017, 170, 197–207. [Google Scholar] [CrossRef]
  21. Grether-Beck, S.; Marini, A.; Jaenicke, T.; Krutmann, J. Photoprotection of human skin beyond ultraviolet radiation. Photodermatol. Photoimmunol. Photomed. 2014, 30, 167–174. [Google Scholar] [CrossRef] [PubMed]
  22. Lu, Y.; Yeh, W.; Ohashi, P.S. LPS/TLR4 signal transduction pathway. Cytokine 2008, 42, 145–151. [Google Scholar] [CrossRef] [PubMed]
  23. Peng, L.; Shi, H.; Yuan, M.; Li, J.; Song, K.; Huang, J.; Yi, P.; Shen, H.; Fu, B. Madecassoside protects against LPS-induced acute lung injury via inhibiting TLR4/NF-κB activation and blood-air barrier permeability. Front. Pharmacol. 2020, 11, 807. [Google Scholar] [CrossRef]
  24. Wang, W.; Wu, L.; Li, Q.; Zhang, Z.; Xu, L.; Lin, C.; Gao, L.; Zhao, K.; Liang, F.; Zhang, Q. Madecassoside prevents acute liver failure in LPS/D-GalN-induced mice by inhibiting p38/NF-κB and activating Nrf2/HO-1 signaling. Biomed. Pharmacother. 2018, 103, 1137–1145. [Google Scholar] [CrossRef]
  25. Cao, W.; Li, X.; Zhang, X.; Hou, Y.; Zeng, A.; Xie, Y.; Wang, S. Madecassoside suppresses LPS-induced TNF-α production in cardiomyocytes through inhibition of ERK, p38, and NF-κB activity. Int. Immunopharmacol. 2010, 10, 723–729. [Google Scholar] [CrossRef]
  26. Albanesi, C.; Scarponi, C.; Giustizieri, M.L.; Girolomoni, G. Keratinocytes in inflammatory skin diseases. Curr. Drug Targets-Inflamm. Allergy 2005, 4, 329–334. [Google Scholar] [CrossRef] [PubMed]
  27. Bonneville, M.; Chavagnac, C.; Vocanson, M.; Rozieres, A.; Benetiere, J.; Pernet, I.; Denis, A.; Nicolas, J.; Hennino, A. Skin Contact Irritation Conditions the Development and Severity of Allergic Contact Dermatitis. J. Investig. Dermatol. 2007, 127, 1430–1435. [Google Scholar] [CrossRef]
  28. Zhang, Y.; Heinemann, N.; Rademacher, F.; Darvin, M.E.; Raab, C.; Keck, C.M.; Vollert, H.; Fluhr, J.W.; Gläser, R.; Harder, J. Skin care product rich in antioxidants and anti-inflammatory natural compounds reduces itching and inflammation in the skin of atopic dermatitis patients. Antioxidants 2022, 11, 1071. [Google Scholar] [CrossRef]
  29. Nizioł-Łukaszewska, Z.; Osika, P.; Wasilewski, T.; Bujak, T. Hydrophilic dogwood extracts as materials for reducing the skin irritation potential of body wash cosmetics. Molecules 2017, 22, 320. [Google Scholar] [CrossRef]
  30. Hernández-Hernández, C.; Aguilar, C.N.; Rodríguez-Herrera, R.; Flores-Gallegos, A.C.; Morlett-Chávez, J.; Govea-Salas, M.; Ascacio-Valdés, J.A. Rambutan (Nephelium lappaceum L.): Nutritional and functional properties. Trends Food Sci. Technol. 2019, 85, 201–210. [Google Scholar] [CrossRef]
  31. Li, Y.; Zhuang, Y.; Tian, W.; Sun, L. In vivo acute and subacute toxicities of phenolic extract from rambutan (Nephelium lappaceum) peels by oral administration. Food Chem. 2020, 320, 126618. [Google Scholar] [CrossRef] [PubMed]
  32. Fadilah, N.N.; Nofriyaldi, A.; Junaedi, S.A. Antipyretic Activity Test of Rambutan (Nephelium lappaceum L.) Seed in White Male Mice (Mus musculus). Recent Dev. Chem. Biochem. Res. 2023, 2720, 030003. [Google Scholar]
  33. Sangeeth Shyam Sundar, S.S.; Rajamanickam, C.; Saraswathy, S.; Venkatesan, K.; Balakumbahan, R.; Vijayasamundeeswari, A.; Sankar, C. Sapindaceae fruits: A comprehensive overview on phytochemicals, nutraceuticals and health benefits application. Plant Sci. Today 2024, 11, 1–14. [Google Scholar] [CrossRef]
  34. Nam, Y.H.; Ahn, S.M.; Seo, G.J.; Kim, N.W.; Shin, S.W.; Nuankaew, W.; Murughanantham, N.; Pandian, S.; Hwang, J.S.; Hong, B.N.; et al. Optimization of NADES-based green extraction of ellagitannins from rambutan peel with enhanced antioxidant activity. Food Chem. 2025, 475, 143308. [Google Scholar] [CrossRef]
  35. Okabe, S.; Suganuma, M.; Imayoshi, Y.; Taniguchi, S.; Yoshida, T.; Fujiki, H. New TNF-α releasing inhibitors, geraniin and corilagin, in leaves of Acer nikoense, Megusurino-ki. Biol. Pharm. Bull. 2001, 24, 1145–1148. [Google Scholar] [CrossRef]
  36. Thitilertdecha, N.; Chaiwut, P.; Saewan, N. In-vitro antioxidant potential of Nephelium lappaceum L. rind extracts and geraniin on human epidermal keratinocytes. Biocatal. Agric. Biotechnol. 2020, 23, 101482. [Google Scholar] [CrossRef]
  37. Siqueira, E.M.d.S.; Lima, T.L.; Boff, L.; Lima, S.G.; Lourenço, E.M.; Ferreira, É.G.; Barbosa, E.G.; Machado, P.R.; Farias, K.J.; Ferreira, L.d.S. Antiviral potential of Spondias mombin L. leaves extract against herpes simplex virus type-1 replication using in vitro and in silico approaches. Planta Med. 2020, 86, 505–515. [Google Scholar] [CrossRef] [PubMed]
  38. Afaq, F.; Adhami, V.M.; Mukhtar, H. Photochemoprevention of ultraviolet B signaling and photocarcinogenesis. Mutat. Res./Fundam. Mol. Mech. Mutagen. 2005, 571, 153–173. [Google Scholar] [CrossRef]
  39. Dinarello, C.A. Proinflammatory Cytokines. Chest 2000, 118, 503–508. [Google Scholar] [CrossRef]
  40. Chen, L.; Deng, H.; Cui, H.; Fang, J.; Zuo, Z.; Deng, J.; Li, Y.; Wang, X.; Zhao, L. Inflammatory responses and inflammation-associated diseases in organs. Oncotarget 2017, 9, 7204. [Google Scholar] [CrossRef]
  41. He, Y.; Kim, B.; Kim, H.; Sun, Q.; Shi, S.; Ma, G.; Kim, Y.; Kim, O.; Kim, O. The protective role of feruloylserotonin in LPS-induced HaCaT cells. Molecules 2019, 24, 3064. [Google Scholar] [CrossRef] [PubMed]
  42. Bae, J.; Choi, J.; Kang, S.; Lee, Y.; Park, J.; Kang, Y. Dietary compound ellagic acid alleviates skin wrinkle and inflammation induced by UV-B irradiation. Exp. Dermatol. 2010, 19, e182–e190. [Google Scholar] [CrossRef] [PubMed]
  43. Petersen, L.J.; Lyngholm, A.M.; Arendt-Nielsen, L. A novel model of inflammatory pain in human skin involving topical application of sodium lauryl sulfate. Inflamm. Res. 2010, 59, 775–781. [Google Scholar] [CrossRef]
  44. Kim, B.; Lee, Y.; Kang, K. The mechanism of retinol-induced irritation and its application to anti-irritant development. Toxicol. Lett. 2003, 146, 65–73. [Google Scholar] [CrossRef] [PubMed]
  45. Gagosian, V.S.C.; Claro, F.C.; Schwarzer, A.C.d.A.P.; Cruz, J.V.; Thá, E.L.; Trindade, E.d.S.; Magalhães, W.L.E.; Pestana, C.B.; Leme, D.M. The potential use of kraft lignins as natural ingredients for cosmetics: Evaluating their photoprotective activity and skin irritation potential. Int. J. Biol. Macromol. 2022, 222, 2535–2544. [Google Scholar] [CrossRef]
  46. Smith, W. Stratum corneum barrier integrity controls skin homeostasis. Int. J. Cosmet. Sci. 1999, 21, 99–106. [Google Scholar]
Figure 1. The effects of Nephelium lappaceum peel extract and geraniin on the viability of HaCaT Cells. (A) HaCaT cells were treated with Nephelium lappaceum peel extract 1, 5, 10, 20, 30 ppm for 24 h. (B) HaCaT cells were treated with geraniin 0.1, 1, 5, 10 μM for 24 h. Values are the means ± SD from three replicates (n = 3). Data were analyzed with t-test. ** p < 0.01, *** p < 0.001 compared with the non-treated cells.
Cosmetics 12 00117 g001
Figure 2. (A) HaCaT cells were pretreated with RA 1μM for 3 h and then treated with 5, 10, and 20 ppm of Nephelium lappaceum peel extract. After 24 h, Nephelium lappaceum extract inhibited the release of TNF- α in a dose-dependent manner. Similarly, the release of TNF- α was confirmed after pretreatment with RA 3 h before treatment with geraniin 0.1, 0.5, and 1 μM. The release of TNF- α was confirmed to be lower than that of RA treatment. (B) MCP-1 expression was determined by 3 h pretreatment with RA followed by 24 h treatment with each substance. Both Nephelium lappaceum peel extract and geraniin inhibited MCP-1. Values are the means ± SD from three replicates (n = 3). Data were analyzed with t-test. ** p < 0.01, *** p < 0.001 compared with the RA treated. ### p < 0.001 compared with the control.
Cosmetics 12 00117 g002
Figure 3. (A) HaCaT cells were pretreated with UV 50 mJ for 3 h and then treated with 5, 10, 20 ppm Nephelium lappaceum peel extract and 0.1, 0.5, 1 μM geraniin. After 24 h, both Nephelium lappaceum peel extract and geraniin inhibited TNF-α in a dose-dependent manner. (B) HaCaT cells were pretreated with UV 50 mJ for 3 h and then treated with 5, 10, and 20 ppm of Nephelium lappaceum peel extract for 24 h. The results showed a dose-dependent inhibition of IL-8. Values are the means ± SD from three replicates (n = 3). Data were analyzed with t-test. ** p < 0.01, *** p < 0.001 compared with UV-induced. ### p < 0.001 compared with the control.
Cosmetics 12 00117 g003
Figure 4. HaCaT cells were treated with 10 μg/mL of SDS for 3 h and then treated with 5, 10, 20 ppm of Nephelium lappaceum peel extract and 0.1, 0.5, 1 μM of geraniin for 24 h and analyzed by q-RT PCR. The release of IL-α from Nephelium lappaceum peel extract and geraniin was reduced in a dose-dependent manner compared to the SDS treatment group. Values are the means ± SD from three replicates (n = 3). Data were analyzed with t-test. *** p < 0.001 compared with the SDS-induced. ### p < 0.001 compared with the control.
Cosmetics 12 00117 g004
Figure 5. HaCaT cells were treated with LPS and the release of TNF-α and IL-8 was determined by q-RT PCR. (A) LPS was treated 3 h before treatment with Nephelium lappaceum peel extract and geraniin, and TNF-α release was determined by 24 h treatment with 5, 10, and 20 ppm of Nephelium lappaceum peel extract and 0.1, 0.5, 1 μM of geraniin. Both substances decreased in a dose-dependent manner. (B) The release of IL-8 was determined by the same treatment. The results showed a dose-dependent decrease, similar to TNF-α. Values are the means ± SD from three replicates (n = 3). Data were analyzed with t-test. *** p < 0.001 compared with LPS-induced. ### p < 0.001 compared with the control.
Cosmetics 12 00117 g005
Figure 6. To induce skin damage through ultraviolet (UV) exposure, an artificial UV irradiation device (Multiport UV Solar Simulator, 601–300 W; Solar Light Co., Philadelphia, PA, USA) was used. A dose of 60 mJ/cm2 was applied to the left or right medial sides of the participants’ upper arms. Skin irritation was confirmed through a skin redness reaction within 16 to 24 h post-irradiation. Afterwards, each evaluation item was measured using the product for 3 and 14 days. (A) TEWL was measured once at each test site on the study participants at each evaluation point (before and after stimulation, after 3 days of product use, and after 14 days of product use) using a Vapometer® (Delfin, Finland). (B) This is an image showing the measurement of TEWL in the control, non-treated, and treated areas of one of the participants. (C) Skin redness was assessed using ANTERA 3D® CS (miravex, Ireland). At each evaluation point, the participant’s test area was photographed, filters were applied, and a* values representing skin redness were analyzed. Values are the means ± SD from three replicates (n = 20). Data were analyzed with RM-ANOVA. * p < 0.05 compared with after UV irradiation. † p < 0.05 compared with 3 days after treated on the non-treated group. # p < 0.05 compared with 14 days after treated on the non-treated group. $ p < 0.05 compared with 3 days after treated on control group. ‡ p < 0.05 compared with 14 days after treated on control group.
Cosmetics 12 00117 g006
Figure 7. Retinol (1%) was applied to the inner forearm of the participants’ left or right arms in three designated areas (control, non-treated, and treated). A 20 μL aliquot of 1% retinol was dispensed into a chamber and occlusively applied for 24 h. After 24 h, the chamber was removed, and the application site was gently cleansed with lukewarm water. After an additional 30 min, the presence or absence of skin damage was assessed under standardized lighting conditions. The retinol used in this study was provided by InvivoTech Co., Ltd. as a 15% retinol formulation and was used to induce skin damage. (A) TEWL was measured once at each test site on the study participants at each evaluation point (before and after stimulation, after 3 days of product use, and after 14 days of product use) using a Vapometer® (Delfin, Finland). (B) This is an image showing the measurement of TEWL in the control, non-treated, and treated areas of one of the participants. (C) Skin redness was assessed using ANTERA 3D® CS (miravex, Ireland). At each evaluation point, the participant’s test area was photographed, filters were applied, and a* values representing skin redness were analyzed. Values are the means ± SD from three replicates (n = 20). Data were analyzed with RM-ANOVA. * p < 0.05 compared with after retinol treated. † p < 0.05 compared with 3 days after treated on the non-treated group. # p < 0.05 compared with 14 days after treated on the non-treated group. $ p < 0.05 compared with 3 days after treated on control group. ‡ p < 0.05 compared with 14 days after treated on control group.
Cosmetics 12 00117 g007
Figure 8. To induce a form of chemical damage using SLS, 20 μL of 1.5% SLS was dispensed into a chamber and applied to three sites (control, non-treated, treated) on the inner forearm (left or right) of the participants for 24 h. After 24 h, the patch was removed, and the site was gently washed with lukewarm water. After 30 min, the presence or absence of skin damage was assessed under standardized illumination conditions. (A) TEWL was measured once at each test site on the study participants at each evaluation point (before and after stimulation, after 3 days of product use, and after 14 days of product use) using a Vapometer® (Delfin, Finland). (B) This is an image showing the measurement of TEWL in the control, non-treated, and treated areas of one of the participants. (C) Skin redness was assessed using ANTERA 3D® CS (miravex, Ireland). At each evaluation point, the participant’s test area was photographed, filters were applied, and a* values representing skin redness were analyzed. Values are the means ± SD from three replicates (n = 20). Data were analyzed with RM-ANOVA. * p < 0.05 compared with after SLS treated. † p < 0.05 compared with 3 days after treated on the non-treated group. # p < 0.05 compared with 14 days after treated on the non-treated group. $ p < 0.05 compared with 3 days after treated on control group. ‡ p < 0.05 compared with 14 days after treated on control group.
Cosmetics 12 00117 g008
Figure 9. To protect against skin damage caused by SLS, 1.5% SLS was added dropwise in 20 μL to the chamber and applied for 24 h after 14 days of product use. (A) TEWL was measured once at each test site on the study participants at each evaluation point (14 days after treated, after SLS treated) using a Vapometer® (Delfin, Finland). (B) This is an image showing the measurement of TEWL in the control, non-treated, and treated areas of one of the participants. (C) Skin redness was assessed using ANTERA 3D® CS (miravex, Ireland). At each evaluation point, the participant’s test area was photographed, filters were applied, and a* values representing skin redness were analyzed. Values are the means ± SD from three replicates (n = 20). Data were analyzed with t-test. * p < 0.05 compared with 14 days after use.
Cosmetics 12 00117 g009
Figure 10. Skin damage induced by external infrared radiation was performed using an infrared irradiator (INFRALUX-300). The left and right facial areas of each participant were designated as the test and control groups, respectively. With the eyes protected by safety goggles, infrared radiation was applied to the test area from a fixed distance of approximately 30 cm for 15 min to induce skin damage. (A) TEWL was measured once at each test site on the study participants at each evaluation point (after IR irradiation, after use) using a Vapometer® (Delfin, Finland). (B) This is an image showing the measurement of TEWL in the control, non-treated, and treated areas of one of the participants. (C) Skin redness was assessed using ANTERA 3D® CS (miravex, Ireland). At each evaluation point, the participant’s test area was photographed, filters were applied, and a* values representing skin redness were analyzed. Values are the means ± SD from three replicates (n = 20). Data were analyzed with t-test. * p < 0.05 compared with after IR irradiation. # p < 0.05 compared with control group.
Cosmetics 12 00117 g010
Figure 11. Physical irritation was induced using the tape stripping method with cellophane tape (3M Scotch™ Multi-Purpose Tape). Stripping was performed on three sites (control, non-treated, treated) on the inner side of the left or right forearm of the participants to induce damage to the stratum corneum. (A) TEWL was measured once at each test site on the study participants at each evaluation point (after IR irradiation, after use) using a Vapometer® (Delfin, Finland). (B) This is an image showing the measurement of TEWL in the control, non-treated, and treated areas of one of the participants. (C) Skin redness was assessed using ANTERA 3D® CS (miravex, Ireland). At each evaluation point, the participant’s test area was photographed, filters were applied, and a* values representing skin redness were analyzed. Values are the means ± SD from three replicates (n = 20). Data were analyzed with t-test. * p < 0.05 compared with after tape stripping. # p < 0.05 compared with after use on the non-treated group. † p < 0.05 compared with after use on the control group.
Cosmetics 12 00117 g011
Table 1. Concentrations of geraniin, corilagin, gallic acid, and ellagic acid in Nephelium lappaceum peel extract obtained using an NADES.
Geraniin
(μg/mg)
Corilagin
(μg/mg)
Gallic Acid
(μg/mg)
Ellagic Acid
(μg/mg)
38.065.718.383.49
Disclaimer/Publisher’s Note: The statements, opinions and data contained in all publications are solely those of the individual author(s) and contributor(s) and not of MDPI and/or the editor(s). MDPI and/or the editor(s) disclaim responsibility for any injury to people or property resulting from any ideas, methods, instructions or products referred to in the content.

