1. Introduction
Rapid economic development in emerging economies has intensified global concern over rising CO2 emissions, energy insecurity, and environmental degradation. Among these economies, China and India occupy a central position as the world’s largest contributors to energy consumption and greenhouse gas emissions. Their economic trajectories—driven by industrialization, urbanization, and structural transformation—have profound implications for global climate commitments, including the Paris Agreement and the Sustainable Development Goals (SDGs). Understanding not only the magnitude but also the direction of these effects is essential, as environmental responses to economic and energy shocks are often asymmetric and context-dependent.
A large body of empirical literature has examined the determinants of CO2 emissions, particularly economic growth, energy consumption, trade openness, and technological progress. However, most studies rely on linear and symmetric modeling frameworks, assuming that positive and negative changes in explanatory variables generate identical environmental responses. This assumption limits the explanatory power of existing models, as it does not reflect the complex and dynamic nature of real-world economic systems. In emerging economies, structural rigidities, policy interventions, and technological constraints often produce nonlinear and asymmetric adjustment patterns. For example, increases in energy consumption may lead to immediate rises in emissions, while reductions may not result in proportional environmental improvements due to fossil fuel dependence or industrial lock-in.
These asymmetries are particularly relevant in the context of China and India. China is undergoing a major energy transition characterized by rapid renewable energy development, industrial upgrading, and strong investment in green innovation. Consequently, the environmental impact of shocks may differ depending on their direction. In contrast, India remains at an earlier stage of structural transformation, with coal dominance, limited renewable penetration, and a less developed innovation system. As a result, emission dynamics may follow different adjustment paths, highlighting the importance of a comparative and nonlinear framework.
Despite the relevance of these dynamics, there remains a gap in the literature concerning the asymmetric environmental behavior of China and India. Existing studies typically analyze each country in isolation and rely on symmetric models such as ARDL or VAR. Comparative evidence using asymmetric approaches remains limited, restricting our understanding of how structural differences influence emissions and limiting the development of targeted environmental policies.
Against this backdrop, this study is motivated by the need to better understand how asymmetric shocks in key macroeconomic and energy variables influence environmental outcomes across structurally diverse emerging economies. Addressing this issue is crucial for designing more effective and targeted climate policies in the context of ongoing energy transitions.
To address this gap, this study investigates the asymmetric effects of economic growth, energy consumption, renewable energy use, trade openness, and innovation on CO2 emissions in China and India. The analysis employs the Nonlinear Autoregressive Distributed Lag (NARDL) model, which decomposes explanatory variables into positive and negative changes, allowing for the estimation of both long-run and short-run asymmetries.
This study makes three main contributions. First, it advances the existing literature by applying the NARDL framework to jointly examine the asymmetric effects of economic growth, energy consumption, renewable energy, trade openness, and innovation on CO2 emissions, thereby moving beyond conventional linear approaches. Second, it provides a structured comparative analysis of China and India, emphasizing how differences in economic scale, energy composition, technological capacity, and stages of development shape asymmetric adjustment dynamics. Third, it offers policy-relevant insights by demonstrating that emissions responses are direction-dependent and country-specific, implying that uniform climate policies may be ineffective in heterogeneous economic contexts.
The remainder of the paper is structured as follows.
Section 2 reviews literature,
Section 3 presents the data and methodology,
Section 4 reports the empirical results,
Section 5 discusses the findings and
Section 6 concludes.
2. Literature Review
The relationships between economic growth, energy use, technological progress, trade openness, and environmental quality have been widely examined, yet remain complex in rapidly evolving economies such as China and India. The literature generally focuses on five key areas: the growth–emissions nexus, energy structure, trade integration, technological innovation, and nonlinear modeling. Together, these strands provide the foundation for understanding emissions dynamics in emerging economies.
2.1. Theoretical Foundations of Asymmetry and Energy Transition
Recent advances in environmental and energy economics emphasize that emission dynamics are inherently nonlinear and structurally dependent. Traditional frameworks such as the Environmental Kuznets Curve (EKC) assume a symmetric relationship between income and environmental degradation. However, more recent studies suggest that this relationship is nonlinear, path-dependent, and sensitive to structural transformation (Grossman & Krueger, 1995 [
1]; Apergis & Ozturk, 2015 [
2]). In particular, economic growth may produce asymmetric environmental effects depending on the direction of shocks and the stage of development.
From an energy transition perspective, the shift from fossil fuels to renewable energy is neither smooth nor uniform. Technological lock-in, infrastructure rigidity, and adjustment costs generate asymmetric responses to energy shocks (Popp et al., 2010 [
3]; Wu et al., 2025 [
4]). For example, increases in fossil energy use may raise emissions rapidly, while reductions may not yield proportional improvements due to persistent structural dependencies.
Structural transformation theory further highlights that economies evolve from energy-intensive systems toward knowledge-based structures, leading to heterogeneous responses across countries. As a result, economies at different stages—such as China and India—exhibit distinct adjustment mechanisms (Zhao et al., 2026 [
5]; Xu et al., 2026 [
6]). These perspectives justify the use of asymmetric models such as NARDL.
2.2. Economic Growth and CO2 Emissions
The relationship between economic growth and environmental degradation is commonly framed within the EKC hypothesis, which suggests that emissions initially rise with income before declining at higher development levels (Grossman & Krueger, 1995 [
1]). Empirical evidence for emerging economies remains mixed. Some studies find partial support for the EKC (Apergis & Ozturk, 2015 [
2]), while others highlight the importance of structural factors and energy dependence.
Recent contributions suggest that the growth–emissions relationship is not only nonlinear but also asymmetric, with different responses to economic expansions and contractions (Zhao et al., 2026 [
5]). In China, emissions are closely linked to industrialization and coal dependence (Zhang & Cheng, 2009 [
7]), whereas in India the turning point of the EKC remains distant due to lower income levels and slower structural change (Sharma, 2011 [
8]). These findings indicate that growth alone cannot explain emissions dynamics and support the need for nonlinear approaches.
2.3. Energy Consumption and Environmental Quality
Energy consumption is a primary driver of CO
2 emissions, particularly through fossil fuel use (Alshehry & Belloumi, 2015 [
9]; Abid et al., 2024 [
10]). In China, coal dominance and industrial intensity generate persistent environmental effects (Huangfu et al., 2023 [
11]). In India, energy demand is more closely linked to short-run economic fluctuations (Kumar & Majid, 2020 [
12]; Kumar et al., 2022 [
13]).
Recent studies emphasize that energy transitions are nonlinear and asymmetric. Renewable energy reduces emissions, but its effectiveness depends on institutional support and technological maturity (Wu et al., 2025 [
4]; Xu et al., 2026 [
6]). While renewables significantly reduce emissions in China (Sohaib et al., 2025 [
14]; Chaabouni & Abid, 2025 [
15]), evidence for India remains mixed due to its limited renewable penetration (Rafindadi & Ozturk, 2017 [
16]).
Overall, the literature highlights that energy structure—not just consumption—plays a critical role, but uneven transitions may generate asymmetric environmental responses.
2.4. Trade Openness and Environmental Effects
The environmental impact of trade openness is theoretically ambiguous. The scale effect increases emissions through production expansion, the composition effect depends on sectoral structure, and the technique effect may reduce emissions through technological improvements (Cole, 2004 [
17]; Abid, 2025 [
18]).
Recent studies suggest that trade effects are conditional and asymmetric, influenced by institutional quality and regulatory frameworks (Soto et al., 2025 [
19]). In China, export-led growth initially increased emissions, although recent structural changes have moderated this effect (Shahbaz et al., 2016 [
20]). In India, trade impacts remain mixed due to weaker institutions and limited diversification (Tiwari et al., 2013 [
21]).
These findings suggest that trade openness does not have a uniform environmental impact and may generate asymmetric responses depending on the direction of shocks.
2.5. Technological Innovation and Emissions
Technological innovation plays a key role in reducing emissions through improved efficiency and cleaner production (Popp et al., 2010 [
3]). In China, rapid innovation in renewable energy and industrial technologies has contributed to emissions reduction, although transitional phases may temporarily increase pollution (Wang et al., 2023 [
22]).
Recent evidence highlights that innovation–environment relationships are nonlinear and asymmetric, with different effects depending on the direction of technological change (Bergougui et al., 2025 [
23]; Zhao et al., 2026 [
5]). In contrast, innovation effects in India remain weaker due to limited R&D capacity and slower technology diffusion (Zhang et al., 2025 [
24]).
Thus, the environmental impact of innovation depends on technological maturity and may vary across countries and over time.
2.6. Nonlinear and Asymmetric Modeling Approaches
Linear models often fail to capture the complexity of environmental dynamics. The NARDL model (Shin et al., 2014 [
25]) addresses this limitation by decomposing variables into positive and negative changes, allowing the estimation of asymmetric long-run and short-run effects. Empirical studies show that NARDL provides superior explanatory power compared to symmetric models (Bahmani-Oskooee & Fariditavana, 2015 [
26]; Xu et al., 2026 [
6]). However, applications of NARDL to China and India in a comparative framework remain limited, particularly when incorporating innovation, trade, and renewable energy simultaneously. This study addresses this gap.
Recent studies further highlight the importance of nonlinear and asymmetric dynamics in the energy–environment nexus, showing that renewable energy, trade, and technological innovation exert heterogeneous and direction-dependent effects on emissions (Umar et al., 2021 [
27]; Balsalobre-Lorente et al., 2018 [
28]; Abid, 2025 [
29]). These findings indicate that positive and negative shocks in key variables do not generate symmetric environmental responses, thereby reinforcing the relevance of nonlinear modeling approaches. In addition, the effectiveness of innovation in reducing emissions depends critically on structural conditions and institutional quality (Usman & Hammar, 2020 [
30]; Adebayo et al., 2021 [
31]). More specifically, recent evidence suggests that the environmental impact of innovation is conditional on the maturity of innovation systems and the efficiency of technology diffusion mechanisms, particularly in emerging economies.
2.7. Summary and Research Gap
Existing studies confirm that growth, energy use, innovation, and trade are key determinants of CO2 emissions, but their effects vary across countries. China and India differ significantly in energy structure, industrial development, and technological capacity, leading to divergent environmental outcomes.
Recent research increasingly emphasizes nonlinear and asymmetric relationships, particularly in economies undergoing energy transition (Zhao et al., 2026 [
5]; Xu et al., 2026 [
6]). However, comparative evidence remains limited.
This study fills three main gaps by integrating multiple determinants within a unified framework, applying an asymmetric NARDL approach, and providing a comparative analysis of China and India.
3. Methodology
3.1. Data Description
This study uses annual time-series data for China and India covering the period 1990–2023. All variables are obtained from internationally recognized and publicly accessible databases to ensure data reliability, comparability, and transparency. Specifically, CO2 emissions (metric tons per capita), energy consumption (kg of oil equivalent per capita), renewable energy consumption (% of total final energy consumption), GDP growth (annual percentage change in real GDP), and trade openness (sum of exports and imports as a percentage of GDP) are sourced from the World Bank (WDI).
The use of a time-series framework is appropriate given the country-specific focus of the analysis. It allows for capturing dynamic and asymmetric adjustment processes within each economy, which may be obscured in a panel setting due to cross-country heterogeneity.
Technological innovation is proxied by the number of patent applications (residents), which is also retrieved from the World Bank, ensuring consistency across variables and countries. Where necessary, missing observations were cross-checked and complemented using data from the International Energy Agency and the OECD to maintain data continuity and accuracy.
Variables (CO2 emissions, energy use, trade openness, and patent applications) are transformed into natural logarithms to reduce heteroskedasticity and allow elasticity interpretation. GDP growth is retained in its original form as it represents a rate of change and includes negative values. Renewable energy consumption, expressed as a percentage, is also kept in levels to preserve interpretability.
To ensure consistency and robustness, several data processing steps are applied. Variables expressed in levels—such as CO2 emissions, energy use, trade openness, and patent applications—are transformed into natural logarithms to reduce heteroskedasticity and allow for elasticity-based interpretation of the estimated coefficients. GDP growth is retained in its original form, as it is already expressed as a rate of change and includes both positive and negative values. Renewable energy consumption, expressed as a percentage, is also kept in levels to preserve interpretability.
All variables are aligned temporally and converted into a consistent annual frequency over the period 1990–2023. Prior to estimation, the dataset is examined through descriptive statistics and correlation analysis to identify potential outliers, inconsistencies, and multicollinearity issues, ensuring its suitability for econometric analysis.
Table 1 summarizes the variables, definitions and measurement units.
3.2. Justification for Country Selection: China and India
In examining cross-country asymmetric dynamics, the selection of China and India is grounded in their pronounced structural variability and distinct energy–economic trajectories.
China—High Structural Transformation and Energy Transition
China represents the world’s largest CO2 emitter and has undergone profound structural and energy transitions over the past three decades. These include significant shifts in the national energy mix as the country moves from coal dominance toward large-scale renewable deployment, rapid urbanization, industrial upgrading, and strong export-driven growth cycles. China has also experienced substantial gains in innovation capacity, particularly in green technologies, generating pronounced fluctuations in energy intensity and emissions. These features create strong asymmetric responses to economic and energy shocks, making China particularly suitable for nonlinear modeling.
India—High-Growth, Demand-Driven System
India, the world’s third-largest energy consumer, is characterized by rapidly increasing energy demand driven by economic expansion and population growth. Its continued reliance on coal, combined with gradual renewable energy adoption, generates significant variability in energy-related emissions. India also exhibits strong cyclical fluctuations in GDP growth, with differing impacts on environmental pressure across expansionary and contractionary phases. Institutional and infrastructural constraints further contribute to nonlinear and asymmetric adjustment processes.
Taken together, the contrasting yet dynamic characteristics of China and India provide a robust comparative framework for identifying asymmetric environmental responses. While both countries share features of large emerging economies, their structural differences in energy composition, development stage, and technological capacity strengthen the analytical relevance of this comparative design.
3.3. Econometric Model
3.3.1. Model Framework
To examine the asymmetric relationships between economic growth, energy structure, trade openness, innovation, and CO
2 emissions in China and India, this study employs the Nonlinear Autoregressive Distributed Lag (NARDL) model developed by Shin et al. (2014) [
25]. Unlike conventional ARDL models, NARDL decomposes each explanatory variable into positive and negative partial sums, allowing for distinct effects in both magnitude and direction and capturing nonlinear adjustment dynamics.
For clarity, CO2 emissions are specified as the dependent variable, while GDP growth (GDPG), renewable energy (REN), energy use (ENE), trade openness (TRD), and innovation (PATR) enter as explanatory variables. Each regressor is decomposed into positive and negative changes to capture potential asymmetries. The model simultaneously estimates long-run equilibrium relationships and short-run dynamic adjustments within a unified error-correction framework.
In addition, a standard Autoregressive Distributed Lag (ARDL) model is estimated as a benchmark specification. The ARDL framework allows the simultaneous estimation of short-run dynamics and long-run relationships within a unified reduced-form equation, providing a useful baseline for comparison with the nonlinear NARDL results.
The baseline asymmetric long-run specification is expressed as:
where
- •
and represent partial sum decompositions of positive and negative changes in GDP growth, renewable energy, energy use, trade openness, and patent applications.
- •
The partial sums enable both long-run and short-run asymmetry to be modeled within a unified framework.
In the error-correction form:
where
captures the deviation from long-run equilibrium and the speed at which the system adjusts back.
3.3.2. Model Selection and Lag Structure
The optimal lag length for each country-specific NARDL model is selected using standard information criteria, primarily the Akaike Information Criterion (AIC) and the Schwarz Bayesian Criterion (SIC). Given the relatively small sample size and time-series nature of the data, priority is given to AIC, which is more efficient in capturing dynamic structures in finite samples (Pesaran et al., 2001 [
32]).
Importantly, lag structures are selected separately for China and India rather than being imposed uniformly. This is essential because the two economies exhibit fundamentally different dynamic adjustment processes, particularly in terms of energy consumption patterns, economic cycles, and technological development. As a result, allowing country-specific lag selection ensures that the estimated models accurately reflect the underlying data-generating processes and avoid potential misspecification bias.
However, for comparability and robustness, the maximum lag order is restricted to a common upper bound across both countries, ensuring consistency while preserving model flexibility.
3.3.3. Partial Sum Decomposition
Each explanatory variable is decomposed into positive and negative changes following the NARDL framework (Shin et al., 2014 [
25]). This allows the estimation of:
This allows the model to estimate:
- •
Long-run positive effects ()
- •
Long-run negative effects ()
- •
Short-run positive effects ()
- •
Short-run negative effects ()
Asymmetry is tested using Wald tests for:
- •
Long-run asymmetry:
- •
Short-run asymmetry:
3.3.4. Estimation Procedure
The NARDL estimation follows these steps:
Step 0—Estimation of the ARDL Benchmark Model (NEW)
Before estimating the nonlinear specification, a standard ARDL model is estimated as a benchmark. The general ARDL
specification is defined as:
This model is reparameterized into an error correction representation to distinguish between short-run and long-run effects. The error correction term captures the speed of adjustment toward long-run equilibrium and is expected to be negative and statistically significant.
The ARDL model serves as a baseline against which the nonlinear NARDL specification is evaluated, allowing assessment of whether asymmetry provides additional explanatory power.
Step 1—Unit Root Testing
Although NARDL allows a mixture of I(0) and I(1) variables, none may be I(2). ADF tests are therefore applied to verify that all series satisfy this requirement.
Step 2—Bounds Testing for Cointegration
The existence of a long-run relationship is tested using the bounds testing approach (Pesaran et al., 2001 [
32]).
Step 3—Long-Run and Short-Run Estimation
The model simultaneously estimates:
- •
Long-run asymmetric effects ()
- •
Short-run asymmetric effects ()
- •
Speed of adjustment term ()
Step 4—Dynamic Multiplier Analysis
Dynamic multipliers trace the gradual adjustment path after a positive or negative shock:
These functions illustrate how CO2 emissions respond over time to asymmetric shocks in the explanatory variables.
Step 5—Robustness Checks
To test whether asymmetry matters, a symmetric ARDL is estimated:
Comparing symmetric and asymmetric specifications provides a formal validation of the NARDL approach and ensures that identified nonlinearities are not spurious but reflect genuine asymmetric adjustment processes.
This comparison between ARDL and NARDL models also enhances model interpretability by distinguishing between linear and nonlinear adjustment mechanisms in emissions dynamics.
3.3.5. Diagnostic and Specification Tests
Before interpreting the NARDL estimates, it is essential to verify that the underlying statistical assumptions of the model are satisfied. To do so, a full set of diagnostic and specification tests is conducted on each country-specific model. Serial correlation in the residuals is examined using the Breusch–Godfrey LM test, while heteroskedasticity is assessed through both the White test and the Breusch–Pagan/Cook–Weisberg test. Normality of the residuals is checked using the Shapiro–Wilk test, and additional stability diagnostics, including residual autocorrelation checks and analysis of the lagged residual structure, are performed to assess model adequacy.
Where necessary, robust standard errors such as Newey–West corrections are applied to address potential violations of serial independence. These diagnostic procedures ensure that the NARDL estimations are statistically sound, free from major specification errors, and suitable for reliable inference regarding asymmetric long-run and short-run relationships.
3.3.6. Model Validity and Spurious Regression Considerations
To avoid spurious regression, the NARDL framework is applied to variables integrated of order I(0) and I(1), with cointegration verified using bounds testing. A negative and significant error-correction term confirms convergence to long-run equilibrium. Residual stationarity further supports model validity, ensuring that estimated relationships reflect meaningful economic linkages rather than spurious correlations.
Taken together, these procedures provide strong evidence that the estimated NARDL models are statistically valid, free from spurious regression bias, and robust to structural changes. This reinforces the credibility of the asymmetric long-run and short-run relationships identified in this study.
3.3.7. Model Validation and Econometric Justification
To ensure the reliability and validity of the proposed NARDL framework, several methodological conditions and diagnostic procedures are explicitly addressed.
First, the suitability of the NARDL model relies on the order of integration of the variables. The approach is valid when variables are integrated of order I(0) and/or I(1), but not I(2). This condition is verified using Augmented Dickey–Fuller (ADF) unit root tests, ensuring that all variables satisfy the required integration properties.
Second, the existence of a long-run equilibrium relationship is formally tested using the bounds testing procedure developed by Pesaran et al., (2001) [
32]. The rejection of the null hypothesis of no cointegration confirms that the estimated relationships are not spurious and that the model captures meaningful long-run dynamics.
Third, the validity of the asymmetric specification is assessed by comparing the NARDL model with a conventional symmetric ARDL framework. This comparison allows evaluation of whether decomposing variables into positive and negative components provides additional explanatory power. The use of Wald tests further confirms the presence of statistically significant asymmetries in both the long run and short run.
Fourth, model adequacy is verified through a comprehensive set of diagnostic tests, including checks for serial correlation (Breusch–Godfrey test), heteroskedasticity (White and Breusch–Pagan tests), and residual normality (Shapiro–Wilk test). Where necessary, Newey–West heteroskedasticity and autocorrelation consistent (HAC) standard errors are employed to ensure robust statistical inference.
Finally, the inclusion of dynamic multipliers provides an additional layer of validation by illustrating the adjustment path of CO2 emissions following positive and negative shocks. This dynamic analysis confirms the stability and economic interpretability of the estimated relationships over time.
Taken together, these procedures ensure that the proposed NARDL model is econometrically valid, robust, and appropriate for capturing asymmetric environmental dynamics in China and India.
Endogeneity Considerations
Endogeneity represents a potential concern in this analysis, as several explanatory variables—particularly economic growth, energy consumption, and trade openness—may exhibit bidirectional relationships with CO2 emissions. For instance, while economic growth can increase emissions through higher energy demand, environmental degradation may in turn influence growth through regulatory constraints, technological adaptation, or efficiency adjustments. Similarly, energy consumption and trade openness may both affect and respond to emissions dynamics, leading to potential reverse causality.
The NARDL framework partially mitigates endogeneity concerns through its dynamic specification. First, the inclusion of lagged dependent and independent variables reduces contemporaneous feedback effects by capturing temporal adjustments. Second, the error-correction representation separates long-run equilibrium relationships from short-run fluctuations, thereby limiting bias arising from omitted dynamic structure. Third, the bounds testing approach ensures that the estimated relationships reflect stable long-run associations rather than spurious correlations.
While these features enhance the robustness of the estimates, it is acknowledged that NARDL does not fully eliminate all sources of endogeneity. Therefore, the results should be interpreted with appropriate caution. Future research could extend the analysis by employing instrumental variable techniques, structural models, or dynamic panel estimators (e.g., GMM) to further address potential endogeneity issues.
The outcomes of these validation procedures are reported and discussed in
Section 4.
4. Results
This section presents empirical findings, beginning with an overview of the data characteristics.
4.1. Exploratory Data Analysis
4.1.1. Descriptive Statistics
To provide an initial overview of the dataset and understand the basic behavior of all variables employed in the analysis,
Table 2 presents the descriptive statistics.
The descriptive statistics reveal marked structural differences between China and India. China exhibits significantly higher CO2 emissions per capita, energy use, and innovation activity, consistent with its larger industrial base and advanced stage of economic transformation. Its higher variability in GDP growth and patents reflects periods of rapid expansion and policy-induced structural shifts. In contrast, India shows lower levels of emissions and energy consumption but greater volatility in economic growth, including negative output episodes, indicating stronger cyclical asymmetry. The narrower range of India’s renewable energy share suggests a more gradual and constrained transition. These patterns validate the presence of substantial asymmetric fluctuations in both countries, reinforcing their suitability for NARDL-based analysis.
4.1.2. Correlation Analysis
Table 3 reports the pairwise correlation coefficients among the variables to assess the strength and direction of their linear associations and to evaluate potential multicollinearity concerns before estimating the NARDL model.
Table 3 reports the pairwise correlation matrix for China and India. The results indicate the presence of relatively strong correlations among some variables, particularly between CO
2 emissions, energy use, renewable energy, and innovation. These high correlations are expected in macroeconomic time-series data, where variables often exhibit common trends associated with economic growth, industrialization, and structural transformation.
Importantly, high pairwise correlations do not necessarily imply harmful multicollinearity in a dynamic regression framework. The NARDL model incorporates lag structures and decomposes variables into positive and negative partial sums, which mitigates potential multicollinearity concerns. Furthermore, variance inflation factor (VIF) diagnostics (reported separately) confirm that multicollinearity does not pose a serious threat to the reliability of the estimated coefficients. Therefore, all variables are retained in the model to preserve theoretical consistency and capture the joint dynamics of the energy–environment system.
The observed correlations further justify the use of a nonlinear dynamic framework, as linear models may fail to disentangle these closely interrelated effects.
4.2. Pre-Estimation Diagnostics
The empirical results begin with a set of pre-estimation diagnostics to ensure the suitability of the data for NARDL modeling.
4.2.1. Unit Root Tests
To determine the order of integration,
Table 4 reports the results of ADF unit root tests.
The results indicate that, for both China and India, all variables except GDP growth are non-stationary in levels but become stationary after first differencing. CO2 emissions, renewable energy, energy use, trade openness, and patent applications are therefore integrated of order one, I(1), while GDP growth is I(0). This mixed integration order satisfies the requirements of the NARDL framework and supports its application.
4.2.2. Cointegration Analysis
To assess the existence of a long-run relationship,
Table 5 presents the NARDL bounds test results.
The results strongly reject the null hypothesis of no long-run relationship for both countries. The high F-statistics confirm stable cointegration between CO2 emissions and the explanatory variables. This validates the use of the ARDL/NARDL framework and supports the estimation of both long-run relationships and short-run adjustment dynamics.
4.3. NARDL Estimation
4.3.1. Long-Run and Short-Run Asymmetric Coefficients
Table 6 reports the estimated long-run and short-run asymmetric coefficients for China.
The results indicate a strong long-run adjustment mechanism, as shown by the negative and significant lagged CO2 term (L.CO2, p = 0.003), confirming convergence to equilibrium. In the long run, renewable energy exhibits asymmetric effects: positive shocks significantly reduce emissions (L.REN+), while negative shocks are insignificant. Energy use shows strong asymmetry, with increases significantly raising emissions (L.ENE+), whereas reductions do not generate proportional declines, reflecting structural dependence on energy-intensive production.
Innovation also displays asymmetric effects: positive patent shocks increase emissions (L.PATR+), while negative shocks have a larger adverse impact (L.PATR−), suggesting that contractions in innovation worsen environmental outcomes more than expansions improve them. However, this result should be interpreted with caution, as the patent-based proxy does not distinguish between environmentally clean and pollution-intensive innovations. Consequently, the estimated effect may partly reflect the composition of innovation, rather than purely structural technological progress. GDP and trade variables remain insignificant in the long run.
Short-run results reinforce these patterns. Positive shocks in renewable energy reduce emissions (ΔREN+), while increases in energy use strongly raise emissions (ΔENE+). Negative shocks in most variables are insignificant, indicating limited short-run gains from contractions. Overall, China’s emissions are driven by asymmetric responses to energy use, renewable energy expansion, and innovation.
The NARDL estimation results for India are presented in
Table 7.
For India, the lagged CO2 term is negative and weakly significant (L.CO2, p = 0.072), indicating a slower adjustment toward equilibrium. Long-run coefficients are largely insignificant across all variables, including GDP, renewable energy, energy use, trade, and innovation, suggesting the absence of stable long-run asymmetric relationships.
Short-run dynamics are more informative. The only robust effect is the strong positive impact of energy-use increases on emissions (ΔENE+, p < 0.001), indicating that short-term energy demand drives emissions. Negative shocks and other variables remain insignificant, highlighting weak short-run adjustment outside energy demand. Overall, India’s emissions are primarily influenced by short-run fluctuations rather than structural long-run factors.
Comparatively, China exhibits strong and significant long-run asymmetries, reflecting its ongoing structural transformation and energy transition. In contrast, India shows weak long-run relationships, with emissions driven mainly by short-run energy demand. This divergence highlights different stages of energy transition and policy capacity between the two economies.
4.3.2. Diagnostic Tests
To ensure the robustness and reliability of the NARDL estimates,
Table 8 summarizes the key diagnostic tests results.
The diagnostic results indicate that heteroskedasticity and normality assumptions are satisfied for both China and India. However, the Breusch–Godfrey test reveals the presence of residual autocorrelation, suggesting that the standard error estimates from the baseline NARDL specification may be inefficient. To address this issue, Newey–West heteroskedasticity and autocorrelation consistent (HAC) standard errors are employed. This correction does not alter the estimated coefficients but provides robust inference by adjusting the variance–covariance matrix.
Importantly, the presence of autocorrelation does not invalidate the estimated long-run relationships or the cointegration results, as these depend on the consistency of the parameter estimates rather than the efficiency of the standard errors. The Newey–West corrected results are therefore used as the preferred basis for statistical inference, while the original estimates are retained for comparison.
Finally, residual dependence is further examined using lagged residual diagnostics (reported as residual persistence checks), confirming that the dynamic specification adequately captures the underlying adjustment process after correction.
4.3.3. Robust NARDL–Newey–West Estimates
Table 9 presents the Newey–West corrected results for China.
The robust estimates confirm previous findings. The lagged CO2 term remains negative and significant, indicating stable long-run adjustment. Positive energy-use shocks continue to increase emissions, while innovation retains asymmetric effects. Renewable energy remains beneficial, although its significance weakens slightly. Short-run dynamics are unchanged, with energy-use increases exerting the strongest effect. These results confirm the robustness of China’s asymmetric emission dynamics.
The NARDL model results with Newey–West standard errors for India are presented in
Table 10.
The results confirm that India’s emissions are dominated by short-run dynamics. Although the error-correction term becomes significant, most long-run coefficients remain insignificant. Short-run energy-use increases continue to raise emissions, while other variables have no significant effects. This reinforces the conclusion that India’s emissions are driven primarily by short-term energy demand rather than structural factors.
4.3.4. Wald Tests for Long-Run and Short-Run Asymmetry
To formally test whether positive and negative shocks exert statistically different effects,
Table 11 includes the Wald tests for long-run and short-run asymmetry.
The Wald test results reveal important structural differences, but also notable similarities, in the asymmetric adjustment mechanisms of CO2 emissions between China and India.
For China, there is clear evidence of both long-run and short-run asymmetry, particularly in innovation (PATR) and energy use (ENE). Long-run innovation asymmetry (p = 0.0467) indicates that increases and decreases in patent activity exert significantly different long-term effects on emissions, reflecting the direction-sensitive role of technological change in a structurally transforming economy. In addition, short-run asymmetry in both innovation (p = 0.0137) and energy use (p = 0.0394) highlights the immediate responsiveness of emissions to directional shocks in technological activity and energy demand.
In contrast to earlier expectations, the results for India also provide meaningful evidence of asymmetry, although in different channels. Specifically, renewable energy (REN) and energy use (ENE) exhibit statistically significant long-run asymmetry (p = 0.0451 and p = 0.0165, respectively), indicating that increases and decreases in these variables have unequal long-term effects on emissions. This suggests that even in a relatively less advanced energy system, directional changes in energy structure can produce asymmetric environmental outcomes. Furthermore, short-run asymmetry is observed in trade openness (TRD) (p = 0.0366), implying that expansions and contractions in trade have different immediate impacts on emissions, likely reflecting composition and scale effects in India’s trade structure.
These results challenge the notion of a predominantly symmetric emissions system in India and instead point to the presence of selective asymmetry, particularly concentrated in energy and trade-related channels.
These findings indicate that asymmetry is not exclusive to structurally advanced economies such as China but can also emerge in specific sectors within developing economies like India. However, the scope and intensity of asymmetry differ markedly between the two countries. In China, asymmetry is broad-based and strongly linked to innovation and energy dynamics, reflecting deep structural transformation and technological maturity. In India, asymmetry is more selective and sector-specific, remaining largely confined to energy structure and trade dynamics, which reflects its earlier stage of structural and technological development.
Overall, the results highlight that the relevance of asymmetry is context-dependent rather than universal. The NARDL framework proves particularly valuable in this context, as it allows for the identification of both the presence and the location of asymmetric effects across different variables and countries. This strengthens the contribution of the study by demonstrating that emissions dynamics are shaped not only by the magnitude of economic and energy shocks, but also by their direction and the structural characteristics of each economy.
4.3.5. Short-Run and Long-Run Asymmetric Effects on CO2
To illustrate the differential effects of positive and negative shocks,
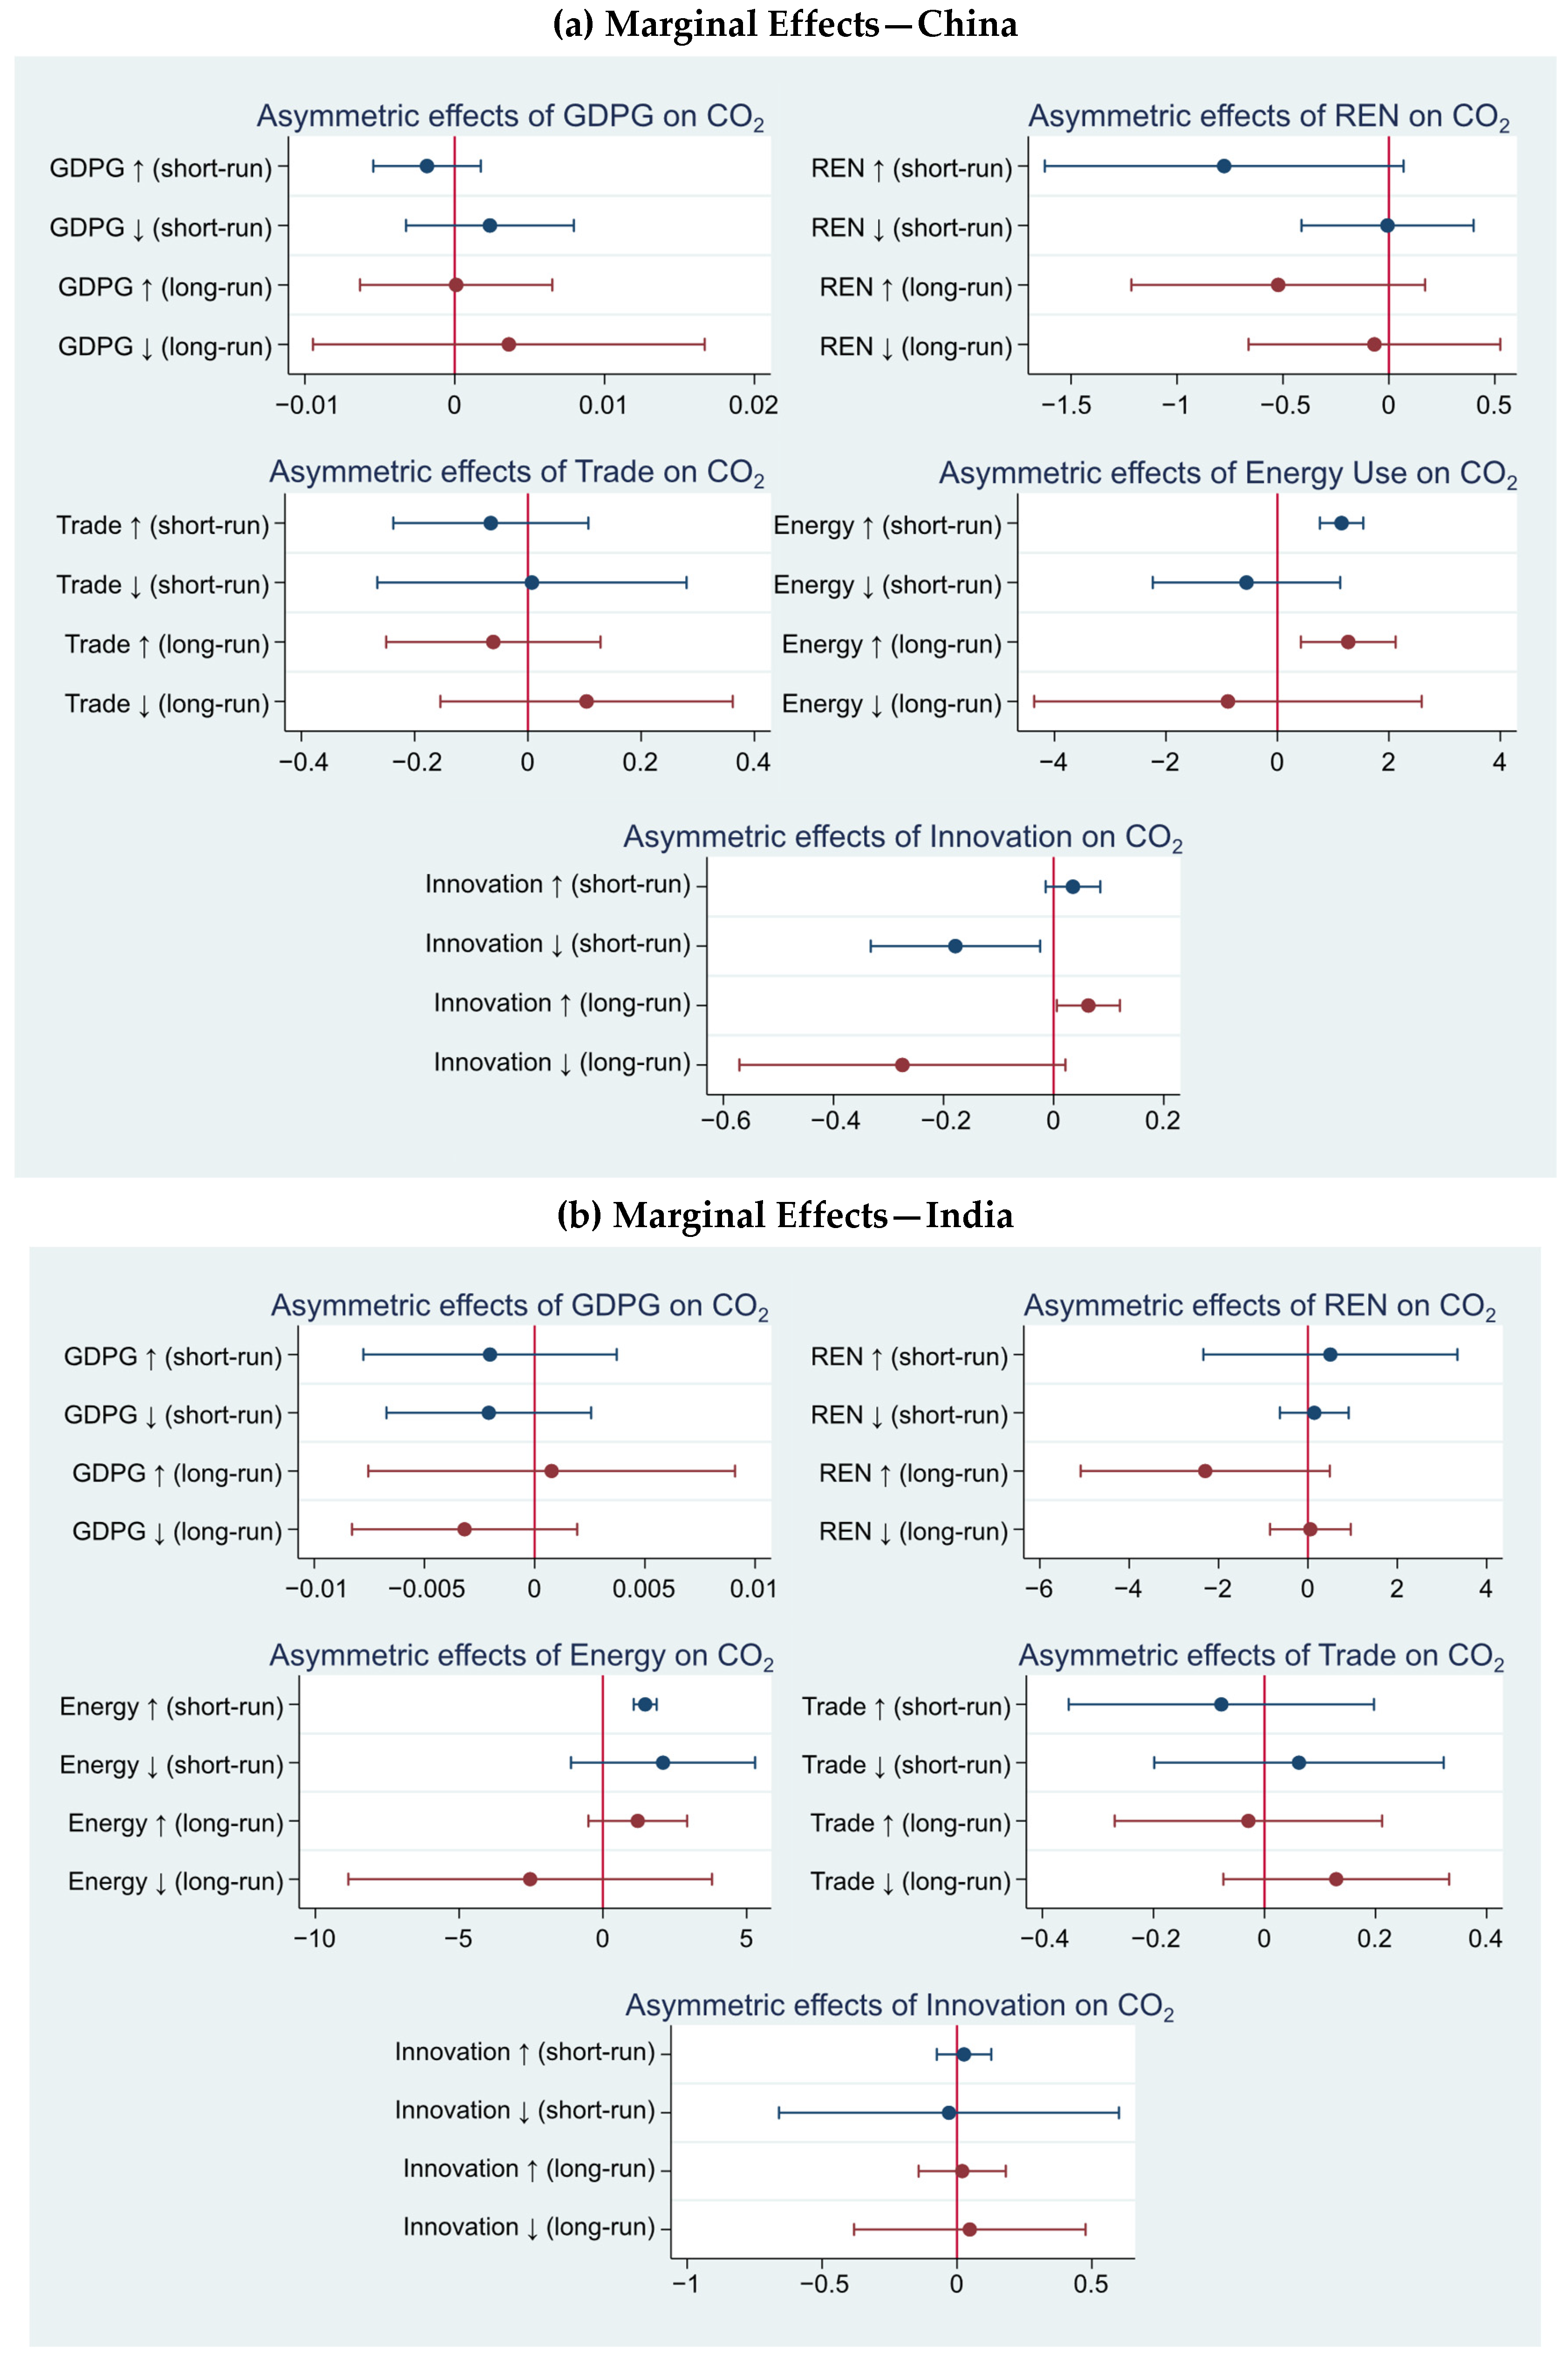
Figure 1 presents the short- and long-run asymmetric marginal effects derived from the NARDL estimates.
The plots reveal clear contrasts between China and India. In China, strong asymmetries are observed, particularly for energy use and innovation: positive shocks increase emissions, while negative shocks generate disproportionate or limited responses, indicating structural nonlinearity. Renewable energy also exhibits asymmetry, with positive shocks reducing emissions more effectively than negative shocks increase them. In contrast, GDP growth and trade openness show largely symmetric and insignificant effects.
For India, the results display mostly symmetric patterns, with confidence intervals centered around zero. Energy use remains the primary driver of emissions, although its positive and negative shocks produce more balanced effects than in China. Renewable energy and innovation show weak or insignificant asymmetries, reflecting a demand-driven emissions structure with limited technological influence.
Overall, China exhibits strong structural asymmetries driven by energy and innovation dynamics, whereas India’s emissions respond more symmetrically and are primarily influenced by energy demand.
4.3.6. Dynamic Multipliers of Positive Shocks in China and India
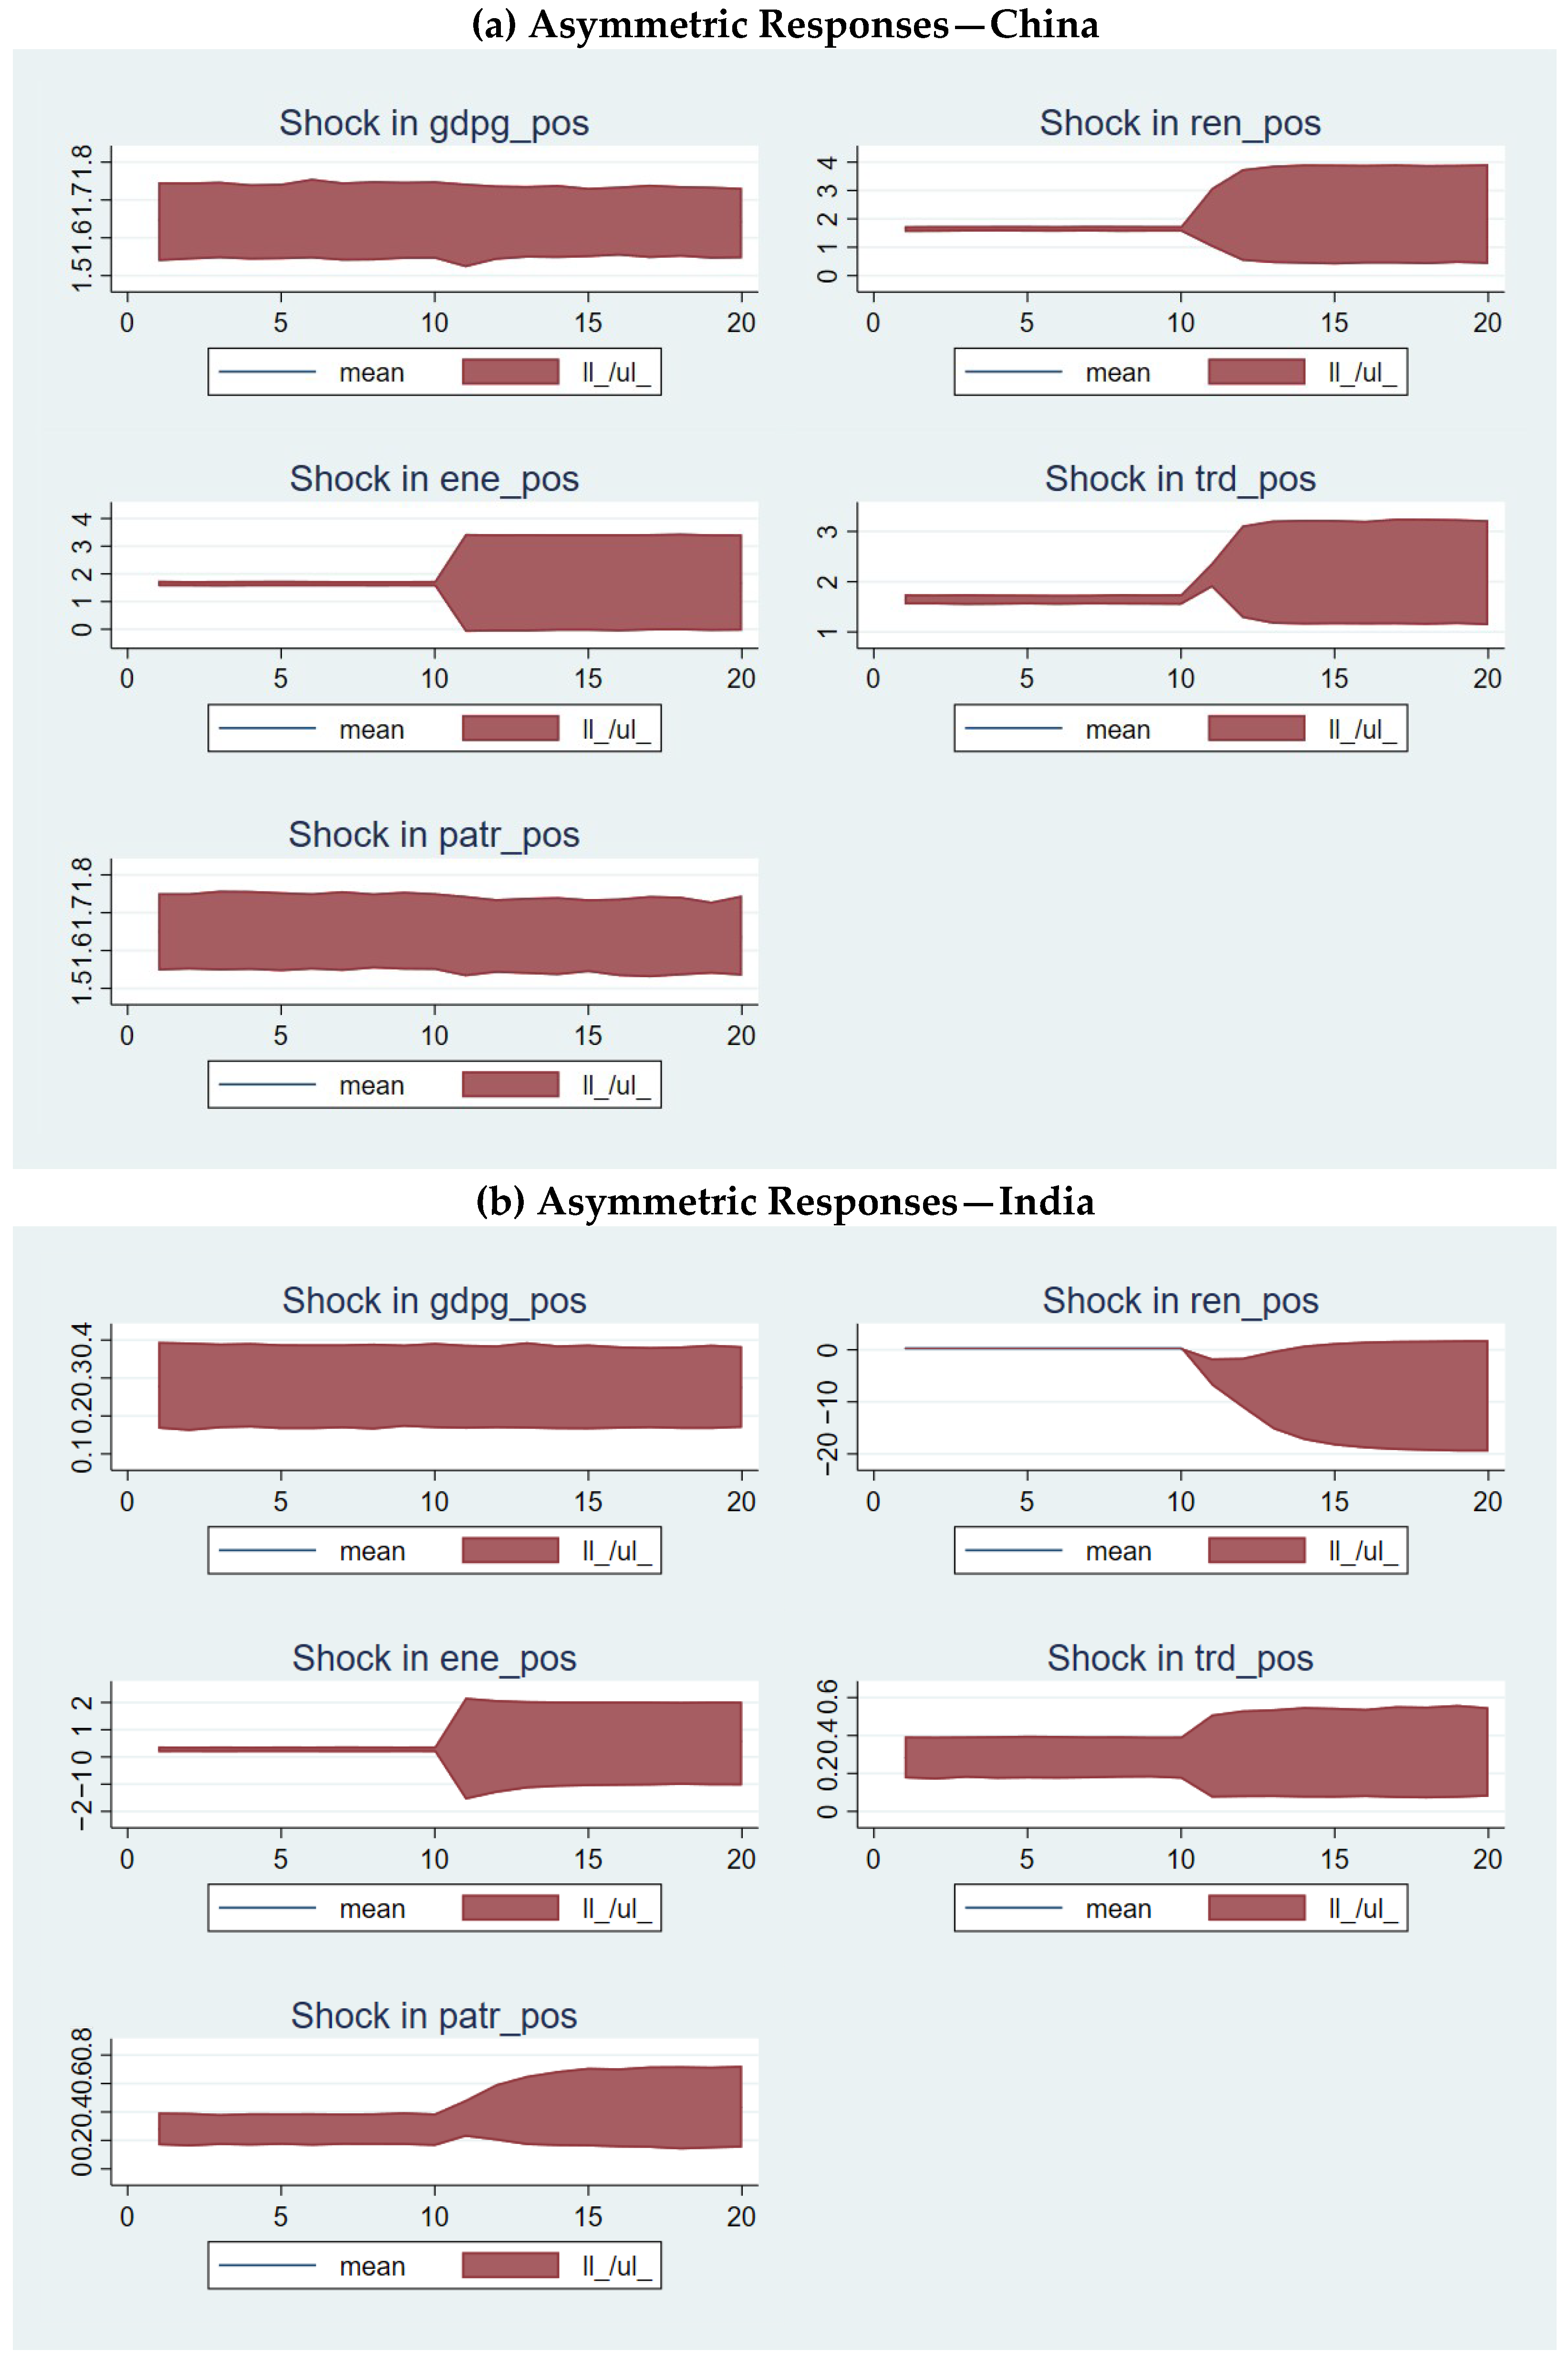
To further analyze the dynamic adjustment path of CO
2 emissions following positive and negative shocks,
Figure 2 presents the impulse response functions.
The dynamic multipliers provide deeper insight into the temporal adjustment process of CO2 emissions following positive shocks, particularly in terms of convergence speed, persistence, and potential overshooting behavior. In China, energy-use shocks produce the strongest and most persistent increases in emissions, with adjustment paths exhibiting slow convergence toward the long-run equilibrium. The length of shock persistence is notably high, indicating that energy-related disturbances generate prolonged environmental effects, consistent with China’s energy-intensive industrial structure. In some cases, the adjustment path displays mild overshooting behavior, where emissions temporarily exceed their long-run equilibrium level before gradually stabilizing, reflecting adjustment frictions and delayed policy or technological responses.
Renewable energy shocks in China show a gradual but sustained negative impact on emissions, with a relatively long convergence horizon. This indicates that the environmental benefits of renewable energy materialize progressively over time rather than instantaneously, highlighting the importance of long-run structural transformation. Innovation shocks exhibit moderate persistence, with small but lasting effects on emissions, suggesting that technological changes operate through cumulative and path-dependent mechanisms. By contrast, GDP and trade shocks show low persistence and rapid convergence, indicating limited dynamic propagation within the emissions system.
In India, the dynamic multipliers reveal a markedly different adjustment pattern characterized by faster convergence and limited persistence. Energy-use shocks still generate positive emission responses; however, the duration of these effects is relatively short, indicating a lower shock persistence length compared to China. The adjustment paths converge quickly to equilibrium without evidence of overshooting, suggesting a more flexible but less structurally embedded emissions system. Renewable energy, GDP, trade, and innovation shocks exhibit negligible persistence and minimal dynamic effects, reinforcing the conclusion that India’s emissions are primarily driven by short-run demand fluctuations rather than long-run structural dynamics.
Overall, the comparison highlights that China’s emissions system is characterized by slow adjustment, high persistence, and occasional overshooting behavior, reflecting deep structural rigidities and ongoing energy transition processes. In contrast, India exhibits rapid convergence, low persistence, and largely symmetric adjustment paths, consistent with an emissions system dominated by short-run energy demand rather than structural transformation.
4.4. Robustness Check: Symmetric ARDL Model
To assess robustness,
Table 12 reports the results of a symmetric ARDL model. Comparing these estimates with the NARDL results allows evaluation of whether the nonlinear specification provides additional explanatory power.
For China, the symmetric ARDL model shows high overall fit but limited significant relationships. Energy use remains the only strong and significant determinant of emissions, while renewable energy exhibits a modest short-run reduction effect. GDP growth, trade openness, and innovation are insignificant in both current and lagged terms. Importantly, the lagged CO2 coefficient is positive and statistically insignificant, indicating weak evidence of long-run adjustment under the symmetric specification.
In contrast to the NARDL results, the symmetric model fails to capture the asymmetric long-run and short-run effects identified for energy use, renewable energy, and innovation. This suggests that China’s emissions dynamics cannot be adequately represented by a uniform response structure, and that nonlinear modeling provides additional explanatory power.
Table 13 presents the results of the symmetric ARDL model for India.
For India, the model also exhibits good overall fit but identifies few significant relationships. Energy use remains the dominant driver, with a strong positive short-run effect. Trade openness shows a short-run emission-increasing impact, while innovation is significant only in its lagged form, suggesting delayed effects. GDP growth and renewable energy are insignificant. As in the case of China, the lagged CO2 term is statistically insignificant, indicating weak long-run adjustment and the absence of a stable equilibrium relationship under the symmetric specification.
Overall, the symmetric ARDL model primarily captures short-run dynamics and fails to distinguish between positive and negative shocks. As a result, it masks important nonlinearities in emissions behavior. In contrast, the NARDL framework uncovers richer and more consistent dynamics, confirming that emissions adjustment in both China and India is better characterized by asymmetric and nonlinear processes.
5. Discussion
The findings reveal substantial cross-country differences in the asymmetric determinants of CO2 emissions between China and India, reflecting deeper structural divergences in economic systems, energy composition, and stages of development. China exhibits strong and persistent asymmetries in both the long and short run, whereas India’s emissions appear less uniformly asymmetric and instead exhibit selective asymmetry, particularly in energy consumption and renewable energy dynamics. Importantly, these results should be interpreted as asymmetric associations rather than causal effects, given the nature of the NARDL framework.
5.1. Asymmetry in China’s Energy–Environment Relationship
In China, the strong positive effect of energy-use shocks on emissions, combined with weak mitigating effects of negative shocks, is consistent with structural rigidity in an energy-intensive system. Capital lock-in and coal dependence limit downward adjustment, so increases in energy demand are closely associated with higher emissions, while reductions yield limited environmental gains (Zhang & Cheng, 2009 [
7]).
Renewable energy is strongly associated with long-run asymmetry, as positive shocks significantly reduce emissions, whereas negative shocks have minimal impact. This suggests that renewable energy becomes effective only after reaching a critical scale supported by policy and investment, consistent with recent evidence on China’s energy transition (Sohaib et al. [
14], 2025; Wu et al., 2025 [
4]).
This asymmetric pattern appears to reflect the maturity and structural integration of China’s innovation system. At advanced stages of development, innovation is closely embedded in industrial upgrading and green technology deployment (e.g., electrification, energy efficiency, and renewable integration). As a result, continuous innovation is required to sustain efficiency gains, and any disruption in R&D activity immediately slows technological diffusion and reinforces dependence on existing energy-intensive production systems.
In contrast, positive innovation shocks do not generate equally strong emission reductions in the short run because they often coincide with scale expansion and increased energy demand, particularly in manufacturing and infrastructure-intensive sectors. This “transition effect” suggests that the environmental benefits of innovation may be delayed and depend on the effective implementation and diffusion of green technologies.
Moreover, China’s industrial structure—characterized by a large share of heavy industry—appears to amplify this asymmetry. Innovation plays a critical role in reducing energy intensity in these sectors; therefore, negative shocks to innovation are associated with disproportionately larger environmental consequences compared to the incremental gains from innovation expansion.
Nevertheless, this interpretation should be treated with caution. The proxy used for innovation (patent applications) does not distinguish between environmentally beneficial (green) and pollution-intensive (brown) technologies. In the context of China, where patent growth has historically included both clean energy innovations and fossil-fuel-related technologies, part of the observed positive impact may reflect this composition effect rather than purely structural technological transformation.
This interpretation aligns with directed technical change theory (Popp et al., 2010, [
3]) and empirical findings on nonlinear eco-innovation effects (Bergougui et al., 2025 [
23]; Wang et al., 2023 [
22]).
These findings are consistent with recent studies showing that structural and technological factors—such as innovation capacity, digitalization, and financial development—play a central role in shaping energy transition dynamics in China (Xu et al., 2026 [
6]; Zhao et al., 2026 [
5]). Overall, China’s emissions appear increasingly linked to structural and policy-induced transformation rather than purely short-run fluctuations.
5.2. India’s Demand-Driven Emissions Structure
In contrast, India’s emissions system does not exhibit uniformly strong asymmetry across all variables. Neither GDP, trade, nor innovation shows statistically significant long-run asymmetric associations, while short-run dynamics are dominated by energy consumption.
However, renewable energy and energy consumption display statistically significant asymmetric associations, indicating that energy-related variables play a central role in shaping nonlinear emissions dynamics.
This is consistent with India’s earlier stage of structural transformation. Emissions are closely linked to contemporaneous energy demand, with limited influence from technological or structural factors. Fossil fuels remain dominant, and renewable penetration is insufficient to produce persistent environmental effects (Sharma, 2011 [
8]; Apergis & Ozturk, 2015 [
2]; Kumar et al., 2022 [
13]).
The absence of innovation asymmetry further highlights the limited role of R&D and technological diffusion (Zhang et al., 2025 [
24]). This can be explained by the relatively low maturity of India’s innovation system and the weak transmission mechanisms between innovation, industrial structure, and energy systems. Unlike China, innovation in India is less embedded in large-scale industrial transformation and remains constrained by institutional, financial, and infrastructural factors. As a result, changes in patent activity are not strongly associated with measurable environmental effects, and emissions remain primarily driven by energy demand rather than technological progress.
Therefore, India’s emissions dynamics are better characterized by selective asymmetric associations, concentrated primarily in energy-related channels, rather than a fully symmetric adjustment process.
These findings are consistent with recent literature emphasizing that the environmental impact of trade, innovation, and energy transition depends critically on institutional capacity and policy frameworks (Soto et al., 2025 [
19]; Wu et al., 2025 [
4]).
5.3. Dynamic Adjustment Differences
Dynamic multiplier analysis reinforces these contrasts. China exhibits persistent and long-lasting adjustment patterns following shocks, reflecting strong interconnections between industrial, energy, and technological systems (Shahbaz et al., 2016 [
20]; Tang et al., 2025 [
33]). In contrast, India’s responses are relatively short-lived and converge more rapidly, indicating weaker structural embeddedness (Kumar et al., 2022 [
13]).
These differences suggest that in China, shocks propagate through more complex structural channels, whereas in India, emissions are more closely linked to short-term demand fluctuations.
5.4. Comparative Synthesis and Policy Implications
The comparison highlights fundamental structural differences. China exhibits broad and persistent asymmetric associations driven by renewable energy, innovation, and energy use, whereas India shows more limited and selective asymmetry, with emissions largely influenced by short-run energy demand.
Importantly, the symmetric ARDL model provides weaker evidence of long-run adjustment, as indicated by the insignificant lagged CO2 term and the limited number of significant coefficients. This suggests that the linear specification primarily captures short-run dynamics and does not fully reflect the underlying adjustment process. In contrast, the NARDL framework uncovers richer and more consistent long-run relationships, indicating that emissions dynamics are better characterized by nonlinear and asymmetric associations rather than uniform responses.
These findings confirm that environmental dynamics are inherently nonlinear and context-dependent, particularly in economies undergoing structural transformation (Bergougui et al., 2025 [
23]; Zhao et al., 2026 [
5]). They also reinforce that renewable energy and innovation are more effective when supported by strong institutional and policy frameworks (Wu et al., 2025 [
4]; Xu et al., 2026 [
6]).
From a policy perspective, a one-size-fits-all approach is inappropriate. The findings suggest that China may benefit from policies that reinforce structural transformation, including clean innovation, renewable integration, and industrial energy efficiency, while India may benefit from strengthening foundational conditions, including renewable infrastructure, institutional capacity, and technological development.
Importantly, the contrasting results on innovation imply that policy effectiveness depends on the maturity of national innovation systems. In China, policies may focus on sustaining green innovation and improving technology diffusion, whereas in India, policy efforts may prioritize strengthening innovation capacity and its linkage with clean energy deployment.
5.5. Implications for EKC and Structural Transition Theory
The findings provide important insights into the Environmental Kuznets Curve (EKC). China’s nonlinear and asymmetric responses suggest that structural transformation is associated with deviations from traditional EKC patterns (Grossman & Krueger, 1995 [
1]). In contrast, India’s symmetric behavior indicates it has not yet reached the turning point (Sharma, 2011 [
8]; Apergis & Ozturk, 2015 [
2]).
More broadly, the results suggest that the EKC should be interpreted as a conditional and dynamic relationship, shaped by structural capabilities, technological progress, and institutional effectiveness rather than a universal law.
6. Conclusions
This study examined the asymmetric effects of economic growth, energy consumption, renewable energy, trade openness, and innovation on CO2 emissions in China and India over the period 1990–2023 using the NARDL framework. By decomposing variables into positive and negative shocks, the analysis provides a more nuanced understanding of how emissions respond to structural and cyclical changes, revealing significant cross-country differences in the nature and persistence of asymmetric dynamics.
The results show that China exhibits strong and persistent asymmetries in both the long and short run, particularly in energy use, renewable energy, and innovation. Energy consumption increases emissions significantly, while renewable energy and innovation generate asymmetric adjustment effects consistent with an ongoing structural transition. These findings indicate that China’s emissions are increasingly shaped by long-run technological and policy-driven transformations.
The results show that China exhibits strong and persistent asymmetries in both the long and short run, particularly in energy use, renewable energy, and innovation. Energy consumption increases emissions significantly, while renewable energy and innovation generate asymmetric adjustment effects consistent with an ongoing structural transition. However, the interpretation of innovation effects should be treated with caution, as the proxy used (patent applications) does not distinguish between environmentally “clean” and “dirty” technologies, potentially introducing measurement bias. These findings indicate that China’s emissions are increasingly shaped by long-run technological and policy-driven transformations.
India’s emissions remain largely demand-driven but exhibit selective asymmetric effects, particularly in energy consumption and renewable energy, indicating early-stage structural transition.
Overall, the comparison highlights that China and India are at different stages of environmental and structural transformation. While both countries share characteristics of large emerging economies, they differ significantly in economic scale, income levels, industrial structure, energy composition, and stages of industrialization and urbanization, which justifies their comparative analysis. Asymmetry appears to deepen with technological advancement and energy transition, evolving from sector-specific effects to system-wide dynamics, as observed in China.
These findings have important policy implications. China should prioritize policies that reinforce structural transformation, including clean innovation, renewable integration, and industrial energy efficiency. In particular, policy design should differentiate between short-run and long-run effects. In the short run, stricter energy efficiency standards and carbon pricing mechanisms should be implemented to mitigate the strong emission-increasing effects of energy-use shocks. In the long run, sustained public and private investment in green innovation—particularly in energy-efficient industrial technologies—should be prioritized to accelerate structural decarbonization.
Given the asymmetric role of innovation, policies should focus not only on promoting innovation expansion but also on preventing disruptions in R&D activity. This includes stabilizing funding for green research, strengthening innovation ecosystems, and facilitating technology diffusion across sectors. Targeted support for heavy industries is particularly important, as these sectors exhibit strong energy inertia and contribute disproportionately to emissions.
In contrast, India should focus on building the foundations of transition through expanding renewable capacity, reducing coal dependence, strengthening infrastructure, and enhancing technological capabilities. In the short run, policies should address demand-driven emissions by improving energy efficiency in rapidly growing sectors such as transport and urban infrastructure. In the long run, accelerating renewable energy deployment and improving grid integration are critical to reducing structural dependence on fossil fuels.
Furthermore, institutional strengthening is essential in India to enhance the effectiveness of environmental and energy policies. This includes improving regulatory enforcement, promoting private sector participation in clean energy investment, and enhancing access to green finance.
More broadly, the results demonstrate that climate policies must be country-specific and aligned with structural conditions rather than relying on uniform strategies. The presence of asymmetric effects also implies that policy responses should be state-dependent: expansionary and contractionary phases require different policy tools. For example, during periods of economic expansion, stricter environmental regulations may be necessary, while during downturns, supporting green innovation becomes critical to avoid long-term environmental setbacks.
However, the scope of the study is limited to two economies, which may constrain the generalizability of the results. Expanding the analysis to include countries at different levels of development could provide broader insights into asymmetric environmental dynamics. In this context, panel data approaches may offer complementary advantages by capturing cross-country heterogeneity and increasing statistical power.
Furthermore, both China and India exhibit substantial regional disparities in economic development, industrialization, and energy use. The reliance on aggregate national data may therefore mask important within-country heterogeneity. Future research could address this limitation by using regional or state-level data to better capture subnational dynamics.
While the NARDL framework provides a flexible approach for capturing asymmetric relationships, its applicability to other countries should be interpreted with caution. The estimated results are inherently context-specific and depend on country-level structural characteristics such as energy composition, institutional capacity, and the stage of economic development.
In addition, several methodological limitations should be noted. First, the use of annual data and a relatively small sample size may limit the ability to capture short-term dynamics and structural changes. Second, the omission of potentially relevant variables—such as environmental regulation, energy pricing, and institutional quality—may influence the estimated relationships. Third, the proxy for innovation (patent applications) does not distinguish between environmentally “clean” and “dirty” technologies, which may bias the interpretation of innovation effects, particularly in China. Finally, although the NARDL framework captures asymmetric associations, it does not establish causal relationships, and potential endogeneity (e.g., between innovation and emissions) cannot be fully ruled out.
Future research could address these limitations by incorporating disaggregated indicators (e.g., green patents), testing for structural breaks, and applying causal identification approaches such as nonlinear Granger causality or instrumental variable methods.