Article

Floristic Diversity, Structure and Carbon Storage of a Sub-Andean Forest in Southwestern Colombia: The Case of the El Mangón


by
Luis Eduardo López-Vargas
1,*,
Diego Jesús Macías-Pinto
1,
Jhoy Fleming Córdoba-Calvo
1 and
Jorge Hernan Patiño Rodriguez
2
1
SACHAWAIRA Plant Diversity Research Group, GELA—Latin American Ethnobotanical Group, Department of Biology, Faculty of Natural, Exact Sciences and Education, Universidad del Cauca, Popayán 190003, Cauca, Colombia
2
Bogotá D.C. Biotechnology and Environment Research Group, Department of Biology, Faculty of Engineering, Administration and Basic Sciences, Universidad INCCA de Colombia, Bogotá 110110, Colombia
*
Author to whom correspondence should be addressed.
Biology 2026, 15(14), 1154; https://doi.org/10.3390/biology15141154
Submission received: 30 April 2026 / Revised: 25 June 2026 / Accepted: 29 June 2026 / Published: 15 July 2026
(This article belongs to the Section Ecology)

Simple Summary

Tropical mountain forests in the Colombian Andes are among the most species-rich places on Earth, yet many small forest patches that survive inside farmland have never been studied. We examined one such patch, called El Mangón, in southwestern Colombia: a forest of about 24 hectares that one family has protected since 1912. During eight months of fieldwork, we listed all the plants we could find and, in smaller measured plots, recorded the size and position of trees and shrubs to estimate how much carbon the vegetation stores above the ground. We found an unusually rich flora of 281 kinds of plants, including a remarkable number that grow perched on tree branches, together with mosses and lichens. The forest is still young and recovering, with many small stems and only a few tall trees, so the amount of carbon stored in its wood is modest. We also propose simple ways to rank species by how much carbon they hold and by how evenly that carbon is spread across the forest. Our results show that even small, privately protected forests can shelter exceptional plant diversity, and they support the local effort to declare El Mangón a protected nature reserve.

Abstract

Sub-Andean forests of the Colombian Central Cordillera are among the most biodiverse and threatened Neotropical ecosystems, yet their floristic composition, vegetation structure, and aboveground carbon storage remain poorly documented. We characterized the floristic diversity, vegetation structure, and aboveground carbon storage of the El Mangón sub-Andean forest remnant (24 ha; 1600–1700 m a.s.l., Cauca, Colombia) using general (non-systematic) collections across the total area and a structural inventory in five 50 × 4 m transects (498 individuals, 35 species). A total of 281 species, 209 genera, and 99 families were recorded; epiphytes represented 44.13% of species, exceeding typical values (25–35%) for this forest type. Diversity indices were intermediate (H′ = 2.55; DMg = 5.47; 1-D = 0.89). Palicourea crocea dominated structurally (IVI = 45.12), whereas aboveground carbon—re-estimated with the pantropical model (total = 72.85 Mg C ha−1)—was concentrated in a few large canopy trees (Alchornea latifolia, 32%; Myrsine guianensis, 16%), with P. crocea contributing only 3.6%. Three novel carbon indices (CVI, CCEI, CSI) integrate storage magnitude with capture efficiency and spatial stability; the CSI differed significantly among spatial-distribution groups (Kruskal–Wallis, p = 0.003), being higher in aggregated, large-stemmed species than in low-aggregation species. El Mangón ranks among the most diverse sub-Andean remnants documented to date in southwestern Colombia, underscoring its conservation priority in an increasingly fragmented landscape.

1. Introduction

Sub-Andean forests constitute one of the most biodiverse and threatened ecosystems in the Neotropics. Distributed between 1000 and 2400 m a.s.l. in Colombia, they harbor exceptional levels of species richness and endemism, function as biological corridors among altitudinal zones, and provide critical ecosystem services, including hydrological regulation, soil retention, and carbon storage [1,2]. In Colombia, these forests have lost more than 74% of their original cover because of agricultural-frontier expansion, selective timber extraction, and land-use conversion [3]. The most recent national monitoring data indicate that 113,608 ha were deforested in Colombia during 2024 [4], and that in the department of Cauca, forest loss reached 790.34 ha that same year [5], a trend that severely affects connectivity among fragments and alters species composition in sub-Andean landscapes [6]. The Colombian Central Cordillera accounts for an especially significant fraction of this threatened diversity: its sub-Andean forests are dominated by families such as Lauraceae, Melastomataceae, Rubiaceae, and Piperaceae [7,8,9], and represent one of the systems with the greatest floristic-documentation deficit in the country [2,10].
Despite recognition of their ecological importance, knowledge of the floristic diversity and structure of the sub-Andean forests of the Colombian Central Cordillera remains fragmentary. Available studies in the region document between 62 and 431 species per site, with methodological differences that hinder direct comparison [11,12,13,14,15], and only a few simultaneously integrate floristic characterization, quantitative structural analysis, and carbon-storage estimation [16]. This gap is particularly relevant given that montane secondary forests accumulate between 40 and 70% of the carbon stored in comparable mature forests [17,18] and play an increasing role in national climate-change mitigation strategies. The development of functional indices that integrate carbon storage with individual capture efficiency and the stability associated with species spatial-distribution patterns represents a scarcely explored approach in Colombian floristic studies, with direct potential to guide conservation and restoration strategies based on functional efficiency.
The El Mangón forest remnant, located in the corregimiento of Tunía, municipality of Piendamó, department of Cauca (1600–1700 m a.s.l.; 24 ha), constitutes a case of special interest for the landscape ecology of fragmented areas of the Central Cordillera. With an uninterrupted history of private conservation since 1912, when the Gómez family decided to protect the forest in a context of growing agricultural pressure, this remnant represents a rare example of a sub-Andean forest with low direct intervention embedded in an intensive agricultural mosaic. The ongoing initiative to declare the property a Natural Reserve of Civil Society (Reserva Natural de la Sociedad Civil, RNSC) confers immediate relevance on its floristic and functional characterization for private-conservation policy in Colombia. Until now, no scientific study had comprehensively documented its floristic diversity, vegetation structure, or aboveground carbon-storage capacity.
The general objective of this study was to characterize the floristic diversity, vegetation structure, and carbon storage of the El Mangón sub-Andean forest, in order to contribute to the knowledge of the sub-Andean ecosystems of the Colombian Central Cordillera and to provide baseline information for their conservation and management. Specific objectives were: (i) to inventory and analyze the taxonomic composition of the remnant through general (non-systematic) collections across the total area (24 ha); (ii) to characterize the horizontal and vertical structure of the forest through systematic transect-based sampling; (iii) to estimate aboveground biomass and carbon storage by species and to interpret the results using the Carbon Valuation Index (CVI), the Carbon Capture Efficiency Index (CCEI) and the Carbon Sustainability Index (CSI), which integrate storage magnitude with individual efficiency and the spatial stability of species; and (iv) to compare the findings with analogous studies in sub-Andean forests of southwestern Colombia and the Central Cordillera.

2. Materials and Methods

2.1. Study Area

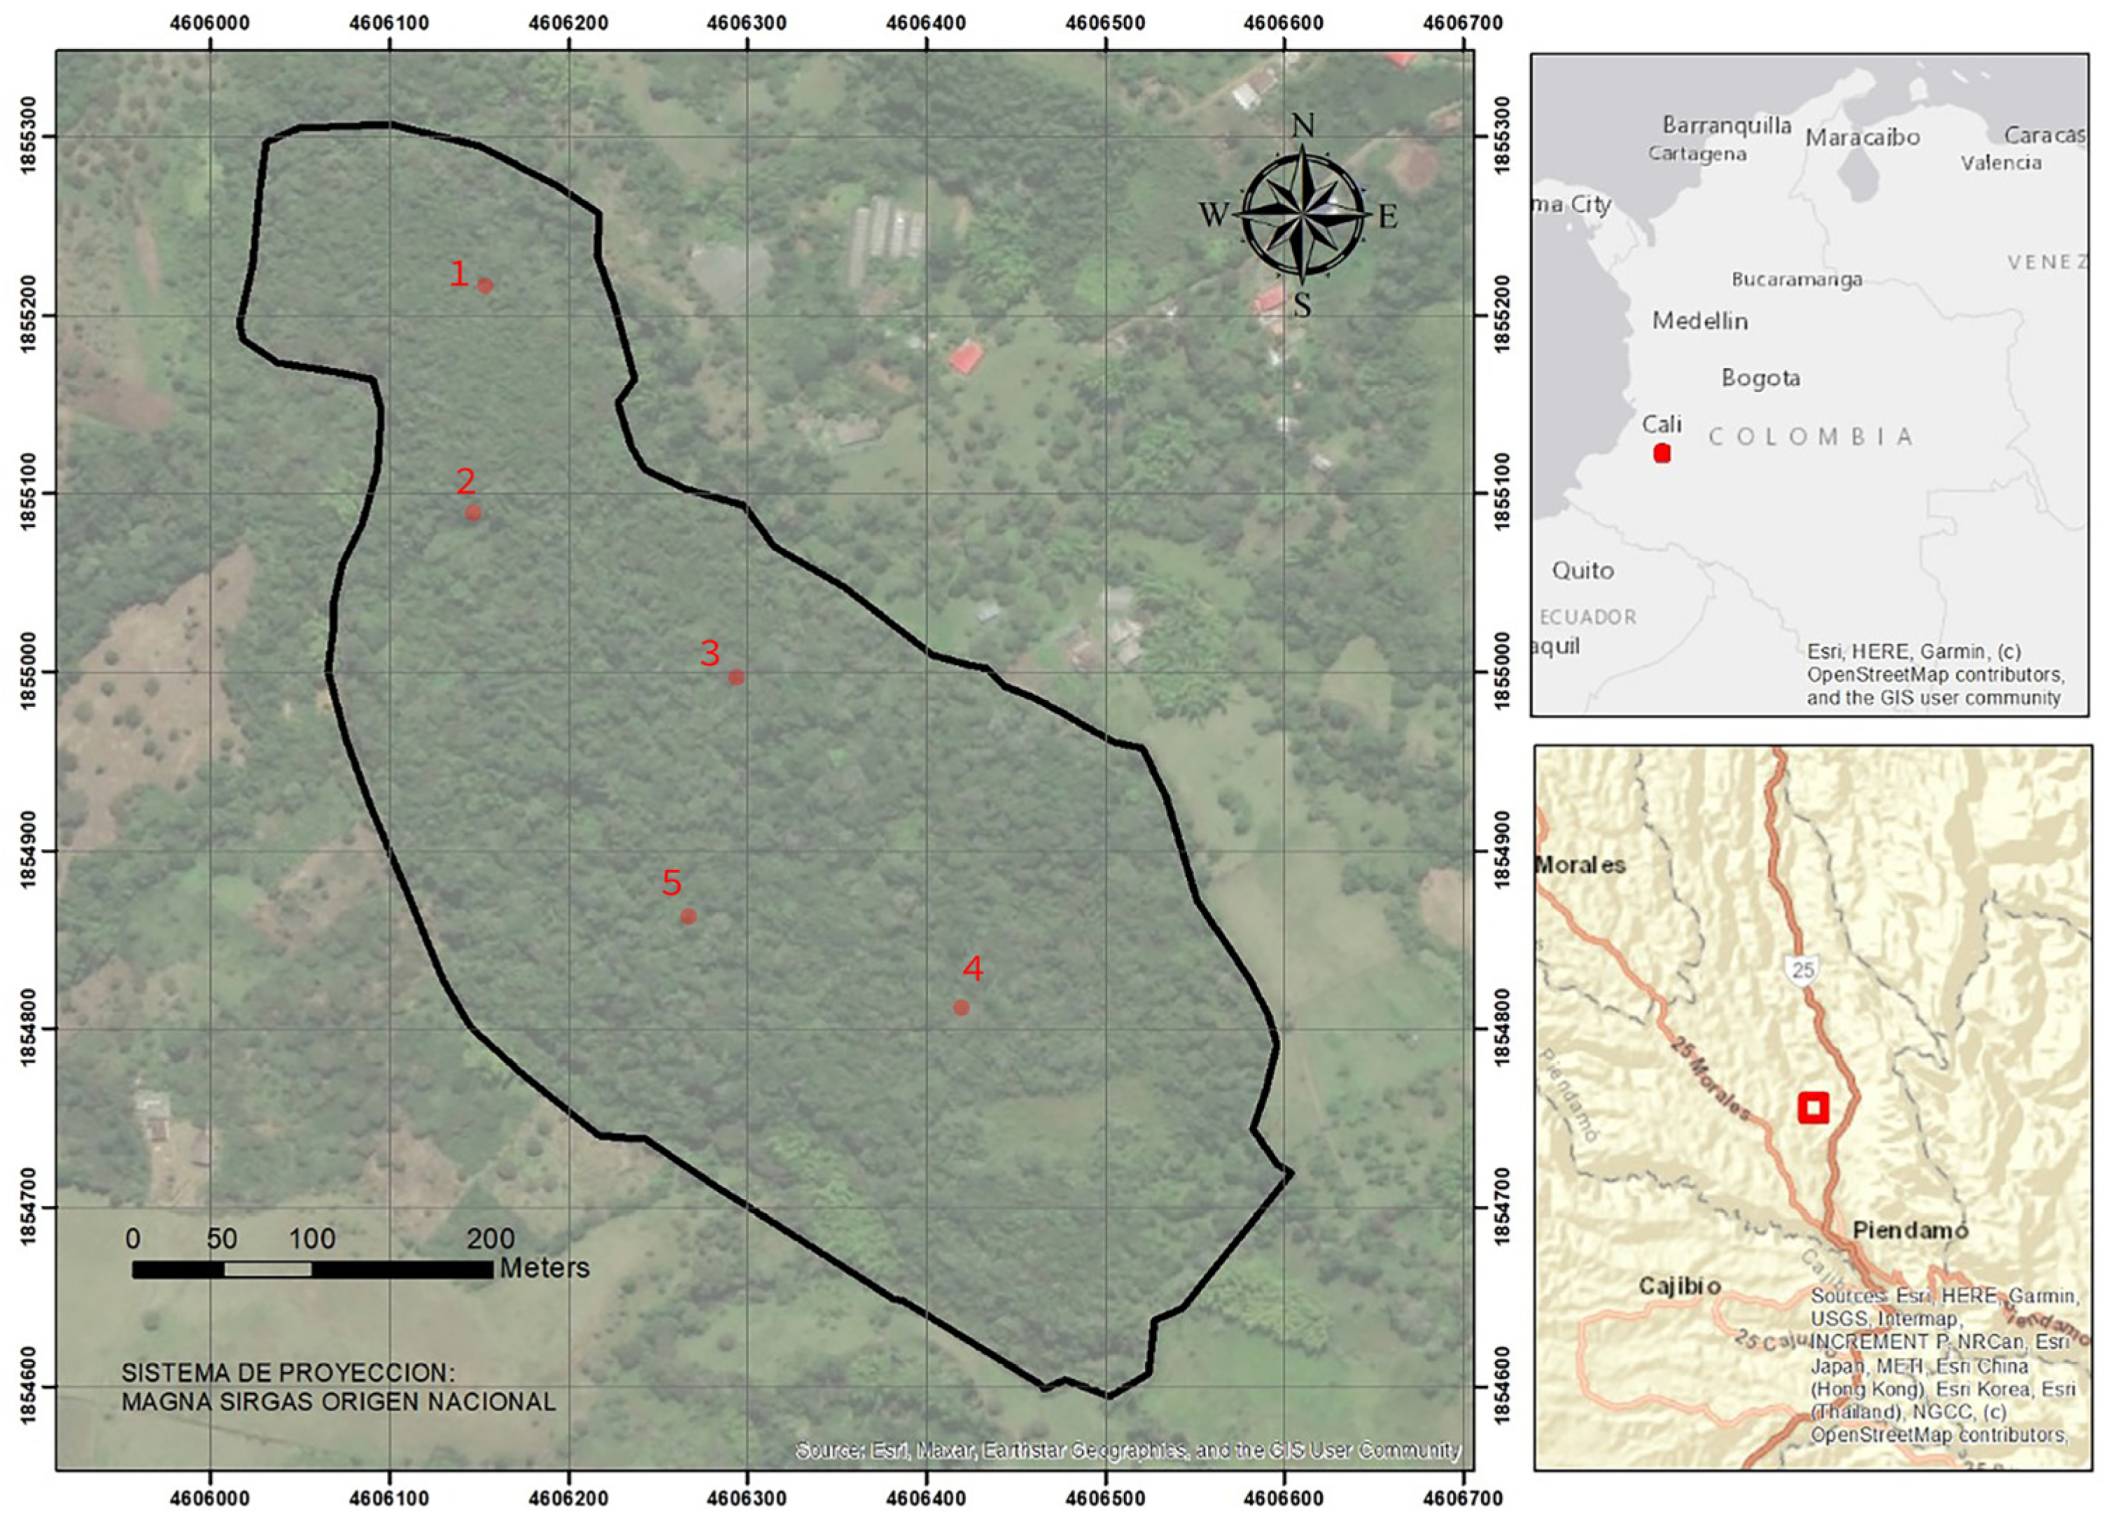
The El Mangón forest remnant is in the corregimiento of Tunía, municipality of Piendamó, department of Cauca, Colombia (2º40′52.2″ N, 76º32′25.5″ W), covering an area of 24 ha between 1600 and 1700 m a.s.l. The site has a mean annual temperature of 18 °C and an annual precipitation of 2300 mm. It is crossed by three water bodies (Colcha, Espino, and Quebrada Grande streams) and contains a water spring in its interior (Figure 1). The conservation history dates to 1912, when the Gómez family decided to protect the forest in the face of growing agricultural pressure in the region, an initiative sustained until the present and oriented toward declaring the property a Natural Reserve of Civil Society (RNSC).

2.2. Study Design and Component Distinction

This study comprises two methodologically differentiated components. Component I (floristic inventory) consisted of documenting total diversity through general (non-systematic) collections across the 24 ha, recording 281 species in 209 genera and 99 families (Appendix A). Component II (structural and functional analysis) was based on systematic sampling in fixed-area transects: 35 species and 498 individuals in 0.1 ha (five 50 × 4 m transects). All alpha diversity, horizontal and vertical structure, biomass, and carbon analyses correspond exclusively to Component II, unless otherwise indicated.

2.3. General (Non-Systematic) Floristic Inventory (Component I)

Twelve field expeditions were conducted between June 2025 and January 2026 under botanical collection permit No. 001040 ANLA (granted 30 May 2025), following the general (non-systematic) collection methodology for floristic inventories [19]. Each expedition involved a team of two to four botanical collectors, with an average duration of approximately eight hours each (≈96 expedition-hours; ≈192–384 person-hours for teams of two to four collectors). Collections covered the total area of the remnant (24 ha), including previously inaccessible interior forest zones. Vascular plants, bryophytes, and lichenized fungi (lichens) were recorded, with emphasis on epiphytes, lianas, and ferns; lichens and bryophytes were documented opportunistically as part of the cryptogamic flora. Taxonomic identification was performed using: (a) dichotomous keys and monographs of the flora of Colombia [2,7]; (b) reference collections of the CAUP Herbarium (Universidad del Cauca); (c) virtual collections of GBIF and COL; and (d) nomenclatural verification in World Flora Online (WFO) [20]. Reference specimens were deposited at the CAUP Herbarium under collection numbers Lelopez-4000 to Lelopez-4281.

2.4. Structural Sampling via Transects (Component II)

For the structural analysis, five 50 × 4 m transects (total area = 0.1 ha; sampling intensity = 0.42% of the remnant area) were systematically distributed in the interior of the forest, separated from each other by a minimum of 10 m. In each transect, all arboreal and shrubby individuals with circumference at breast height (CBH) ≥ 5 cm (equivalent to DBH ≥ 1.59 cm) were recorded. For each individual we measured: CBH (measuring tape ± 1 mm), total height (Ht) and stem height (Hf) using a Suunto clinometer, and relative spatial coordinates within the transect. Because this structural inventory covers 0.1 ha (0.42% of the remnant), the horizontal structure, biomass and carbon results are interpreted as a first quantitative approximation for the forest interior rather than as a stand-level census; sampling sufficiency for community-level patterns is evaluated by rarefaction/extrapolation and pooled sample coverage (Section Structural Sampling Completeness: Rarefaction and Asymptotic Estimation). Transects were placed in the forest interior (the least-disturbed portion of the remnant), spanning local variation in proximity to the three streams and in canopy-gap conditions; edge and recently disturbed zones were not sampled, so the structural results characterize interior conditions and are expected to under-represent edge-associated and early-pioneer assemblages.
DBH (cm) = CBH (cm)/π
Conversion of circumference to diameter at breast height, applied uniformly to all recorded individuals, is done according to Equation (1).
To evaluate the completeness of the structural inventory, we performed: (a) individual-based rarefaction curves by transect, standardized to the smallest sampling unit size (n = 52 individuals; transect 1); and (b) asymptotic diversity estimation using Hill numbers (q = 0, 1 and 2) with 95% confidence intervals computed by bootstrap resampling (999 iterations) using the iNEXT package [21] in R [22].

2.5. Alpha Diversity and Horizontal Structure (Component II)

Standard alpha diversity indices were calculated for the 35 species and 498 individuals recorded in the transects, following standard formulations [19]:
H′ = −∑(pi · ln pi)
Shannon–Wiener; pi = proportion of individuals of species i.
DMg = (S − 1)/ln N
Margalef; S = number of species; N = number of individuals.
1 − D = 1 − ∑(pi2)
Simpson (complement); pi = proportion of individuals of species i.
J′ = H′/ln S
Pielou’s evenness; S = number of species.
d = Nmax/N
Berger–Parker; Nmax = individuals of the most abundant species; N = total individuals.
The Importance Value Index (IVI) was calculated as the sum of relative abundance, relative frequency, and relative dominance of each species, with a theoretical maximum of 300 [19]. The spatial-distribution pattern was evaluated using the Pielou aggregation index:
Ga = Do/De
Ga = aggregation index; Do = observed density; De = expected density under random distribution. Ga < 1: tendency toward dispersion; 1 ≤ Ga ≤ 2: tendency toward clumping; Ga > 2: aggregated pattern.
The mixture coefficient was calculated as CM = (number of species/number of individuals) [7].

2.6. Vertical Structure and Allometric Analysis (Component II)

Vertical structural diversity was evaluated using the Pretzsch Index (A) [23]:
A = −∑(pij · ln pij)/ln(S × Z)
where pij = proportion of individuals of species i in stratum j; S = number of species; Z = number of strata.
Vertical strata were defined at four levels—lower stratum (0–8 m), middle stratum (8.1–12 m), upper stratum (12.1–18 m), and emergent stratum (18.1–33 m)—based on the observed total-height distribution of the sampled individuals. Class width for height and diameter distributions was determined using Scott’s criterion [24]:
h = 3.5 · σ · n−1/3
where h = class width; σ = standard deviation; n = number of individuals.
The Ogawa diagram [25] was constructed to visualize height distribution in relation to diameters, and the allometric relationship between Ht and Hf was evaluated using linear regression. Residual normality (Shapiro–Wilk) and homoscedasticity (Breusch–Pagan) assumptions were verified; R2 and p-values are reported.

2.7. Biomass and Carbon Estimation (Component II)

Aboveground biomass (AGB) was estimated using the FAO volumetric methodology [26]:
AGB = VCC × WD × BEF
where AGB = aboveground biomass (t·ha−1); VCC = stem volume with bark (m3·ha−1); WD = wood density (t·m−3); BEF = biomass expansion factor.
VCC = BA × Hf × 0.7
where BA = basal area (m2·ha−1); Hf = mean stem height (m); 0.7 = form factor.
WD = 0.6 t·m−3 was used as the regional reference value for tropical Americas [26], and BEF = 1.74. Carbon content was estimated as C = AGB × 0.47 (IPCC convention [27]). Analyses were performed exclusively on Component II and carbon results are expressed in Mg C ha−1 (and in kg ha−1 at the species level). Because the volumetric route markedly under-estimated stand biomass (implied basal area was inconsistent with the measured 22.6 m2 ha−1), aboveground biomass was re-estimated with the pantropical allometric model of [28] from individual diameter, total height and wood density; this DBH-based estimate (72.85 Mg C·ha−1) is adopted as the primary carbon value.

Proposed Carbon Indices (Component II)

To integrate carbon storage with the structural ecological importance of each species, three novel functional indices are proposed in this study: the Carbon Valuation Index (CVI), the Carbon Capture Efficiency Index (CCEI), and the Carbon Sustainability Index (CSI).
CVIi = IVIi × (Ci/Ctotal)
where CVI = Carbon Valuation Index; IVIi = IVI of species i; Ci = carbon stored by species i (kg·ha−1); Ctotal = total carbon in the sampling area (kg·ha−1).
CCEIi = Ci/(IVIi × Di)
where CCEI = Carbon Capture Efficiency Index; Ci = carbon stored by species i (kg·ha−1); IVIi = Importance Value Index of species i; Di = density of species i (ind·ha−1).
For CSI estimation, a spatial factor (Fspatial) was assigned to each species according to its distribution pattern (Table 1):
CSIi = Ci × Fspatial,i × (1 + |H′i|)
where CSIi = Carbon Sustainability Index of species i; Ci = stored carbon (kg·ha−1); Fspatial,i = spatial factor (Table 1); H′i = individual contribution of species i to the community Shannon index (absolute value).
The CSI of group g is calculated as the sum of the individual CSIs of all species in the group: CSIg = ∑CSIi for all species in group g.
Each index addresses a management-relevant question that IVI, biomass, carbon or ordination do not answer individually: the CVI identifies species combining high structural importance with a large stored-carbon pool; the CCEI is an intensive (per-importance, per capita) measure that flags efficient storers, subject to a native-status filter; and the CSI weights each species’ carbon by its spatial pattern and diversity contribution as a first-order proxy for how spatially buffered that carbon is. The three indices are descriptive, single-site, single-time tools rather than validated predictors and rest on a single regional wood-density value (Section 2.7), so species-level scores are provisional.

2.8. Collection Permits and Ethical Declarations

Biological material collection was carried out under the Framework Collection Permit for Biological Specimens for Non-commercial Scientific Research, Permit 001040 of 30 May 2025, ANLA (Autoridad Nacional de Licencias Ambientales), in accordance with Resolution 1484 of 2014 of the Colombian Ministry of Environment and Sustainable Development (MADS). Specimens were deposited at the CAUP Herbarium of Universidad del Cauca under collection numbers Lelopez-4000 to Lelopez-4281.

2.9. Statistical Analysis

Data were organized in Microsoft Excel 2019. Statistical and ecological analyses were performed in R v4.3.0 [22], with packages vegan v2.6–4 [29], ggplot2 v3.4.0 [30], dplyr v1.1.2 [31], and iNEXT R package, version 3.0.1 [21]. Carbon functional groups were defined by k-means partitioning into four groups (Euclidean distance on standardized variables). Principal Component Analysis (PCA) was applied to ten standardized variables (mean = 0, SD = 1): biomass, carbon, IVI, relative abundance, relative frequency, relative dominance, Shannon and Simpson contributions, Pielou aggregation index (Ga), and density. With the corrected (Chave-based) carbon and biomass, PC1 explained 59.4% of the total variance and PC2 explained 20.2% (cumulative variance: 79.6%); the four-group structure and variable–axis associations were preserved when Palicourea crocea was excluded (PC1 = 57.4%, PC2 = 32.8%), indicating that both components adequately summarize the structural, ecological, and functional variation among the analyzed species. Comparison of CSI values among spatial-pattern groups was performed using the non-parametric Kruskal–Wallis test, with post hoc pairwise Wilcoxon comparisons and Benjamini–Hochberg correction. Statistical significance was set at α = 0.05.

3. Results

Results are presented in two differentiated blocks reflecting the two methodological components of the study (see Section 2.2). Component I corresponds to the general (non-systematic) floristic inventory (24 ha): 281 species, 209 genera, 99 families. Component II corresponds to the structural sampling in five 50 × 4 m transects (0.1 ha): 35 species and 498 individuals. Unless otherwise indicated, all numerical values for IVI, diversity indices, biomass, and carbon refer to Component II.

3.1. Taxonomic Diversity and Floristic Richness (Component I—24 ha)

A total of 281 species distributed in 209 genera and 99 families were recorded in the El Mangón forest remnant (Table A1). The species/genus ratio (1.34), species/family ratio (2.84), and genus/family ratio (2.11) indicate a balanced taxonomic structure. The most diverse families were Poaceae (20 spp.), Asteraceae (13 spp.), and Orchidaceae (13 spp.)—16.4% of total richness—which together with Polypodiaceae and Rubiaceae (10 spp. each), Piperaceae (9 spp.), Fabaceae and Melastomataceae (8 spp. each), and Bromeliaceae and Bryaceae (7 spp. each) accounted for 37.4% of species diversity (Table 2). The class distribution showed a predominance of Magnoliopsida (117 spp., 41.64%), followed by Liliopsida (53 spp., 18.86%) and Bryopsida (48 spp., 17.08%). Lecanoromycetes and Polypodiopsida contributed 24 spp. (8.54%) and 25 spp. (8.90%), respectively.

Growth Forms—General (Non-Systematic) Floristic Inventory (Component I)

Analysis of growth forms showed that epiphytes constituted the most diverse group with 124 spp. (44.13%), followed by herbs with 97 spp. (34.52%), shrubs with 31 spp. (11.03%), and trees with 25 spp. (8.90%). Hemiparasites and lianas were the least represented, with 2 spp. each (0.71%). The high proportion of epiphytes exceeded the typical values of 25–35% reported for Neotropical sub-Andean forests.

3.2. Alpha Diversity Indices (Component II—Transects, 35 spp., 498 ind.)

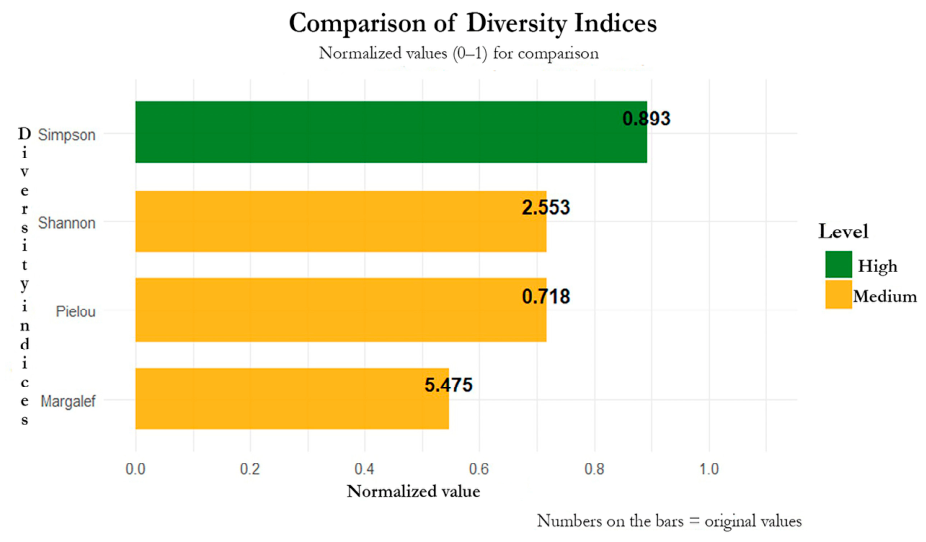
Species diversity analysis of Component II revealed a community of 35 species and 498 individuals. The Shannon–Wiener index (H′ = 2.55) indicated intermediate diversity characteristic of forests in intermediate succession; the Margalef index (DMg = 5.47) evidenced high species richness relative to sample size. Community structure exhibited low dominance (Simpson 1-D = 0.89; Pielou J′ = 0.72; Berger–Parker d = 0.17), confirming a relatively homogeneous distribution of abundances among the 35 sampled species (Figure 2).

Structural Sampling Completeness: Rarefaction and Asymptotic Estimation

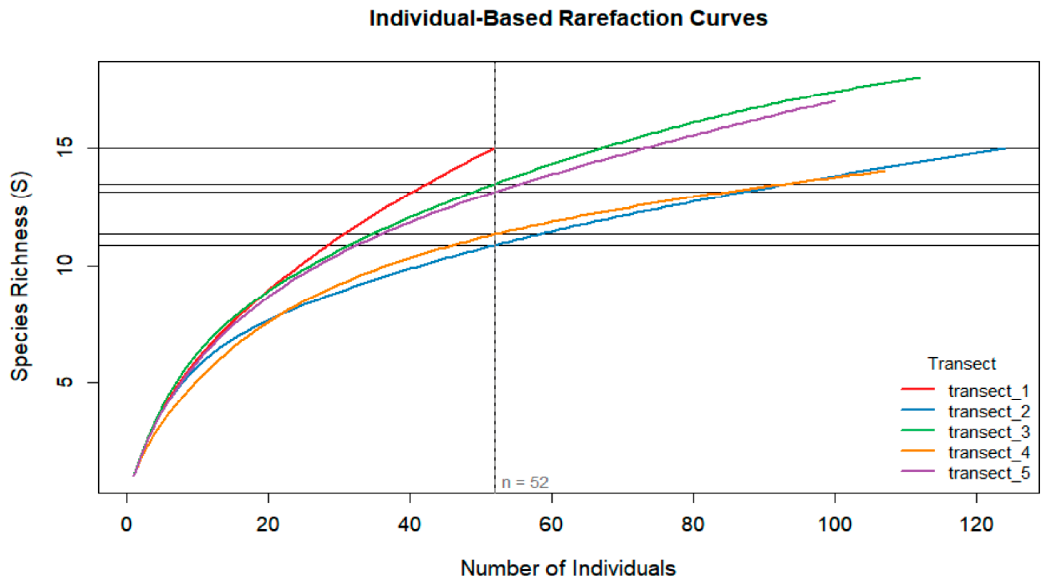
Individual-based rarefaction analysis revealed differences in standardized richness among the five transects. Standardizing to n = 52 individuals (smallest transect size: transect 1), rarefied richness ranged from 10.85 spp. (transect 2; SE = 1.35) to 15.00 spp. (transect 1; reference), with intermediate values for transect 3 (13.46 ± 1.51), transect 5 (13.11 ± 1.40), and transect 4 (11.31 ± 1.19) (Figure 3).
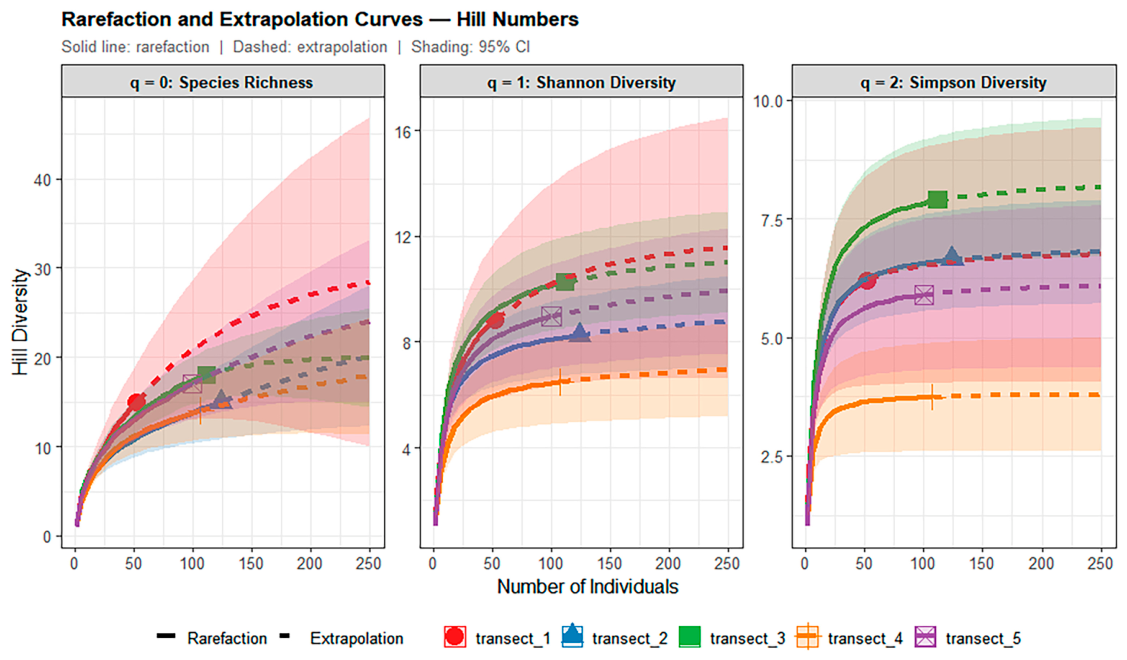
Asymptotic extrapolation curves (Hill numbers, q = 0) showed that none of the five transects reached inventory saturation at the individual sampling unit scale: estimated asymptotic richness exceeded observed richness in all cases. Asymptotic estimates ranged from 20.1 spp. (transect 3; observed: 18; 95% CI: 18.0–34.1) to 32.9 spp. (transect 2; observed: 15; 95% CI: 15.0–58.7). Transect 3 was closest to saturation (relative completeness ≈ 90%), while transect 1 and transect 2 showed the largest gaps (completeness ≈ 49% and ≈ 46%, respectively; Table 3, Figure 4). These results confirm that sampling by individual transect is incomplete; the five transects combined allow adequate estimation of community patterns for the objectives of the present study. For the pooled structural sample (498 individuals, 35 species; 12 singletons, 4 doubletons), sample coverage was Ĉ = 97.6% and asymptotic richness (Chao1, q = 0) was 48.2 species, indicating that the combined transects captured the majority of the species expected at this DBH threshold even though individual transects did not saturate.

3.3. Horizontal Structure of the Forest Remnant (Component II)

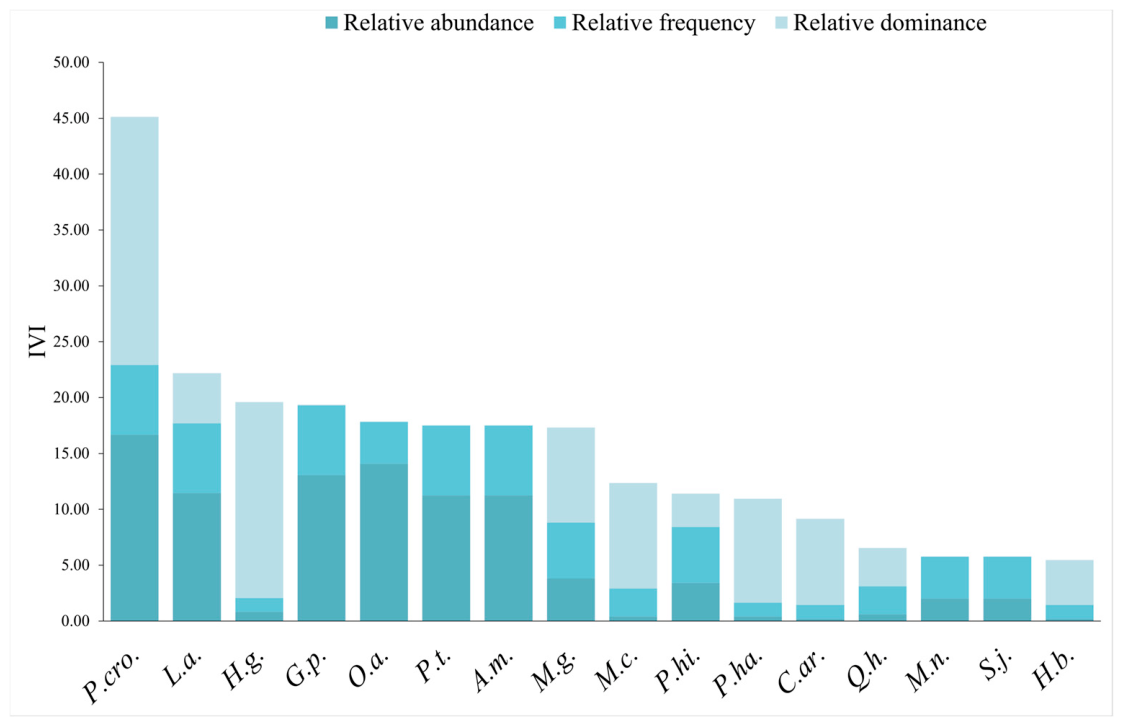
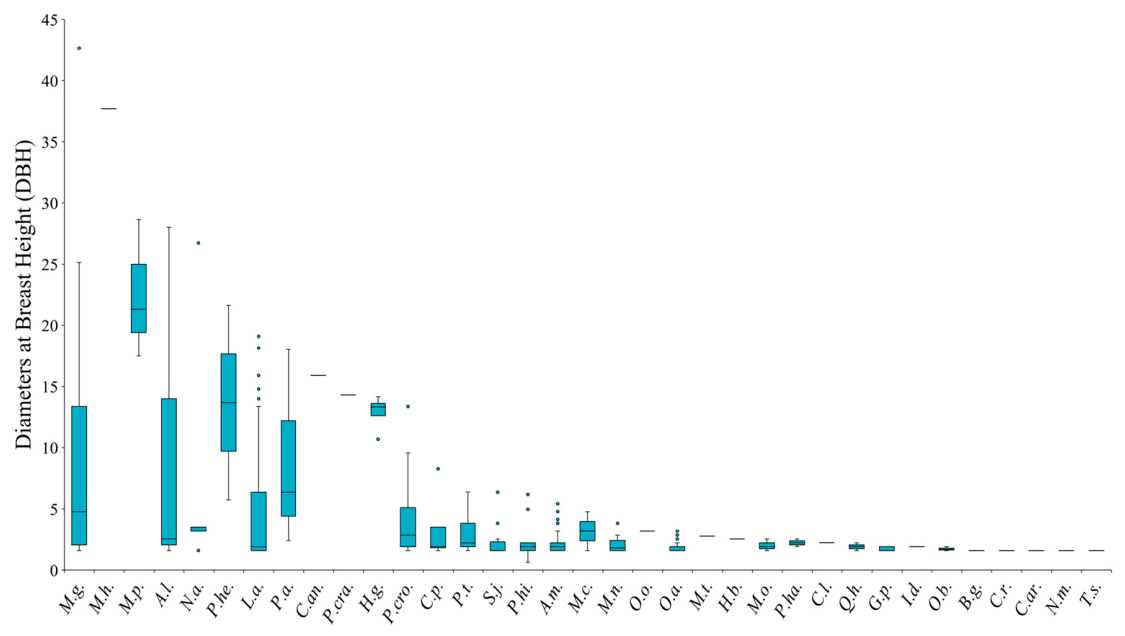
Analysis of horizontal structure revealed marked heterogeneity in the ecological importance of species, with IVI values ranging from 1.46 to 45.12 (scale 0–300) (Table A2). P. crocea (Rubiaceae) was the ecologically dominant species (IVI = 45.12; relative abundance = 16.67%; relative dominance = 22.21%), followed by Lacistema aggregatum (IVI = 22.18) and Heliconia griggsiana (IVI = 19.60). The fifteen most important species contributed approximately 80% of total IVI, with the top ten amounting to 66.4% (Figure 5; Table A2). Variation in stem size by species is summarized in Figure 6, where Myrcianthes hallii, Myrcia popayanensis, and Palicourea heterochroma displayed the largest median DBH values, while shrubby and palm species (Geonoma pinnatifrons, Coffea arabica, Citrus reticulata) presented the smallest size classes.
Of the species, 57.14% (20 spp.) exhibited Ga < 1 (low-aggregation distribution), while 25.71% (9 spp.) showed an aggregated pattern (Ga > 2) (Table A2). Olmedia aspera showed the highest degree of aggregation (Ga = 15.28), followed by P. crocea (Ga = 3.60) and G. pinnatifrons (Ga = 2.82). The mixture coefficient (CM = 0.070; 1/CM = 14.23) classified the ecosystem as structurally homogeneous.

3.4. Vertical Structure of the Forest Remnant (Component II)

The vertical structure revealed four clearly differentiated strata: the lower stratum (0–8 m), middle stratum (8.1–12 m), upper stratum (12.1–18 m), and emergent stratum (18.1–33 m). The Pretzsch Index reached A = 3.21, equivalent to 64.93% of the theoretical maximum (4.94), indicating notable vertical structural complexity for a forest in active regeneration.
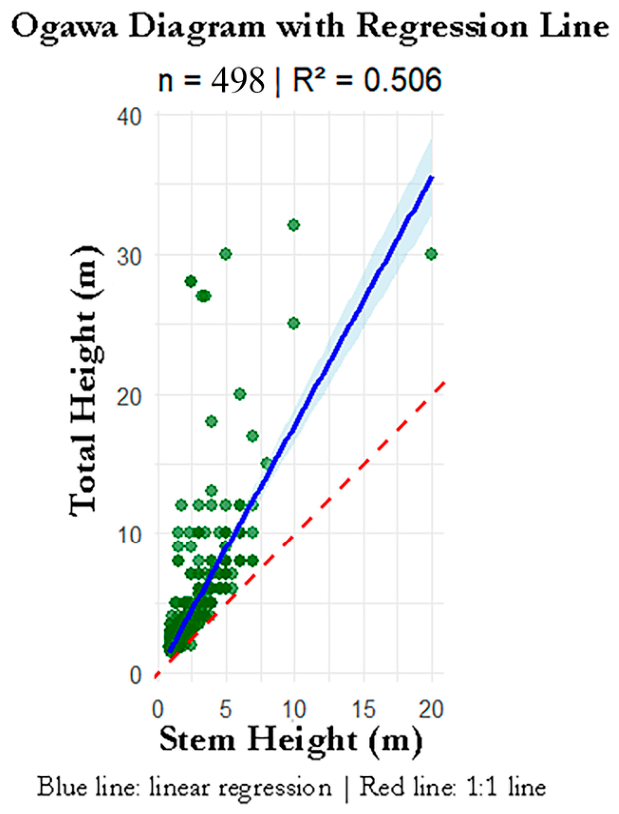
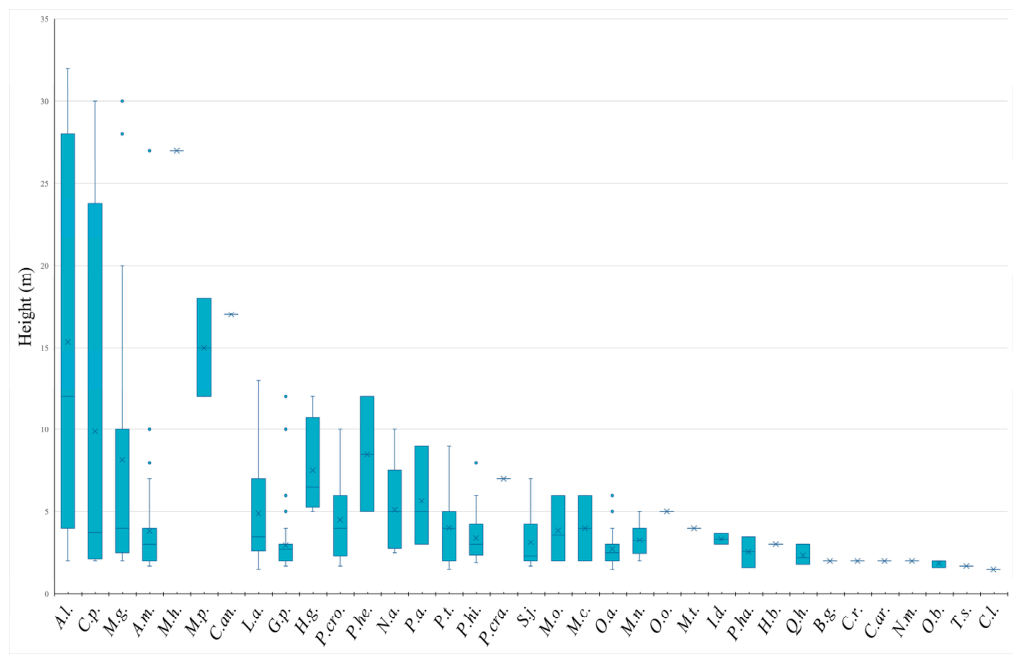
The Ogawa diagram (Figure 7) showed an asymmetric height distribution, with a strong concentration of individuals in lower and intermediate classes and a small number of dominant canopy trees. Mean height was 4.34 m (±4.09 m). The allometric relationship between Ht and Hf was moderate but significant (R2 = 0.51, p < 0.001). The lower stratum concentrated 91.77% of individuals (457 ind. of 32 spp.); the middle stratum 5.62% (28 ind. of 12 spp.); and the upper and emergent strata 2.61% (13 ind. of 8 spp.). The species-level distribution of total height (Figure 8) reveals that the tallest medians correspond to canopy trees such as Alchornea latifolia, Cinchona pubescens, and M. popayanensis, while the bulk of the assemblage exhibits modal heights below 5 m, consistent with an inverse-J pattern typical of secondary forests in active regeneration.
On a per-hectare basis, the stand had a basal area of 22.6 m2·ha−1, a commercial stem volume of 79.23 m3·ha−1 and a total volume with bark of 264.62 m3·ha−1 (the previously reported 5.49 and 24.00 m3·ha−1 were affected by a scaling error in the volume computation); P. crocea contributed the greatest number of stems, whereas the largest individual volumes corresponded to a few large canopy trees.

3.5. Biomass and Carbon of the Remnant (Component II)

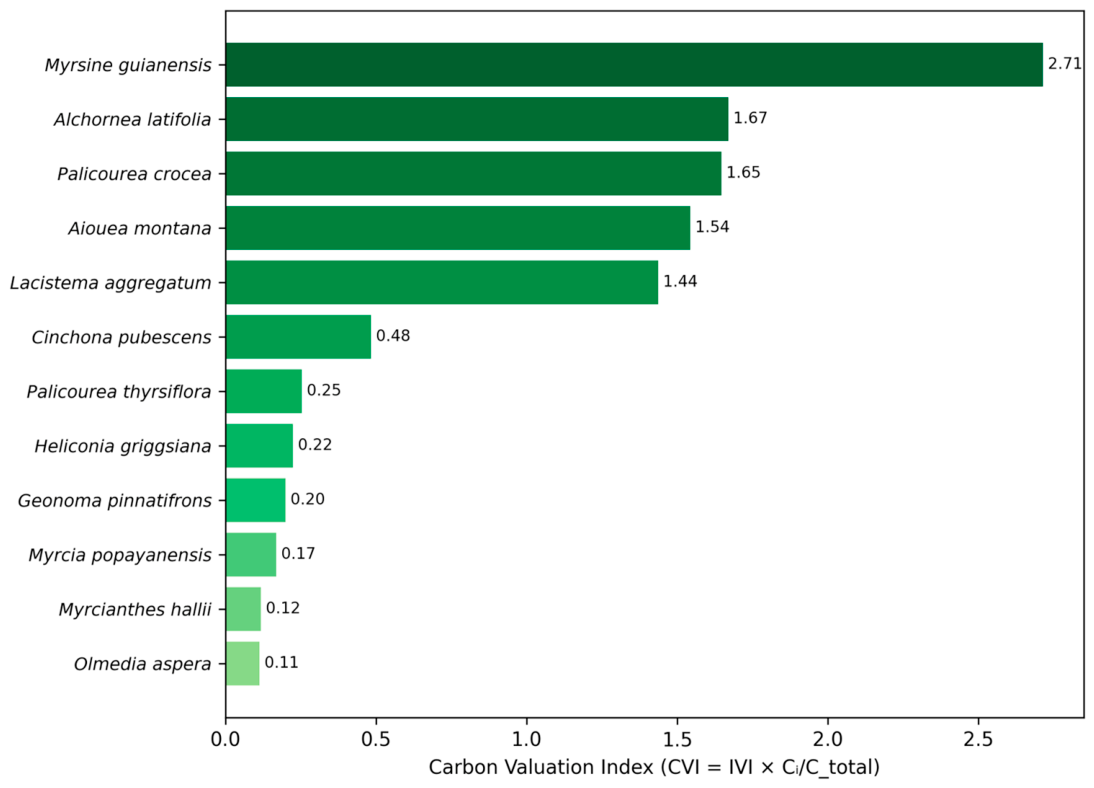
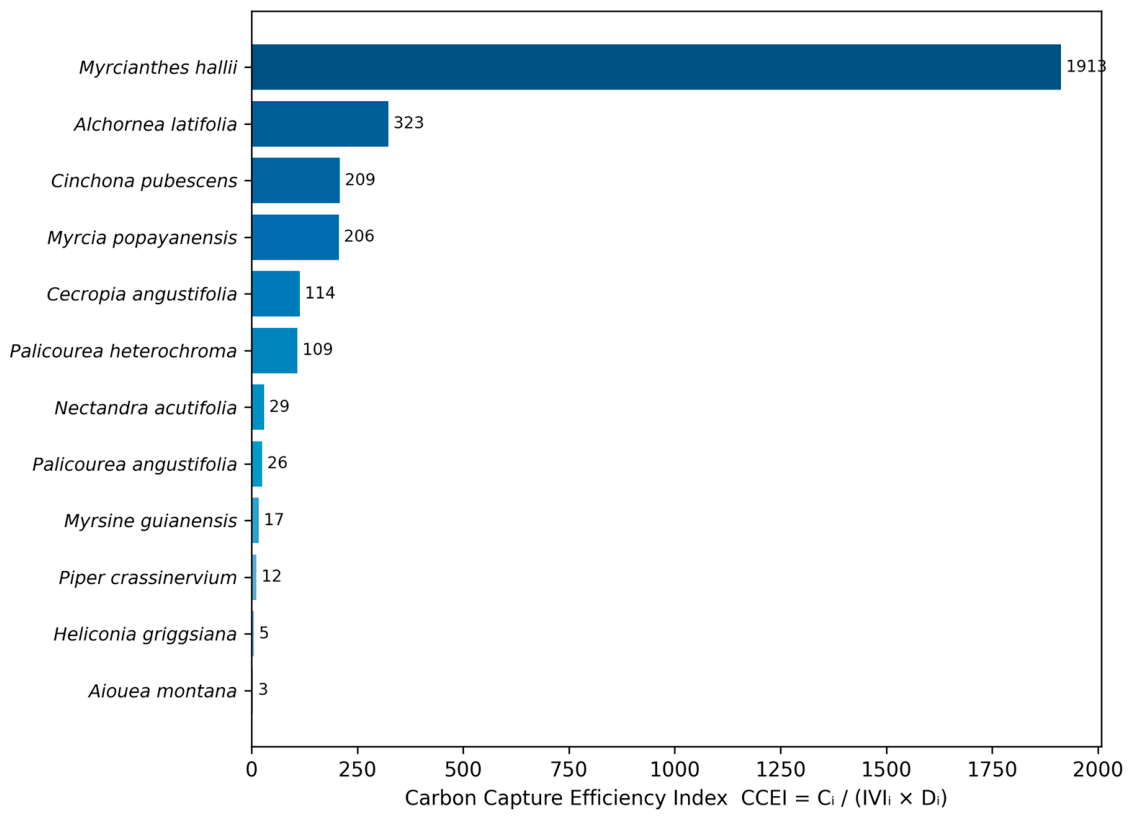
Aboveground carbon, re-estimated with the [28] pantropical allometric model from individual diameter, total height and regional wood density (WD = 0.6 t·m−3), totaled 72.85 Mg C·ha−1 (72,850 kg·ha−1); a wood-density sensitivity analysis (0.4–0.8 t·m−3) gave 49.0–96.5 Mg C·ha−1. P. crocea (Rubiaceae) showed the highest structural dominance (IVI = 45.12), but under the corrected carbon the highest CVI corresponds to Myrsine guianensis (CVI = 2.71), followed by Alchornea latifolia (1.67) and P. crocea (1.65) (Figure 9). By contrast, the Carbon Capture Efficiency Index (CCEI) highlighted species with high carbon storage per unit of ecological importance and density, mainly rare or low-density large-stemmed species (Figure 10). Aboveground carbon is dominated by a few large canopy trees (A. latifolia, 32%; M. guianensis, 16%; C. pubescens, 10.5%), whereas P. crocea contributes only 3.6%.
Note on C. arabica: this cultivated species, native to Ethiopia and introduced to Colombia during the colonial period [32], occurs in the transects as remnant individuals from a coffee plantation with more than 50 years of history at the site, currently abandoned. C. arabica is therefore not a native component of the Colombian sub-Andean ecosystem. Its high CCEI value reflects specific physiological characteristics (photosynthetic efficiency under shade and high C/N ratio) rather than a central ecological function in the natural ecosystem; ecological implications are discussed in Section 4.5.
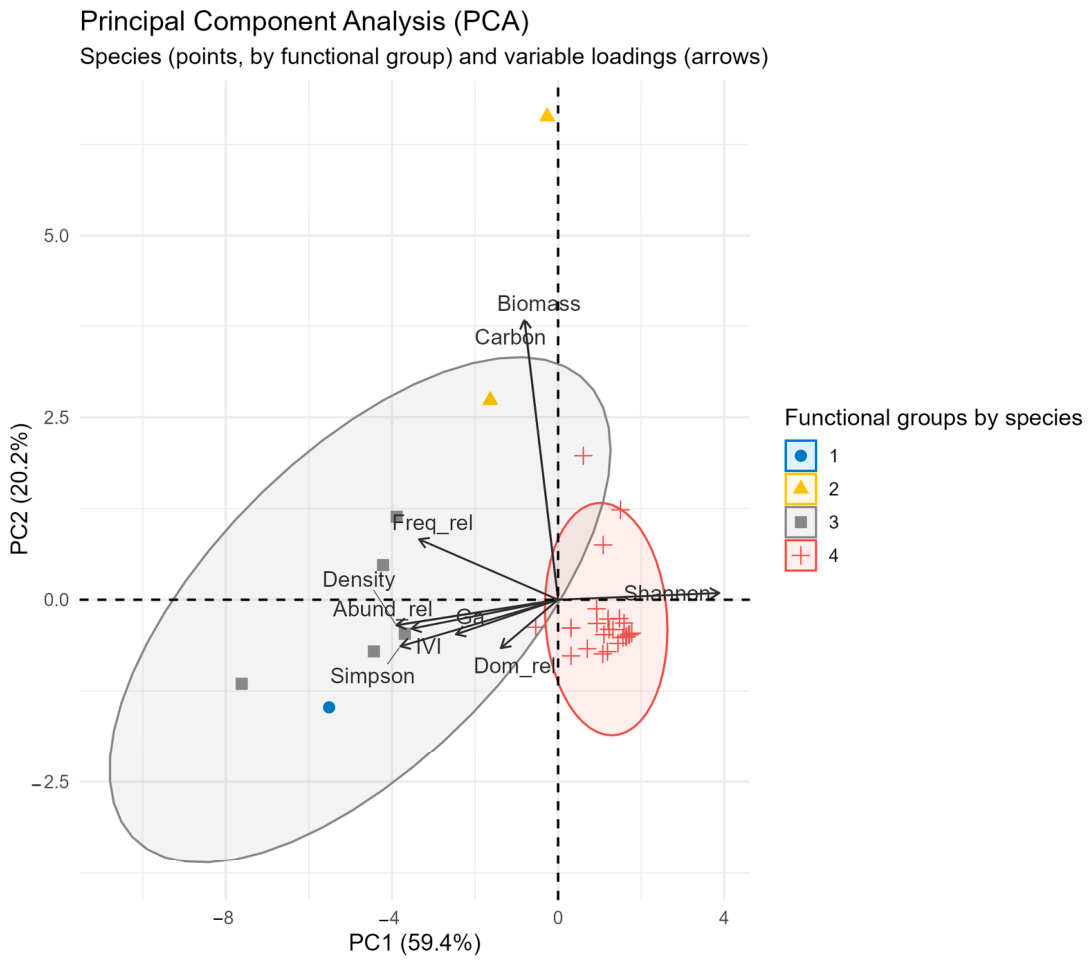
Functional-group analysis (k-means, four groups) on the corrected carbon separated a large group of low-carbon species (24 spp.; mean ≈ 192 kg·ha−1) from small groups of high-carbon, large-stemmed trees (a group dominated by A. latifolia, ≈ 23,456 kg·ha−1, and a high-storage group with mean ≈ 7178 kg·ha−1); P. crocea (83 ind.) fell in a high-density, moderate-carbon group. PCA on the ten standardized variables showed that PC1 (59.4% of variance) was influenced primarily by IVI, density, relative abundance and the diversity contributions, while PC2 (20.2%; cumulative 79.6%) was associated with biomass, carbon and relative dominance (Figure 11).

3.6. Carbon Sustainability Index (CSI) by Spatial Pattern (Component II)

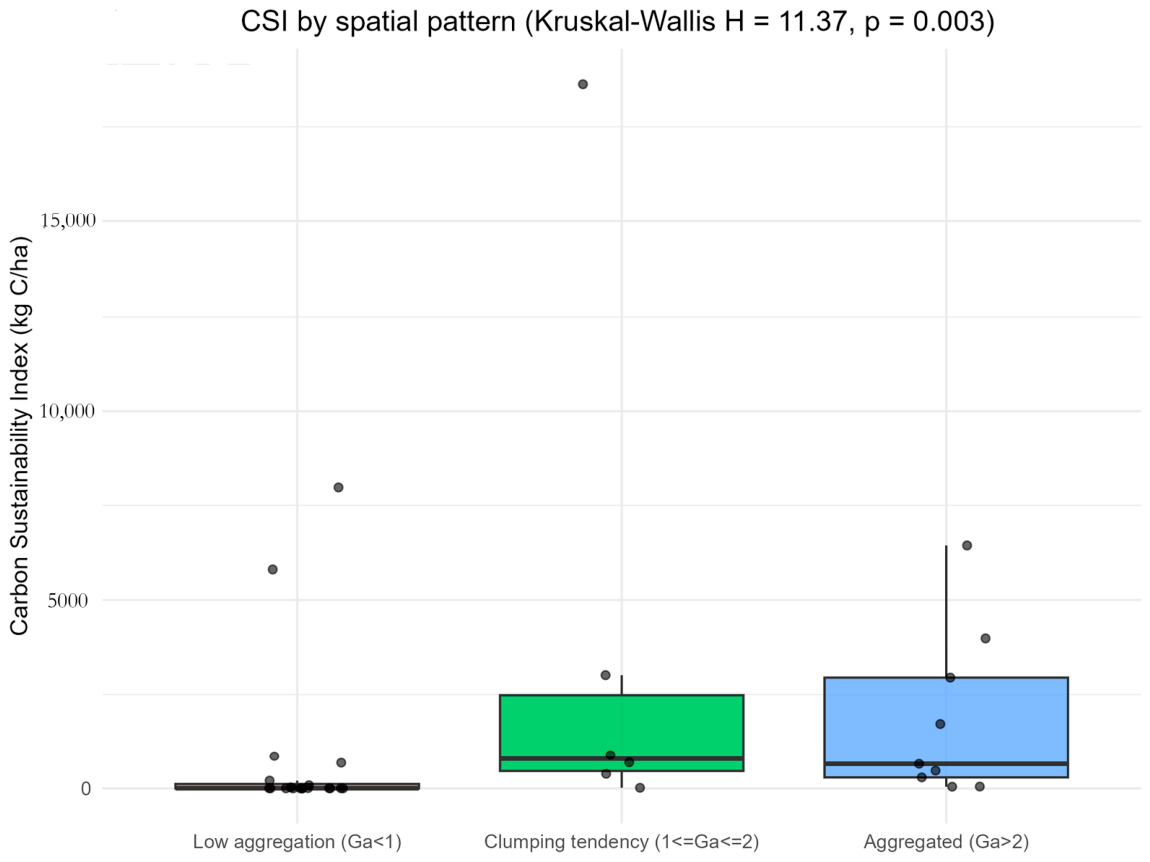
Evaluation of the CSI by spatial pattern revealed differences in cumulative values among distribution groups (Figure 12). With carbon re-estimated using [28], the low-aggregation group (20 spp.) showed the lowest mean CSI (785 kg C·ha−1 per species), whereas the clumping-tendency (6 spp.; mean 3942) and aggregated (9 spp.; mean 1846) groups—which include the large canopy trees—showed higher values.
The Kruskal–Wallis test detected statistically significant differences in individual CSI values among the three spatial-pattern groups (H = 11.37, df = 2, p = 0.003). Post hoc pairwise comparisons (Wilcoxon with Benjamini–Hochberg correction) showed that the low-aggregation group differed significantly from both the clumping-tendency and the aggregated groups (p = 0.017 in both cases), whereas the latter two did not differ (p = 0.86). The mean CSI per species was lowest in the low-aggregation group (785 kg C·ha−1) and higher in the clumping-tendency (3942) and aggregated (1846) groups, indicating that most sustainable carbon is held by a few large, spatially concentrated trees.

4. Discussion

4.1. Taxonomic Diversity and Floristic Richness

The floristic richness of the El Mangón remnant (281 spp., 209 gen., 99 fam.) is comparable to that reported for El Peñol, Antioquia (285 spp.; [1]), and surpasses records from other Cauca remnants such as Timbío, Hacienda Hato Viejo (151 spp.; [11]) and Popayán, Reserva Forestal Cajete (164 spp.; [3]). This level of richness confirms the patterns of high diversity characteristic of the sub-Andean forests of the Colombian Central Cordillera described by [7,9,33].
The predominance of Poaceae (20 spp.), Asteraceae (13 spp.), and Orchidaceae (13 spp.) partially departs from the general pattern of Colombian sub-Andean forests, where Rubiaceae and Melastomataceae typically dominate floristic composition [7,9]. This peculiarity may be explained by the specific ecological conditions of the site—especially the surrounding agricultural matrix and the disturbance history—which favor the establishment of grasses and composites typical of forest edges and intermediate successional stages [8]. The dominance of Rubiaceae in the structural analyses (driven mainly by P. crocea) indicates that the family is indeed important at the structural level, although not in terms of species diversity in the general (non-systematic) inventory.
The high representation of epiphytes (44.13%) greatly exceeds the typical values of 25–35% reported for Neotropical sub-Andean forests [34]. This exceptional epiphytic richness can be attributed to: the permanence of forest cover since 1912 without clear-cutting, the presence of four well-differentiated vertical strata that increase microhabitat availability, and microclimate stability provided by the three water bodies crossing the remnant. The association between canopy vertical structural heterogeneity and epiphytic diversity has been documented in tropical Andean montane forests [10,35]. Because the general (non-systematic) inventory deliberately emphasized epiphytes, lianas and ferns, this proportion partly reflects targeted collecting effort and is not directly comparable with epiphyte proportions derived from systematic plot-based sampling.

4.2. Diversity Indices and Community Structure

The Shannon–Wiener index (H′ = 2.55) places El Mangón in an intermediate range relative to other Colombian sub-Andean forests, below values reported for Puracé (H′ = 3.0; [12]) and Santander de Quilichao (H′ = 3.0; [13]), but above records from Timbío (H′ = 2.0; [14]) and Nariño (H′ = 2.0; [6]). Pielou’s evenness (J′ = 0.72) indicates a moderately uniform abundance distribution, consistent with an ecosystem in successional reorganization.
Patterns of intermediate diversity and low dominance (Simpson 1-D = 0.89; Berger–Parker d = 0.17) are consistent with post-disturbance recovery dynamics described by [15] for tropical Andean forests in intermediate succession. The high Margalef index (DMg = 5.47) reflects high species richness relative to the structural sample size (0.1 ha).

4.3. Horizontal Structure and Spatial-Distribution Patterns

The marked dominance of P. crocea (IVI = 45.12) constitutes an atypical pattern for sub-Andean forests. The concentration of 66.4% of total IVI in ten species coincides with patterns recorded in fragmented sub-Andean remnants, where the first twelve species typically accumulate ≈72% of IVI [16,17]. This pattern may be partly attributable to the placement of transects in areas of higher density of P. crocea (Ga = 3.60, aggregated pattern), an aspect that constitutes a methodological limitation discussed in Section 4.6.
The predominance of low-aggregation patterns (57.14% of species with Ga < 1) contrasts with the predominantly aggregated pattern of mature tropical forests and suggests active interspecific competition and seed-dispersal limitations, processes typical of intermediate successional stages [15,18]. The high aggregation of O. aspera (Ga = 15.28) and P. crocea (Ga = 3.60) indicates specific reproductive strategies and marked microenvironmental preferences.

4.4. Vertical Structure and Successional Position

The presence of four well-differentiated vertical strata and a Pretzsch Index of 3.21 (64.93% of the theoretical maximum) indicates notable vertical structural complexity for a forest in active regeneration. This value is consistent with the three to four well-defined strata reported for mature secondary forests of the Colombian Andes in advanced passive restoration [3,36], where gradual canopy differentiation generates light gradients that diversify microhabitats for recovering species.
The concentration of 91.77% of individuals in the lower stratum (0–8 m) reflects typical dynamics of recovering forests, where active regeneration generates high densities of young individuals [15,37]. The inverse-J pattern in diameter and height distributions is characteristic of communities with continuous recruitment and density-dependent mortality, suggesting a successional trajectory toward a forest with greater canopy dominance. The Ht–Hf allometric relationship (R2 = 0.51, p < 0.001) indicates the architectural heterogeneity expected in secondary forests with high diversity of growth forms [37].

4.5. Carbon Storage and Sustainability

Carbon-storage patterns revealed marked functional heterogeneity among species. When aboveground biomass is re-estimated with the [28] pantropical model, total aboveground carbon is 72.85 Mg C·ha−1—within the range reported for Andean montane secondary forests (≈20–80 Mg C·ha−1) and broadly consistent with secondary forests 25–30 years old accumulating 40–70% of the carbon of comparable mature stands [17,18]. Carbon is concentrated in a few large canopy trees (A. latifolia, M. guianensis, C. pubescens) rather than in the structurally dominant P. crocea (only 3.6% of total), whereas species with lower structural dominance show higher per-individual capture efficiency (CCEI). The much lower value initially obtained with the volumetric route (2.87 Mg C·ha−1) reflected an under-estimation of standing volume and is not retained. This result also reinforces the importance of selecting appropriate allometric models for biomass and carbon estimation, since species-specific or locally calibrated equations can substantially improve the accuracy of aboveground biomass estimates [38].
The presence of C. arabica (L.) among the species with a relatively high CCEI requires careful interpretation. The presence of this species in the transects corresponds to remnant individuals from a coffee plantation with more than 50 years of history at the site, currently abandoned. C. arabica, native to the Ethiopian highlands and introduced to Colombia during the colonial period [32], is not a native component of the Colombian sub-Andean ecosystem. Its maintenance under the canopy of the remnant—without reproducing or expanding as part of the native assemblage—and its high CCEI may reflect specific physiological characteristics (photosynthetic efficiency under shade conditions; high C/N ratio) rather than a central ecological function in ecosystem carbon storage. This distinction is relevant both for the interpretation of the carbon analysis and for site management within the framework of the RNSC declaration, where the status of introduced species must be formally evaluated. More generally, this case delimits the interpretation of CCEI: because the index rewards high carbon per unit of ecological importance and density, it can be maximized by low-density, physiologically efficient species—including introduced ones—irrespective of their conservation value, so a high CCEI must not be read as ecological priority. Accordingly, within the prospective RNSC management plan, C. arabica should be treated as a non-native legacy of former cultivation: enrichment planting and restoration should rely on native species, whereas isolated, non-regenerating coffee individuals under the canopy may be tolerated and monitored rather than actively propagated, with gradual removal prioritized only where regeneration or expansion is detected.
Functional-group analyses and PCA revealed clear trade-offs between diversity and carbon storage: the group dominated by P. crocea maximizes total storage but reduces structural diversity, while groups with a greater number of species generate greater functional heterogeneity. With the corrected carbon, the CSI differs significantly among spatial-distribution groups (Kruskal–Wallis, p = 0.003): aggregated and clumping-tendency species—which include the large canopy trees that store most carbon—show a higher CSI than low-aggregation species. In this stand, therefore, carbon sustainability is associated with the spatial concentration of a few large trees rather than with low-aggregation patterns, broadly consistent with evidence that the spatial arrangement of tree species influences forest functioning [39]—although that study found spatial mixing, rather than aggregation, to enhance functioning, so this single-site association more likely reflects the large carbon mass held by a few aggregated trees; this single-site, single-time result nonetheless requires validation with greater sampling intensity and temporal monitoring. Beyond these descriptive results, the three indices are intended to provide information that IVI, biomass, carbon and ordination do not yield individually: CVI identifies species whose conservation simultaneously protects a large, structurally anchored carbon pool; CCEI is an intensive (per-importance, per capita) measure that flags efficient storers for potential enrichment planting, subject to the native-status filter noted above; and CSI weights each species’ carbon by its spatial pattern and diversity contribution as a first-order proxy for how spatially buffered that carbon is. Their shared assumptions are made explicit: carbon rests on a single regional wood-density value (Section 2.7), so species-level scores are provisional; the indices are single-site, single-time descriptors rather than validated predictors; and the CSI spatial factor is an ordinal weighting, not a mechanistic stability model. They therefore complement—and do not replace—IVI, biomass and ordination, and require multi-site validation before generalization. It should also be noted that, because absolute stored carbon varies among species by orders of magnitude, it dominates the CSI despite the lower spatial weight assigned to aggregated species; the index therefore mainly indicates where carbon is concentrated rather than how evenly it is spatially buffered, which should be borne in mind when interpreting the present results.

4.6. Study Limitations

This study presents limitations that must be considered in the interpretation of results. First, the structural sampling intensity (0.1 ha out of 24 ha, equivalent to 0.42%) is low for a forest with the reported spatial heterogeneity. The high abundance of P. crocea (IVI = 45.12) may partly reflect a bias of the transects toward areas of higher density of this species. Future studies with greater sampling intensity or stratified sampling designs will allow evaluation of the representativeness of the structural analysis.
Second, biomass estimation with a uniform WD value (0.6 t·m−3) may introduce biases in the comparative estimation of carbon by species; although aboveground biomass was estimated with [28] pantropical model, the use of species-specific wood densities (e.g., from a global wood-density database) rather than a single regional value would further reduce this uncertainty. Third, the rarefaction analysis indicated that sampling by individual transect was incomplete (relative completeness between ≈46% and ≈90%), reinforcing the need to expand the structural inventory. Finally, the CVI, CCEI, and CSI indices proposed here are novel tools that require comparative validation at additional sites before generalizing their applicability as indicators of forest carbon sustainability.

5. Conclusions

The El Mangón forest remnant represents one of the floristically richest sub-Andean fragments documented in the department of Cauca and in southwestern Colombia, with a species diversity that reflects the conservation potential of secondary forests with a prolonged history of private protection. The composition of the general inventory—with predominance of epiphytes (44.13%) and significant cryptogamic contributions, including bryophytes and lichens—is consistent with a long-protected, structurally complex canopy. In this intensive agricultural landscape, descriptors such as “microclimate maturity” and “biodiversity refuge” are advanced as hypotheses to be tested with expanded structural sampling, rather than as established status.
Structural analysis indicates an actively regenerating, low-biomass interior stand—four differentiated vertical strata, a Pretzsch Index of 3.21 (64.93% of the theoretical maximum), and an inverse-J size structure with most stems below 8 m and low basal area—consistent with an early-to-intermediate successional phase rather than a mature forest. The structural dominance of P. crocea and the predominance of low-aggregation spatial-distribution patterns are indicators of a community in active competitive reorganization, compatible with a trajectory toward stages of greater forest complexity.
The proposed carbon indices (CVI, CCEI, and CSI) constitute complementary tools to standard floristic and structural analysis by integrating the magnitude of carbon storage with individual species efficiency and the stability associated with their spatial-distribution patterns. Aboveground carbon (72.85 Mg C·ha−1, estimated with [28]) is concentrated in a few large canopy trees, and the CSI differs significantly among spatial-distribution groups (p = 0.003), being higher in aggregated, large-stemmed species; this single-site result requires validation with greater sampling intensity and temporal monitoring.
The potential declaration of the property as a Natural Reserve of Civil Society has a solid ecological basis: the documented floristic richness, the complex vertical structure, the carbon-storage potential, and the uninterrupted history of private conservation justify inclusion of the remnant in national biodiversity-protection instruments. Technical and legal support for the Corporación Autónoma Regional del Cauca is recommended for the declaration process as a landscape-conservation strategy in the municipality of Piendamó.
This contribution helps fill a floristic gap in the Colombian Central Cordillera and provides a quantitative baseline for long-term monitoring. For future research, we recommend: (i) increasing the intensity of structural sampling through stratified designs; (ii) updating the biomass estimation model with species-specific wood densities; (iii) formally documenting the status of introduced species present in the remnant; and (iv) evaluating the connectivity potential of the remnant with other forest fragments in the Río Piendamó corridor.

Author Contributions

Conceptualization, L.E.L.-V.; methodology, L.E.L.-V. and D.J.M.-P.; software, L.E.L.-V. and D.J.M.-P.; validation, J.H.P.R., L.E.L.-V., D.J.M.-P. and J.F.C.-C.; formal analysis, L.E.L.-V., J.H.P.R. and D.J.M.-P.; investigation, L.E.L.-V., D.J.M.-P. and J.F.C.-C.; resources, L.E.L.-V.; data curation, L.E.L.-V. and D.J.M.-P.; writing—original draft preparation, L.E.L.-V.; writing—review and editing, L.E.L.-V., D.J.M.-P. and J.F.C.-C.; visualization, D.J.M.-P. and L.E.L.-V.; supervision, L.E.L.-V.; project administration, L.E.L.-V.; funding acquisition, L.E.L.-V. All authors have read and agreed to the published version of the manuscript.

Funding

This research received no external funding.

Institutional Review Board Statement

The botanical collection was conducted under the Framework Collection Permit for Biological Specimens for Non-commercial Scientific Research, Permit No. 001040 of 30 May 2025, ANLA (Autoridad Nacional de Licencias Ambientales), in accordance with Resolution 1484 of 2014 of the Colombian Ministry of Environment and Sustainable Development (MADS). Voucher specimens were deposited at the CAUP Herbarium of Universidad del Cauca (collection numbers Lelopez-4000 to Lelopez-4281).

Informed Consent Statement

Not applicable.

Data Availability Statement

The data supporting the findings of this study are available from the corresponding author (L.E.L.-V.) upon reasonable request. The complete floristic inventory is provided as (Appendix A).

Acknowledgments

The authors are grateful to the Gómez family for allowing access to the El Mangón forest remnant and for their commitment to the conservation of the site over several generations. The Universidad del Cauca and its Biology Program are thanked for logistical support. The CAUP Herbarium is acknowledged for facilitating the processing of botanical collections. We are also grateful to the SACHAWAIRA Plant Diversity Research Group for support in statistical analyses, and to the Latin American Ethnobotanical Group (GELA) for collaboration in taxonomic identification. We thank Parques Nacionales Naturales de Colombia for institutional support of co-author J.F.C.-C.

Conflicts of Interest

The authors declare no conflicts of interest.

Abbreviations

The following abbreviations are used in this manuscript:
AGBAboveground biomass
ANLAAutoridad Nacional de Licencias Ambientales
BABasal area
BEFBiomass expansion factor
CAUPHerbario de la Universidad del Cauca
CBHCircumference at breast height
CCEICarbon Capture Efficiency Index
CSICarbon Sustainability Index
CVICarbon Valuation Index
DBHDiameter at breast height; D

Appendix A

Complete floristic inventory of the El Mangón sub-Andean forest remnant (Tunía, Piendamó, Cauca, Colombia), comprising 281 species in 209 genera and 99 families, with taxonomic classification and growth-form designation.
Table A1. Complete floristic inventory of the El Mangón sub-Andean forest remnant (Component I; general (non-systematic) collections across 24 ha; 281 species in 209 genera and 99 families). Species are listed alphabetically by family.
FamilySpecies
AcanthaceaeDianthera secunda, Lepidagathis alopecuroidea, Ruellia blechum
ActinidiaceaeSaurauia scabra
AmaranthaceaeAlternanthera porrigens, Alternanthera sessilis, Iresine diffusa
AnacardiaceaeMauria heterophylla, Toxicodendron striatum
AraceaeAnthurium longistamineum, Anthurium microspadix
AraliaceaeOreopanax bogotensis
ArecaceaeGeonoma pinnatifrons
ArthoniaceaeArthonia sp. 1, Herpothallon rubrocinctum, Herpothallon rubroechinatum
AspleniaceaeAsplenium aethiopicum, Asplenium theciferum
AsteraceaeAcmella ciliata, Ageratum conyzoides, Austroeupatorium inulifolium, Baccharis latifolia, Baccharis trinervis, Bidens pilosa, Calea colombiana, Calea sessiliflora, Chromolaena laevigata, Critoniella acuminata, Elephantopus mollis, Pseudelephantopus spiralis, Sonchus asper
BacidiaceaeBacidia biatorina
BartramiaceaeBreutelia chrysea
BrachytheciaceaeBrachythecium plumosum, Brachythecium stereopoma
BrassicaceaeLepidium trianae
BromeliaceaeCipuropsis capituligera, Racinaea fraseri, Racinaea penlandii, Racinaea tenuispica, Tillandsia complanata, Tillandsia fendleri, Tillandsia myriantha
BryaceaeAnomobryum conicum, Anomobryum julaceum, Brachymenium globosum, Bryum andicola, Bryum argenteum, Bryum densifolium, Rhodobryum beyrichianum
CactaceaeRhipsalis sulcata
CaliciaceaeDirinaria applanata, Dirinaria confluens, Pyxine cocoes
CallicostaceaeHypnella diversifolia
CalymperaceaeSyrrhopodon gaudichaudii
CampanulaceaeCentropogon lehmannii
CandelariaceaeCandelaria concolor
ChloranthaceaeHedyosmum bonplandianum, Hedyosmum goudotianum
CoccocarpiaceaeCoccocarpia sp.
CoenogoniaceaeCoenogonium linkii, Coenogonium pinetti
CollemataceaeLeptogium granulatum, Leptogium phyllocarpum
CordiaceaeVarronia acuta
CostaceaeCostus laevis
CryphaeaceaeCryphaea patens, Cryphaea ramosa
CucurbitaceaeMelothria pendula
CyatheaceaeCyathea horrida
CyperaceaeCyperus hermaphroditus, Rhynchospora hieronymi, Rhynchospora nervosa
DaltoniaceaeAdelothecium bogotense
DicranaceaeBryohumbertia filifolia, Campylopus pilifer, Dicranella hilariana, Holomitrium flexuosum, Leucoloma cruegerianum
DryopteridaceaeElaphoglossum burchellii, Elaphoglossum ellipsoideum, Elaphoglossum muscosum, Elaphoglossum paleaceum, Peltapteris flabellata, Polystichum platyphyllum
EuphorbiaceaeAlchornea latifolia, Croton hibiscifolius, Euphorbia hirta
FabaceaeAcaciella angustissima, Desmodium purpusii, Inga densiflora, Inga edulis, Senna hirsuta, Senna pendula, Trifolium repens, Zornia reticulata
FagaceaeQuercus humboldtii
FissidentaceaeFissidens asplenioides, Fissidens lagenarius, Fissidens polypodioides
FrullaniaceaeFrullania sp.
FunariaceaeFunaria hygrometrica
GesneriaceaeBesleria solanoides, Kohleria spicata
GraphidaceaeGraphis chondroplaca
HeliconiaceaeHeliconia burleana, Heliconia gaiboriana, Heliconia griggsiana
HerbertaceaeHerbertus pensilis
HypericaceaeVismia lauriformis
HypnaceaeCtenidium malacodes, Ectropothecium leptochaeton, Isopterygium tenerifolium, Isopterygium tenerum, Mittenothamnium reptans
HypoxidaceaeHypoxis decumbens
LacistemataceaeLacistema aggregatum
LamiaceaeClinopodium brownei, Mesosphaerum pectinatum, Mesosphaerum sidifolium, Ocimum campechianum, Salvia scutellarioides, Salvia tiliifolia, Scutellaria incarnata
LauraceaeAiouea montana, Nectandra acutifolia, Nectandra mollis, Ocotea cuatrecasasii, Ocotea oblonga
LecanoraceaeLecanora argentata
LejeuneaceaeBryopteris filicina, Lejeunea sp.
LeucobryaceaeAtractylocarpus longisetus, Leucobryum antillarum, Leucobryum giganteum
LoranthaceaeOryctanthus spicatus, Passovia pyrifolia
LycopodiaceaeHuperzia linifolia, Lycopodiella cernua, Lycopodium clavatum
LythraceaeCuphea strigulosa
MalpighiaceaeStigmaphyllon bogotense
MalvaceaeHeliocarpus americanus, Pavonia sepioides, Sida rhombifolia, Triumfetta bogotensis, Triumfetta rhomboidea
MarchantiaceaeMarchantia chenopoda
MelastomataceaeArthrostemma ciliatum, Chaetogastra gracilis, Miconia desmantha, Miconia notabilis, Miconia octona, Miconia theaezans, Miconia versicolor, Rhynchanthera mexicana
MeteoriaceaeMeteoridium remotifolium, Meteorium nigrescens, Squamidium leucotrichum
MniaceaePlagiomnium rhynchophorum
MoraceaeOlmedia aspera
MyrtaceaeMyrcia popayanensis, Myrcianthes hallii, Psidium guineense, Syzygium jambos
OctoblepharaceaeOctoblepharum albidum
OrchidaceaeComparettia falcata, Dichaea humilis, Dichaea pendula, Epidendrum melinanthum, Erycina pusilla, Lepanthes tracheia, Oncidium adelaidae, Pleurothallis cordata, Prosthechea grammatoglossa, Rodriguezia granadensis, Stelis argentata, Stelis pusilla, Trizeuxis falcata
OrobanchaceaeCastilleja angustata
OrthotrichaceaeGroutiella chimborazensis, Groutiella tomentosa, Macromitrium guatemaliense, Macromitrium cf. punctatum, Macromitrium richardii
PallaviciniaceaeSymphyogyna brasiliensis
PannariaceaeParmeliella triptophylla
ParmeliaceaeCrespoa crozalsiana, Hypotrachyna sp., Rimelia subisidiosa, Usnea sp.
PeltigeraceaeCrocodia aurata, Sticta hypoglabra
PhysciaceaeLeucodermia leucomelos
PiperaceaePeperomia haematolepis, Peperomia silvivaga, Peperomia tetraphylla, Piper auritum, Piper capillipes, Piper catripense, Piper crassinervium, Piper hartwegianum, Piper hispidum
PlantaginaceaePlantago major
PoaceaeAgrostis perennans, Andropogon aequatoriensis, Chloris radiata, Cynodon nlemfuensis, Digitaria ciliaris, Digitaria horizontalis, Eleusine indica, Eragrostis bahiensis, Homolepis glutinosa, Lasiacis divaricata, Lasiacis ligulata, Lasiacis nigra, Lasiacis sorghoidea, Oplismenus hirtellus, Panicum polygonatum, Paspalum candidum, Paspalum conjugatum, Pseudechinolaena polystachya, Steinchisma laxa, Zeugites americanus
PolygalaceaePolygala asperuloides
PolypodiaceaeCampyloneurum brevifolium, Campyloneurum phyllitidis, Grammitis apiculata, Pecluma plumula, Pleopeltis astrolepis, Pleopeltis macrocarpa, Serpocaulon adnatum, Serpocaulon funckii, Serpocaulon lasiopus, Serpocaulon levigatum
PrimulaceaeMyrsine coriacea, Myrsine guianensis
PteridaceaeAdiantum andicola, Polytaenium lineatum, Radiovittaria gardneriana, Vittaria graminifolia
PterobryaceaeCalyptothecium duplicatum, Hildebrandtiella guyanensis
RamalinaceaeLopezaria versicolor, Ramalina celastri
RoccellaceaeBactrospora sp.
RosaceaeRubus idaeus, Rubus urticifolius
RubiaceaeChiococca alba, Cinchona pubescens, Coccocypselum lanceolatum, Coffea arabica, Ladenbergia oblongifolia, Palicourea angustifolia, Palicourea crocea, Palicourea heterochroma, Palicourea thyrsiflora, Spermacoce capitata
RutaceaeCitrus reticulata
SalicaceaeBanara guianensis
SchizaeaceaeAnemia hirsuta, Anemia villosa
SelaginellaceaeSelaginella diffusa
SematophyllaceaeSematophyllum subpinnatum
SolanaceaeSolanum americanum, Solanum caripense, Solanum quitoense, Solanum sisymbriifolium, Solanum umbellatum
SphagnaceaeSphagnum meridense
TeloschistaceaeGallowayella weberi, Teloschistes flavicans
ThuidiaceaeThuidium peruvianum, Thuidium tomentosum
UrticaceaeCecropia angustifolia, Phenax sonneratii
VerbenaceaeVerbena litoralis
ViburnaceaeViburnum lehmannii
ZingiberaceaeHedychium coronarium, Renealmia ligulata
Table A2. Importance Value Index (IVI), Pielou aggregation index (Ga), and spatial-distribution interpretation for the 35 species recorded in the structural sampling (Component II, n = 498 individuals).
SpeciesIVIGaInterpretation
Aiouea montana17.502.43Aggregated
Alchornea latifolia5.181.53Tendency toward clumping
Banara guianensis1.860.04Low aggregation
Cecropia angustifolia2.960.90Low aggregation
Cinchona pubescens4.590.87Low aggregation
Citrus reticulata1.480.90Low aggregation
Coffea arabica9.150.90Low aggregation
Costus laevis1.480.90Low aggregation
Geonoma pinnatifrons19.352.82Aggregated
Hedyosmum bonplandianum5.460.90Low aggregation
Heliconia griggsiana19.600.17Low aggregation
Inga densiflora4.390.09Low aggregation
Lacistema aggregatum22.182.48Aggregated
Miconia notabilis5.772.18Aggregated
Miconia octona3.161.17Tendency toward clumping
Miconia theaezans1.710.90Low aggregation
Myrcia popayanensis3.151.17Tendency toward clumping
Myrcianthes hallii1.500.90Low aggregation
Myrsine coriacea12.360.78Low aggregation
Myrsine guianensis17.312.36Aggregated
Nectandra acutifolia3.921.96Tendency toward clumping
Nectandra mollis2.450.90Low aggregation
Ocotea oblonga2.680.90Low aggregation
Olmedia aspera17.8515.28Aggregated
Oreopanax bogotensis5.200.65Low aggregation
Palicourea angustifolia3.251.17Tendency toward clumping
Palicourea crocea45.123.60Aggregated
Palicourea heterochroma2.091.79Tendency toward clumping
Palicourea thyrsiflora17.512.43Aggregated
Piper crassinervium3.670.90Low aggregation
Piper hartwegianum10.950.09Low aggregation
Piper hispidum11.410.74Low aggregation
Quercus humboldtii6.520.13Low aggregation
Syzygium jambos5.762.18Aggregated
Toxicodendron striatum1.460.90Low aggregation

References

  1. Alvarado-Reyes, A.J.; Rosero-Lasprilla, L.; Jara-Muñoz, O.A. Estructura y composición florística de un bosque subandino en Togüí (Boyacá, Colombia). Biota Colomb. 2024, 25, e1202. [Google Scholar] [CrossRef] [Scilit]
  2. Alvear, M.; Betancur, J.; Franco-Rosselli, P. Diversidad florística y estructura de remanentes de bosque andino en la zona de amortiguación del Parque Nacional Natural Los Nevados, Cordillera Central Colombiana. Caldasia 2010, 32, 39–63. [Google Scholar]
  3. Anzoátegui, L.V.; Gil-Leguizamón, P.A.; Sanabria-Marín, R. Frontera agrícola y multitemporalidad de cobertura vegetal en Páramo del Parque Regional Natural Cortadera (Boyacá, Colombia). Bosque 2023, 44, 159–170. [Google Scholar] [CrossRef] [Scilit]
  4. IDEAM; MADS. Actualización de Cifras de Monitoreo de la Superficie de Bosque—Año 2024. Resumen de Resultados de Monitoreo; IDEAM-MADS: Bogotá, Colombia, 2025. [Google Scholar]
  5. IDEAM. Tasa Anual de Deforestación Según Departamento, 1990–2024; Sistema de Monitoreo de Bosques y Carbono; IDEAM: Bogotá, Colombia, 2025. [Google Scholar]
  6. Armenteras, D.; Rodríguez, N. Dinámicas y causas de deforestación en bosques de Latinoamérica: Una revisión desde 1990. Colomb. For. 2014, 17, 233–246. [Google Scholar] [CrossRef] [Scilit]
  7. Galindo-T, R.; Betancur, J.; Cadena-M, J.J. Estructura y composición florística de cuatro bosques andinos del Santuario de Flora y Fauna Guanentá-Alto Río Fonce, Cordillera Oriental Colombiana. Caldasia 2003, 25, 313–335. [Google Scholar]
  8. Ariza Cortés, W.; Toro Murillo, J.L.; Lores Medina, A. Análisis florístico y estructural de los bosques premontanos en el municipio de Amalfi (Antioquia, Colombia). Colomb. For. 2009, 12, 81–102. [Google Scholar] [CrossRef] [Scilit]
  9. Trujillo, W.F.; Henao, M.M. Riqueza florística y recambio de especies en la vertiente orinoquense de los Andes, Colombia. Colomb. For. 2018, 21, 18–33. [Google Scholar] [CrossRef] [Scilit]
  10. Franco-Rosselli, P.; Betancur, J.; Fernández-Alonso, J.L. Diversidad florística en dos bosques subandinos del sur de Colombia. Caldasia 1997, 19, 205–234. [Google Scholar] [CrossRef] [Scilit]
  11. Sanín, D.; Duque, C.A. Estructura y composición florística de dos transectos localizados en la Reserva Forestal Protectora Río Blanco (Manizales, Caldas, Colombia). Bol. Cient. Mus. Hist. Nat. Univ. Caldas 2006, 10, 45–75. [Google Scholar]
  12. Rangel-Ch, J.O.; Lozano-C, G. Un perfil de vegetación entre La Plata (Huila) y el Volcán del Puracé. Caldasia 1986, 14, 503–547. [Google Scholar]
  13. Vallejo-Mayo, L.Y.; Rivera-Díaz, O. Inventario florístico en áreas de bosque andino de la cordillera central de Colombia (El Peñol, Antioquia). Caldasia 2022, 44, 8–18. [Google Scholar] [CrossRef] [Scilit]
  14. López Vargas, L.E.; Becoche Mosquera, J.M.; Macías Pinto, D.J.; Ruiz Montoya, K.; Velasco Reyes, A.; Pineda, S. Estructura y composición florística de la Reserva Forestal—Institución Educativa Cajete, Popayán (Cauca). Luna Azul 2015, 41, 131–151. [Google Scholar] [CrossRef] [Scilit]
  15. Bolaños, G.Y.; Feuillet, C.; Chito, E.; Muñoz, E.L.; Ramírez Padilla, B.R. Vegetación, estructura y composición de un área boscosa en el jardín botánico “Álvaro José Negret”, vereda La Rejoya, Popayán (Cauca, Colombia). Bol. Cient. Mus. Hist. Nat. Univ. Caldas 2010, 14, 19–38. [Google Scholar]
  16. Segura-Madrigal, M.A.; Andrade, H.J.; Sierra-Ramírez, E. Diversidad florística y captura de carbono en robledales y pasturas con árboles en Santa Isabel, Tolima, Colombia. Rev. Biol. Trop. 2020, 68, 383–393. [Google Scholar] [CrossRef] [Scilit]
  17. Aragón, S.; Salinas, N.; Nina-Quispe, A.; Huaman Qquellon, V.; Rayme Paucar, G.; Huaman, W.; Chambi Porroa, P.; Olarte, J.C.; Cruz, R.; Muñiz, J.G.; et al. Aboveground biomass in secondary montane forests in Peru: Slow carbon recovery in agroforestry legacies. Glob. Ecol. Conserv. 2021, 28, e01696. [Google Scholar] [CrossRef] [Scilit]
  18. Ojoatre, S.; Barlow, J.; Jacobs, S.R.; Rufino, M.C. Recovery of aboveground biomass, soil carbon stocks and species diversity in tropical montane secondary forests of East Africa. For. Ecol. Manag. 2024, 552, 121569. [Google Scholar] [CrossRef] [Scilit]
  19. Mueller-Dombois, D.; Ellenberg, H. Aims and Methods of Vegetation Ecology; John Wiley & Sons: New York, NY, USA, 1974. [Google Scholar]
  20. World Flora Online Consortium. World Flora Online. Published on the Internet. Available online: https://www.worldfloraonline.org/ (accessed on 30 June 2025).
  21. Hsieh, T.C.; Ma, K.H.; Chao, A. iNEXT: An R package for rarefaction and extrapolation of species diversity (Hill numbers). Methods Ecol. Evol. 2016, 7, 1451–1456. [Google Scholar] [CrossRef] [Scilit]
  22. R Core Team. R: A Language and Environment for Statistical Computing; Version 4.3.0; R Foundation for Statistical Computing: Vienna, Austria, 2023; Available online: https://www.R-project.org/ (accessed on 15 March 2025).
  23. Pretzsch, H. Forest Dynamics, Growth and Yield: From Measurement to Model; Springer: Berlin/Heidelberg, Germany, 2009. [Google Scholar] [CrossRef] [Scilit]
  24. Scott, D.W. On optimal and data-based histograms. Biometrika 1979, 66, 605–610. [Google Scholar] [CrossRef]
  25. Ogawa, H.; Yoda, K.; Ogino, K.; Kira, T. Comparative ecological studies on three main types of forest vegetation in Thailand. II. Plant biomass. Nat. Life Southeast Asia 1965, 4, 49–80. [Google Scholar] [CrossRef] [Scilit]
  26. FAO. Global Forest Resources Assessment 2000: Main Report; FAO Forestry Paper 140; FAO: Rome, Italy, 2001. [Google Scholar]
  27. IPCC. 2019 Refinement to the 2006 IPCC Guidelines for National Greenhouse Gas Inventories. In Volume 4: Agriculture, Forestry and Other Land Use; Calvo Buendia, E., Tanabe, K., Kranjc, A., Baasansuren, J., Fukuda, M., Ngarize, S., Osako, A., Pyrozhenko, Y., Shermanau, P., Federici, S., Eds.; IPCC: Geneva, Switzerland, 2019. [Google Scholar]
  28. Chave, J.; Réjou-Méchain, M.; Búrquez, A.; Chidumayo, E.; Colgan, M.S.; Delitti, W.B.C.; Duque, A.; Eid, T.; Fearnside, P.M.; Goodman, R.C.; et al. Improved allometric models to estimate the aboveground biomass of tropical trees. Glob. Change Biol. 2014, 20, 3177–3190. [Google Scholar] [CrossRef] [Scilit] [PubMed]
  29. Oksanen, J.; Simpson, G.L.; Blanchet, F.G.; Kindt, R.; Legendre, P.; Minchin, P.R.; O’Hara, R.B.; Solymos, P.; Stevens, M.H.H.; Szoecs, E.; et al. Vegan: Community Ecology Package; R package Version 2.6-4; Comprehensive R Archive Network (CRAN), R Foundation for Statistical Computing: Vienna, Austria, 2022; Available online: https://CRAN.R-project.org/package=vegan (accessed on 15 March 2025).
  30. Wickham, H. ggplot2: Elegant Graphics for Data Analysis; Springer: Cham, Switzerland, 2016. [Google Scholar] [CrossRef] [Scilit]
  31. Wickham, H.; François, R.; Henry, L.; Müller, K.; Vaughan, D. dplyr: A Grammar of Data Manipulation, R Package Version 1.1.2. 2023. Available online: https://CRAN.R-project.org/package=dplyr (accessed on 15 March 2025).
  32. Murcia, C.; Guariguata, M.R.; Peralvo, M.; Gálmez, V. La Restauración de Bosques Andinos Tropicales: Avances, Desafíos y Perspectivas del Futuro; Documentos Ocasionales 170; CIFOR: Bogor, Indonesia, 2017. [Google Scholar] [CrossRef] [Scilit]
  33. Rodríguez-Lombana, A.R.; Beltrán-Gutiérrez, H.E.; Moreno, A.C. Caracterización florística del bosque subandino y algunas áreas disturbadas en San Bernardo (Cundinamarca), Colombia. Biota Colomb. 2017, 18, 43–72. [Google Scholar] [CrossRef] [Scilit]
  34. Gentry, A.H.; Dodson, C.H. Diversity and biogeography of Neotropical vascular epiphytes. Ann. Mo. Bot. Gard. 1987, 74, 205–233. [Google Scholar] [CrossRef] [Scilit]
  35. Freund, C.A.; Silman, M.R. Developing a more complete understanding of tropical montane forest disturbance ecology through landslide research. Front. For. Glob. Change 2023, 6, 1091387. [Google Scholar] [CrossRef] [Scilit]
  36. Herazo Vitola, F.; Carrascal Prasca, D.; Herrera Castillo, M.; Valencia-Cuéllar, D.S. Inventario florístico de plantas vasculares en fragmentos de bosque seco tropical en el departamento Magdalena, Colombia. Acta Bot. Mex. 2021, 128, e1828. [Google Scholar] [CrossRef] [Scilit]
  37. Holguín-Estrada, V.A.; Alanís-Rodríguez, E.; Aguirre-Calderón, O.A.; Yerena-Yamallel, J.I.; Pequeño-Ledezma, M.A. Estructura vertical de un bosque de galería en un gradiente altitudinal en el noroeste de México. Polibotánica 2021, 51, 55–71. [Google Scholar] [CrossRef] [Scilit]
  38. Montes de Oca-Cano, E.; Salvador-García, Á.; Nájera-Luna, J.A.; Corral-Rivas, S.; Méndez González, J. Ecuaciones alométricas para estimar biomasa y carbono en Trichospermum mexicanum (DC.) Baill. Colomb. For. 2020, 23, 89–98. [Google Scholar] [CrossRef] [Scilit]
  39. Beugnon, R.; Albert, G.; Hähn, G.; Yu, W.; Haider, S.; Hättenschwiler, S.; Davrinche, A.; Rosenbaum, B.; Gauzens, B.; Eisenhauer, N. Improving forest ecosystem functions by optimizing tree species spatial arrangement. Nat. Commun. 2025, 16, 6286. [Google Scholar] [CrossRef] [Scilit] [PubMed]
Figure 1. Geographic location of the El Mangón sub-Andean forest remnant in the corregimiento of Tunía, municipality of Piendamó, department of Cauca, southwestern Colombia (1600–1700 m a.s.l., 24 ha). The red square indicates the sampling area located in the municipality of Piendamó, corregimiento of Tunía. The Inset shows the position of the department of Cauca within Colombia. The five 50 × 4 m structural transects (Component II) are marked and numbered (1–5) within the remnant. Source: Own elaboration using QGIS software (version 3.34), based on Esri basemaps and satellite imagery, with data from Esri, Maxar, Earthstar Geographics, HERE, Garmin, USGS, Intermap, INCREMENT P, NRCan, OpenStreetMap contributors, and the GIS User Community.
Biology 15 01154 g001
Figure 2. Comparison of alpha diversity indices computed for the El Mangón forest remnant (Component II; n = 498 individuals; 35 species). Bars show normalized values (0–1) for visual comparison; numerical labels above each bar indicate the original index values. Shannon–Wiener (H′) = 2.55; Simpson (1-D) = 0.89; Pielou (J′) = 0.72; Margalef (DMg) = 5.47. Color codes: green = high level; orange = medium level.
Biology 15 01154 g002
Figure 3. Individual-based rarefaction curves for the five 50 × 4 m transects sampled in the El Mangón remnant, standardized to n = 52 individuals (smallest transect size; vertical dashed line). Each curve represents the expected species richness as a function of the number of sampled individuals.
Biology 15 01154 g003
Figure 4. Rarefaction (solid lines) and extrapolation (dashed lines) curves of Hill numbers (q = 0, q = 1, q = 2) for the five 50 × 4 m transects of the El Mangón remnant. q = 0: species richness; q = 1: exponential of Shannon entropy; q = 2: inverse Simpson concentration. Shaded bands represent 95% bootstrap confidence intervals (999 iterations). iNEXT package [21] in R v4.3.0 [22].
Biology 15 01154 g004
Figure 5. Importance Value Index (IVI) of the sixteen most ecologically dominant species in the El Mangón forest remnant (Component II; n = 498 individuals; 35 species). P.cro. = Palicourea crocea · L.a. = Lacistema aggregatum · H.g. = Heliconia griggsiana · G.p. = Geonoma pinnatifrons · O.a. = Olmedia aspera · P.t. = Palicourea thyrsiflora · A.m. = Aiouea montana · M.g. = Myrsine guianensis · M.c. = Myrsine coriacea · P.hi. = Piper hispidum · P.ha. = Piper hartwegianum · C.ar. = Coffea arabica · Q.h. = Quercus humboldtii · M.n. = Miconia notabilis · S.j. = Syzygium jambos · H.b. = Hedyosmum bonplandianum.
Biology 15 01154 g005
Figure 6. Box plots of diameter at breast height (DBH, cm) for the 35 species recorded in the structural sampling (Component II; n = 498 individuals). Boxes show the interquartile range; horizontal lines denote the median; whiskers extend to 1.5 × IQR; points indicate outliers. Myrcianthes hallii, Myrcia popayanensis, and Palicourea heterochroma show the largest median DBH; small-stemmed species cluster on the right of the panel. A.l. = Alchornea latifolia · A.m. = Aiouea montana · B.g. = Banara guianensis · C.an. = Cecropia angustifolia · C.ar. = Coffea arabica · C.l. = Costus laevis · C.p. = Cinchona pubescens · C.r. = Citrus reticulata · G.p. = Geonoma pinnatifrons · H.b. = Hedyosmum bonplandianum · H.g. = Heliconia griggsiana · I.d. = Inga densiflora · L.a. = Lacistema aggregatum · M.c. = Myrsine coriacea · M.g. = Myrsine guianensis · M.h. = Myrcianthes hallii · M.n. = Miconia notabilis · M.o. = Miconia octona · M.p. = Myrcia popayanensis · M.t. = Miconia theaezans · N.a. = Nectandra acutifolia · N.m. = Nectandra mollis · O.a. = Olmedia aspera · O.b. = Oreopanax bogotensis · O.o. = Ocotea oblonga · P.a. = Palicourea angustifolia · P.cra. = Piper crassinervium · P.cro. = Palicourea crocea · P.ha. = Piper hartwegianum · P.he. = Palicourea heterochroma · P.hi. = Piper hispidum · P.t. = Palicourea thyrsiflora · Q.h. = Quercus humboldtii · S.j. = Syzygium jambos · T.s. = Toxicodendron striatum.
Biology 15 01154 g006
Figure 7. Ogawa diagram with linear regression for the El Mangón forest remnant (n = 498 individuals; R2 = 0.51). Total height (Ht, m) is plotted against stem height (Hf, m). Solid blue line: linear regression; shaded band: 95% confidence interval; dashed red line: 1:1 reference line. The diagram reveals an asymmetric height distribution with strong concentration of individuals in lower and intermediate classes.
Biology 15 01154 g007
Figure 8. Box plots of total height (Ht, m) by species recorded in the structural sampling of El Mangón (Component II; n = 498 individuals). Boxes show the interquartile range; horizontal lines denote the median; whiskers extend to 1.5 × IQR; points indicate outliers. A.l. = Alchornea latifolia · A.m. = Aiouea montana · B.g. = Banara guianensis · C.an. = Cecropia angustifolia · C.ar. = Coffea arabica · C.l. = Costus laevis · C.p. = Cinchona pubescens · C.r. = Citrus reticulata · G.p. = Geonoma pinnatifrons · H.b. = Hedyosmum bonplandianum · H.g. = Heliconia griggsiana · I.d. = Inga densiflora · L.a. = Lacistema aggregatum · M.c. = Myrsine coriacea · M.g. = Myrsine guianensis · M.h. = Myrcianthes hallii · M.n. = Miconia notabilis · M.o. = Miconia octona · M.p. = Myrcia popayanensis · M.t. = Miconia theaezans · N.a. = Nectandra acutifolia · N.m. = Nectandra mollis · O.a. = Olmedia aspera · O.b. = Oreopanax bogotensis · O.o. = Ocotea oblonga · P.a. = Palicourea angustifolia · P.cra. = Piper crassinervium · P.cro. = Palicourea crocea · P.ha. = Piper hartwegianum · P.he. = Palicourea heterochroma · P.hi. = Piper hispidum · P.t. = Palicourea thyrsiflora · Q.h. = Quercus humboldtii · S.j. = Syzygium jambos · T.s. = Toxicodendron striatum.
Biology 15 01154 g008
Figure 9. Carbon Valuation Index (CVI) of the most relevant species in the El Mangón remnant (Component II), calculated according to Equation (12). Myrsine guianensis leads the index (CVI = 2.71), followed by Alchornea latifolia (1.67) and Palicourea crocea (1.65). Numerical labels indicate the CVI value of each species.
Biology 15 01154 g009
Figure 10. Carbon Capture Efficiency Index (CCEI = Carbon/(IVI × Density)) of the species with the highest values in the El Mangón remnant, calculated according to Equation (13). With aboveground carbon re-estimated using the [28] model, the highest CCEI values correspond to rare, large-stemmed native species (Myrcianthes hallii, Alchornea latifolia, Cinchona pubescens); a high CCEI flags low-density, physiologically efficient storers irrespective of native status (see Section 4.5).
Biology 15 01154 g010
Figure 11. Principal Component Analysis (PCA) biplot of structural and functional variables for the species recorded in Component II. PC1 = 59.4% of variance; PC2 = 20.2% (cumulative = 79.6%), computed on ten standardized variables (biomass, carbon, IVI, relative abundance, relative frequency, relative dominance, Shannon and Simpson contributions, Pielou Ga, density; mean = 0, SD = 1) with carbon re-estimated using [28]. Colored ellipses indicate the four functional groups identified by k-means partitioning.
Biology 15 01154 g011
Figure 12. Carbon Sustainability Index (CSI) according to spatial-pattern group in the El Mangón remnant. Boxes show the distribution of individual species CSI values for three groups: aggregated/grouped (Ga > 2; 9 spp.), dispersed/low aggregation (Ga < 1; 20 spp.), and species with tendency toward grouping (1 ≤ Ga ≤ 2). Boxes show interquartile range; horizontal lines indicate the median; whiskers extend to 1.5 × IQR; points are outliers. Differences among groups were statistically significant (Kruskal–Wallis, p = 0.003), the low-aggregation group showing lower CSI than the clumping-tendency and aggregated groups (corrected carbon, [28]).
Biology 15 01154 g012
Table 1. Spatial factor (Fspatial) applied in the calculation of the Carbon Sustainability Index (CSI) according to the Pielou aggregation index (Ga).
Distribution Pattern (Ga)FspatialCriterion
Low aggregation (Ga < 1)1.00Dispersed/regular distribution
Tendency toward clumping (1 ≤ Ga ≤ 2)0.75Intermediate pattern
Aggregated (Ga > 2)0.50Aggregated pattern
Other cases0.75Default value
Table 2. Ten most diverse plant families recorded in the El Mangón sub-Andean forest remnant (Component I, general (non-systematic) floristic inventory across 24 ha). Total richness = 281 species in 99 families.
FamilySpecies% of Total
Poaceae207.12
Asteraceae134.63
Orchidaceae134.63
Polypodiaceae103.56
Rubiaceae103.56
Piperaceae93.20
Fabaceae82.85
Melastomataceae82.85
Bromeliaceae72.49
Bryaceae72.49
Subtotal (10 most diverse families)10537.40
Total281100.00
Table 3. Observed, rarefied (n = 52), and asymptotically estimated richness (Hill numbers, q = 0) by transect. Relative completeness = observed S/estimated asymptotic S. Analysis with iNEXT [21] in R v4.3.0 [22].
TransectNS obs.S raref. (n = 52)SES asympt.95% CIComplet.
Transect 1521515.000.00030.715.0–64.4≈49%
Transect 21241510.851.34832.915.0–58.7≈46%
Transect 31121813.461.51120.118.0–34.1≈90%
Transect 41071411.311.18521.914.0–39.0≈64%
Transect 51001713.111.39829.117.0–53.0≈58%
Disclaimer/Publisher’s Note: The statements, opinions and data contained in all publications are solely those of the individual author(s) and contributor(s) and not of MDPI and/or the editor(s). MDPI and/or the editor(s) disclaim responsibility for any injury to people or property resulting from any ideas, methods, instructions or products referred to in the content.