
Proteomic and Functional Analysis Reveals Temperature-Driven Immune Evasion Strategies of Streptococcus iniae in Yellowfin Seabream (Acanthopagrus latus)


Simple Summary
Abstract
1. Introduction
2. Materials and Methods
2.1. Experimental Fish
2.2. Survival Assay
2.3. Proteomic Sequencing
2.4. Leukocyte Isolation
2.5. S. iniae Stimulation and qPCR Analysis
2.6. Apoptosis, ROS, and NO Levels
2.7. Bacterial Labeling and Phagocytosis Assay
2.8. Statistical Analysis
3. Results
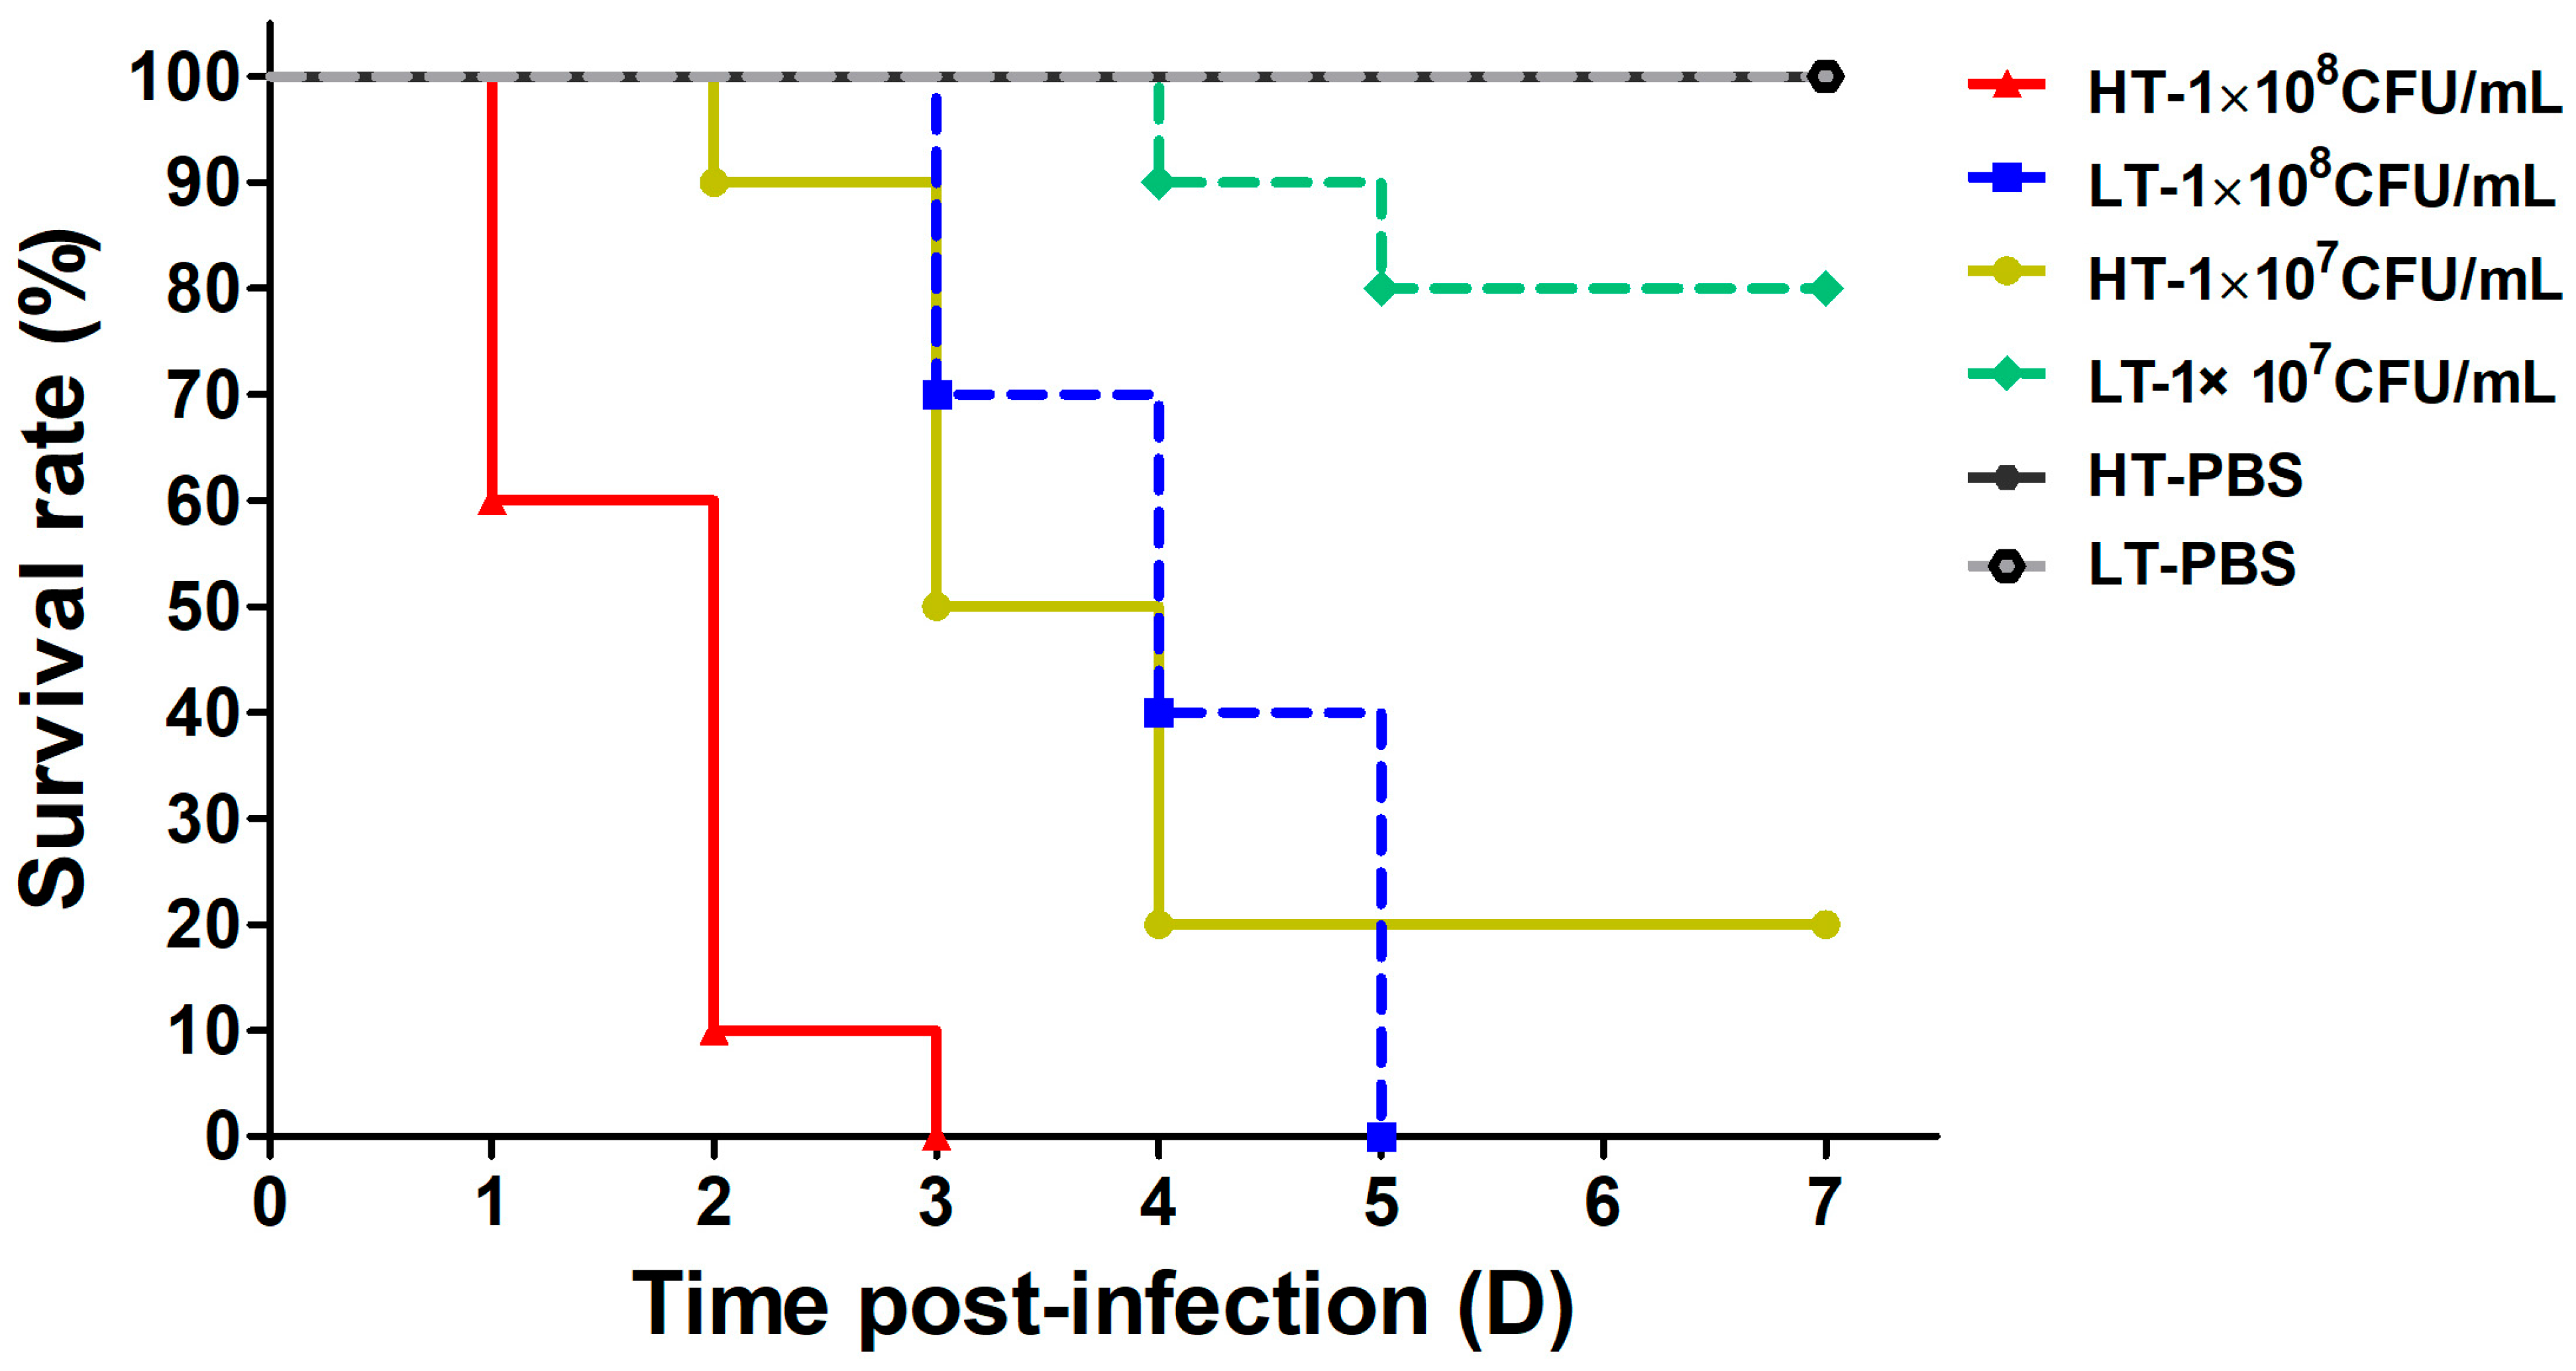
3.1. Survival Rate
3.2. S. iniae NS-1 Proteomic Sequencing
3.3. Leukocyte Kinetics After Stimulation
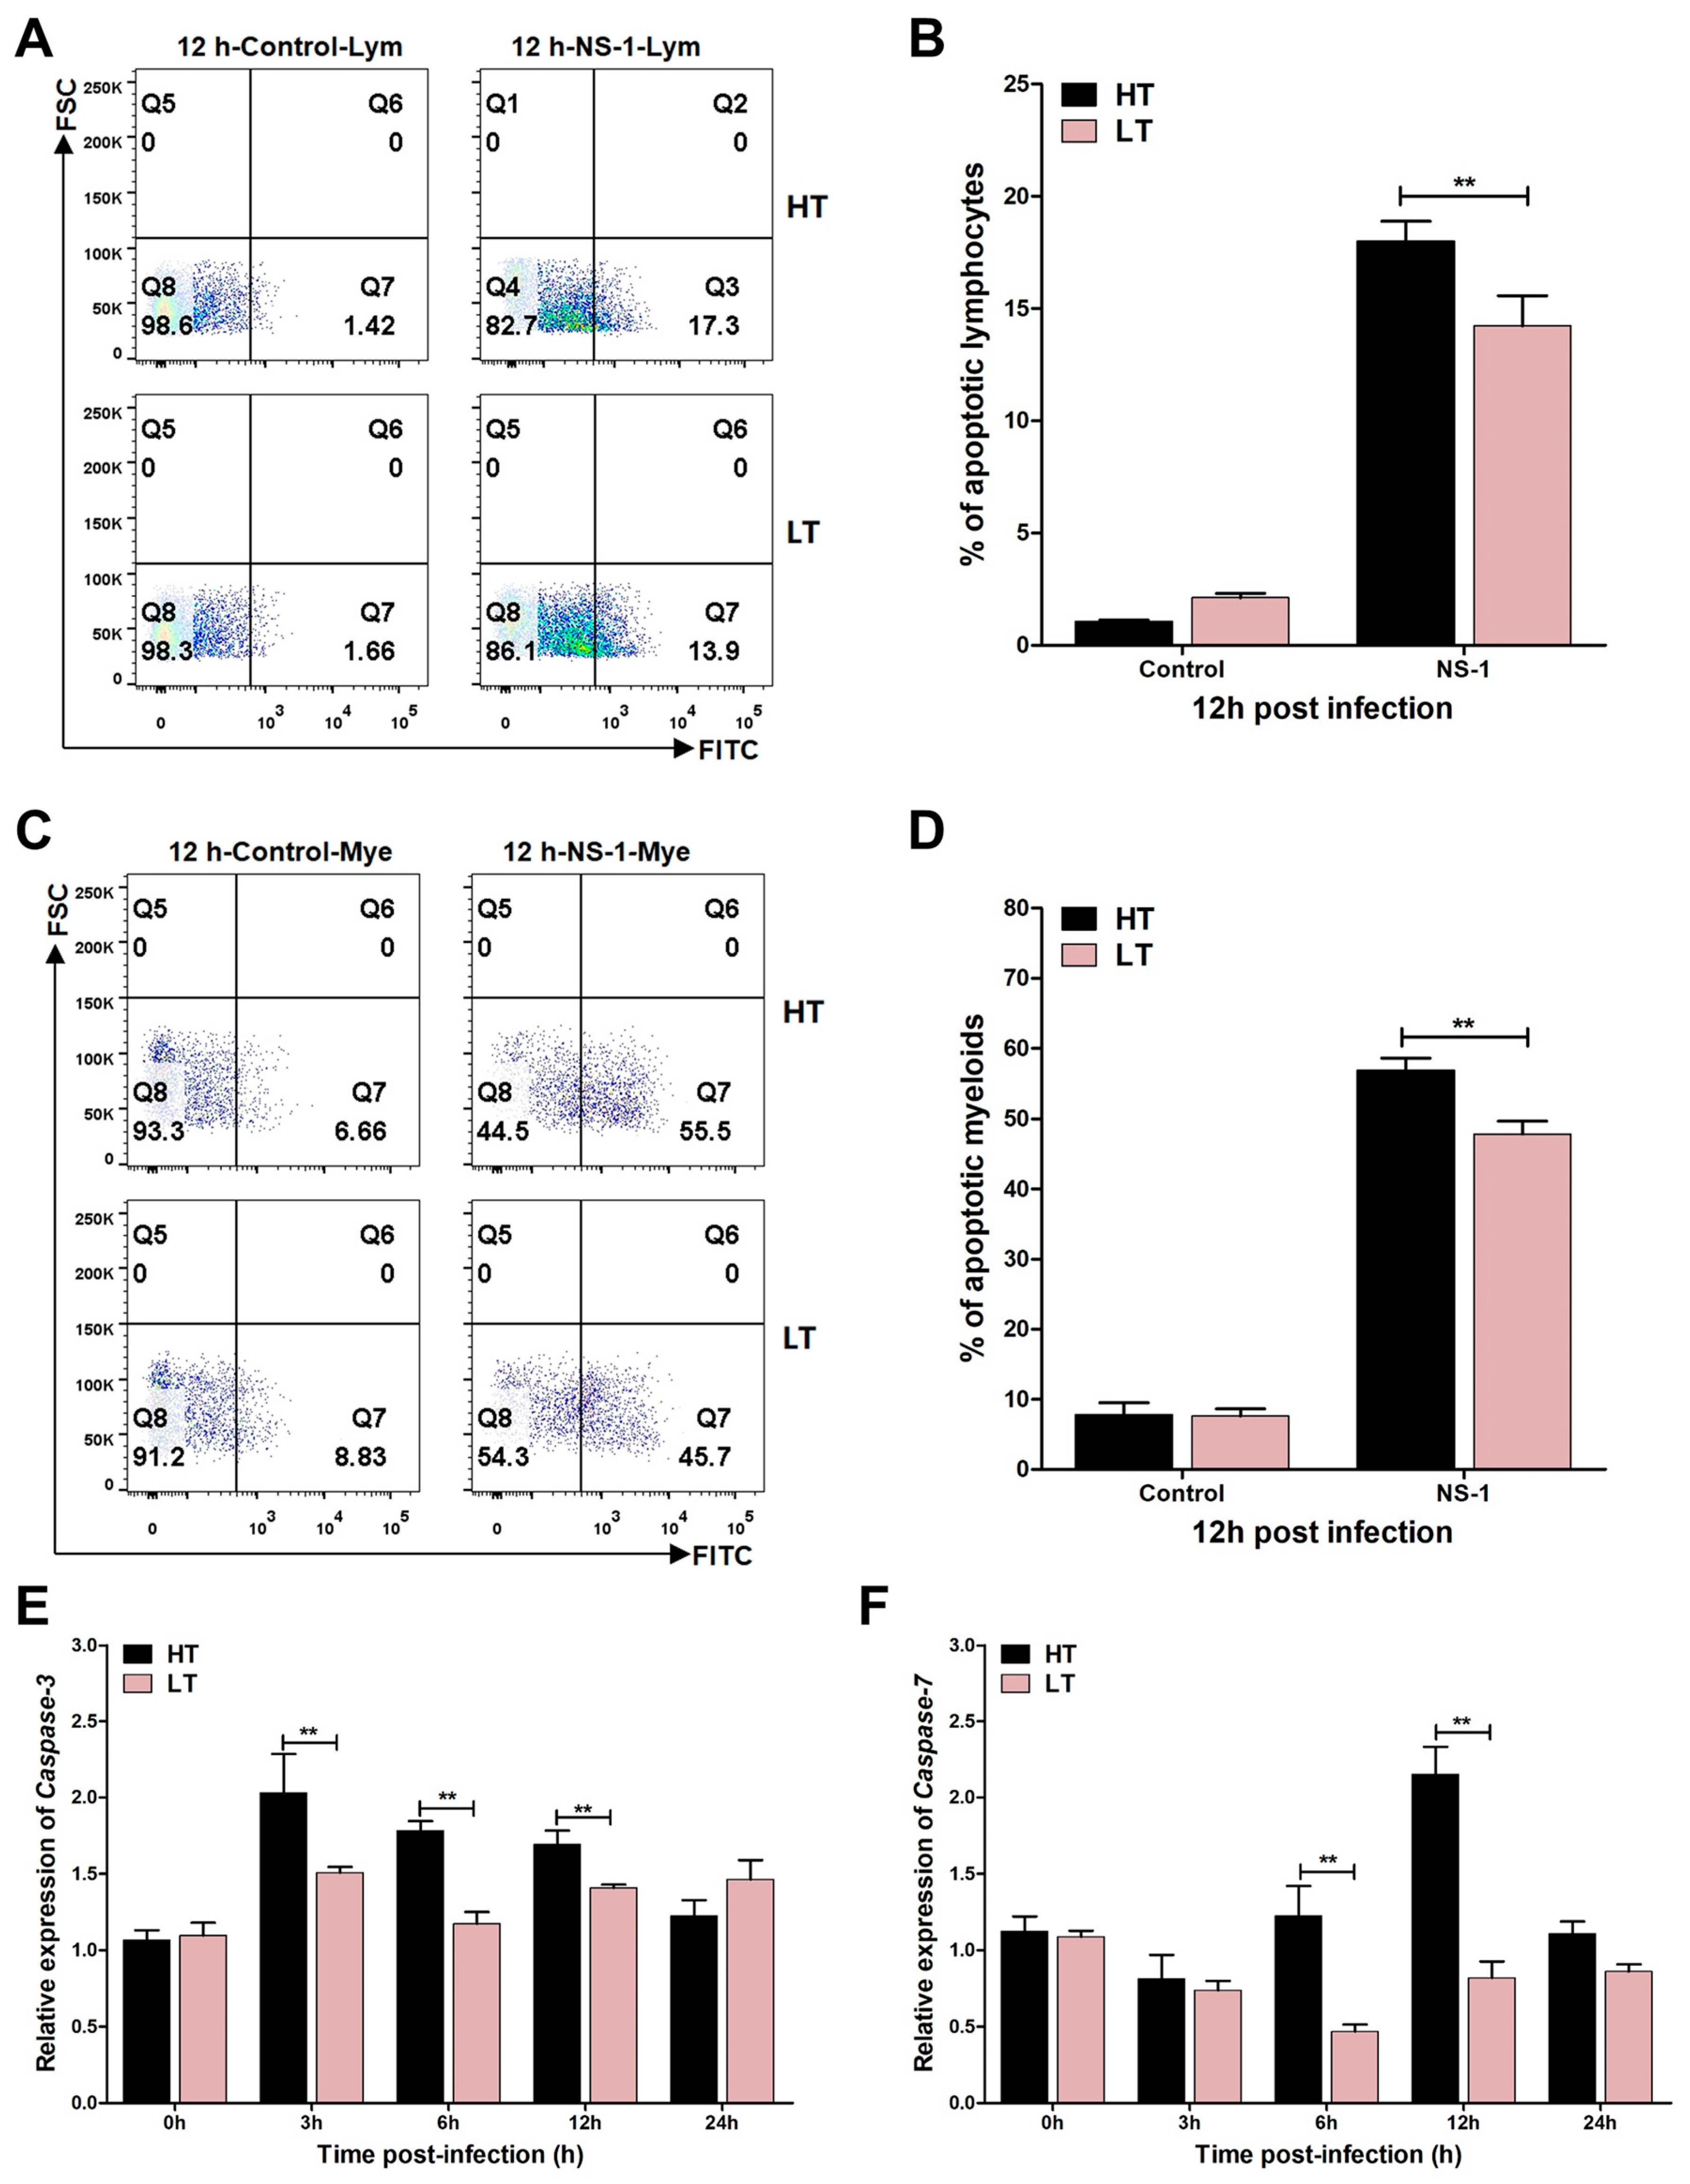
3.4. Levels of Apoptosis
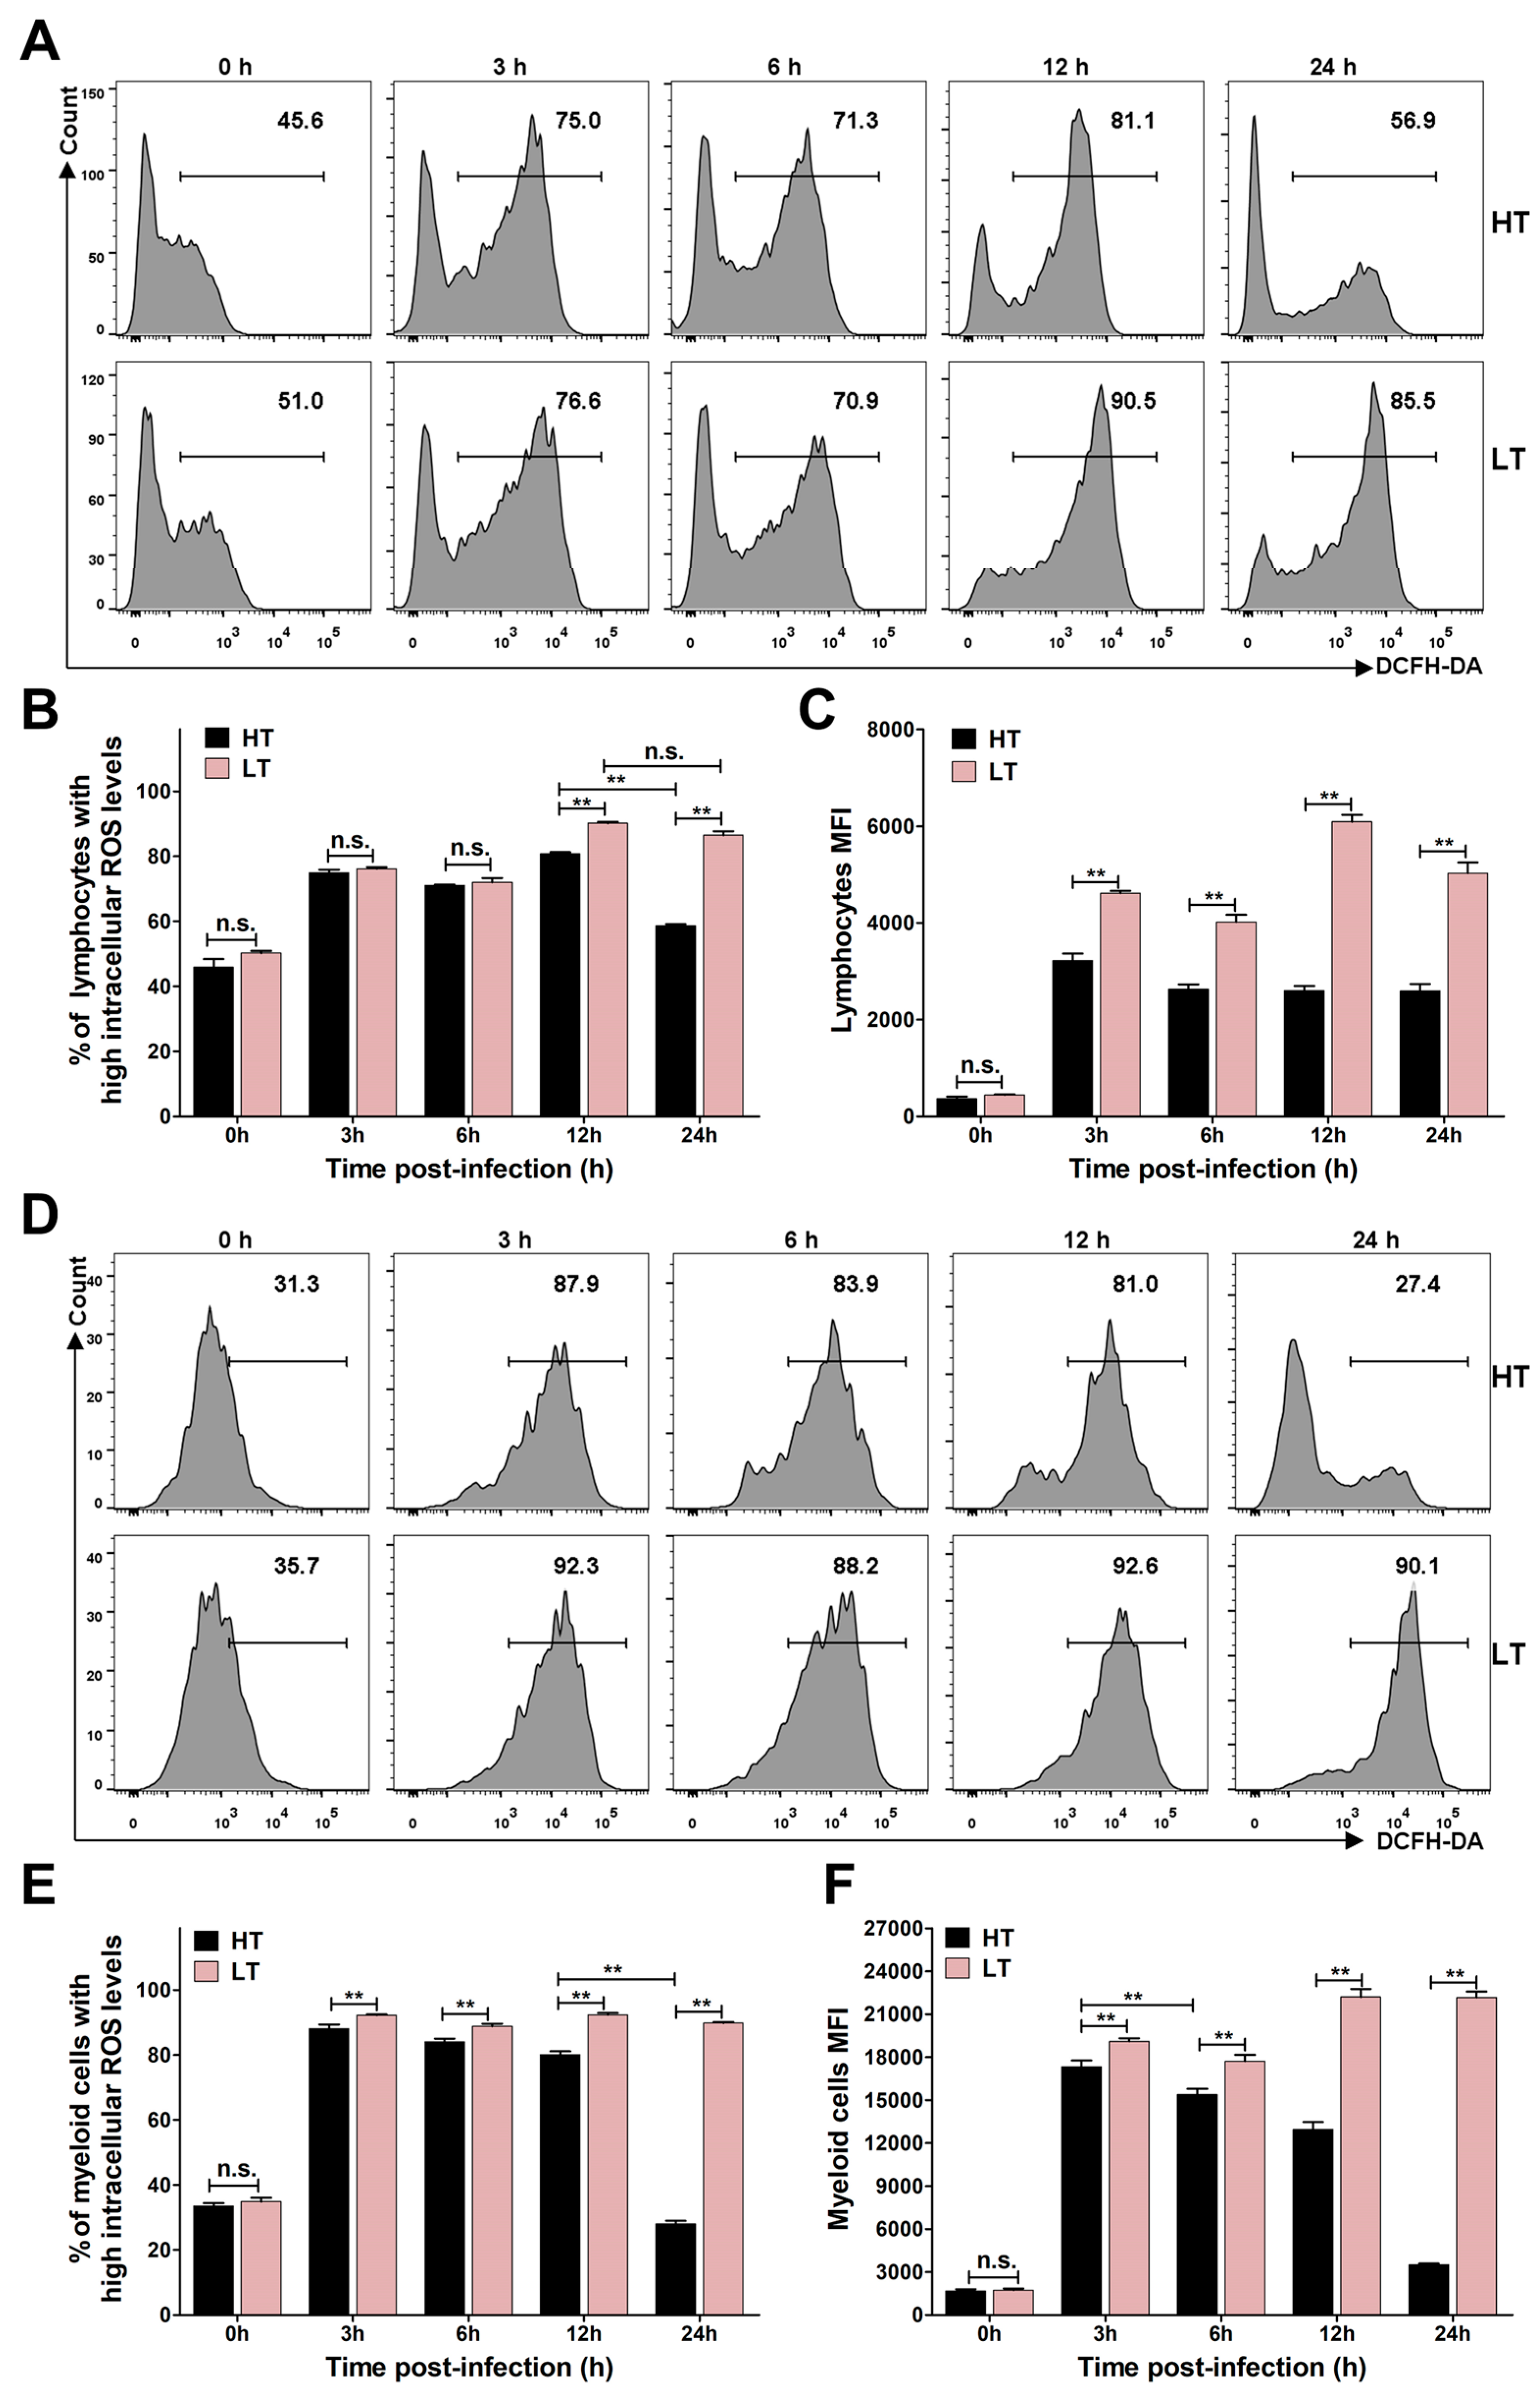
3.5. Levels of ROS and NO
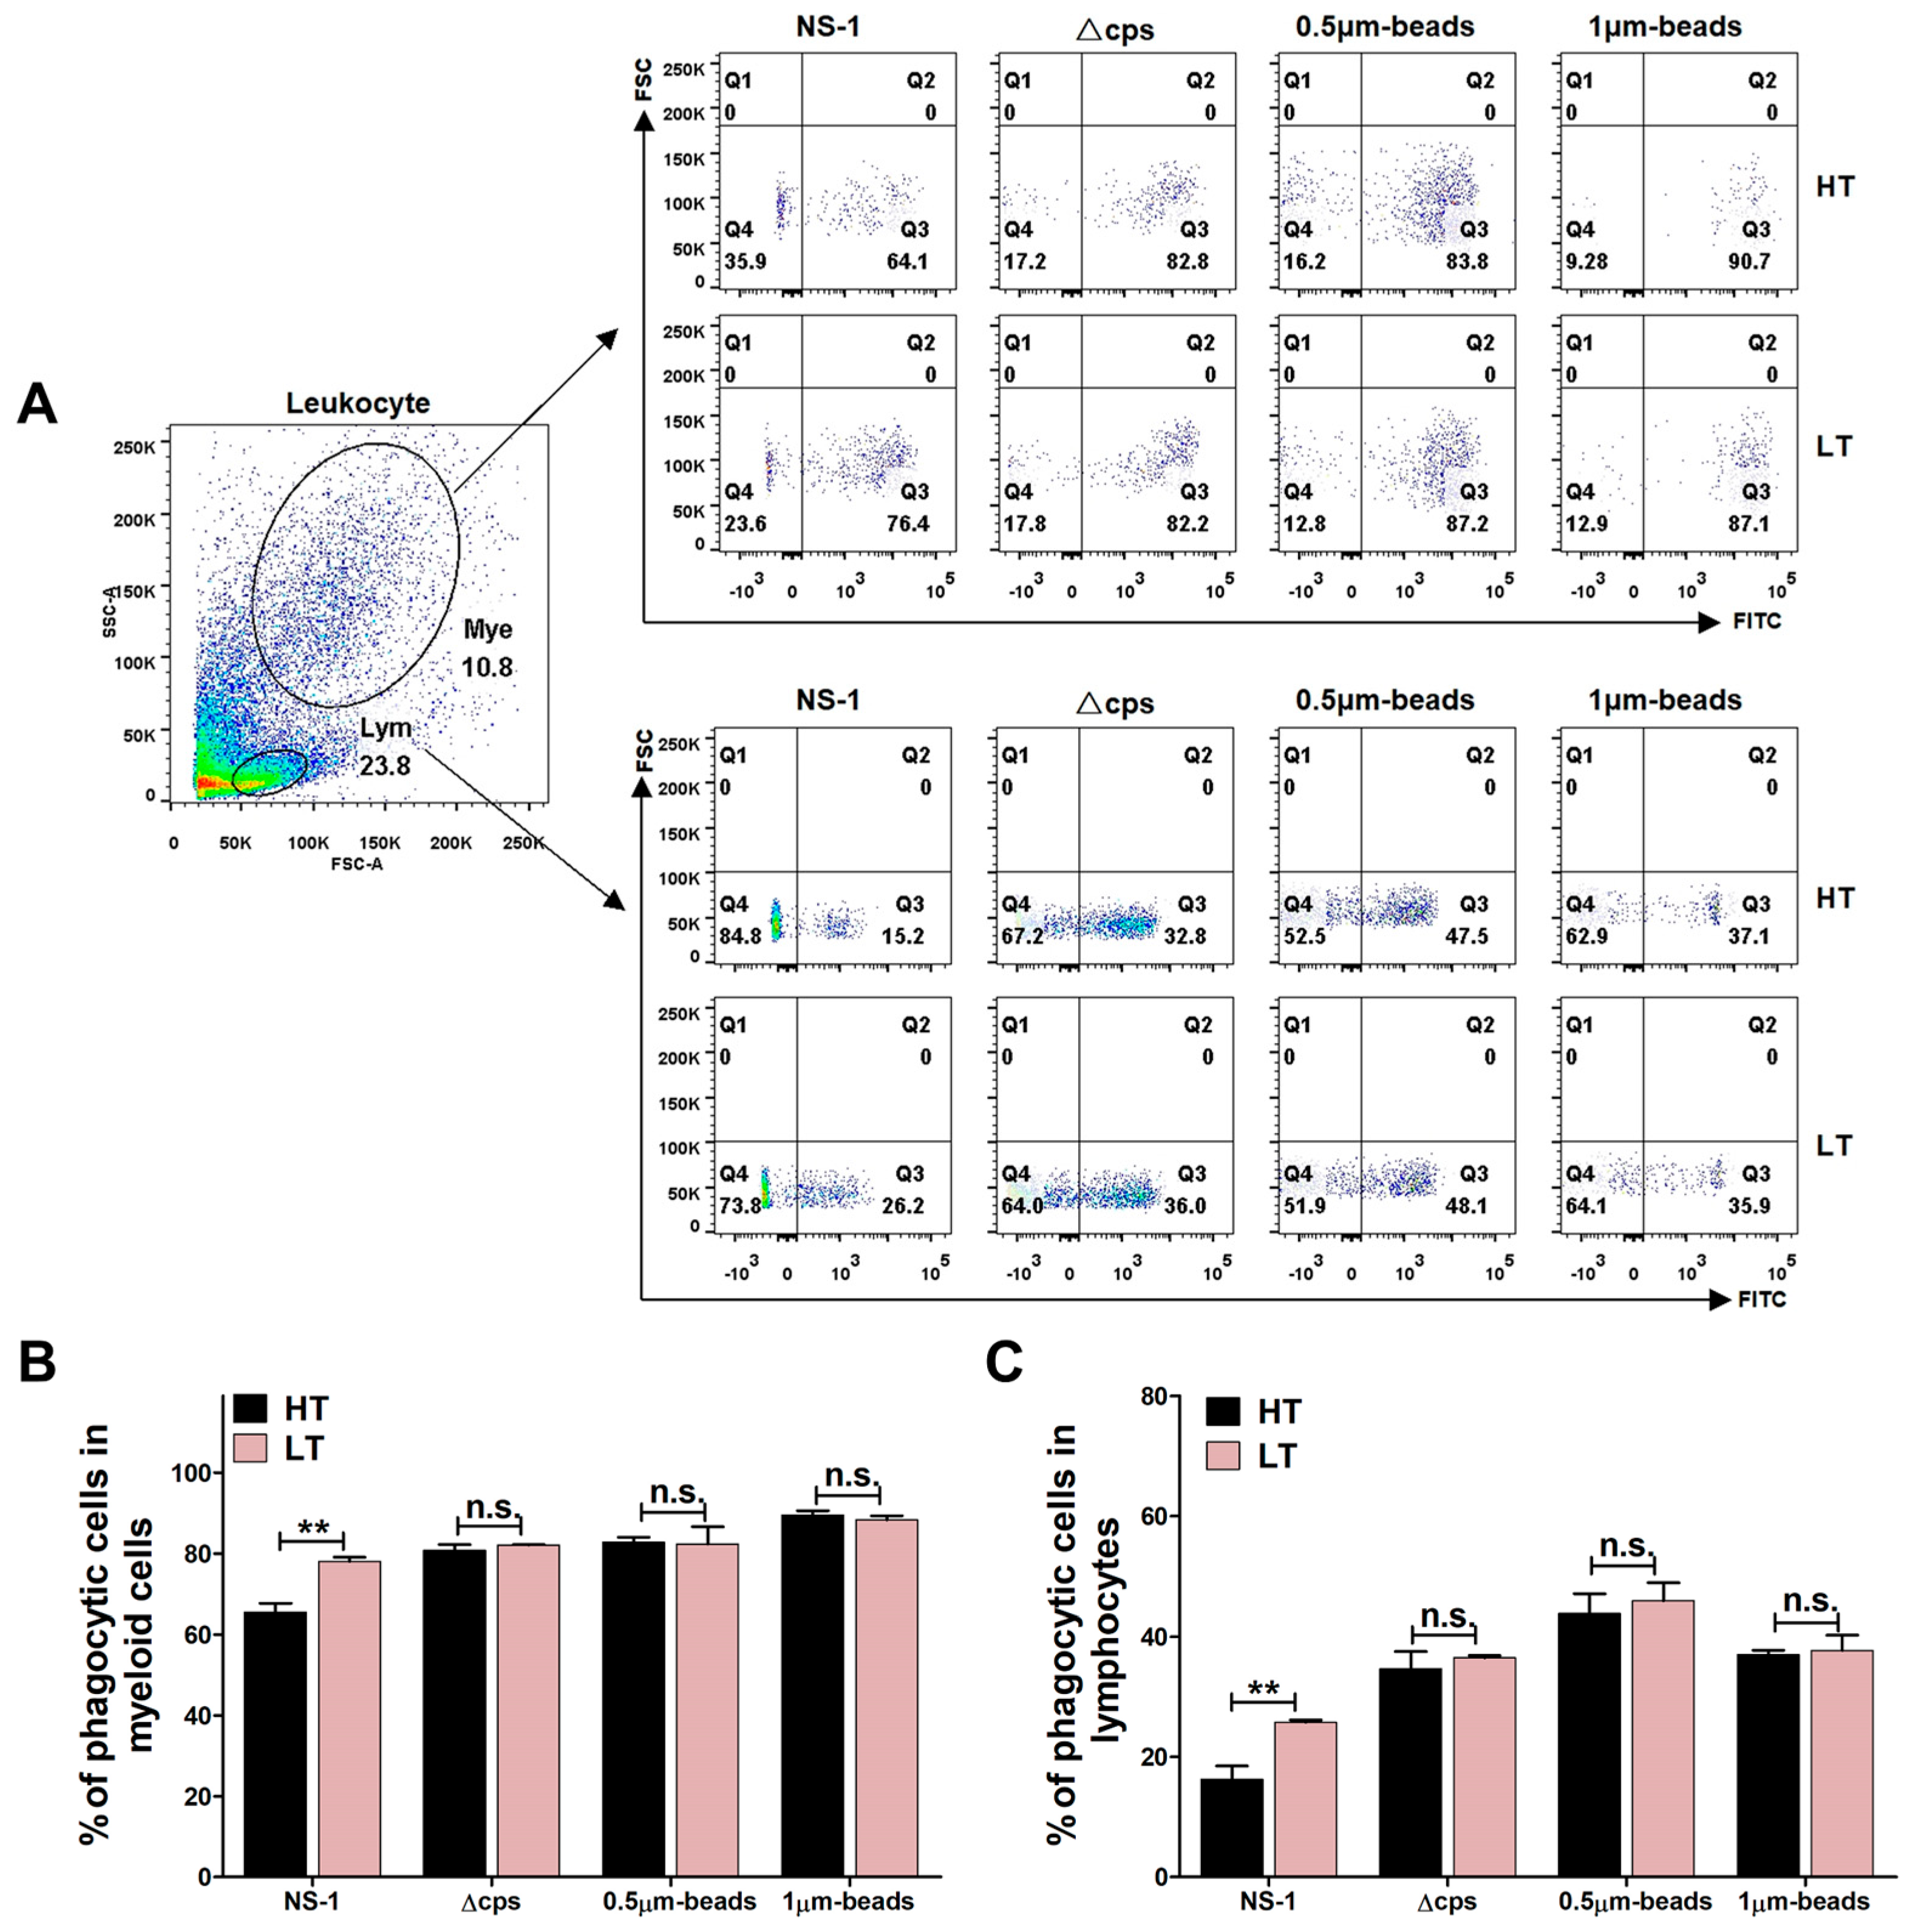
3.6. Phagocytic Activity
4. Discussion
5. Conclusions
Supplementary Materials
Author Contributions
Funding
Institutional Review Board Statement
Informed Consent Statement
Data Availability Statement
Acknowledgments
Conflicts of Interest
References
- Eskandari, G.; Saghavi, H.; Zabayeh Najafabadi, M.; Dehghan Madiseh, S.; Koochaknejad, E. Effect of salinity on reproductive performance of Acanthopagrus latus (Houttuyn) in spawning tanks. Aquac. Res. 2013, 44, 588–595. [Google Scholar] [CrossRef]
- Jian, C.Y.; Cheng, S.Y.; Chen, J.C. Temperature and salinity tolerances of yellowfin sea bream, Acanthopagrus latus, at different salinity and temperature levels. Aquac. Res. 2003, 34, 175–185. [Google Scholar] [CrossRef]
- Iwatsuki, Y. Review of the Acanthopagrus latus complex (Perciformes: Sparidae) with descriptions of three new species from the Indo-West Pacific Ocean. J. Fish Biol. 2013, 83, 64–95. [Google Scholar] [CrossRef]
- Fan, H.D.; Zhao, Y.M.; Liu, M.; Wang, X.; Lin, J.; Huang, W.; Wang, J.H. Mechanisms of immune responses in Acanthopagrus latus to Streptococcus agalactiae infection revealed by transcriptomic analysis. Fish Shellfish Immunol. 2025, 157, 110114. [Google Scholar] [CrossRef] [PubMed]
- Guo, H.Y.; He, H.X.; Liu, B.S.; Zhang, N.; Zhu, K.C.; Zhang, D.C. The regulatory mechanisms of IRF7 mediated by the type I IFN signalling pathway against Streptococcus iniae in yellowfin seabream, Acanthopagrus latus (Hottuyn, 1782). Int. J. Biol. Macromol. 2023, 247, 125635. [Google Scholar] [CrossRef] [PubMed]
- Pier, G.B.; Madin, S.H. Streptococcus iniae sp. nov., a beta-hemolytic streptococcus isolated from an Amazon freshwater dolphin, Inia geoffrensis. Int. J. Syst. Evol. Microbiol. 1976, 26, 545–553. [Google Scholar] [CrossRef]
- Baiano, J.C.; Barnes, A.C. Towards control of Streptococcus iniae. Emerg. Infect. Dis. 2009, 15, 1891–1896. [Google Scholar] [CrossRef]
- Kitao, T.; Aoki, T.; Sakoh, R. Epizootic caused by β-haemoltytic Streptococcus species in cultured freshwater fish. Fish Pathol. 1981, 15, 301–307. [Google Scholar] [CrossRef]
- Nguyen, H.T.; Kanai, K.; Yoshikoshi, K. Ecological investigation of Streptococcus iniae in cultured Japanese flounder (Paralichthys olivaceus) using selective isolation procedures. Aquaculture 2002, 205, 7–17. [Google Scholar] [CrossRef]
- Eldar, A.; Perl, S.; Frelier, P.F.; Bercovier, H. Red drum Sciaenops ocellatus mortalities associated with Streptococcus iniae infection. Dis. Aquat. Organ. 1999, 36, 121–127. [Google Scholar] [CrossRef]
- El Aamri, F.; Padilla, D.; Acosta, F.; Caballero, M.; Roo, J.; Bravo, J.; Vivas, J.; Real, F. First report of Streptococcus iniae in red porgy (Pagrus pagrus, L.). J. Fish Dis. 2010, 33, 901–905. [Google Scholar] [CrossRef]
- Chen, D.F.; Wang, K.Y.; Geng, Y.; Wang, J.; Huang, X.L.; He, M. Pathological changes in cultured channel catfish Ictalurus punctatus spontaneously infected with Streptococcus iniae. Dis. Aquat. Organ. 2011, 95, 203–208. [Google Scholar] [CrossRef]
- Deng, M.L.; Yu, Z.H.; Geng, Y.; Wang, K.Y.; Chen, D.F.; Huang, X.L.; Ou, Y.P.; Chen, Z.L.; Zhong, Z.J.; Lai, W.M. Outbreaks of Streptococcosis associated with Streptococcus iniae in Siberian sturgeon (Acipenser baerii) in China. Aquac. Res. 2017, 48, 909–919. [Google Scholar] [CrossRef]
- Rahmatullah, M.; Ariff, M.; Kahieshesfandiari, M.; Daud, H.M.; Zamri-Saad, M.; Sabri, M.Y.; Amal, M.N.A.; Ina-Salwany, M.Y. Isolation and pathogenicity of Streptococcus iniae in cultured red hybrid tilapia in Malaysia. J. Aquat. Anim. Health 2017, 29, 208–213. [Google Scholar] [CrossRef]
- Luo, X.; Fu, X.Z.; Liao, G.L.; Chang, O.Q.; Huang, Z.B.; Li, N.Q. Isolation, pathogenicity and characterization of a novel bacterial pathogen Streptococcus uberis from diseased mandarin fish Siniperca chuatsi. Microb. Pathog. 2017, 107, 380–389. [Google Scholar] [CrossRef]
- Guo, S.; Mo, Z.Q.; Wang, Z.; Xu, J.; Li, Y.W.; Dan, X.M.; Li, A.X. Isolation and pathogenicity of Streptococcus iniae in offshore cage-cultured Trachinotus ovatus in China. Aquaculture 2018, 492, 247–252. [Google Scholar] [CrossRef]
- Colussi, S.; Pastorino, P.; Mugetti, D.; Antuofermo, E.; Sciuto, S.; Esposito, G.; Polinas, M.; Tomasoni, M.; Burrai, G.P.; Fernandez-Garayzabal, J.F.; et al. Isolation and genetic characterization of Streptococcus iniae virulence factors in adriatic sturgeon (Acipenser naccarii). Microorganisms 2022, 10, 883. [Google Scholar] [CrossRef] [PubMed]
- Xu, H.S.; Zhu, N.B.; Chen, Y.L.; Yue, H.M.; Zhuo, M.Q.; Wangkahart, E.; Liang, Q.R.; Wang, R. Pathogenicity of Streptococcus iniae causing mass mortalities of yellow catfish (Tachysurus fulvidraco) and its induced host immune response. Front. Microbiol. 2024, 15, 1374688. [Google Scholar] [CrossRef] [PubMed]
- Weinstein, M.R.; Litt, M.; Kertesz, D.A.; Wyper, P.; Rose, D.; Coulter, M.; McGeer, A.; Facklam, R.; Ostach, C.; Willey, B.M. Invasive infections due to a fish pathogen, Streptococcus iniae. NEJM 1997, 337, 589–594. [Google Scholar] [CrossRef]
- Deng, Y.; Lin, Z.Y.; Xu, L.W.; Jiang, J.J.; Cheng, C.H.; Ma, H.L.; Feng, J. A first report of Streptococcus iniae infection of the spotted sea bass (Lateolabrax maculates). Front. Vet. Sci. 2024, 11, 1404054. [Google Scholar] [CrossRef]
- Muhammad, M.; Zhang, T.; Gong, S.Y.; Bai, J.; Ju, J.S.; Zhao, B.H.; Liu, D. Streptococcus iniae: A growing threat and causative agent of disease outbreak in farmed Chinese sturgeon (Acipenser sinensis). Pak. J. Zool. 2020, 52, 1931–1939. [Google Scholar] [CrossRef]
- Zhou, K.; Cui, T.T.; Li, P.L.; Liang, N.J.; Liu, S.C.; Ma, C.W.; Peng, Z.H. Modelling and predicting the effect of temperature, water activity and pH on growth of Streptococcus iniae in tilapia. J. Appl. Microbiol. 2008, 105, 1956–1965. [Google Scholar] [CrossRef]
- Young, E.J.; Bannister, J.; Buller, N.B.; Vaughan-Higgins, R.J.; Stephens, N.S.; Whiting, S.D.; Yeap, L.; Miller, T.L.; Warren, K.S. Streptococcus iniae associated mass marine fish kill off Western Australia. Dis. Aquat. Organ. 2020, 142, 197–201. [Google Scholar] [CrossRef]
- Bromage, E.; Owens, L. Environmental factors affecting the susceptibility of barramundi to Streptococcus iniae. Aquaculture 2009, 290, 224–228. [Google Scholar] [CrossRef]
- Jia, X.L.; Huang, Z.C.; Yang, L.D.; Lyu, J.; Li, Y.P.; Jian, J.C.; Huang, Y.C. Transcriptome analysis of Streptococcus iniae from fish at different culture temperatures. J. Trop. Biol. 2024, 15, 109–121. [Google Scholar] [CrossRef]
- Su, Y.L.; Feng, J.; Liu, C.; Li, W.; Xie, Y.D.; Li, A.X. Dynamic bacterial colonization and microscopic lesions in multiple organs of tilapia infected with low and high pathogenic Streptococcus agalactiae strains. Aquaculture 2017, 471, 190–203. [Google Scholar] [CrossRef]
- Zhang, J.S.; Geng, M.; Xiao, J.; Chen, L.T.; Cao, Y.; Li, K.; Yang, J.L.; Wei, X.M. Comparative analysis of T-cell immunity between Streptococcus agalactiae susceptible and resistant tilapia (Oreochromis niloticus). Fish Shellfish Immunol. 2024, 154, 109967. [Google Scholar] [CrossRef]
- Han, X.Q.; Cui, Z.W.; Ma, Z.Y.; Wang, J.; Hu, Y.Z.; Li, J.; Ye, J.M.; Tafalla, C.; Zhang, Y.A.; Zhang, X.J. Phagocytic plasma cells in teleost fish provide insights into the origin and evolution of B cells in vertebrates. J. Immunol. 2024, 213, 730–742. [Google Scholar] [CrossRef]
- Hong, Y.W.; Pan, Y.Y.; Zhu, Q.J.; Li, Y.Y.; Yang, H.C.; Lin, B.C.; Dong, Z.Y.; Lou, Y.J.; Fu, S.Q. Mechanisms for improving the quality of crucian carp (Carassius auratus) by short-term low-salinity treatment revealed by UPLC-MS and GC–MS. Aquac. Int. 2024, 32, 3511–3531. [Google Scholar] [CrossRef]
- Cheng, C.H.; Yang, F.F.; Ling, R.Z.; Liao, S.A.; Miao, Y.T.; Ye, C.X.; Wang, A.L. Effects of ammonia exposure on apoptosis, oxidative stress and immune response in pufferfish (Takifugu obscurus). Aquat. Toxicol. 2015, 164, 61–71. [Google Scholar] [CrossRef]
- Zheng, H.O.; Guo, Q.; Duan, X.Z.; Xu, Z.; Wang, Q.C. L-arginine inhibited apoptosis of fish leukocytes via regulation of NF-κB-mediated inflammation, NO synthesis, and anti-oxidant capacity. Biochimie 2019, 158, 62–72. [Google Scholar] [CrossRef]
- Li, J.; Barreda, D.R.; Zhang, Y.A.; Boshra, H.; Gelman, A.E.; LaPatra, S.; Tort, L.; Sunyer, J.O. B lymphocytes from early vertebrates have potent phagocytic and microbicidal abilities. Nat. Immunol. 2006, 7, 1116–1124. [Google Scholar] [CrossRef]
- Ellis, A.E. The leucocytes of fish: A review. J. Fish Biol. 1977, 11, 453–491. [Google Scholar] [CrossRef]
- Zhu, W.T.; Su, J.G. Immune functions of phagocytic blood cells in teleost. Rev. Aquac. 2022, 14, 630–646. [Google Scholar] [CrossRef]
- Chan, J.T.; Kadri, S.; Köllner, B.; Rebl, A.; Korytář, T. RNA-seq of single fish cells–seeking out the leukocytes mediating immunity in teleost fishes. Front. Immunol. 2022, 13, 798712. [Google Scholar] [CrossRef] [PubMed]
- Wu, L.T.; Gao, A.L.; Li, L.; Chen, J.L.; Li, J.; Ye, J.M. A single-cell transcriptome profiling of anterior kidney leukocytes from Nile Tilapia (Oreochromis niloticus). Front. Immunol. 2021, 12, 783196. [Google Scholar] [CrossRef] [PubMed]
- Guijarro, J.A.; Cascales, D.; Garcia-Torrico, A.I.; Garcia-Dominguez, M.; Mendez, J. Temperature-dependent expression of virulence genes in fish-pathogenic bacteria. Front. Microbiol. 2015, 6, 700. [Google Scholar] [CrossRef] [PubMed]
- Chideroli, R.T.; Amoroso, N.; Mainardi, R.M.; Suphoronski, S.A.; de Padua, S.B.; Alfieri, A.F.; Alfieri, A.A.; Mosela, M.; Moralez, A.T.; de Oliveira, A.G. Emergence of a new multidrug-resistant and highly virulent serotype of Streptococcus agalactiae in fish farms from Brazil. Aquaculture 2017, 479, 45–51. [Google Scholar] [CrossRef]
- Rodkhum, C.; Kayansamruaj, P.; Pirarat, N. Effect of water temperature on susceptibility to Streptococcus agalactiae serotype Ia infection in Nile tilapia (Oreochromis niloticus). Thai J. Vet. Med. 2011, 41, 309–314. [Google Scholar] [CrossRef]
- Kayansamruaj, P.; Pirarat, N.; Hirono, I.; Rodkhum, C. Increasing of temperature induces pathogenicity of Streptococcus agalactiae and the up-regulation of inflammatory related genes in infected Nile tilapia (Oreochromis niloticus). Vet. Microbiol. 2014, 172, 265–271. [Google Scholar] [CrossRef]
- Mian, G.F.; Godoy, D.T.; Leal, C.A.; Yuhara, T.Y.; Costa, G.M.; Figueiredo, H.C. Aspects of the natural history and virulence of S. agalactiae infection in Nile tilapia. Vet. Microbiol. 2009, 136, 180–183. [Google Scholar] [CrossRef]
- Guiney, D.G. Regulation of bacterial virulence gene expression by the host environment. J. Clin. Investig. 1997, 99, 565–569. [Google Scholar] [CrossRef] [PubMed]
- Juarez-Cortes, M.Z.; Vazquez, L.E.C.; Diaz, S.F.M.; Cardona Felix, C.S. Streptococcus iniae in aquaculture: A review of pathogenesis, virulence, and antibiotic resistance. Int. J. Vet. Sci. Med. 2024, 12, 25–38. [Google Scholar] [CrossRef] [PubMed]
- Medzhitov, R. Recognition of microorganisms and activation of the immune response. Nature 2007, 449, 819–826. [Google Scholar] [CrossRef]
- Zhao, Z.C.; Xiang, M.L.; Zhu, J.C.; Wang, Y.; Li, G.H.; Zhong, Z.H.; Sun, Y.; Deng, H.W.; Guo, W.L.; Zhou, Y.C. Isolation, identification, and pathogenicity of γ-hemolytic Streptococcus iniae in Selenotoca multifasciata. J. World Aquac. Soc. 2025, 56, e70023. [Google Scholar] [CrossRef]
- Al-Marzouk, A.; Duremdez, R.; Yuasa, K.; Al-Zenki, S.; Al-Gharabally, H.; Munday, B. Fish kill of mullet Liza klunzingeri in Kuwait Bay: The role of Streptococcus agalactiae and the influence of temperature. Dis. Asian Aquac. 2005, 143–153. [Google Scholar]
- Babior, B.M. Phagocytes and oxidative stress. Am. J. Med. 2000, 109, 33–44. [Google Scholar] [CrossRef]
- Tang, Y.L.; Zhang, X.Y.; Wu, W.; Lu, Z.Y.; Fang, W.H. Inactivation of the sodA gene of Streptococcus suis type 2 encoding superoxide dismutase leads to reduced virulence to mice. Vet. Microbiol. 2012, 158, 360–366. [Google Scholar] [CrossRef]
- Zhang, M.M.; Qin, Y.X.; Huang, L.X.; Yan, Q.P.; Mao, L.L.; Xu, X.J.; Wang, S.Y.; Zhang, M.M.; Chen, L.W. The role of sodA and sodB in Aeromonas hydrophila resisting oxidative damage to survive in fish macrophages and escape for further infection. Fish Shellfish Immunol. 2019, 88, 489–495. [Google Scholar] [CrossRef]
- Karavolos, M.H.; Horsburgh, M.J.; Ingham, E.; Foster, S.J. Role and regulation of the superoxide dismutases of Staphylococcus aureus. Microbiology 2003, 149, 2749–2758. [Google Scholar] [CrossRef]
- Kordon, A.O.; Karsi, A.; Pinchuk, L. Innate immune responses in fish: Antigen presenting cells and professional phagocytes. Turk. J. Fish. Aquat. Sci. 2018, 18, 1123–1139. [Google Scholar] [CrossRef]
- Wu, L.T.; Li, L.; Gao, A.L.; Ye, J.M.; Li, J. Antimicrobial roles of phagocytosis in teleost fish: Phagocytic B cells vs professional phagocytes. Aquac. Fish. 2024, 9, 105–114. [Google Scholar] [CrossRef]
- Locke, J.B.; Colvin, K.M.; Datta, A.K.; Patel, S.K.; Naidu, N.N.; Neely, M.N.; Nizet, V.; Buchanan, J.T. Streptococcus iniae capsule impairs phagocytic clearance and contributes to virulence in fish. J. Bacteriol. 2007, 189, 1279–1287. [Google Scholar] [CrossRef]
- Roberts, I.S. The biochemistry and genetics of capsular polysaccharide production in bacteria. Annu. Rev. Microbiol. 1996, 50, 285–315. [Google Scholar] [CrossRef]
- Orskov, F.; Sharma, V.; Orskov, I. Influence of growth temperature on the development of Escherichia coli polysaccharide K antigens. J. Gen. Microbiol. 1984, 130, 2681–2684. [Google Scholar] [CrossRef] [PubMed]


| Primers | Nucleotide Sequence (5′-3′) | Product Size (bp) | Amplification Efficiency | Sequence ID |
|---|---|---|---|---|
| β-actin-F | CGAGAGGGAAATCGTGCGTGACA | 189 | 0.97 | XM_037087864.1 |
| β-actin-R | AGGAAGGAAGGCTGGAAGAGGGC | |||
| ef1α-F | TCGGCGGTATTGGAACTGTC | 210 | 0.98 | XM_037092652.1 |
| ef1α-R | CGACGTATCCACGACGGATT | |||
| caspase3-F | CCCCGTAGAAGCTGACTTCC | 213 | 1.02 | XM_037083014 |
| caspase3-R | GCATCAAAGCCCGGTGAATG | |||
| caspase7-F | GACAGATTCAGGTCCGCCAA | 162 | 0.96 | XM_037081625.1 |
| caspase7-R | TTGCAGAGTGCCTGGACAAA |
Disclaimer/Publisher’s Note: The statements, opinions and data contained in all publications are solely those of the individual author(s) and contributor(s) and not of MDPI and/or the editor(s). MDPI and/or the editor(s) disclaim responsibility for any injury to people or property resulting from any ideas, methods, instructions or products referred to in the content. |
© 2025 by the authors. Licensee MDPI, Basel, Switzerland. This article is an open access article distributed under the terms and conditions of the Creative Commons Attribution (CC BY) license (https://creativecommons.org/licenses/by/4.0/).
Share and Cite
Yang, Y.; Zhang, G.; Xu, R.; Deng, Y.; Mo, Z.; Li, Y.; Dan, X. Proteomic and Functional Analysis Reveals Temperature-Driven Immune Evasion Strategies of Streptococcus iniae in Yellowfin Seabream (Acanthopagrus latus). Biology 2025, 14, 986. https://doi.org/10.3390/biology14080986
Yang Y, Zhang G, Xu R, Deng Y, Mo Z, Li Y, Dan X. Proteomic and Functional Analysis Reveals Temperature-Driven Immune Evasion Strategies of Streptococcus iniae in Yellowfin Seabream (Acanthopagrus latus). Biology. 2025; 14(8):986. https://doi.org/10.3390/biology14080986
Chicago/Turabian StyleYang, Yanjian, Guanrong Zhang, Ruilong Xu, Yiyang Deng, Zequan Mo, Yanwei Li, and Xueming Dan. 2025. "Proteomic and Functional Analysis Reveals Temperature-Driven Immune Evasion Strategies of Streptococcus iniae in Yellowfin Seabream (Acanthopagrus latus)" Biology 14, no. 8: 986. https://doi.org/10.3390/biology14080986
APA StyleYang, Y., Zhang, G., Xu, R., Deng, Y., Mo, Z., Li, Y., & Dan, X. (2025). Proteomic and Functional Analysis Reveals Temperature-Driven Immune Evasion Strategies of Streptococcus iniae in Yellowfin Seabream (Acanthopagrus latus). Biology, 14(8), 986. https://doi.org/10.3390/biology14080986