Simple Summary
This study revealed that supplementing C. gigas feed with selenium-enriched yeast significantly alters gene expression related to metabolism, immunity, and tissue structure. Specifically, moderate selenium addition (2 ppm) enhanced metabolic activity and promoted fattening, while higher concentrations (4 ppm) may induce immune responses. These findings suggest that appropriate selenium supplementation can improve oyster growth and quality, offering a promising strategy to boost efficiency and economic returns in oyster and broader shellfish aquaculture industries.
Abstract
This study explores the effects of selenium-enriched yeast supplementation on growth-related and immune-related gene expression in C. gigas, aiming to support feed optimization in oyster aquaculture. Selenium, an essential trace element, is vital for growth, immune function, and metabolism in animals. Selenium-enriched yeast, an organic form, offers superior bioavailability, enabling efficient absorption and utilization. C. gigas, a commercially significant marine shellfish, is rich in protein and nutrients, but the effects of selenium on mollusks remain insufficiently explored. In this study, oysters were divided into three groups: a control group without selenium (THNP), a 2 ppm selenium group (THMP), and a 4 ppm selenium group (THHP). Transcriptome sequencing yielded 388,679,026 clean reads. GO and KEGG enrichment analyses identified key metabolic signaling pathways, and a PPI analysis was performed on the translation products of DEGs involved in the KEGG pathways. qRT-PCR validated the expression of principal DEGs. The combined results of enrichment and PPI analyses highlighted pathways such as glutathione metabolism and collagen signaling. Additionally, three hub genes—FASN, HRAS, and ABCG5—were identified as central to the selenium response. These findings enhance the understanding of selenium’s molecular impact on oysters and support its application in aquaculture.
1. Introduction
Selenium is an essential dietary trace element that plays a critical role in the growth, immune response, and metabolic processes of humans and animals [1]. In nature, selenium exists in two primary forms: the hexavalent cation of selenate (Se6+) and the tetravalent cation of selenite (Se4+) [2]. As it can exist in the form of selenocysteine within selenoproteins, selenium is involved in various biological pathways, enhancing antioxidant capacity and exerting anti-inflammatory and antimicrobial effects [3,4]. Plants, capable of absorbing selenium from the soil, do not require this trace element for survival [5]. Selenium deficiency in animals leads to a plethora of adverse effects, such as weakened immune systems, metabolic abnormalities, and hindered growth and development [6,7,8]. Previous studies have shown that feeding tilapia with selenium-rich diets significantly promotes growth, increases the activity of antioxidant enzymes, and enhances the transcription levels of immune-related proteins [9]. Research by Tian et al. has revealed that elemental selenium (Se) significantly increases the expression of the IFN and ISG15 genes in EPC cells of crucian carp and zebrafish, thus strengthening their immune defense [10]. Compared to inorganic selenium, selenium-enriched yeast, known for its high absorbability and effectiveness, is more widely used as a feed additive [11]. While studies on selenium’s impact on immunity and metabolism are more common in vertebrates, such research is yet to be conducted in mollusks. Meanwhile, selenium-enriched yeast, an important form of selenium supplementation, is characterized by high absorption and low biotoxicity compared to other inorganic selenium [12]. Hence, this study utilizes selenium-enriched yeast as a dietary selenium supplement to investigate its effects on biological processes such as metabolism and immunity in organisms. It has been suggested that inorganic selenium accumulation in organisms affects their reproductive function, but further research is needed on the bioaccumulation of organic selenium [13,14].
C. gigas is one of the widely cultivated marine mollusks across the globe [15]. As a high-quality protein source among seafood, the demand for oysters has significantly risen [16]. Therefore, the question of whether selenium supplementation in feed can enhance the growth and metabolism of C. gigas remains to be addressed and is a direction for research aimed at increasing oyster aquaculture yields.
High-throughput transcriptome sequencing technology, also known as “next-generation” sequencing technology, is a highly efficient and rapid method for sequencing [17,18,19]. This technology enables the parallel sequencing of a large number of nucleic acid molecules simultaneously, generating extensive data. In recent years, transcriptome sequencing has been extensively utilized in the study of biological mechanisms. For instance, Ding and colleagues employed transcriptome sequencing to analyze the key genes determining the different shell colors of scallops, enhancing our understanding of the molecular mechanisms involved in the growth, immunity, shell pigmentation, and biomineralization of the species [20]. In our study, transcriptome sequencing was employed to investigate the molecular mechanisms underlying the response of C. gigas following dietary supplementation with selenium-enriched yeast. The findings of this study demonstrate the promotional effects of selenium on the growth and development of C. gigas, providing a reference for selenium supplementation in oyster aquaculture feeds.
2. Materials and Methods
2.1. Sample Collection
All the oyster samples required for this experiment (Total weight = 50 ± 20 g) were sourced from the seas near Yantai, Shandong, China, and acclimatized in breeding pools for one week to fully adapt to the experimental seawater conditions (dissolved oxygen = 5.4 mg/L, pH = 8.1, salinity = 30 ± 0.5 ppt). Three 6000 L pools with identical seawater parameters were set up, each holding 30 oysters. All the pools were fed six times daily. In the control group, 24 g of yeast was fed once daily, and live diatoms were fed during the remaining five feedings. In the 2 ppm treatment group, 12 g of yeast and 12 g of selenium-enriched yeast were fed once daily, with live diatoms provided during the other five feedings. The selenium content of the selenium-enriched yeast used was 2000 mg/kg (dry weight; Angel Nutritech, China). In the 4 ppm treatment group, 24 g of selenium-enriched yeast was fed once daily, along with five feedings of live diatoms. For each treatment group, the respective yeast or selenium-enriched yeast was dissolved into 12 L of feed to ensure consistent selenium delivery and uniform distribution [21]. The pools were changed daily to ensure that the concentration was constant. After 45 days of the experiment, which began in June 2023, nine oysters were randomly selected from each experimental group, and tissues from the hepatopancreas were collected. Total RNA was individually extracted from each oyster, and equal molar amounts of RNA from every three individuals were pooled to construct one sequencing library, resulting in three RNA-seq libraries (technical replicates) per group (Table S1). Once sample extraction was completed, they were immediately stored in cryotubes and frozen in liquid nitrogen for subsequent transcriptome sequencing.
2.2. RNA Extraction, Library Construction, and Sequencing
The RNA extraction, library construction, and sequencing for this study were technically supported by Beijing Novogene Corporation (Beijing, China). The Trizol method was used to extract RNA from the hepatopancreas samples, with quality control supported by the Agilent 2 100 Bioanalyzer (Agilent Technologies, Santa Clara, CA, USA). The NEBNext® Ultra™ Directional RNA Library Prep Kit (New England Biolabs, Ipswich, MA, USA) was employed for library construction. The sequencing was conducted on the Illumina NovaSeq 6 000 platform (Illumina, Inc., San Diego, CA, USA) [22].
2.3. Differential Gene Identification
The raw data obtained from sequencing were cleaned. Reads containing adapters, those with a N ratio greater than 10%, and low-quality reads (with a Qphred quality value ≤ 20 and base count over 50) were all removed, constituting a percentage of the total reads. The clean reads were mapped to the C. gigas reference genome vN1 (GCA_011032805.1), which has been deposited in NCBI. The corresponding annotation file used for gene mapping and functional analysis is not yet publicly available. DESeq2 (v1.38.3) in R (v4.2.2) was employed to identify Differentially expressed genes (DEGs) meeting the criteria of |Foldchange| > 1.5 and a p-value ≤ 0.05 [23]. Volcano plots, Venn diagrams, and cluster heatmaps were used to display the differential gene expression in oysters fed with selenium-supplemented diets.
2.4. Enrichment Analysis of DEGs
DAVID (v6.8) was utilized for the functional enrichment analysis of the identified DEGs (Sherman et al., 2022 [24]). The analysis was conducted using the default parameters (Count = 2, EASE = 0.1) of the website. The background gene set used for enrichment analysis consisted of all the expressed genes identified in the transcriptome data prior to differential expression filtering [25].
2.5. Analysis of Protein–Protein Interaction Networks
The STRING v12.0 online platform was employed to construct the protein–protein interaction (PPI) network [26]. The gene sequences of all the DEGs were uploaded to STRING for homologous sequence alignment, and the sequences with the highest scores were used for STRING analysis. The minimum interaction score was set at 0.150, with the other parameters retained as default. The role of key DEGs following organic selenium supplementation in feed was analyzed based on the number of involvements in Kyoto Encyclopedia of Genes and Genomes (KEGG) pathways and PPI.
2.6. Quantitative RT-PCR Verification
Finally, twelve DEGs with key roles in oysters after the addition of organic selenium were used to characterize the accuracy of sequencing. The accuracy of the sequencing results was demonstrated by the concordance between the expression trends of the genes in the sequencing results and the quantitative Reverse Transcription Polymerase Chain Reaction (qRT-PCR) results [27,28]. The Primer Premier 5.0 software was used to design specific primers for quantitative validation (Table 1). Due to the stability of expression, EF-1α was used as a housekeeping gene. The 2−ΔΔCT method was used to calculate the relative amount of fold change in expression of the target gene over the housekeeping gene.

Table 1.
List of primers used for qRT-PCR validation.
3. Results
3.1. Sequencing Quality
High-throughput sequencing technology was applied to sequence oyster hepatopancreas samples. A total of 388,679,026 usable reads were generated for subsequent analysis. Over 67% of the clean reads could be mapped to the reference genome, with a quality score of 95% Q20 and 92% Q30 (Table 2). These high-quality data attest to the reliability of the subsequent analyses [29].
Table 2.
RNA-Seq results.
3.2. Differential Gene Expression Analysis
In this study, we utilized volcano plots to display the differential expression of DEGs in oysters fed with diets supplemented with organic selenium (Figure 1).
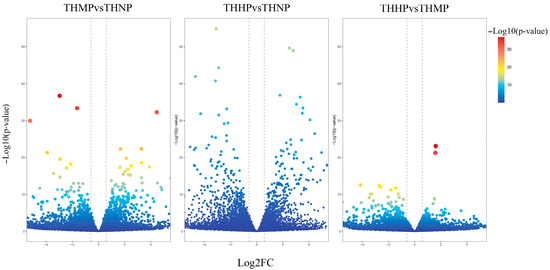
Figure 1.
Volcano plot of DEG expression after the addition of organic selenium to the feed. The x-axis represents the log2 Fold change; the y-axis indicates the change in p-value. Each point in the graph represents a gene, with the color transition from blue to red indicating the variation in the p-value of the gene.
Compared to the control group (THNP), the treatment group with 2 ppm selenium (THMP) exhibited 1144 upregulated DEGs and 1533 downregulated genes. In the comparison between the THNP group and the treatment group with 4 ppm selenium (THHP), 1533 DEGs were upregulated, and 2179 DEGs were downregulated. Between the THMP group and the THHP group, 514 genes were significantly upregulated, and 847 DEGs were significantly downregulated. A large number of significantly DEGs were identified in oysters fed organic selenium-enriched yeast, indicating substantial transcriptomic changes in response to selenium treatment.
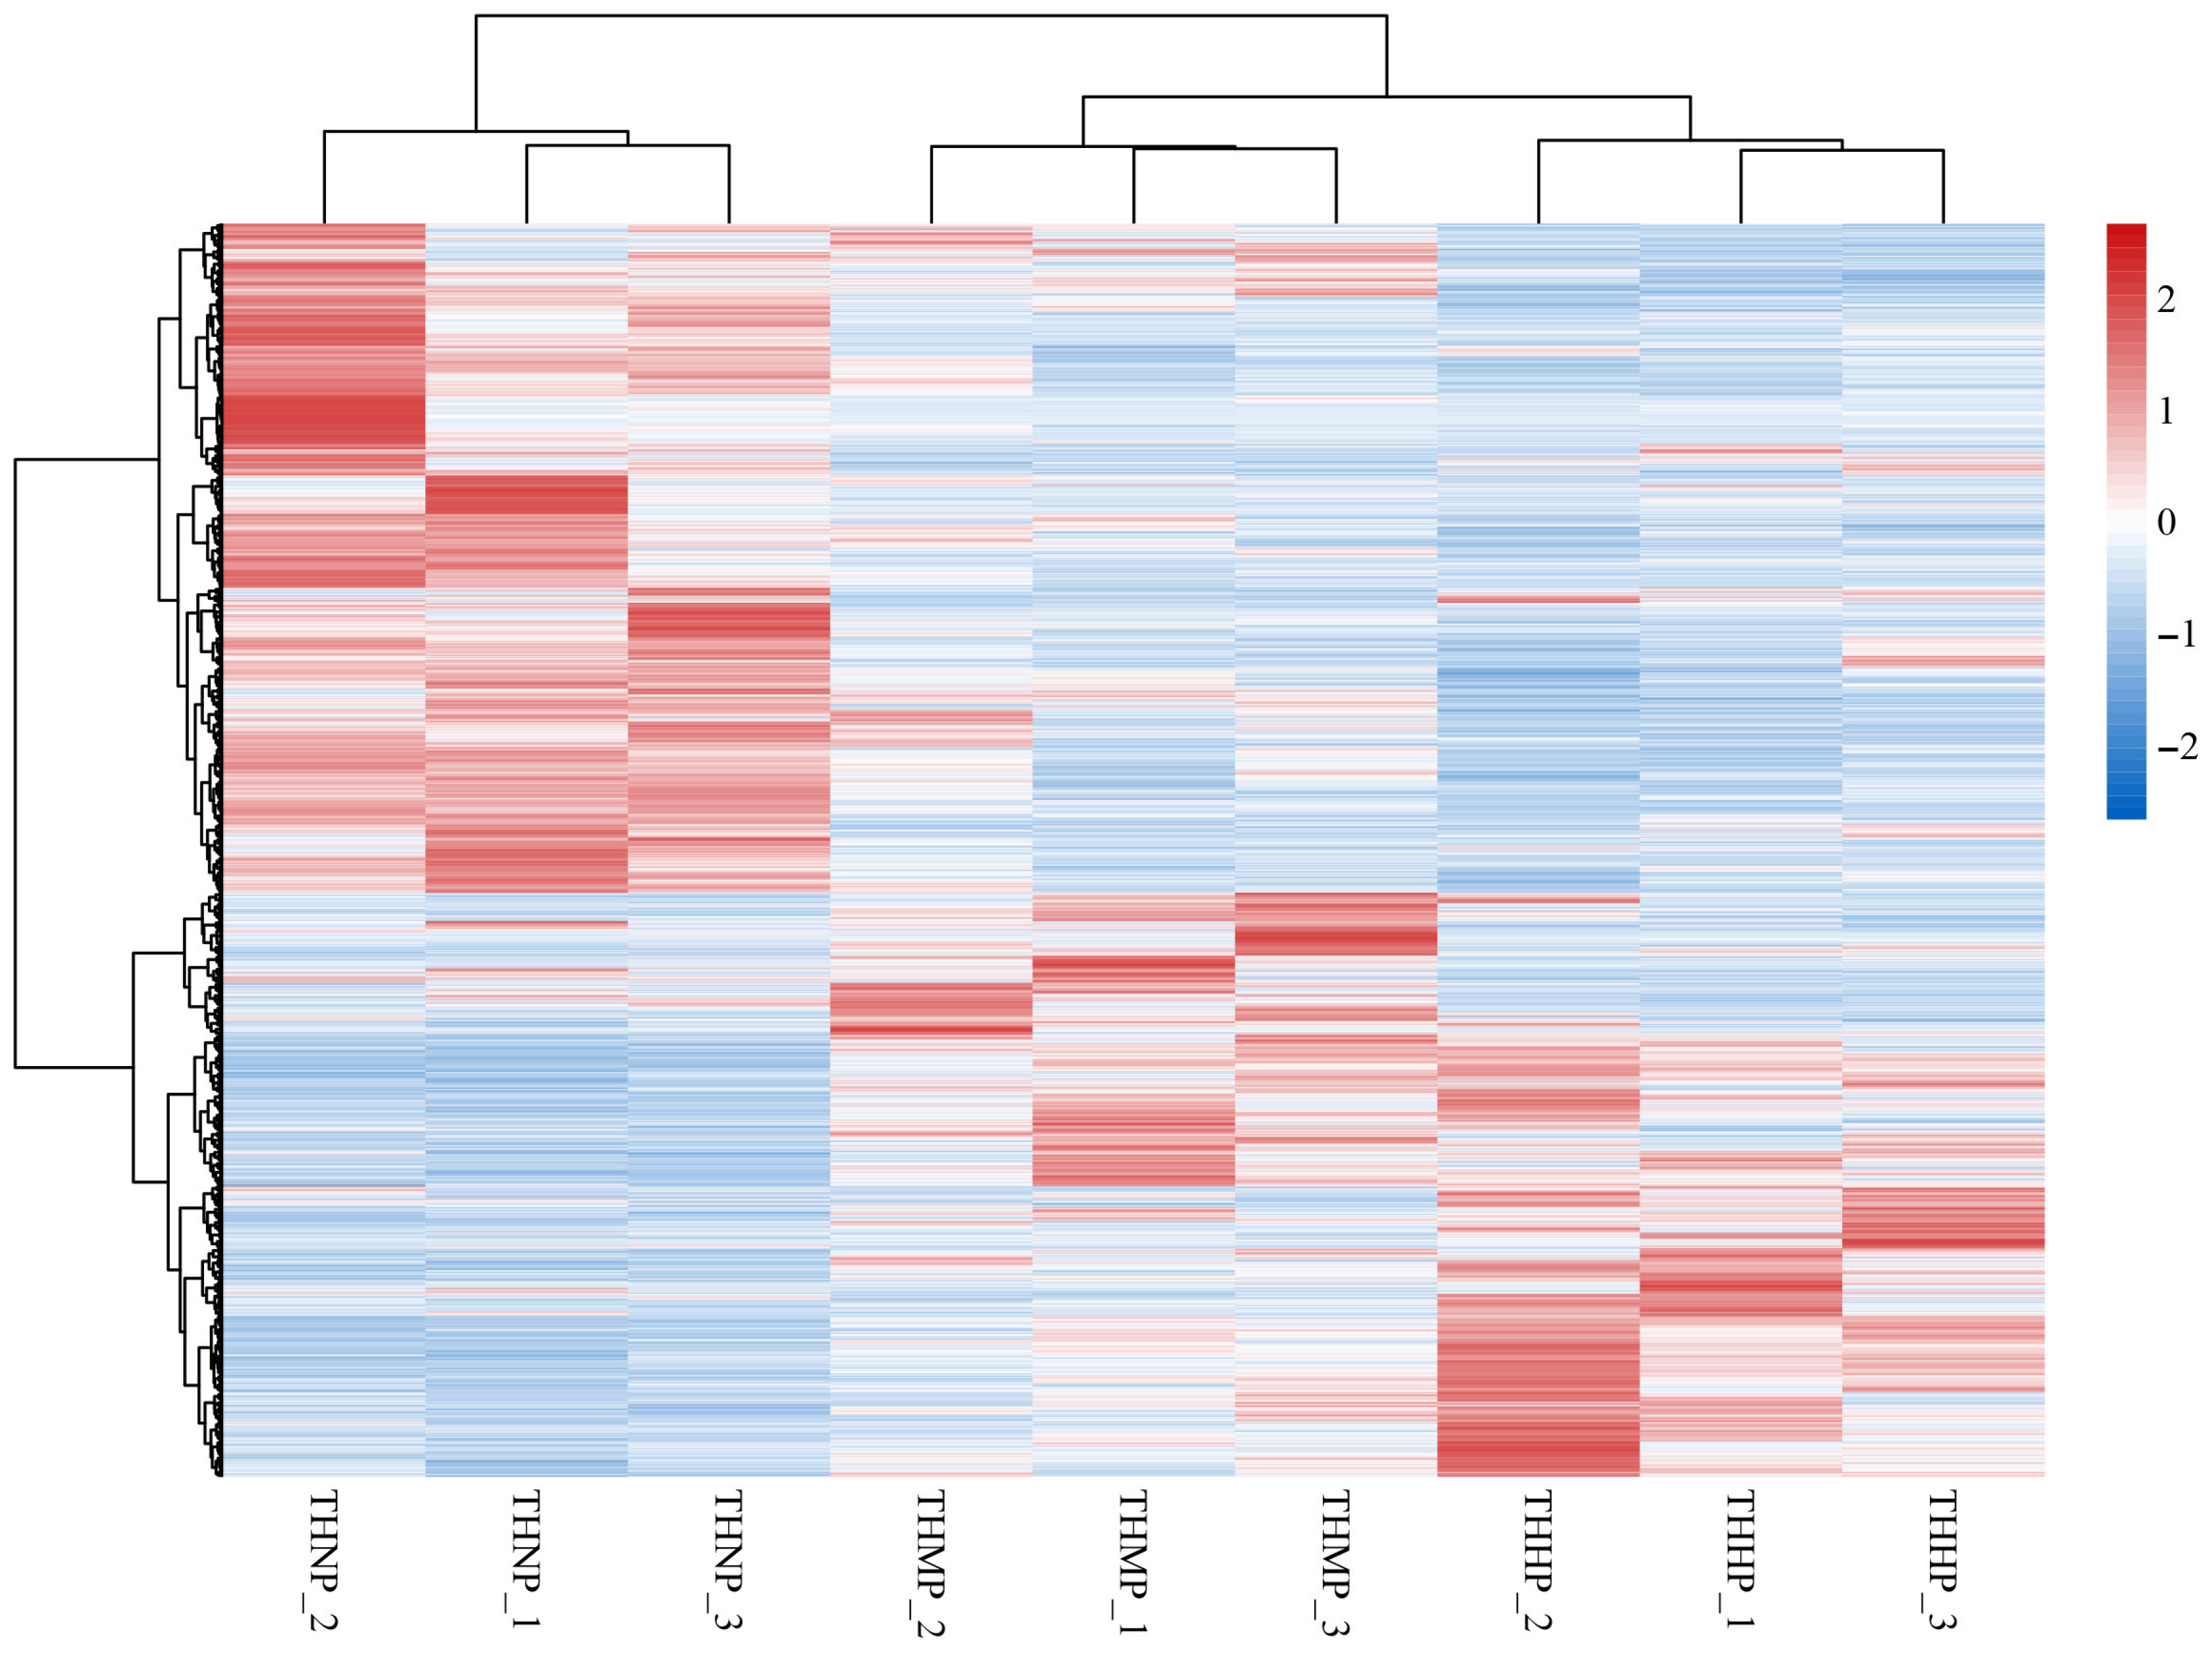
Cluster heatmaps were utilized to demonstrate the correlation between samples and the expression of genes across different treatment groups (Figure 2). In this study, all the DEGs among the three comparison groups were used to create the differential gene cluster heatmap. The similar expression patterns of genes in the three samples of the same treatment method indicate a high correlation between the samples. The varied expression patterns of genes between different treatment groups highlight the significant impact of adding organic selenium to the feed on oysters.
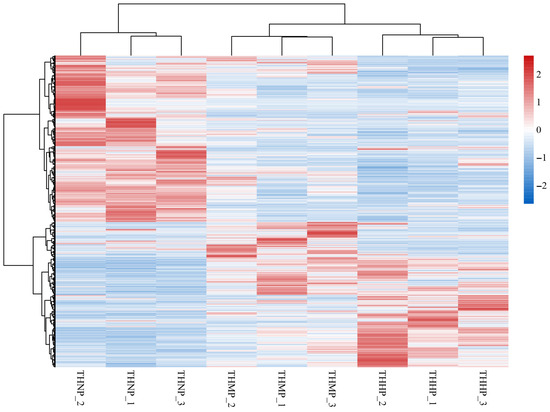
Figure 2.
Cluster heatmap of DEG expression in oysters fed with organic selenium-supplemented feed. Horizontally, the heatmap represents different samples, while vertically, it represents various genes. The color transition from red to blue indicates gene expression from high to low.
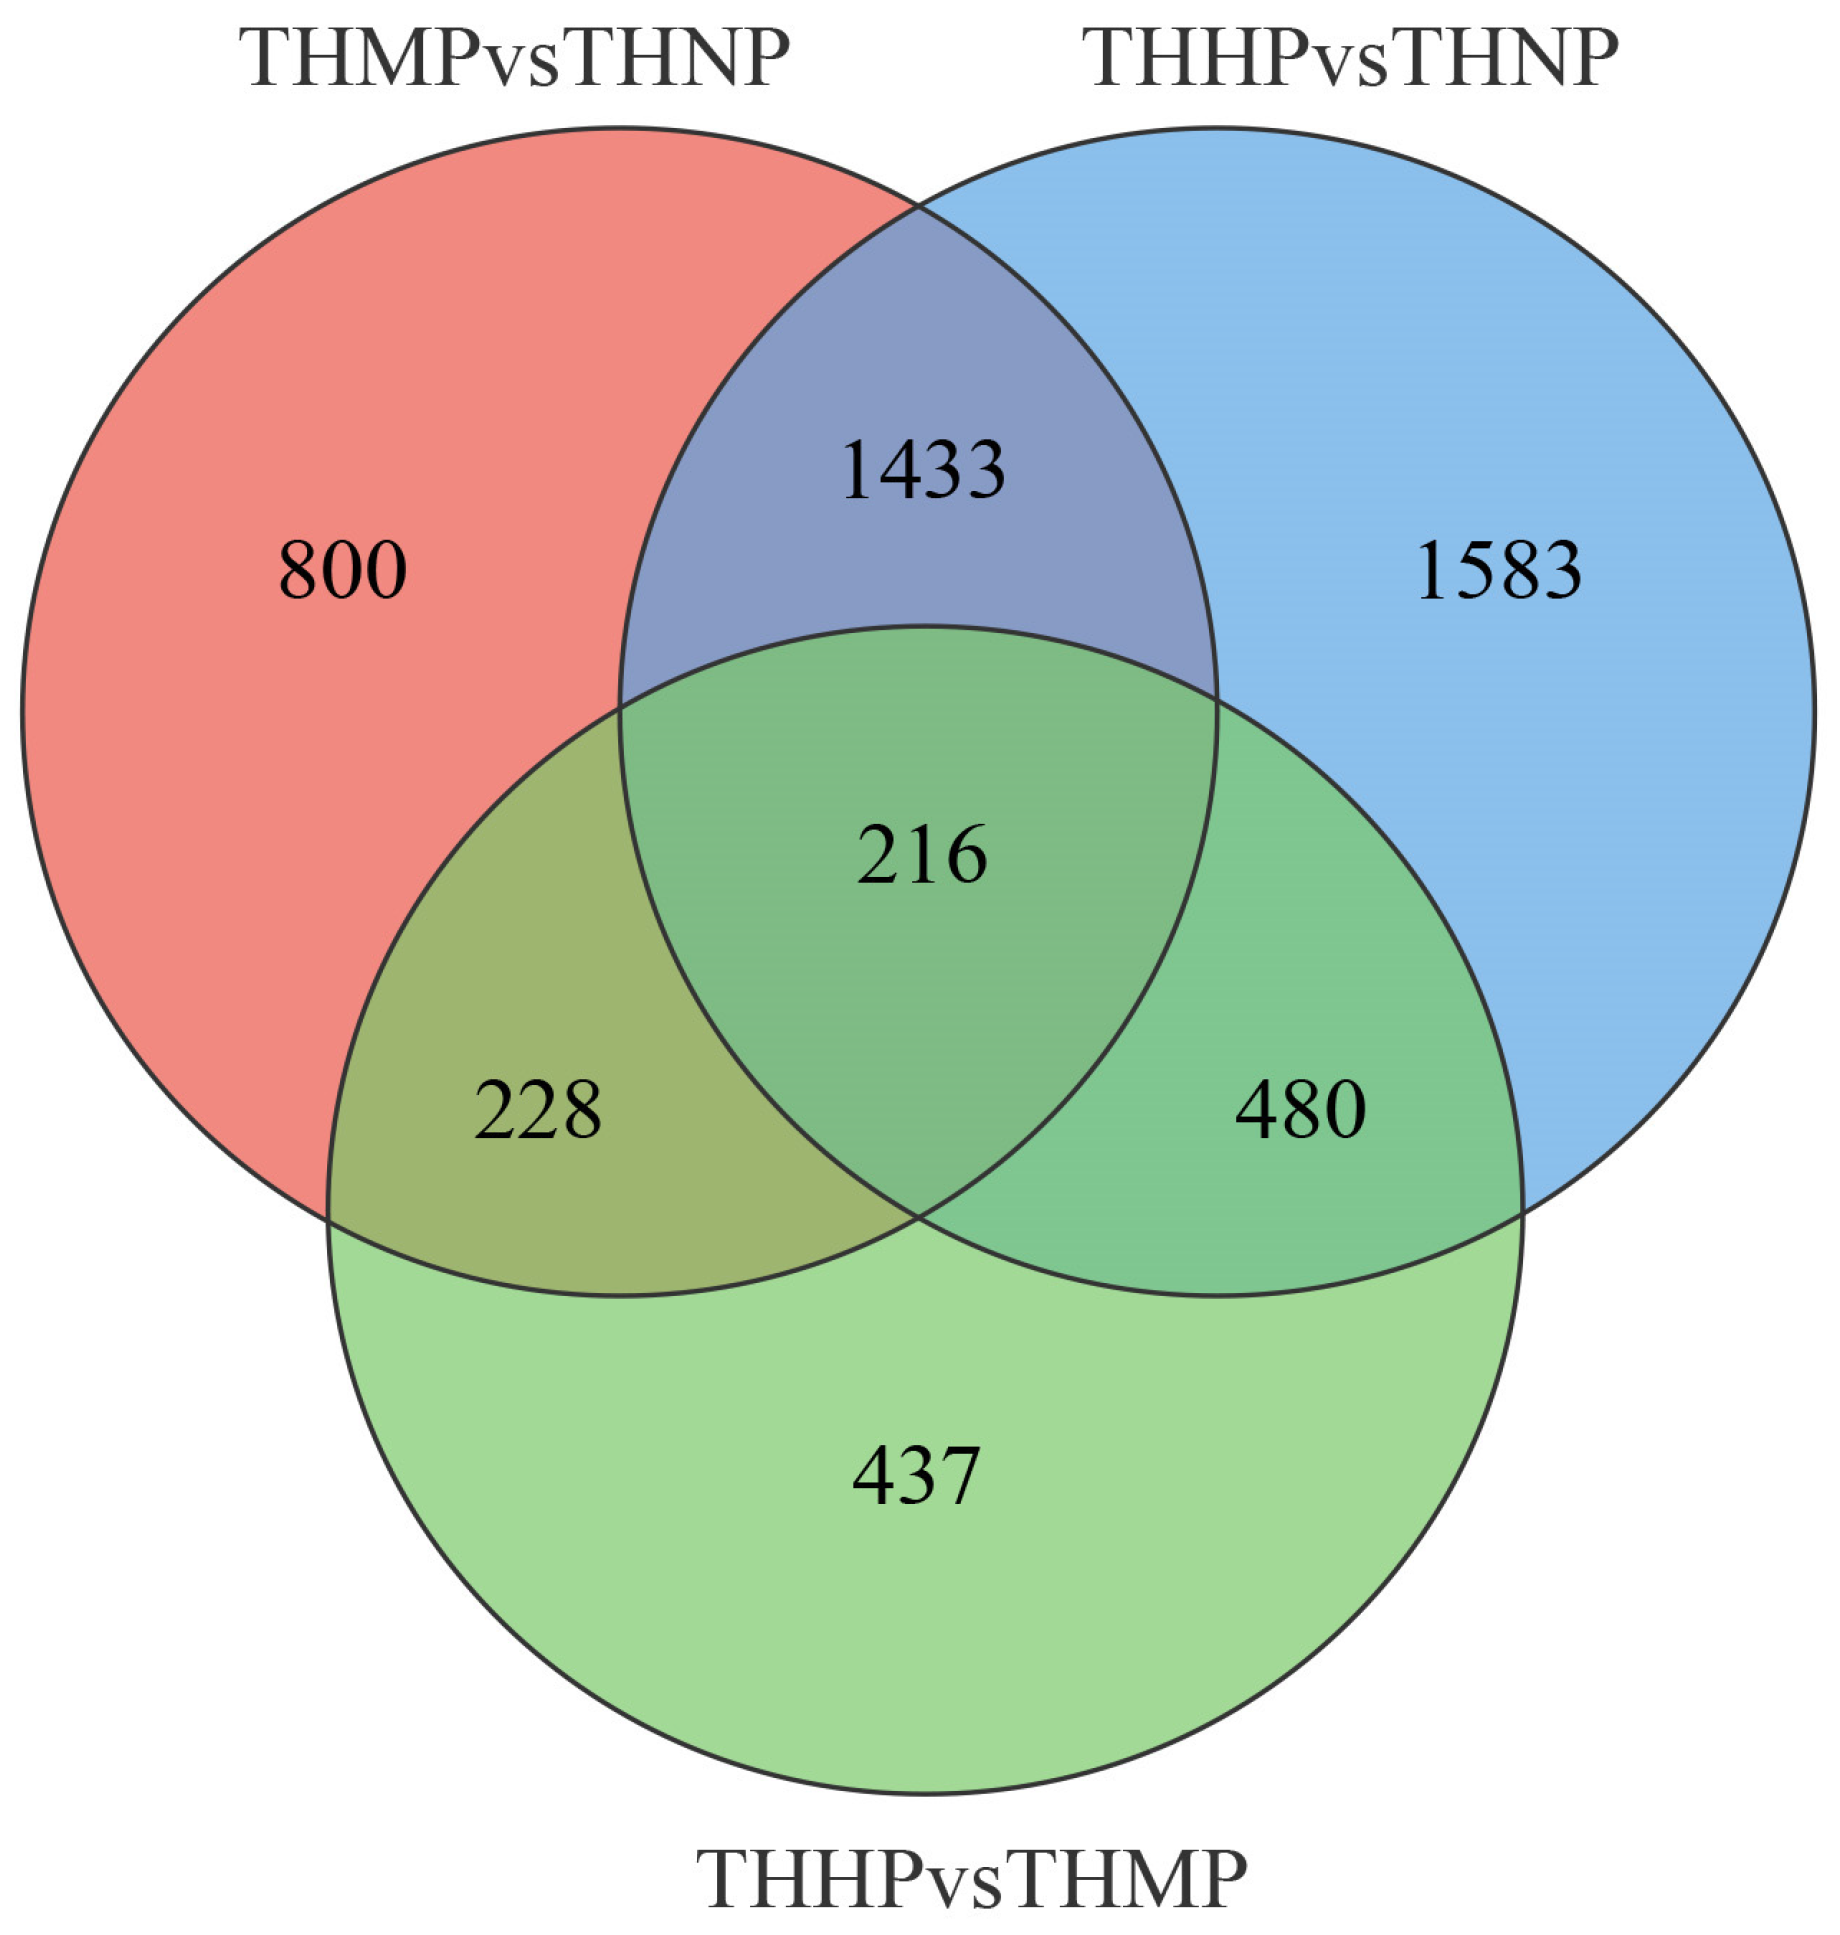
Venn diagrams are used to show the specific number of DEGs among different groups (Figure 3). In this study, 216 DEGs exhibited significant differential expression across all the comparison groups. We hypothesize that these genes play a key role following the addition of organic selenium in oyster feed, and their specific functions warrant further investigation.
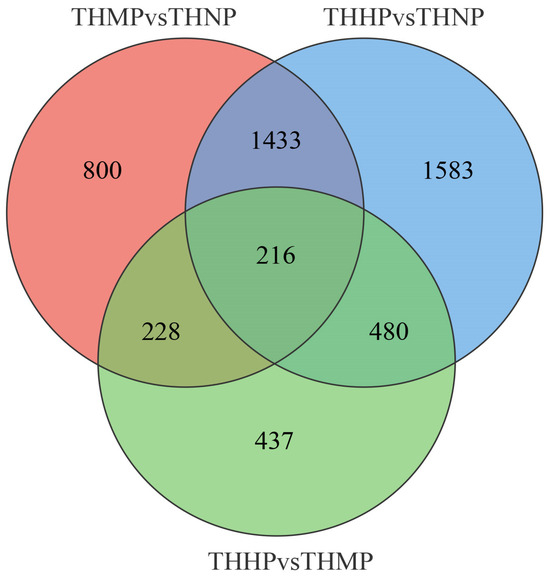
Figure 3.
Venn diagram of DEG expression across different comparison groups after feeding with organic selenium. The intersecting areas represent the DEGs that exhibit significant differential expression across the various comparison groups.
3.3. Functional Enrichment Analysis
Functional enrichment analysis of DEGs provides a clearer understanding of the specific biological functions that genes perform in oysters supplemented with organic selenium. In this study, we conducted Gene Ontology (GO) and KEGG functional enrichment analyses for DEGs exhibiting significant differences between various comparison groups.
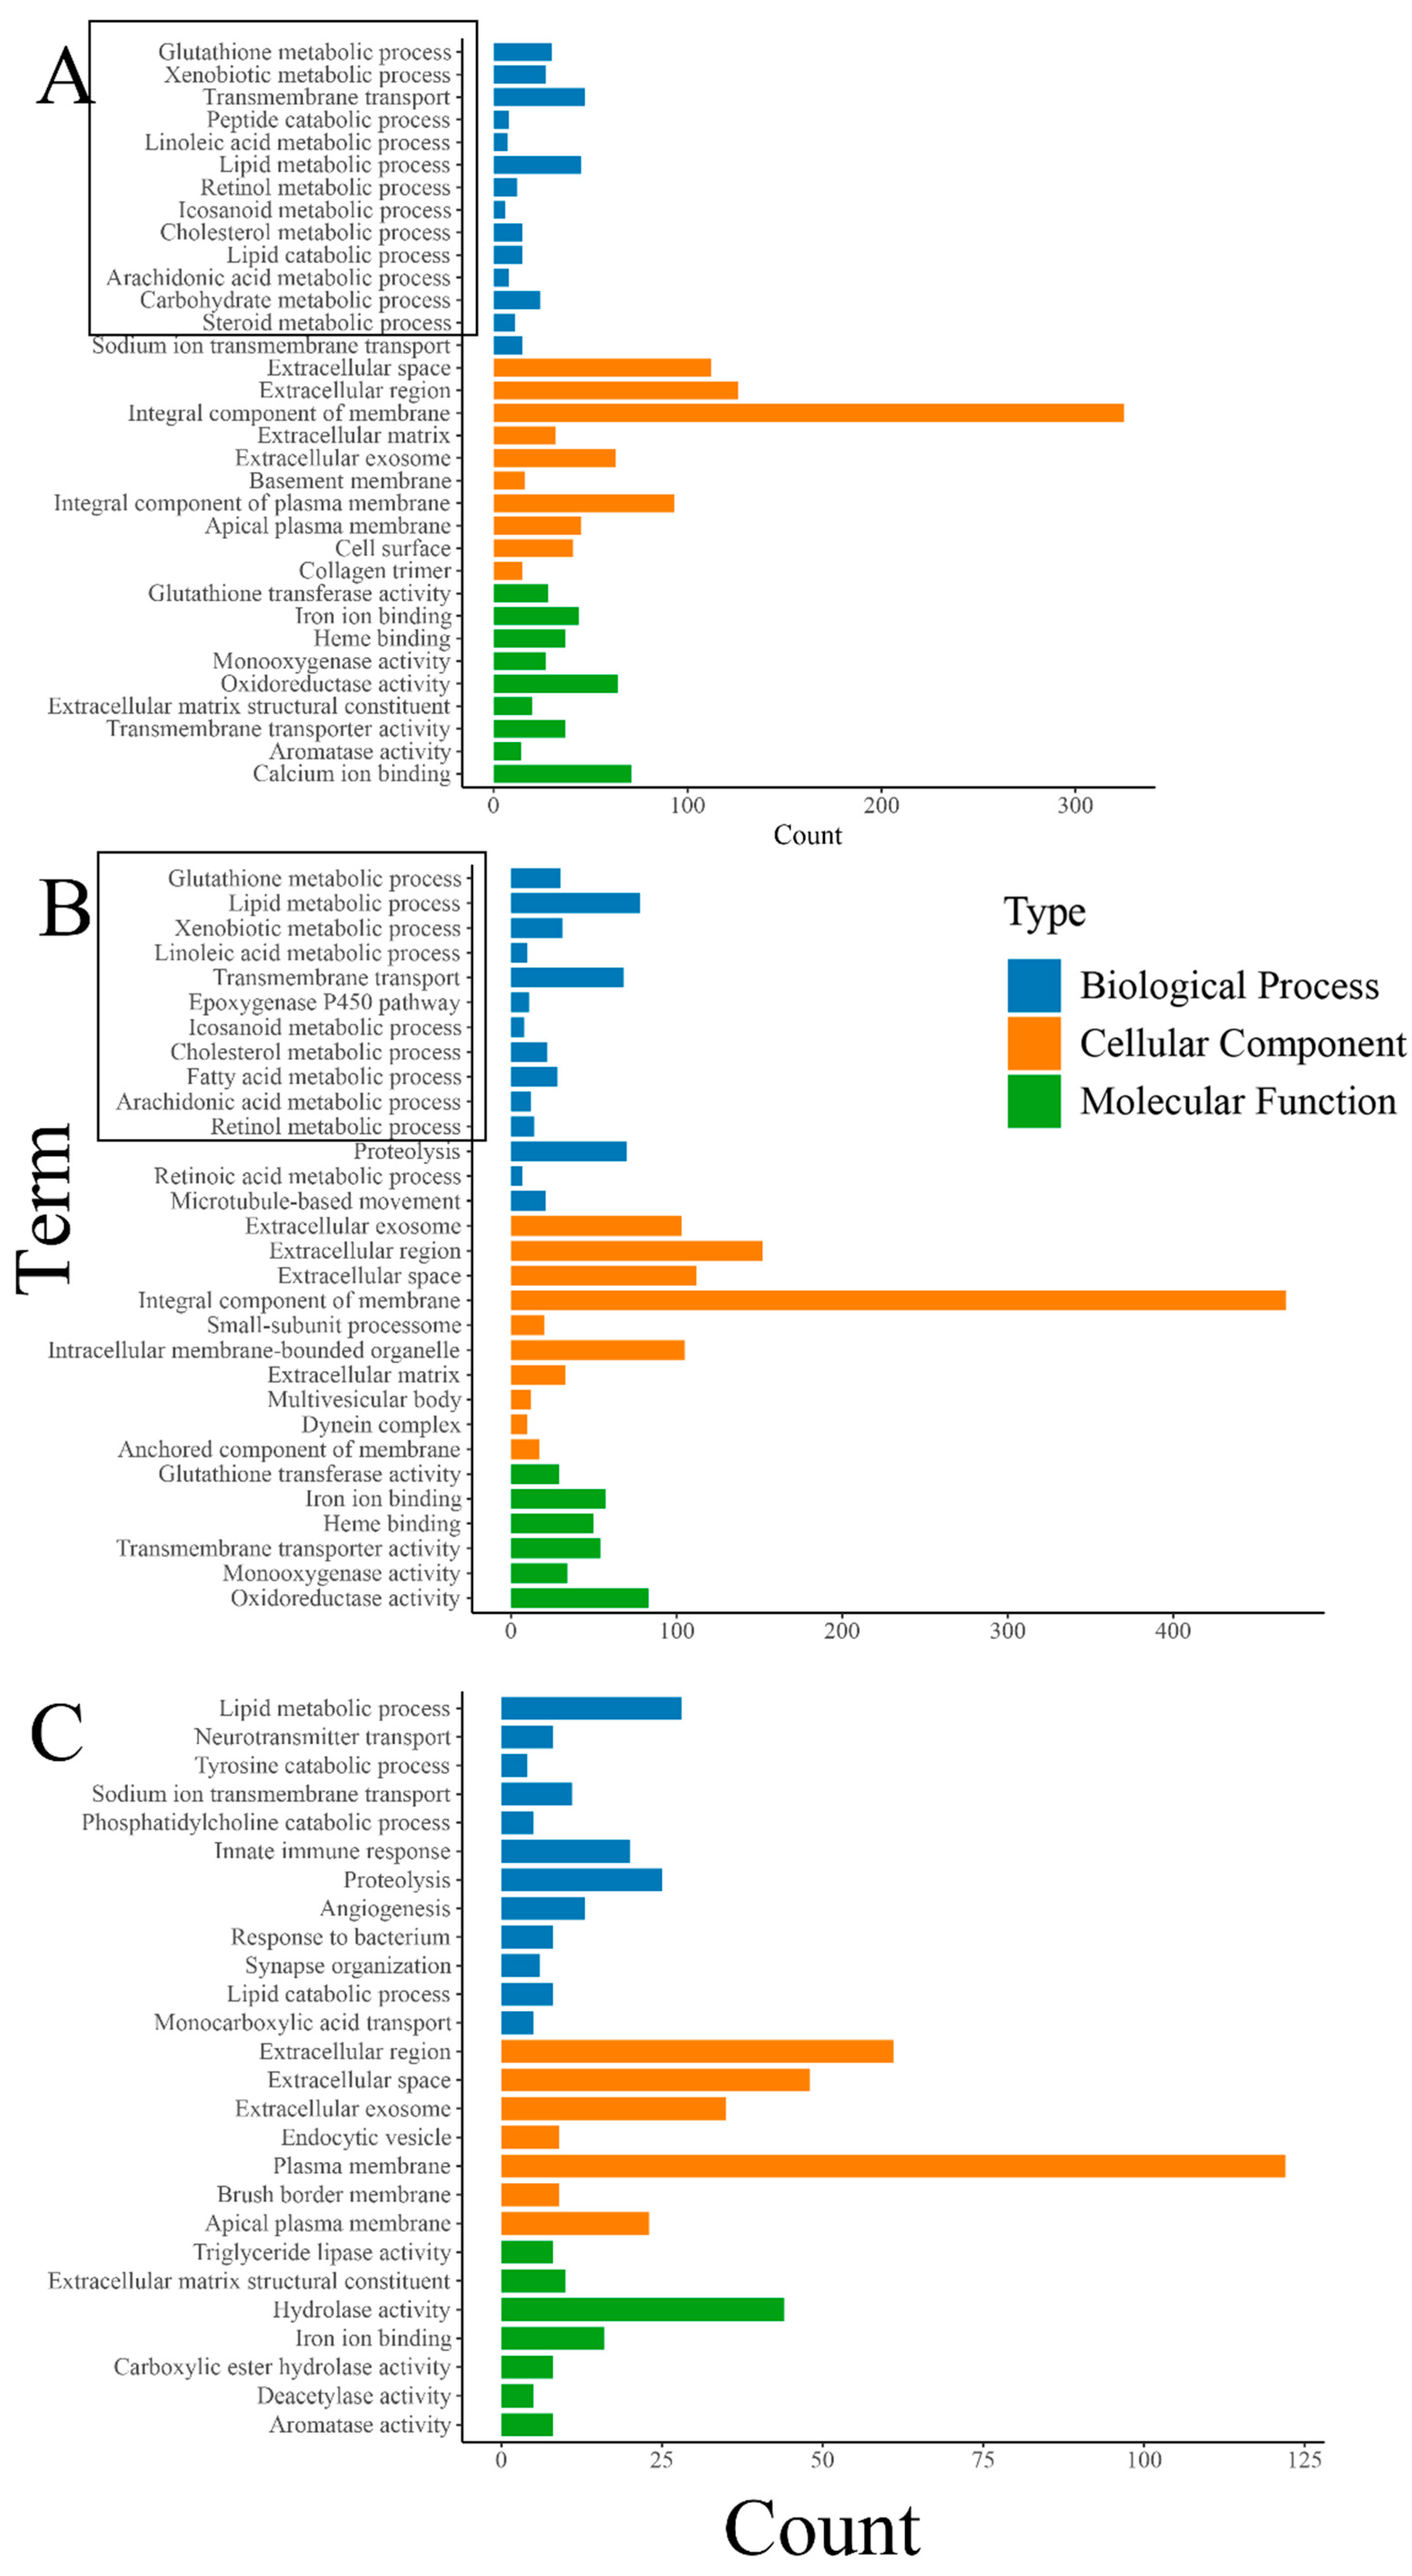
The results of the GO enrichment analysis revealed a significant enrichment of various metabolic-related biological processes, including “glutathione metabolic process”, “lipid metabolic process”, and “fatty acid metabolic process”. Also, biological processes closely related to the growth and development of organisms such as “transmembrane transport” were significantly enriched (Figure 4). The enrichment of numerous metabolic-related processes also indicates that feeding oysters with organic selenium significantly enhances their metabolic level, although this still requires specific validation through biochemical experiments. Differently, the enrichment analysis of DEGs between the treatment groups “THHP” and “THMP” showed significant enrichment of some immune and protein hydrolysis-related biological processes. This phenomenon might be due to the addition of organic selenium at a concentration of 4 ppm, possibly exceeding the optimal level for oysters, causing stress and triggering immune responses and other defensive processes.
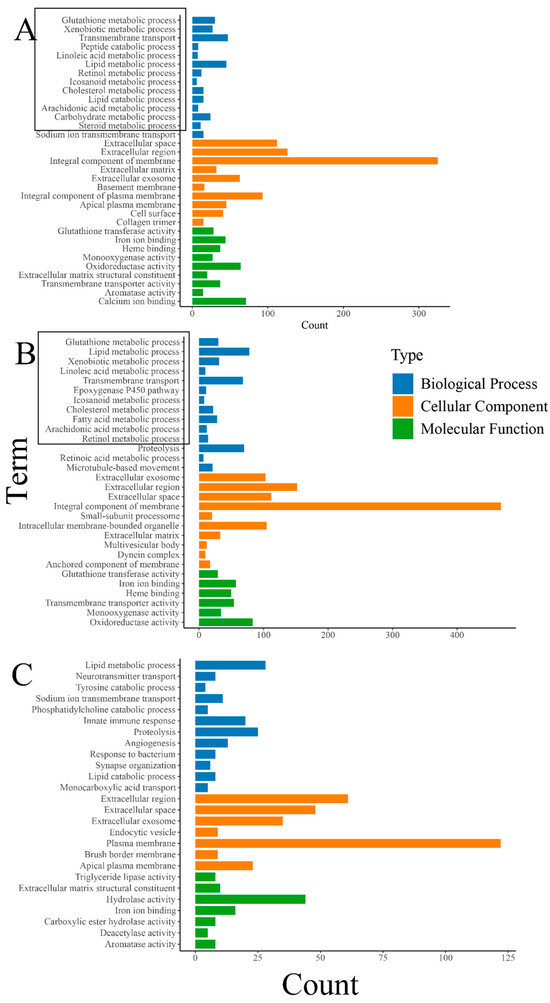
Figure 4.
(A): GO enrichment analysis of DEGs between the treatment group with 2 ppm selenium (THMP) and the control group (THNP); (B): GO enrichment analysis of DEGs between the treatment group with 4 ppm selenium (THHP) and the control group (THNP); (C):GO enrichment analysis of DEGs between the treatment group with 2 ppm selenium (THMP) and the treatment group with 4 ppm selenium (THHP). The horizontal axis represents the number of genes, and the vertical axis represents different GO terms. Different colors denote different GO categories(with bold black indicating metabolism-related terms).
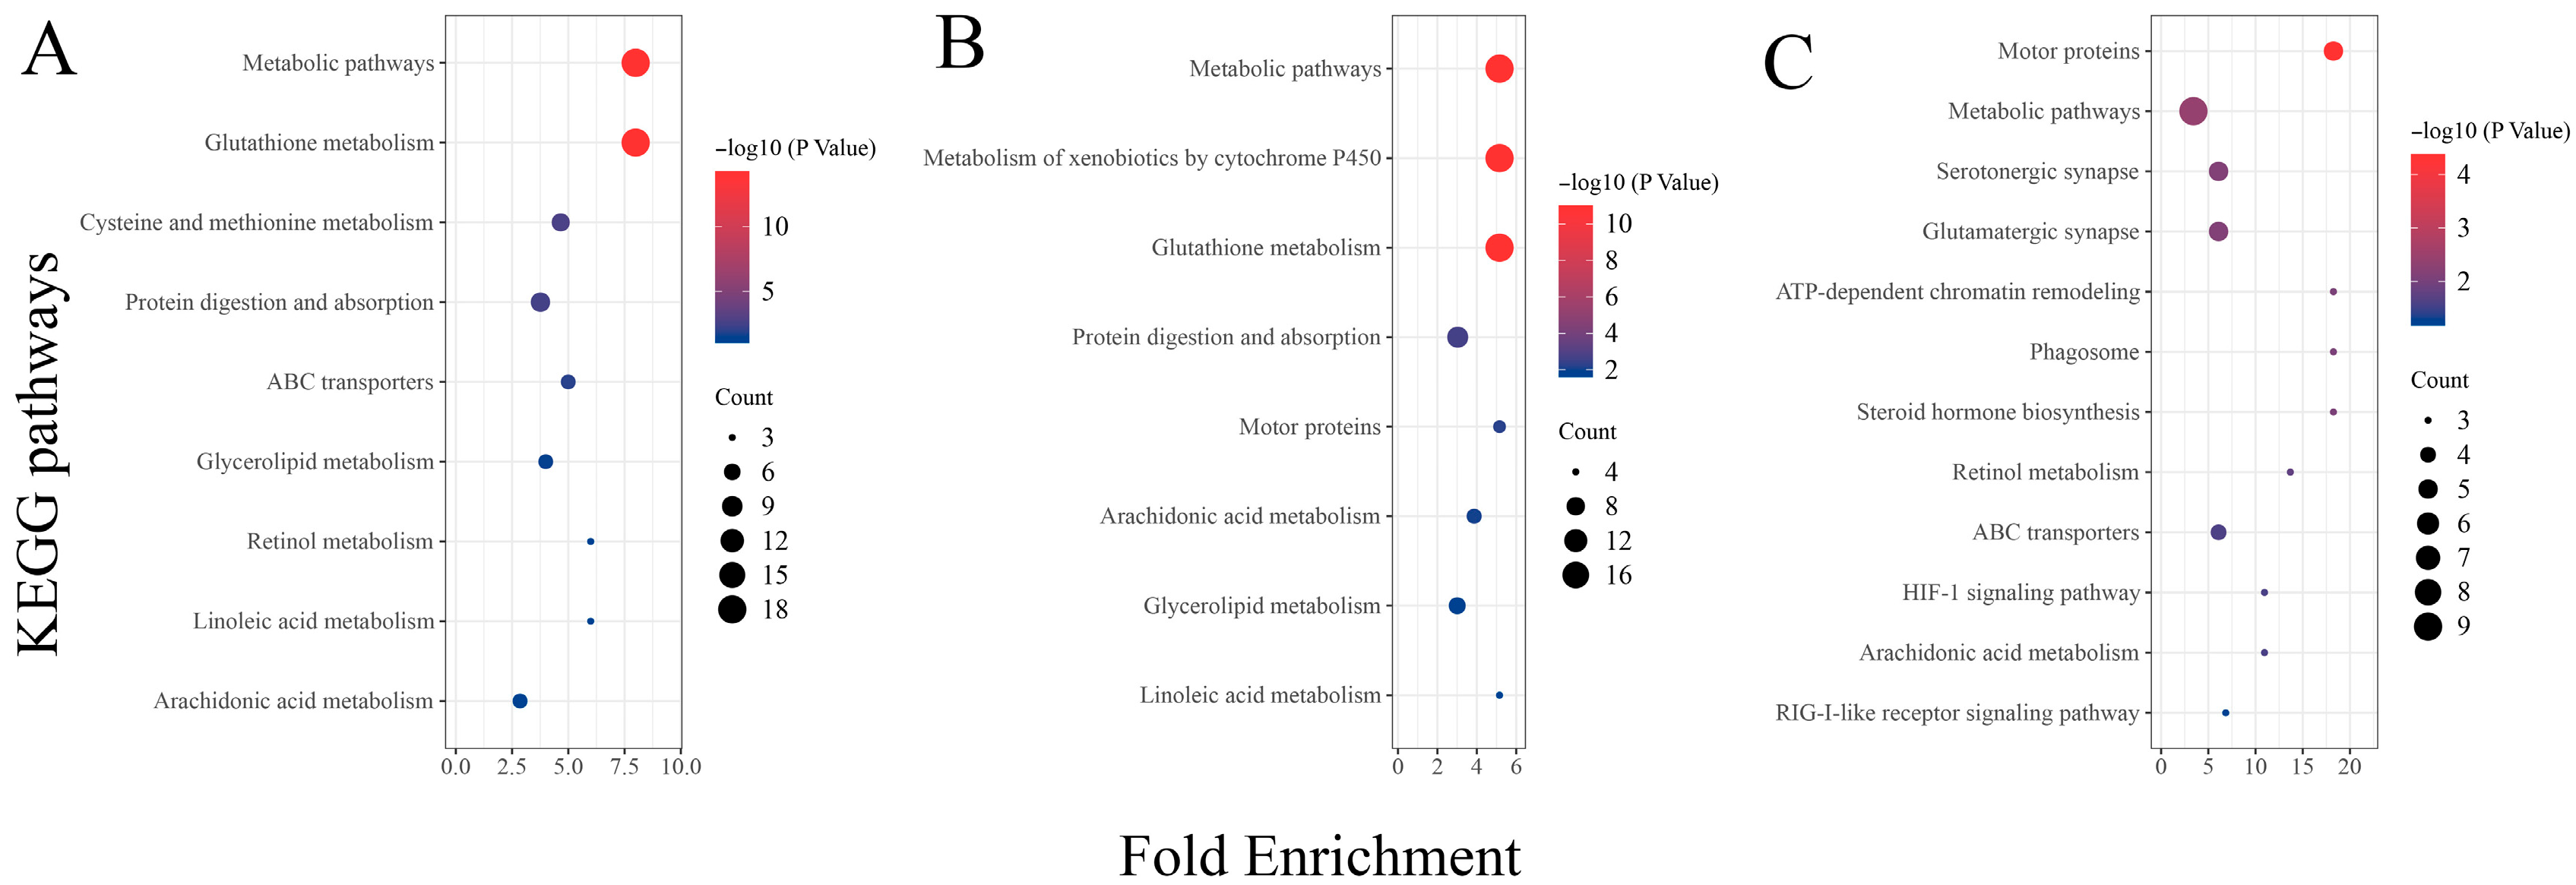
Analysis of the results from the KEGG functional enrichment analysis reveals, similarly to the GO enrichment results, a significant enrichment of metabolic-related signaling pathways between the two different concentration treatment groups (THMP and THHP) compared with the THNP group (Figure 5). These findings also confirm that feeding oysters with organic selenium significantly impacts the metabolic level of the organism. Additionally, DEGs between the different treatment groups (THHP and THMP) were primarily enriched in immune defense and other signaling pathways. This result suggests that a 4 ppm selenium concentration might not be optimal for oysters. However, the number of DEGs in this comparison group is relatively lower compared to others, indicating that this concentration may not be lethal but may activate certain immune defenses in oysters.
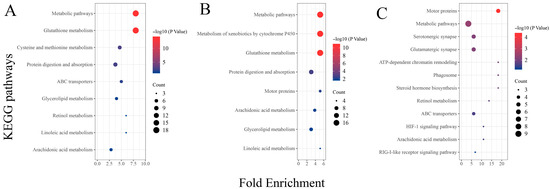
Figure 5.
KEGG enrichment analysis of DEGs in different treatment groups of oysters fed with organic selenium. The horizontal axis represents the enrichment factor, and the vertical axis represents different KEGG signaling pathways. (A): KEGG enrichment analysis of DEGs between the treatment group with 2 ppm selenium (THMP) and the control group (THNP); (B): KEGG enrichment analysis of DEGs between the treatment group with 4 ppm selenium (THHP) and the control group (THNP); (C): KEGG enrichment analysis of DEGs between the treatment group with 2 ppm selenium (THMP) and the treatment group with 4 ppm selenium (THHP).
3.4. PPI Network Analysis
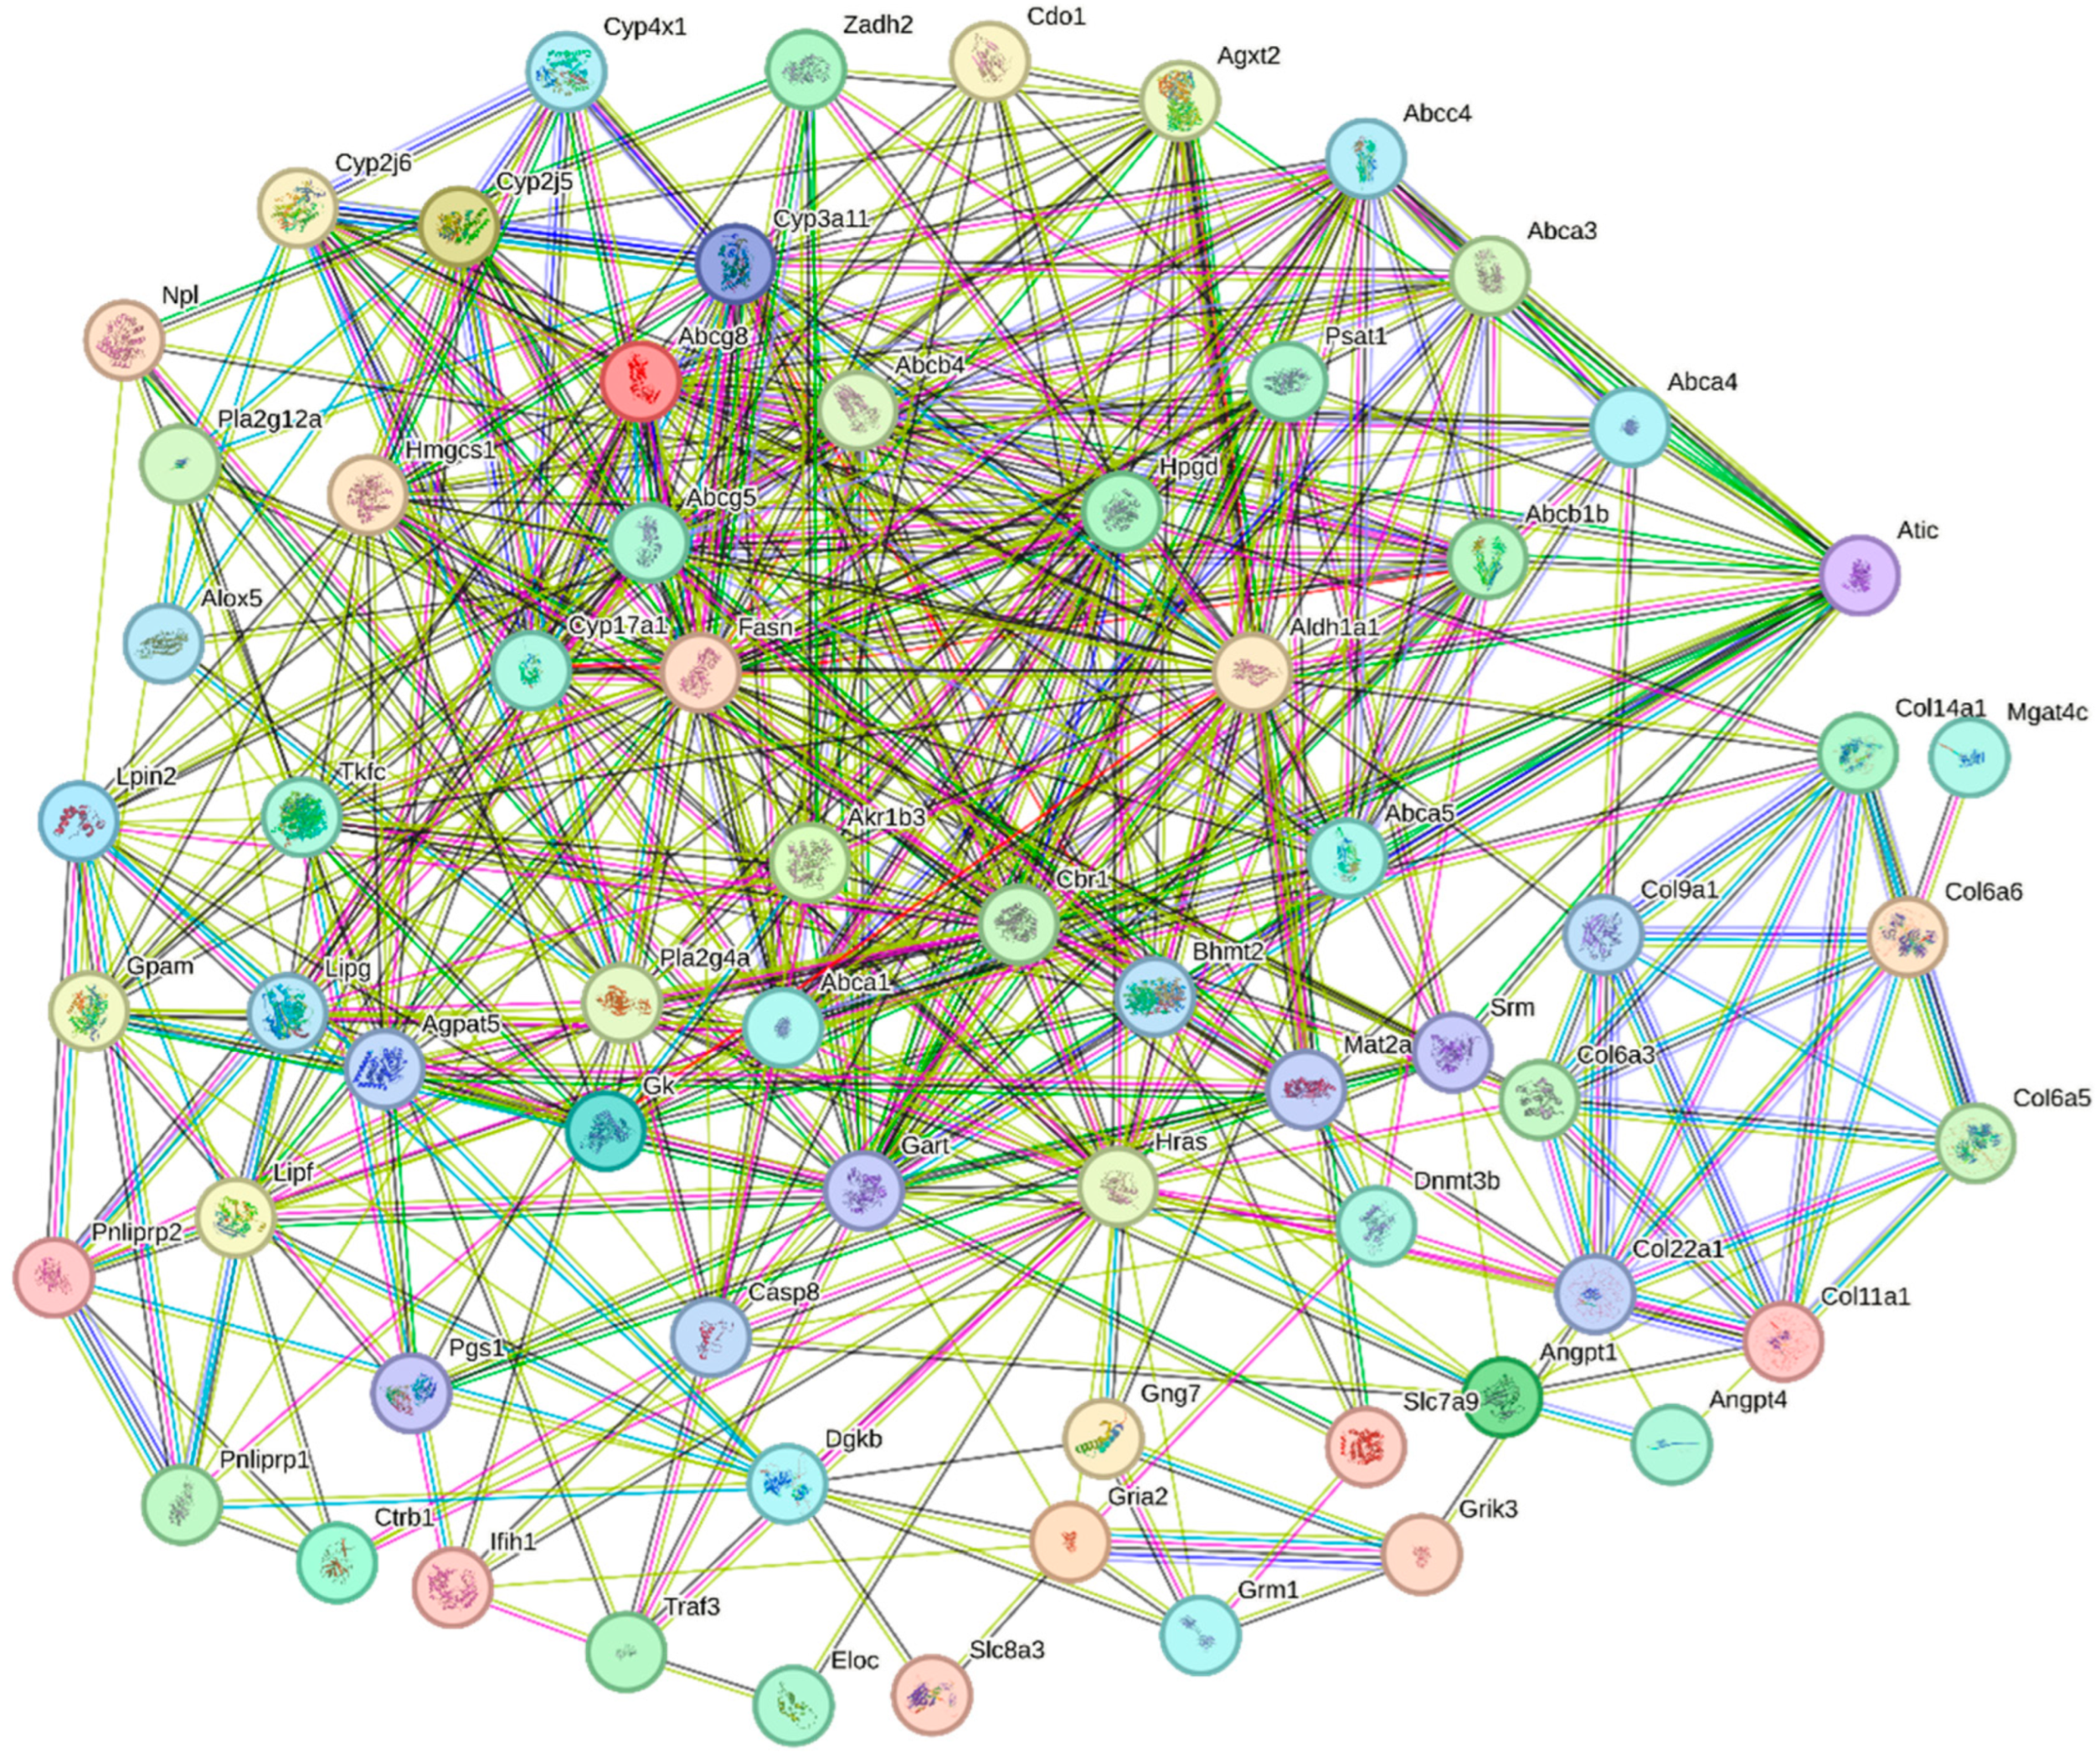
In this study, we uploaded gene sequences of all the DEGs significantly enriched in the KEGG signaling pathways to the STRING website for homologous sequence alignment, using the sequences with the highest scores for the construction of a PPI network (Figure 6 and Table 3). Through a comprehensive analysis of the PPI and KEGG enrichment results, we identified twelve key DEGs that play a crucial role in oysters after being fed with organic selenium (Table 4). These DEGs are likely involved in promoting the growth and development of oysters following the addition of organic selenium to their feed, as suggested by their functional enrichment and expression patterns.
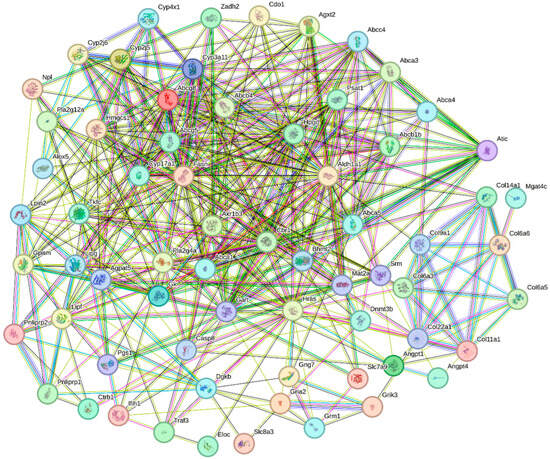
Figure 6.
PPI analysis of DEGs involved in the KEGG signaling pathways in oysters after feeding with organic selenium. Each node represents a protein, and the lines between nodes represent interaction relationships.
Table 3.
Protein interaction network related parameters.
Table 4.
Number of PPI and KEGG of twelve key DEGs.
3.5. Quantitative Validation of DEGs
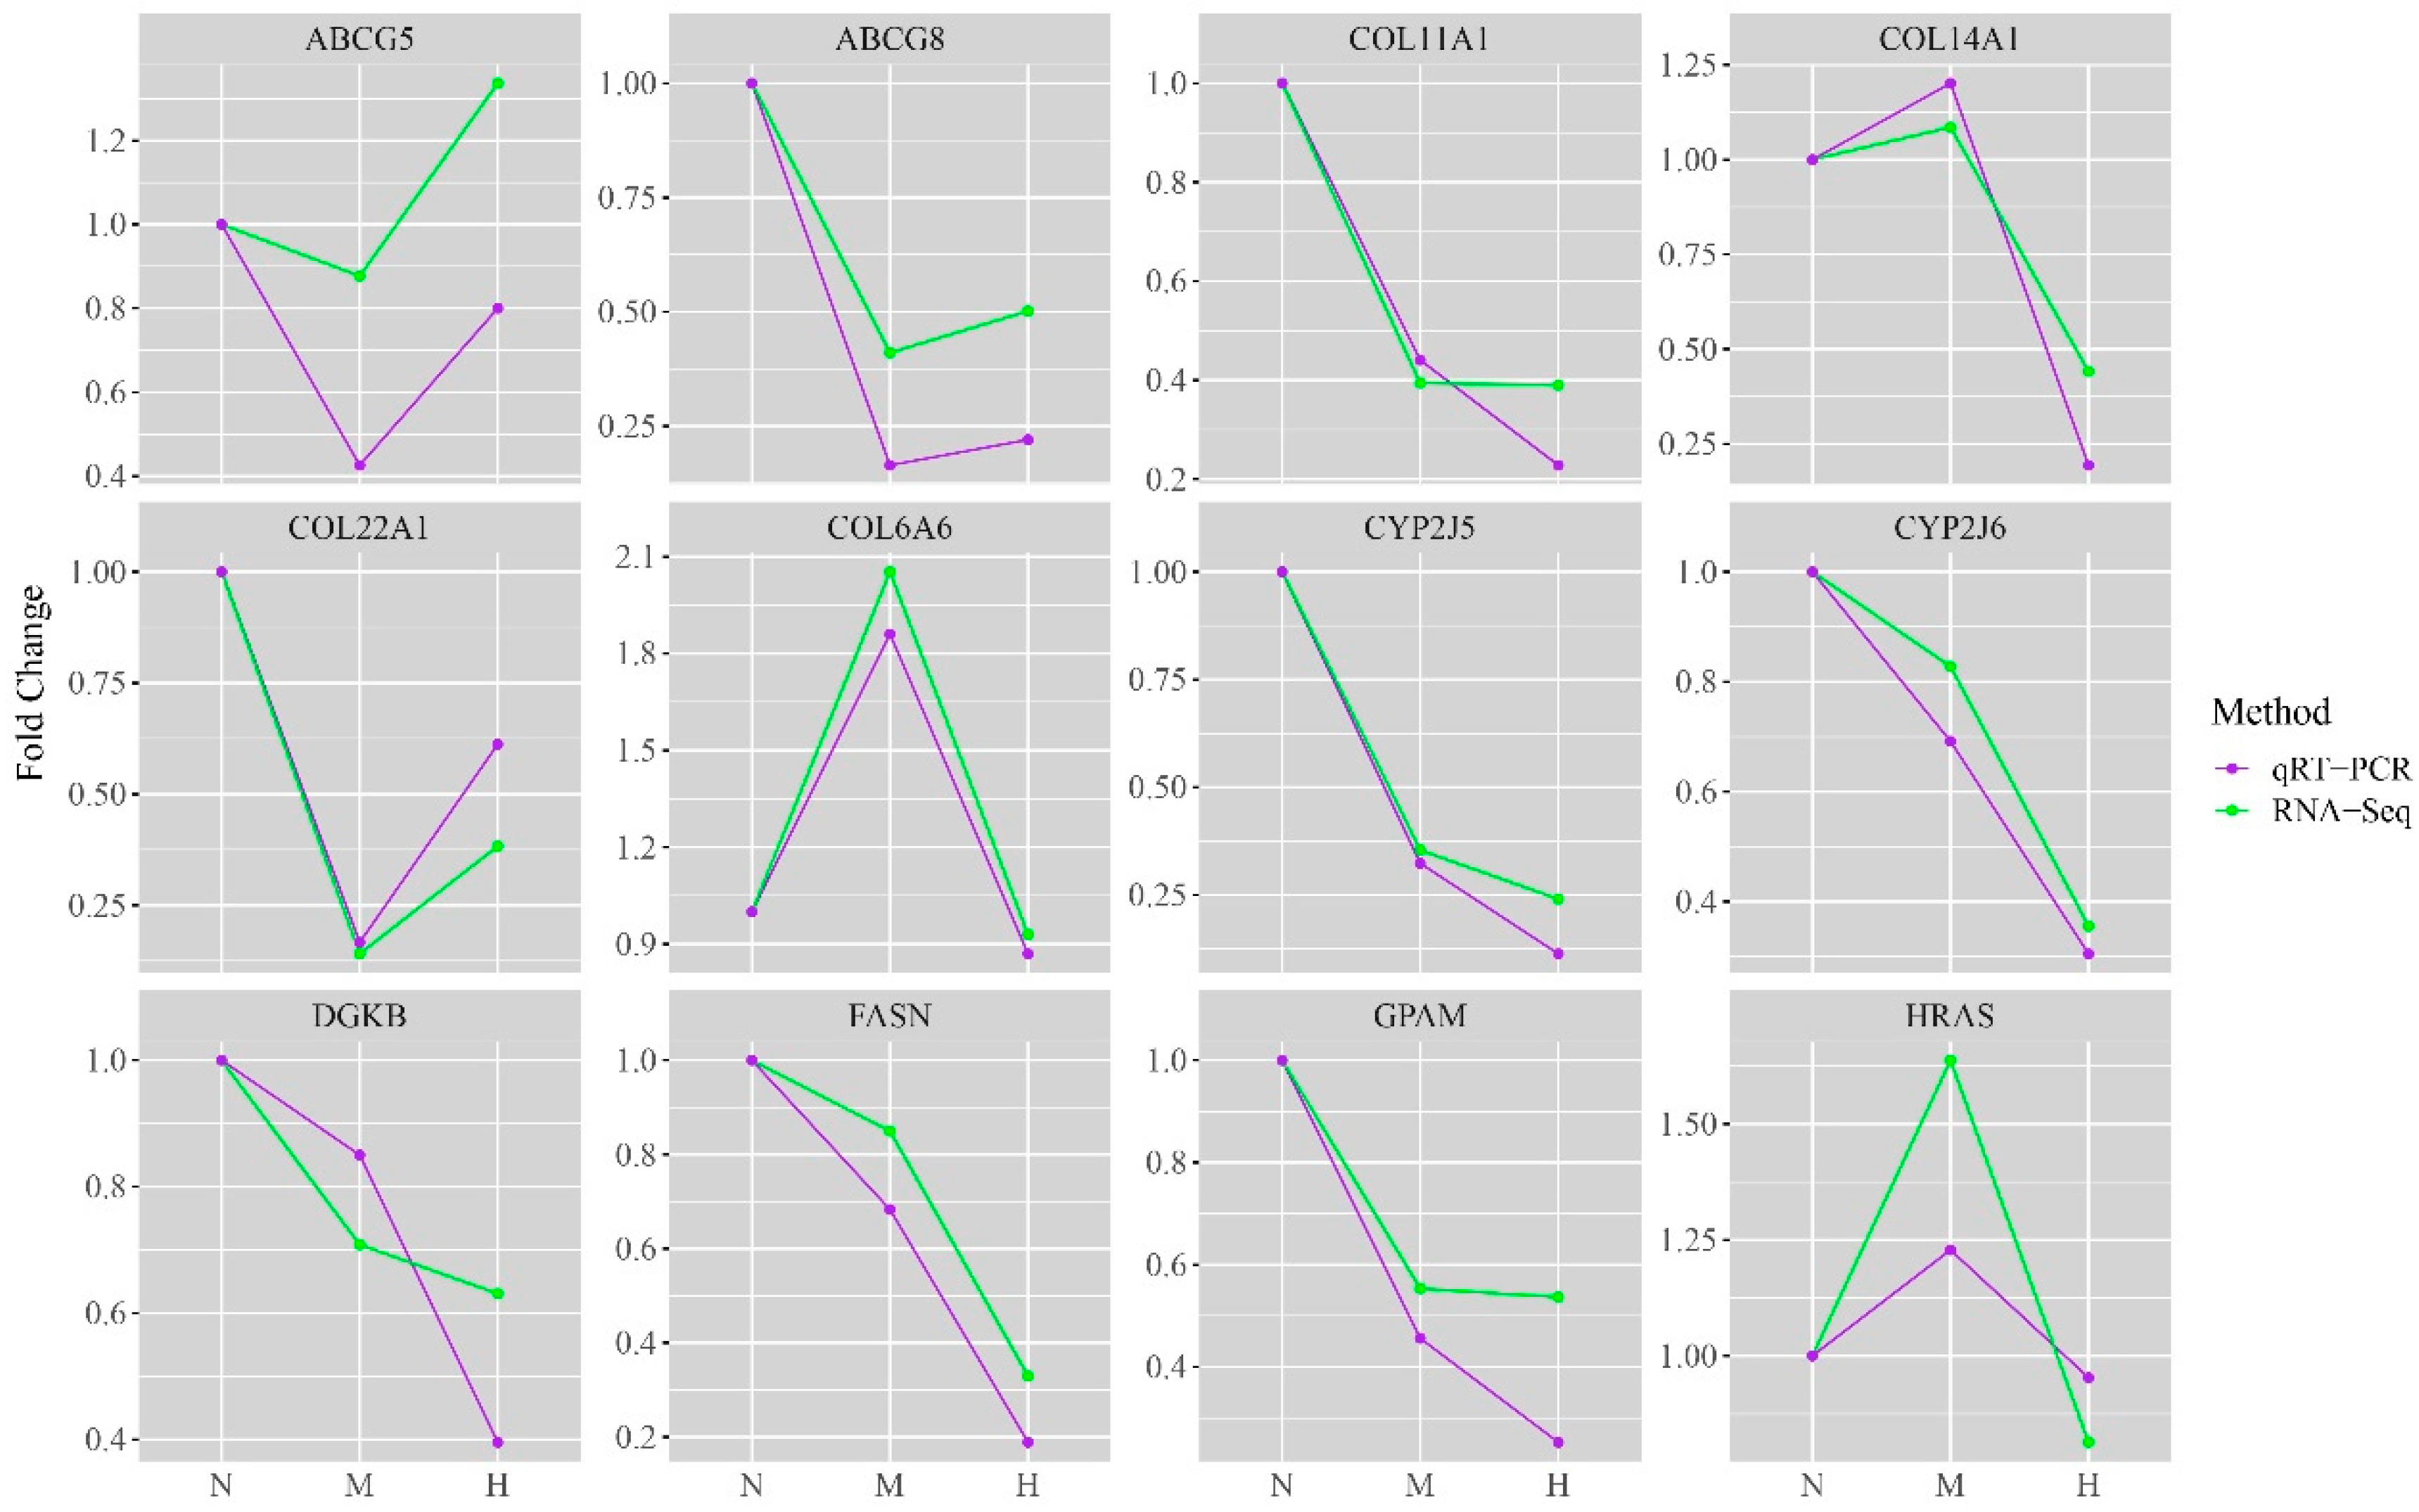
The fluorescence quantitative PCR was used to verify the expression levels of the key genes. The qRT-PCR results demonstrated that the expression trends of the key genes were consistent between different concentrations and that the sequencing results were reliable (Figure 7).
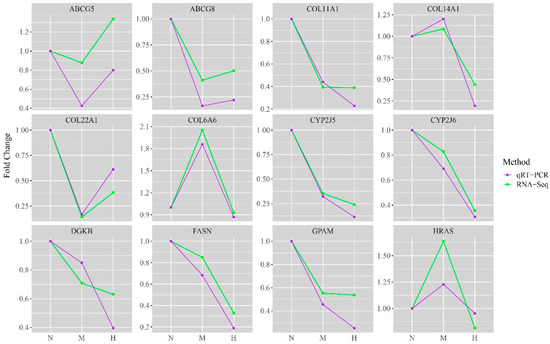
Figure 7.
Quantitative validation of RNA-Seq. The expression trend of DEGs consistently proved the accuracy of the sequencing results. The vertical axis indicates the fold difference between treatment groups. The horizontal axis indicates the different groups: N—fold Change between THNP group and THNP group; M—fold Change between THMP group by THNP group; H—fold Change between THHP group and THNP group.
4. Discussion
4.1. Expression Analysis of DEGs
Selenium is an essential trace element required for the synthesis of various selenoproteins involved in numerous biological processes [30]. In this study, comparative transcriptomic analysis revealed notable differences in gene expression among the experimental groups with varying selenium concentrations. The results suggest that selenium at a concentration of 4 ppm has a greater impact on oysters compared to 2 ppm. The gene expression patterns observed in the volcano plots support this finding. Clustering analysis further showed consistent expression patterns within each treatment group and clear distinctions between groups, indicating good sample reproducibility and providing a solid foundation for subsequent bioinformatics analysis.
4.2. Functional Enrichment Analysis of DEGs
Functional enrichment analysis helps clarify the biological processes in which DEGs are involved [31]. In this study, GO and KEGG enrichment analyses revealed that DEGs between the THNP and THMP groups were mainly associated with metabolic processes such as lipid and fatty acid metabolism, which are crucial for development and immunity [32]. The enrichment of these pathways suggests that selenium exposure affects oyster metabolism. Similar GO results were observed between THNP and THHP, but with more DEGs, indicating a stronger effect at 4 ppm. In contrast, DEGs between THMP and THHP were enriched in immune-related processes, implying an immune response under higher selenium levels. As the innate immune system plays a central role in maintaining internal homeostasis [33], the results suggest that a 4 ppm concentration of selenium may not be optimal for oyster growth and development, as it appears to induce immune-related responses. KEGG analysis supported these findings, with metabolism-related pathways enriched in both selenium-treated groups compared to THNP, and immune-related pathways significantly enriched between THMP and THHP. Notably, the RIG-I-like receptor signaling pathway, a key innate immune pathway, was significantly activated. As a critical member of the pattern recognition receptor (PRR) family, RIG-I-like receptors can initiate innate immune defenses through this pathway, thereby protecting the host organism [34]. These results suggest that appropriate selenium levels can enhance metabolism and promote growth, while higher concentrations (e.g., 4 ppm) may induce immune responses in oysters.
4.3. Functional Analysis of Key DEGs
Proteins are the basis of life activities, and the growth and development of organisms cannot be separated from the support of proteins [35,36,37]. The PPI is able to analyze the interaction relationship between genes encoding proteins, which can help us to understand the molecular mechanism of DEGs encoding proteins more clearly [38]. In this study, we constructed a PPI network using DEGs significantly enriched in the KEGG signaling pathway. Based on the results of the PPI and KEGG enrichment analysis, the signaling pathways and DEGs that played a key role after selenium addition to oyster feed were identified.
4.3.1. Glutathione Metabolism During Selenium Supplementation
Glutathione, an antioxidant synthesized by a two-enzyme reaction catalyzed by glutamate cysteine ligase and glutathione synthetase, plays a key role in protecting cells from oxidative damage and the toxicity of xenobiotic electrophilic reagents as well as maintaining redox homeostasis [39,40,41]. Usually, glutathione can be used directly as an antioxidant to protect cells from free radicals and pro-oxidants and as a cofactor for antioxidant and detoxification enzymes (glutathione peroxidase, glutathione S-transferase, and glyoxalase) [42,43,44]. A previous study has pointed out that tropical fish show a stress response specifically characterized by increased glutathione-S-transferase activity in the gills and increased concentration of reduced glutathione (GSH) in the liver after a high temperature stimulus [45]. This suggests that glutathione is effective in enhancing the antioxidant capacity of organisms and protects them from damage. Nguyen et al. conducted a metabolomic analysis of blood cells of Perna canaliculus after copper stimulation and found that the level of glutathione metabolism exhibits oxidative stress in organisms [46]. In the enrichment analysis results of this study, gene expression related to glutathione metabolism showed significant upregulation in the THMP and THHP groups compared to the THNP group. We found that the glutathione metabolism pathway was significantly upregulated, which may enhance the antioxidant capacity of oysters and thereby support their growth and fattening process, ultimately contributing to improved economic benefits in oyster culture.
4.3.2. Collagen Family
Collagen is a structural protein containing three helical structural domains that play key roles in tissue renewal and repair [47,48,49]. It is primarily involved in forming fibrillar and microfibrillar networks in the extracellular matrix, basement membrane, and other extracellular structures [50,51,52]. In addition to maintaining tissue integrity, collagen participates in cell adhesion, wound healing, and inflammatory regulation [53,54]. In this study, several collagen family genes, including COL11A1, COL14A1, COL22A1, and COL6A6, were significantly downregulated in oysters fed selenium-enriched yeast. This downregulation may suggest potential effects of selenium supplementation on tissue remodeling or extracellular matrix dynamics. However, without direct phenotypic, histological, or health-related data, this remains a hypothesis, and further functional validation is required to confirm any biological impact.
4.3.3. Analysis of Hub Genes
Through the integrated analysis of PPI network and KEGG enrichment results, three key genes were identified: FASN, HRAS, and ABCG5. Fatty acids play essential roles in energy transport and storage, cell membrane structure, and hormone synthesis [55,56,57]. FASN, a key enzyme in lipid metabolism, is vital for growth and development [58,59]. In this study, FASN was significantly downregulated in the selenium-treated groups, possibly due to the inhibition of fatty acid metabolism by organic selenium. This metabolic suppression may contribute to oyster fattening. HRAS encodes H-Ras, a core component of the RAS/MAPK signaling pathway, which regulates cell proliferation, differentiation, survival, and apoptosis [60,61,62]. Here, HRAS expression showed an initial increase followed by a decrease with rising selenium concentration, suggesting that 2 ppm selenium may promote oyster cell proliferation, whereas higher concentrations may impair growth. Cholesterol is crucial for cell growth and function, and imbalances can lead to disease [63,64]. ABCG5 belongs to the ATP-binding cassette (ABC) transporter family. After heterodimerizing with its partner protein in the endoplasmic reticulum, it localizes to the apical membrane and participates in the transport of cholesterol and phytosterols, as well as bile secretion [65,66]. In this study, its expression decreased at 2 ppm selenium but increased again at 4 ppm, implying that moderate selenium enhances cholesterol levels to support growth, while excessive selenium may upregulate ABCG5 to reduce cholesterol, potentially affecting development. Notably, immune-related signaling pathways were enriched in the comparison between THMP and THHP, suggesting that 4 ppm selenium may be excessive for oysters and could trigger immune defense responses.
5. Conclusions
In this study, high-throughput transcriptome sequencing was employed to investigate the molecular mechanisms altered in oysters following dietary supplementation with different concentrations of selenium-enriched yeast. Through the quantitative analysis of DEGs, GO and KEGG functional enrichment analysis, and comprehensive analysis of protein–protein interaction networks, twelve key DEGs and metabolism-related signaling pathways were identified following selenium addition to oyster feed.
The downregulation of the glutathione metabolic pathway suggests that the addition of organic selenium can facilitate the fattening process of oysters to some extent. The downregulation of the collagen family also demonstrated that organic selenium had an effect on changes in tissue structure. The changes in the expression trends of the three pivotal genes also indicated that the addition of moderate amounts of organic selenium could significantly promote the fattening process of oysters, and thus improve the economic benefits of oyster farming. In summary, feeding appropriate concentrations of selenium-enriched yeast can help oysters accelerate the fattening process. The results of this study may provide a suitable reference for feed addition to oysters during aquaculture.
Supplementary Materials
The following supporting information can be downloaded at: https://www.mdpi.com/article/10.3390/biology14070898/s1, Table S1: Experimental oyster phenotypic data in 2023.04.
Author Contributions
Conceptualization, Z.L., W.W. and J.Y.; methodology, Z.L., Y.W., C.C., Y.Z., X.L., L.J. and X.J.; writing—original draft preparation, Y.Z.; writing—review and editing, W.W. and Z.L.; supervision, W.W. and Z.L.; project administration, Z.L., W.W. and J.Y.; funding acquisition, W.W. and J.Y. All authors have read and agreed to the published version of the manuscript.
Funding
This research was supported by the Earmarked Fund for the General Program of the Shandong Provincial Natural Science Foundation (Grant No. ZR2024MD065), the General Program of the National Natural Science Foundation of China (Grant No. 42476107), the Fund of Shandong Engineering Research Center of Oyster Germplasm Creation and Efficient Culture, the Weihai Elite Program A-level Talent Funding Program, and the Yantai Science and Technology Plan Project (Grant No. 2023YD088).
Institutional Review Board Statement
This research was conducted in accordance with the protocols of the Institutional Animal Care and Use Committee of Ludong University (protocol number LDU-IRB20210308NXY) and the China Government Principles for the Utilization and Care of Invertebrate Animals Used in Testing, Research, and Training (State Science and Technology Commission of the People’s Republic of China for No. 2, 31 October 1988).
Informed Consent Statement
Not applicable.
Data Availability Statement
Data will be made available upon request.
Conflicts of Interest
The authors declare no conflicts of interest.
Abbreviations
The following abbreviations are used in this manuscript:
| C. gigas | Crassostrea gigas |
| GO | Gene Ontology |
| KEGG | Kyoto Encyclopedia of Genes and Genomes |
| DEGs | Differentially expressed genes |
| qRT-PCR | quantitative Reverse Transcription Polymerase Chain Reaction |
| PPI | Protein–Protein Interaction |
References
- Oropeza-Moe, M.; Wisløff, H.; Bernhoft, A. Selenium deficiency associated porcine and human cardiomyopathies. J. Trace. Elem. Med. Biol. 2015, 31, 148–156. [Google Scholar] [CrossRef] [PubMed]
- Lv, L.; Zhang, H.; Liu, Z.; Lei, L.; Feng, Z.; Zhang, D.; Ren, Y.; Zhao, S. Comparative study of yeast selenium vs. sodium selenite on growth performance, nutrient digestibility, anti-inflammatory and anti-oxidative activity in weaned piglets challenged by Salmonella typhimurium. Innate. Immun. 2020, 26, 248–258. [Google Scholar] [CrossRef] [PubMed]
- Pecoraro, B.M.; Leal, D.F.; Frias-De-Diego, A.; Browning, M.; Odle, J.; Crisci, E. The health benefits of selenium in food animals: A review. J. Animal. Sci. Biotechnol. 2022, 13, 58. [Google Scholar] [CrossRef] [PubMed]
- Wang, N.; Tan, H.Y.; Li, S.; Xu, Y.; Guo, W.; Feng, Y. Supplementation of Micronutrient Selenium in Metabolic Diseases: Its Role as an Antioxidant. Oxid. Med. Cell. Longev. 2017, 2017, 7478523. [Google Scholar] [CrossRef] [PubMed]
- White, P.J. Selenium accumulation by plants. Ann. Bot. 2016, 117, 217–235. [Google Scholar] [CrossRef] [PubMed]
- Avery, J.; Hoffmann, P. Selenium, Selenoproteins, and immunity. Nutrients 2018, 10, 1203. [Google Scholar] [CrossRef] [PubMed]
- Li, H.; Jia, L.; Deng, Z.; Sun, X.; Zhang, H.; Li, H. The effects of selenium on the growth and bone development in the weaned rats. Food Biosci. 2023, 55, 103018. [Google Scholar] [CrossRef]
- Wells, M.; Basu, P.; Stolz, J.F. The physiology and evolution of microbial selenium metabolism. Metallomics 2021, 13, mfab024. [Google Scholar] [CrossRef] [PubMed]
- Chen, H.; Li, J.; Yan, L.; Cao, J.; Li, D.; Huang, G.Y.; Shi, W.J.; Dong, W.; Zha, J.; Ying, G.G.; et al. Subchronic effects of dietary selenium yeast and selenite on growth performance and the immune and antioxidant systems in Nile tilapia Oreochromis niloticus. Fish Shellfish Immunol. 2020, 97, 283–293. [Google Scholar] [CrossRef] [PubMed]
- Tian, J.; Zhang, Y.; Zhu, R.; Wu, Y.; Liu, X.; Wang, X. Red elemental selenium (Se0) improves the immunoactivities of EPC cells, crucian carp and zebrafish against spring viraemia of carp virus. J. Fish Biol. 2021, 98, 208–218. [Google Scholar] [CrossRef] [PubMed]
- Gul, F.; Ahmad, B.; Afzal, S.; Ullah, A.; Khan, S.; Aman, K.; Khan, M.T.; Hadi, F.; Kiran, K.; Zahra, M.; et al. Comparative analysis of various sources of selenium on the growth performance and antioxidant status in broilers under heat stress. Braz. J. Biol. 2021, 83, e251004. [Google Scholar] [CrossRef] [PubMed]
- Ferrari, L.; Cattaneo, D.M.I.R.; Abbate, R.; Manoni, M.; Ottoboni, M.; Luciano, A.; von Holst, C.; Pinotti, L. Advances in selenium supplementation: From selenium-enriched yeast to potential selenium-enriched insects, and selenium nanoparticles. Anim. Nutr. 2023, 14, 193–203. [Google Scholar] [CrossRef] [PubMed]
- Mo, A.; Wang, X.; Yuan, Y.; Liu, C.; Wang, J. Effects of waterborne exposure to environmentally relevant concentrations of selenite on reproductive function of female zebrafish: A life cycle assessment. Environ. Pollut. 2021, 270, 116–237. [Google Scholar] [CrossRef] [PubMed]
- Olgun, O.; Yıldız, A.; Cufadar, Y. The effects of eggshell and oyster shell supplemental as calcium sources on performance, eggshell quality and mineral excretion in laying hens. Indian J. Anim. Res. 2015, 49, 205–209. [Google Scholar] [CrossRef]
- Wang, X.; Li, C.; Jia, Z.; Xu, T.; Wang, Y.; Sun, M.; Han, S.; Wang, X.; Qiu, L. Regulation of apoptosis by Pacific oyster Crassostrea gigas reveals acclimation strategy to CO2 driven acidification. Ecotoxicol. Environ. Saf. 2021, 217, 112235. [Google Scholar] [CrossRef] [PubMed]
- He, X.; Wu, F.; Wang, L.; Li, L.; Zhang, G. Integrated application of transcriptomics and metabolomics provides insights into condition index difference mechanisms in the Pacific oyster (Crassostrea gigas). Genomics 2022, 114, 110413. [Google Scholar] [CrossRef] [PubMed]
- Bao, X.; Wang, W.; Chen, X.; Feng, Y.; Xu, X.; Sun, G.; Li, B.; Liu, X.; Li, Z.; Yang, J. Exploration of immune response mechanisms in cadmium and copper co-exposed juvenile golden cuttlefish (Sepia esculenta) based on transcriptome profiling. Front. Immunol. 2022, 13, 963931. [Google Scholar] [CrossRef] [PubMed]
- Bao, X.; Wang, W.; Yuan, T.; Li, Y.; Chen, X.; Liu, X.; Xu, X.; Sun, G.; Li, B.; Yang, J.; et al. Transcriptome profiling based on larvae at different time points after hatching provides a core set of gene resource for understanding the immune response mechanisms of the egg protecting behavior against Vibrio anguillarum infection in Amphioctopus fangsiao. Fish Shellfish Immunol. 2022, 124, 430–441. [Google Scholar] [CrossRef] [PubMed]
- Wang, Y.; Bao, X.; Wang, W.; Xu, X.; Liu, X.; Li, Z.; Yang, J.; Yuan, T. Exploration of anti-stress mechanisms in high temperature exposed juvenile golden cuttlefish (Sepia esculenta) based on transcriptome profiling. Front. Physiol. 2023, 14, 1189375. [Google Scholar] [CrossRef] [PubMed]
- Ding, J.; Zhao, L.; Chang, Y.; Zhao, W.; Du, Z.; Hao, Z. Transcriptome sequencing and characterization of Japanese scallop Patinopecten yessoensis from different shell color lines. PLoS ONE 2015, 10, e0116406. [Google Scholar] [CrossRef] [PubMed]
- Guo, Y.; Lei, Y.; Xu, W.; Zhang, Y.; Zhou, H.; Zhang, W.; Mai, K. Protective effects of dietary selenium on abalone Haliotis discus hannai against the toxicity of waterborne cadmium. Aquac. Res. 2018, 49, 3237–3244. [Google Scholar] [CrossRef]
- Liu, X.; Wang, W.; Zhao, H.; Wang, Y.; Jiang, L.; Zhang, E.; Feng, Y.; Wang, X.; Qu, J.; Yang, J.; et al. Transcriptome profiling of triploid Crassostrea gigas gills indicates the host immune mechanism against bacterial infection. Comp. Biochem. Physiol. Part D Genom. Proteom. 2025, 54, 101392. [Google Scholar] [CrossRef] [PubMed]
- Love, M.I.; Huber, W.; Anders, S. Moderated estimation of fold change and dispersion for RNA-seq data with DESeq2. Genome. Biol. 2014, 15, 550. [Google Scholar] [CrossRef] [PubMed]
- Sherman, B.T.; Hao, M.; Qiu, J.; Jiao, X.; Baseler, M.W.; Lane, H.C.; Imamichi, T.; Chang, W. DAVID: A web server for functional enrichment analysis and functional annotation of gene lists (2021 update). Nucleic Acids Res. 2022, 50, W216–W221. [Google Scholar] [CrossRef] [PubMed]
- Zhao, Y.; Chang, D.; Zheng, Y.; Zhang, Y.; Wang, Y.; Bao, X.; Sun, G.; Feng, Y.; Li, Z.; Liu, X.; et al. Comparative transcriptome analysis reveals differences in immune responses to copper ions in Sepia esculenta under high-temperature conditions. BMC Genom. 2025, 26, 262. [Google Scholar] [CrossRef] [PubMed]
- Szklarczyk, D.; Kirsch, R.; Koutrouli, M.; Nastou, K.; Mehryary, F.; Hachilif, R.; Gable, A.L.; Fang, T.; Doncheva, N.T.; Pyysalo, S.; et al. The STRING database in 2023: Protein-protein association networks and functional enrichment analyses for any sequenced genome of interest. Nucleic Acids Res. 2023, 51, D638–D646. [Google Scholar] [CrossRef] [PubMed]
- Liu, X.; Li, Z.; Li, Q.; Bao, X.; Jiang, L.; Yang, J. Acute exposure to polystyrene nanoplastics induced oxidative stress in Sepia esculenta Larvae. Aquac. Rep. 2024, 35, 102004. [Google Scholar] [CrossRef]
- Wang, J.; Medina Torres, I.; Shang, M.; Al-Armanazi, J.; Dilawar, H.; Hettiarachchi, D.U.; Paladines-Parrales, A.; Chambers, B.; Pottle, K.; Soman, M.; et al. Direct and pleiotropic effects of antimicrobial peptide transgene integration on reproductive, growth regulating, and non-coding loci in channel catfish (Ictalurus punctatus). Agric. Commun. 2024, 2, 100044. [Google Scholar] [CrossRef]
- Wang, Y.; Chen, X.; Xu, X.; Yang, J.; Liu, X.; Sun, G.; Li, Z. Weighted Gene Co-Expression Network Analysis Based on Stimulation by Lipopolysaccharides and Polyinosinic:polycytidylic Acid Provides a Core Set of Genes for Understanding Hemolymph Immune Response Mechanisms of Amphioctopus fangsiao. Animals 2023, 14, 80. [Google Scholar] [CrossRef] [PubMed]
- Chen, N.; Zhao, C.; Zhang, T. Selenium transformation and selenium-rich foods. Food Biosci. 2021, 40, 100875. [Google Scholar] [CrossRef]
- Qiu, L.; Chen, H.; Zhou, Z.; Zhang, H.; Liu, R.; Yi, Q.; Yang, C.; Gao, L.; Wang, L. Transcriptomic profile of oyster Crassostrea gigas hemocyte after short-term cadmium exposure and bacteria stimulation. Fish Shellfish Immunol. 2020, 98, 138–146. [Google Scholar] [CrossRef] [PubMed]
- Lim, S.A.; Su, W.; Chapman, N.M.; Chi, H. Lipid metabolism in T cell signaling and function. Nat. Chem. Biol. 2022, 18, 470–481. [Google Scholar] [CrossRef] [PubMed]
- Koenderman, L.; Buurman, W.; Daha, M.R. The innate immune response. Immunol. Lett. 2014, 162 Pt. B, 95–102. [Google Scholar] [CrossRef] [PubMed]
- Kawai, T.; Akira, S. Toll-like receptor and RIG-I-like receptor signaling. Ann. N. Y. Acad. Sci. 2008, 1143, 1–20. [Google Scholar] [CrossRef] [PubMed]
- Ahmad, I.; Ahmed, I.; Fatma, S.; Peres, H. Role of branched-chain amino acids on growth, physiology and metabolism of differentfish species: A review. Aquacult. Nutr. 2021, 27, 1270–1289. [Google Scholar] [CrossRef]
- Chandhini, S.; Trumboo, B.; Jose, S.; Varghese, T.; Rajesh, M.; Kumar, V.J.R. Insulin-like growth factor signalling and its significance as a biomarker in fish and shellfish research. Fish Physiol. Biochem. 2021, 47, 1011–1031. [Google Scholar] [CrossRef] [PubMed]
- Li, Z.; Bao, X.; Liu, X.; Li, Y.; Cui, M.; Liu, X.; Li, B.; Feng, Y.; Xu, X.; Sun, G.; et al. Transcriptome profiling based on protein-protein interaction networks provides a set of core genes for understanding the immune response mechanisms of the egg-protecting behavior in Octopus ocellatus. Fish Shellfish Immunol. 2021, 117, 113–123. [Google Scholar] [CrossRef] [PubMed]
- Majeed, A.; Mukhtar, S. Protein-Protein Interaction Network Exploration Using Cytoscape. Methods. Mol. Biol. 2023, 2690, 419–427. [Google Scholar] [CrossRef] [PubMed]
- Forman, H.J.; Zhang, H.; Rinna, A. Glutathione: Overview of its protective roles, measurement, and biosynthesis. Mol. Aspects. Med. 2009, 30, 1–12. [Google Scholar] [CrossRef] [PubMed]
- Lu, S.C. Glutathione synthesis. Biochim. Biophys. Acta 2012, 1830, 3143–3153. [Google Scholar] [CrossRef] [PubMed]
- Zhang, H.; Forman, H.J. Glutathione synthesis and its role in redox signaling. Semin. Cell. Dev. Biol. 2012, 23, 722–728. [Google Scholar] [CrossRef] [PubMed]
- Averill-Bates, D.A. The antioxidant glutathione. Vitam. Horm. 2023, 121, 109–141. [Google Scholar] [CrossRef] [PubMed]
- Beer, S.M.; Taylor, E.R.; Brown, S.E.; Dahm, C.C.; Costa, N.J.; Runswick, M.J.; Murphy, M.P. Glutaredoxin 2 catalyzes the reversible oxidation and glutathionylation of mitochondrial membrane thiol proteins: Implications for mitochondrial redox regulation and antioxidant DEFENSE. J. Biol. Chem. 2004, 279, 47939–47951. [Google Scholar] [CrossRef] [PubMed]
- Hurd, T.R.; Costa, N.J.; Dahm, C.C.; Beer, S.M.; Brown, S.E.; Filipovska, A.; Murphy, M.P. Glutathionylation of mitochondrial proteins. Antioxid. Redox. Signal 2005, 7, 999–1010. [Google Scholar] [CrossRef] [PubMed]
- Resende, A.C.; Mauro Carneiro Pereira, D.; Cristina Schleger, I.; Dmengeon Pedreiro de Souza, M.R.; Alvez Neundorf, A.K.; Romão, S.; Herrerias, T.; Donatti, L. Effects of heat shock on energy metabolism and antioxidant defence in a tropical fish species Psalidodon bifasciatus. J. Fish Biol. 2022, 100, 1245–1263. [Google Scholar] [CrossRef] [PubMed]
- Nguyen, T.V.; Alfaro, A.C.; Merien, F.; Lulijwa, R.; Young, T. Copper-induced immunomodulation in mussel (Perna canaliculus) haemocytes. Metallomics 2018, 10, 965–978. [Google Scholar] [CrossRef] [PubMed]
- Ferreira, A.M.; Gentile, P.; Chiono, V.; Ciardelli, G. Collagen for bone tissue regeneration. Acta Biomater. 2012, 8, 3191–3200. [Google Scholar] [CrossRef] [PubMed]
- Ricard-Blum, S. The collagen family. Cold Spring Harb. Perspect. Biol. 2011, 3, a004978. [Google Scholar] [CrossRef] [PubMed]
- Siadat, S.M.; Ruberti, J.W. Mechanochemistry of collagen. Acta Biomater. 2023, 163, 50–62. [Google Scholar] [CrossRef] [PubMed]
- Gelse, K.; Pöschl, E.; Aigner, T. Collagens—Structure, function, and biosynthesis. Adv. Drug Deliv. Rev. 2003, 55, 1531–1546. [Google Scholar] [CrossRef] [PubMed]
- Gordon, M.K.; Hahn, R.A. Collagens. Cell Tissue Res. 2010, 339, 247–257. [Google Scholar] [CrossRef] [PubMed]
- Mienaltowski, M.J.; Birk, D.E. Structure, physiology, and biochemistry of collagens. Adv. Exp. Med. Biol. 2014, 802, 5–29. [Google Scholar] [CrossRef] [PubMed]
- Brown, J.C.; Timpl, R. The collagen superfamily. Int. Arch. Allergy Immunol. 1995, 107, 484–490. [Google Scholar] [CrossRef] [PubMed]
- Myllyharju, J.; Kivirikko, K.I. Collagens, modifying enzymes and their mutations in humans, flies and worms. Trends Genet. 2004, 20, 33–43. [Google Scholar] [CrossRef] [PubMed]
- Den Besten, G.; van Eunen, K.; Groen, A.K.; Venema, K.; Reijngoud, D.J.; Bakker, B.M. The role of short-chain fatty acids in the interplay between diet, gut microbiota, and host energy metabolism. J. Lipid. Res. 2013, 54, 2325–2340. [Google Scholar] [CrossRef] [PubMed]
- Fhu, C.W.; Ali, A. Fatty Acid Synthase: An Emerging Target in Cancer. Molecules 2020, 25, 3935. [Google Scholar] [CrossRef] [PubMed]
- Mo, W.; Xu, W.; Hong, M.; Yang, T.; Shi, Y.; Jiao, Y.; Nie, J.; Cui, F.; Cao, J.; Zhang, S. Proteomic and miRNA profiling of radon-induced skin damage in mice: FASN regulated by miRNAs. J. Radiat. Res. 2022, 63, 706–718. [Google Scholar] [CrossRef] [PubMed]
- Günenc, A.N.; Graf, B.; Stark, H.; Chari, A. Fatty Acid Synthase: Structure, Function, and Regulation. Subcell. Biochem. 2022, 99, 1–33. [Google Scholar] [CrossRef] [PubMed]
- Jones, S.F.; Infante, J.R. Molecular Pathways: Fatty Acid Synthase. Clin. Cancer Res. 2015, 21, 5434–5438. [Google Scholar] [CrossRef] [PubMed]
- Aoki, Y.; Niihori, T.; Narumi, Y.; Kure, S.; Matsubara, Y. The RAS/MAPK syndromes: Novel roles of the RAS pathway in human genetic disorders. Hum. Mutat. 2008, 29, 992–1006. [Google Scholar] [CrossRef] [PubMed]
- Fabris, L.; Berton, S.; Pellizzari, I.; Segatto, I.; D’Andrea, S.; Armenia, J.; Bomben, R.; Schiappacassi, M.; Gattei, V.; Philips, M.R.; et al. p27kip1 controls H-Ras/MAPK activation and cell cycle entry via modulation of MT stability. Proc. Natl. Acad. Sci. USA 2015, 112, 13916–13921. [Google Scholar] [CrossRef] [PubMed]
- Molven, A.; Søvik, O.; von der Lippe, C.; Steine, S.J.; Njølstad, P.R.; Houge, G.; Prescott, T.E. Mutasjonsdiagnostikk ved syndromer knyttet til RAS/MAPK-signalveien [Molecular genetic diagnostics in syndromes associated with the RAS/MAPK signalling pathway]. Tidsskr. Nor. Laegeforen 2009, 129, 2358–2361. [Google Scholar] [CrossRef] [PubMed]
- Denning, G.M.; Figard, P.H.; Kaduce, T.L.; Spector, A.A. Role of triglycerides in endothelial cell arachidonic acid metabolism. J. Lipid. Res. 1983, 24, 993–1001. [Google Scholar] [CrossRef] [PubMed]
- Wunderling, K.; Zurkovic, J.; Zink, F.; Kuerschner, L.; Thiele, C. Triglyceride cycling enables modification of stored fatty acids. Nat. Metab. 2023, 5, 699–709. [Google Scholar] [CrossRef] [PubMed]
- Graf, G.A.; Yu, L.; Li, W.P.; Gerard, R.; Tuma, P.L.; Cohen, J.C.; Hobbs, H.H. ABCG5 and ABCG8 are obligate heterodimers for protein trafficking and biliary cholesterol excretion. J. Biol. Chem. 2003, 278, 48275–48282. [Google Scholar] [CrossRef] [PubMed]
- Yu, X.H.; Qian, K.; Jiang, N.; Zheng, X.L.; Cayabyab, F.S.; Tang, C.K. ABCG5/ABCG8 in cholesterol excretion and atherosclerosis. Clin. Chim. Acta 2014, 428, 82–88. [Google Scholar] [CrossRef] [PubMed]

Disclaimer/Publisher’s Note: The statements, opinions and data contained in all publications are solely those of the individual author(s) and contributor(s) and not of MDPI and/or the editor(s). MDPI and/or the editor(s) disclaim responsibility for any injury to people or property resulting from any ideas, methods, instructions or products referred to in the content. |
© 2025 by the authors. Licensee MDPI, Basel, Switzerland. This article is an open access article distributed under the terms and conditions of the Creative Commons Attribution (CC BY) license (https://creativecommons.org/licenses/by/4.0/).