Article

Using Mechanical Alloying to Create Bimetallic Catalysts for Vapor-Phase Carbon Nanofiber Synthesis

1
Chemistry Department, Millersville University, Millersville, PA 17551, USA
2
Applied Engineering, Safety & Technology Department, Millersville University, Millersville, PA 17551, USA
*
Author to whom correspondence should be addressed.
Fibers 2015, 3(4), 394-410; https://doi.org/10.3390/fib3040394
Submission received: 30 June 2015 / Accepted: 24 September 2015 / Published: 5 October 2015
(This article belongs to the Special Issue Carbon Fibers)

Abstract

:
Carbon nanofibers were generated over bimetallic catalysts in an atmospheric pressure chemical vapor deposition (APCVD) reactor. Catalyst compositions of Fe 30 at%, Cu and Ni 30 at% and Cu were mechanically alloyed using high-energy ball milling over durations of 4, 8, 12, 16, and 20 h. The catalyst powders were then used to produce carbon nanofibers in ethylene and hydrogen (4:1) at temperatures of 500, 550, and 600 °C. The microstructures of the catalysts were characterized as a function of milling time as well as at deposition temperature. The corresponding carbon deposition rates were assessed and are correlated to the microstructural features of each catalyst. The milling process directly determines the performance of each catalyst toward carbon deposition, and both catalysts performed comparably to those made by traditional co-precipitation methods. Considerations in miscible and immiscible nanostructured alloy systems are discussed.

Graphical Abstract

1. Introduction

Carbon nanofibers (CNFs) had originally been considered an unwanted byproduct of catalytic conversion of carbon-containing gases, until more recent research found unique applications for these structures [1]. They possess unique magnetic, electronic, chemical, and mechanical properties [2], which has sparked interest in applications for electronics, polymer additives, gas storage, and catalyst support [1,2].
CNFs are formed from the decomposition of carbon-containing gases, such as hydrocarbons and carbon monoxide, over a suitable catalyst at moderate temperatures [3]. Catalysts used for growing CNFs can be pure metals or alloys, but the efficiency of the catalyst depends on other reaction conditions, such as the reaction gas(es), catalyst support, and reaction temperature. For example, when CO is used as the carbon source, pure iron was found to be the most active catalyst; however, in the presence of other carbon sources such as hydrocarbons, iron has negligible catalytic properties [4]. Metals known to efficiently catalyze carbon growth include pure palladium, platinum, nickel, and cobalt; as well as the oxides or carbides of said metals [5,6,7]. Alloys of iron, cobalt, and nickel and of chromium, vanadium, and molybdenum are also known to catalyze carbon [2]. There are many combinations of catalysts and growth conditions suitable for forming CNFs of varying size, morphology, and degrees of crystallinity.
The efficiency of a metallic catalyst is primarily due to its ability to rupture the carbon bonds, and alloys (often binary alloys) are used to enhance the deposition rate and/or alter the character of the resulting fibers. Bimetallic catalysts change the catalytic and adsorptive properties compared to the individual metals as they alter the activity and selectivity of the catalyst [8]. Mixtures of gases have also been found to enhance deposition greatly, and this enhancement has been tied to catalyst surface cleaning (e.g., [9,10,11]) and reconstruction (e.g., [12,13,14]) to resist poisoning and other means of deactivation [15]. Gas-phase reactions resulting in the formation of radical species (e.g., [16,17]), have also been identified as a potential mechanism for controlling catalyst activity. This results in a processing window where growth rate is maximized at an intermediate temperature which corresponds to the presence of favorable species for deposition. For example, carbon can be deposited in a fuel-rich combustion environment using ethylene and oxygen, but the deposition characteristics are highly dependent on the gas ratios, the reaction temperature [18,19], and even position in the reactor (residence time of the gases). Similar results have been noted in ethylene-hydrogen mixtures as well (e.g., [20,21]).
Bimetallic alloys commonly used to grow CNFs include Ni–Cu [22,23], Fe–Cu [24], Co–Cu [9,25], and Fe–Ni [12,21,26]. The conditions for growth can vary widely. For example, a 7:3 Ni:Cu alloy has been found to catalytically decompose ethylene in the presence of hydrogen at temperatures ranging from 450 to 750 °C, with greatest efficiency at 600 °C [27], and 7:3 Fe:Cu decomposes ethylene under the same conditions [24]. A 3:1 Co:Cu alloy has a maximum catalytic performance at 535 °C for decomposition of pure ethylene, but a broader range of catalytic activity is observed by adding hydrogen [9]. A 1:1 Fe:Ni composition decomposes a mixture of C2H4/CO2/H2 most efficiently at 600 °C, but a 7:3 composition is required for efficient deposition in a C2H4/H2 mixture at the same temperature [12,21]. It is evident, then, that the variability in catalyst composition and gas chemistries offers opportunities and challenges.
The most common method for producing catalysts for CNF growth is through precipitation. This process often involves precipitating out metal carbonates from metal nitrate solutions using ammonium bicarbonate. The precipitate is then dried, calcined, reduced at temperatures ranging from 100 to 500 °C, and if needed, mechanically ground to form the nanocrystals (e.g., [9,12,21,22,25,26,28]). Including drying, calcining, and reducing the metal oxides, the precipitation method (or co-precipitation for alloys) can take days to complete (e.g., [22]). Alternatively, electron beam evaporation and ion beam sputtering [23,29,30] can be used to quickly deposit films of the desired catalyst on a substrate, but these are not efficient for large-scale production. The difficulty with mass producing catalytic metals and alloys is that the final powder product should be nanoscale, and many of the alloys are highly immiscible (e.g., Co–Cu [31] and Fe–Cu [32]), so processing cannot be done via traditional methods.
Mechanical alloying is capable of creating non-equilibrium alloys with nanocrystalline or even amorphous microstructures [33,34,35,36,37,38,39]. This solid-state processing technique uses repeated impacts to cause cold welding, fracturing and re-welding of powder particles. Mechanical alloying is typically carried out in a high-energy ball mill under an inert atmosphere to avoid oxidation and contamination of metal powder. This technique helps circumnavigate the problems of mixing metal materials with different melting temperatures or which are insoluble. Milling can be performed on two brittle materials, but mechanical alloying works best when at least one ductile material is involved so that it may act as a binding agent [34].
To create an alloy, the appropriate ratio of elemental powders and grinding media are placed inside a vessel that is shaken and/or rotated to cause the milling media to blend and impact the powder repeatedly. Severe plastic deformation is induced during mechanical alloying, and the structure is heavily strained and deformation occurs in an inhomogeneous manner. The high concentration of lattice defects generated during the milling process provides additional space to accommodate “misfit” atoms which normally produce a high elastic energy that prevents their dissolution under equilibrium conditions. Chemical enthalpies (heat of mixing) can also be at least partially overcome to extend the solid solubility of immiscible systems such as Fe–Cu [40,41,42] or create fine dispersions of one element in another, such as in Ta [43,44], W [45,46,47] or Cr [48,49,50] in Cu. Mechanical alloying is a relatively simple and low-cost method to produce nanostructured, non-equilibrium materials.
The objective of this work was to determine whether mechanical alloying is a viable method for creating catalysts used in CNF synthesis. Two representative alloy systems were chosen: Ni–Cu, which is completely miscible [51], and Fe–Cu, which is highly immiscible [32]. The effects of processing were examined in regard to both catalyst preparation and carbon deposition.

2. Experimental

Nickel-copper and iron-copper powder alloys were prepared using a Spex 8000M high-energy ball mill (Spex SamplePrep, Metuchen, NJ, USA) with a ball-to-powder mass ratio of 5:1. The powders used to make the alloys were nickel (99.8%, <1 µm), copper (99%, < 75 µm), iron (>99%, fine), and stearic acid (reagent grade, 95%). All were obtained from Sigma-Aldrich (St. Louis, MO, USA) and used without modification. Each milling run consisted of 10 g of powder in a 7:3 atomic ratio of Fe:Cu and Ni:Cu. Each alloy was milled with 1 wt% stearic acid to prevent cold welding. The powders were milled in 4 h increments up to 20 h. 1 g of each alloy was removed at each time increment yielding a total of five samples of each alloy (4, 8, 12, 16, and 20 h). Additionally, all constituent powders were milled separately in pure form (Fe, Ni or Cu) under the same conditions. All alloys and pure metals were also used in “unmilled” form as an experimental control. This was accomplished by using the pure metals directly from the manufacturer, and alloys consisted of elemental powders blended in identical ratios to those which were milled (i.e., 7:3 Ni:Cu and Fe:Cu). These unmilled catalysts correspond to a 0 h milling time. Alloy blends were used to control for proximity effects not related to mechanical alloying, as simple mixtures can be more effective than alloyed powders in some cases [52]. All powders were handled and stored in a glove box under constant purge with ultra-high purity nitrogen. Annealed catalyst powders were heated under a reducing atmosphere (5% H2 in Ar) up to the reported temperature, and the furnace was then turned off with samples remaining inside until cool.
Reaction gases used in this work were nitrogen (99.9999%, Airgas, Radnor, PA, USA), ethylene (commercially pure, Airgas, Radnor, PA, USA), and forming gas (5% H2 in Ar, Airgas, Radnor, PA, USA). Each reaction began with ethylene (C2H4) and H2 flowing in a 4:1 ratio controlled using digitally programmed MKS G-series mass flow controllers. After the reaction was complete, samples were cooled under nitrogen. Reactions were performed using a 150 mm diameter, three-zone Lindberg tube furnace equipped with a 75 mm outside diameter quartz tube and matching ceramic vestibule adapters. Reactions were conducted at 500, 550, and 600 °C for all alloy samples. It was observed that the furnace stabilized approximately 20 °C above the programmed set point as measured by an external thermocouple. Catalysts were weighed in the glove box while in alumina (Al2O3) boats (20 × 20 × 150 mm) to negate any mass loss due to powder transfer. The Al2O3 boats were supported on a stainless steel pan in the center of the furnace. For all reactions, approximately 10 mg of Ni–Cu and 30 mg of Fe–Cu were used. Reactions were conducted on two separate samples of the same composition placed side-by-side in the center of the furnace. Fe–Cu alloys were run at temperature for 3 h and Ni–Cu alloys were run for 1 h. Different times and catalysts loads were used due to differing growth rates. The carbon deposition kinetics were calculated using percent mass gain per hour (%/h) to normalize the deposition rates. Deposition rates were found to be consistent between 1 h and 3 h reactions for both alloys.
Mechanically-alloyed catalysts were analyzed by X-ray diffraction (XRD) using a PANalytical (Westborough, MA, USA) X’Pert Pro MPD diffractometer with Cu anode (Cu Kα wavelength: 1.54 Å). Scherrer estimates of crystallite size were calculated by whole-pattern fitting (WPF) using Jade analysis software with broadening correction using NIST 640d standard [53]. The only exception is the Fe–Cu alloy milled for 20 h which could not be accurately fitted by WPF and was instead analyzed using Gaussian peak fitting of the single, broad peak produced by that sample. All crystallite size estimates are averages of the values calculated for each individual peak in the diffraction pattern. Error bars represent one standard deviation of that data. Where only one peak was observed, no error could be calculated. Scanning electron microscopy (SEM, FEI, Hillsborough, OR, USA) was performed using an FEI Nova NanoSEM 630 operated at 10 kV on alloy powders mounted in epoxy, polished and sputter coated with iridium to reduce charging. Corresponding energy-dispersive X-ray spectroscopy (EDS) mapping was performed using a GAD detector (Oxford Instruments, Concord, MA, USA). Powder size analysis was conducted in isopropyl alcohol with a Malvern Mastersizer S. Carbon nanofiber characteristics were examined using an Auriga 60 SEM/FIB at an accelerating voltage of 5 kV.

3. Results and Discussion

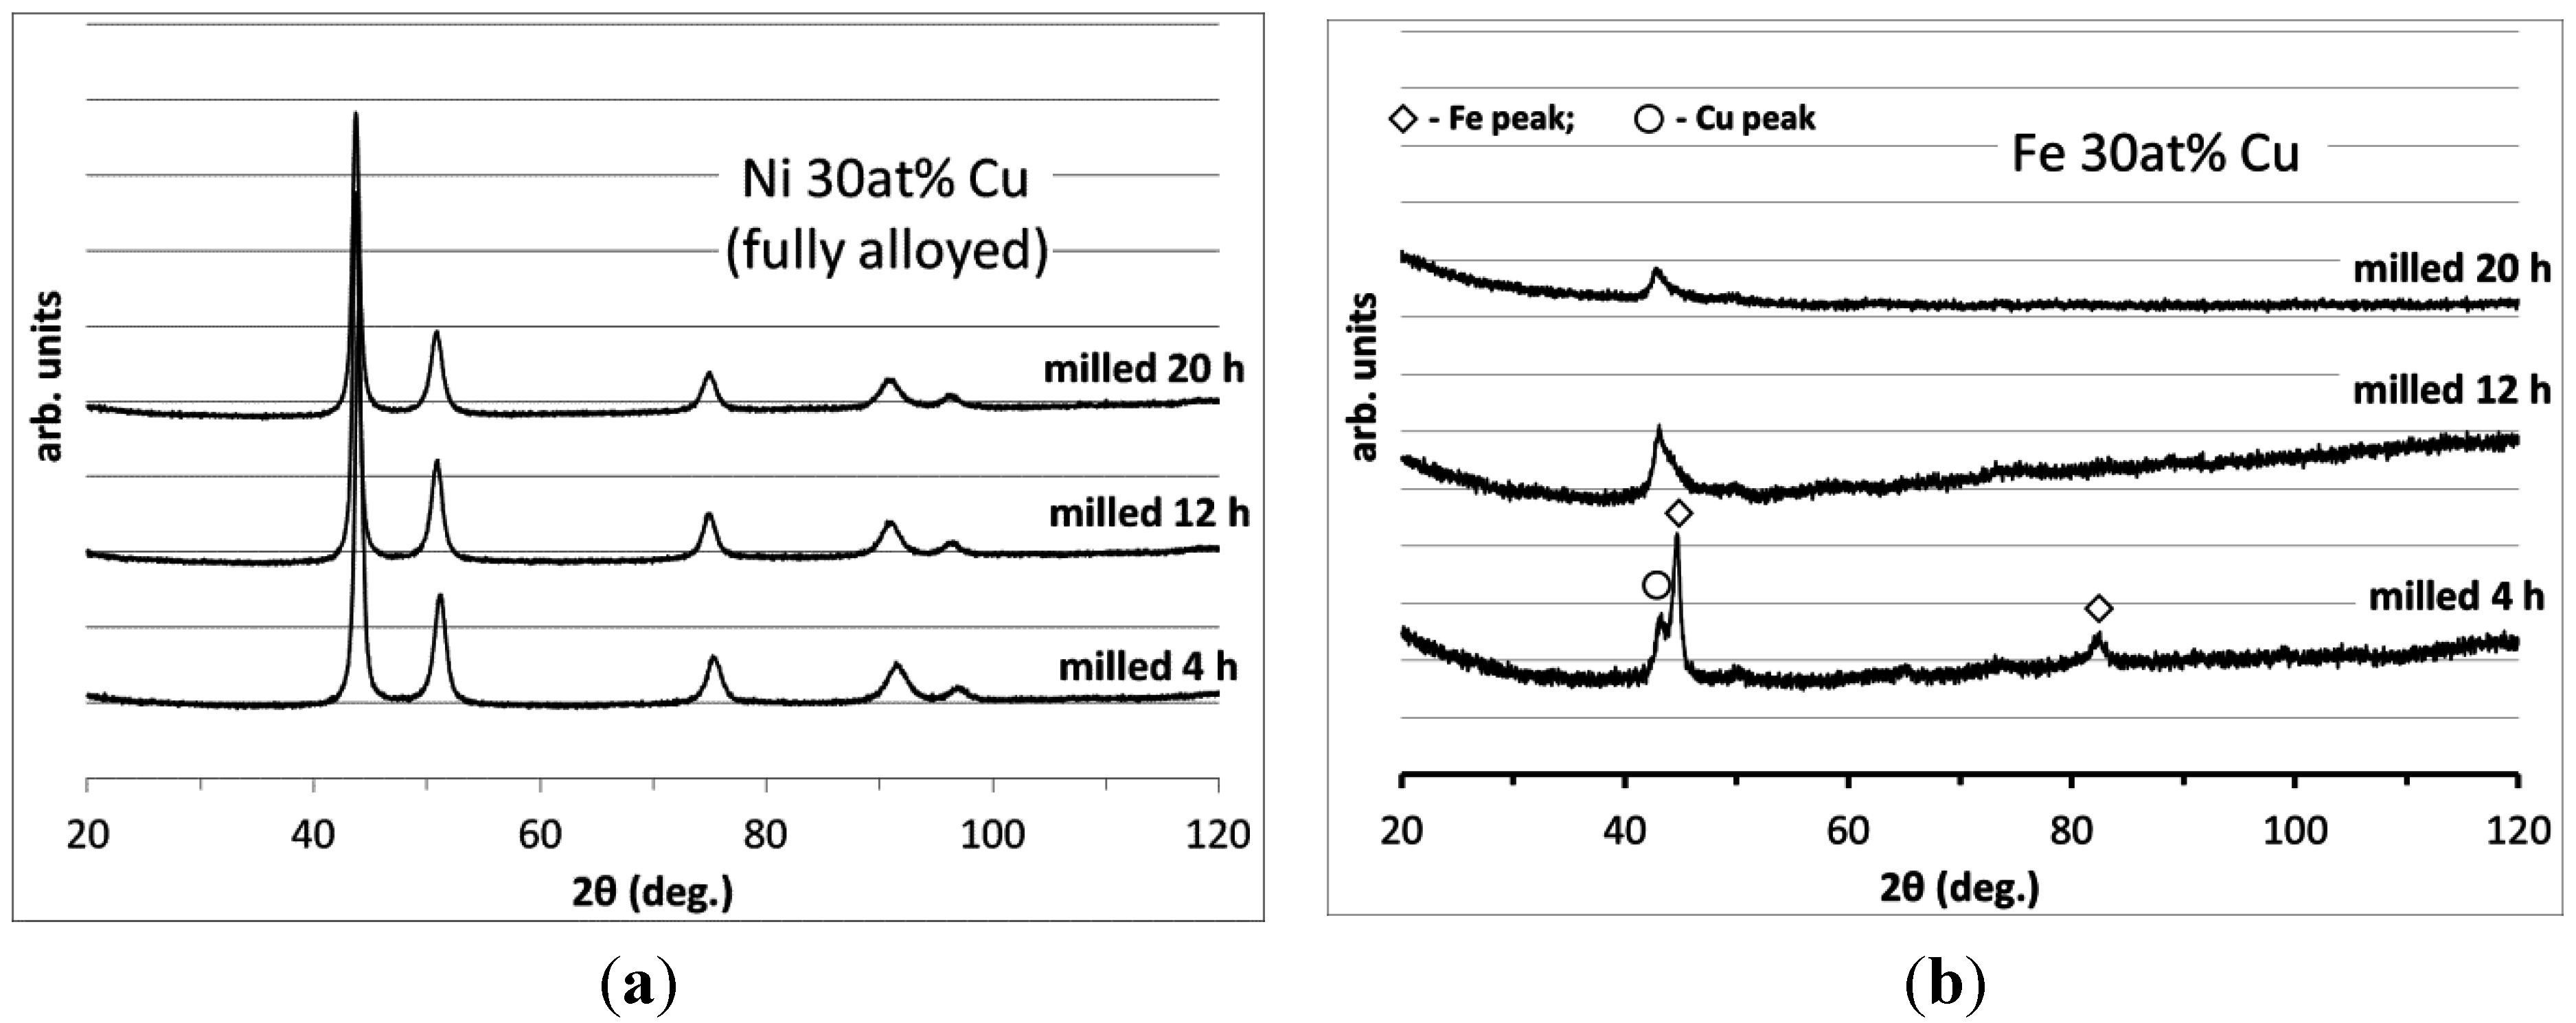
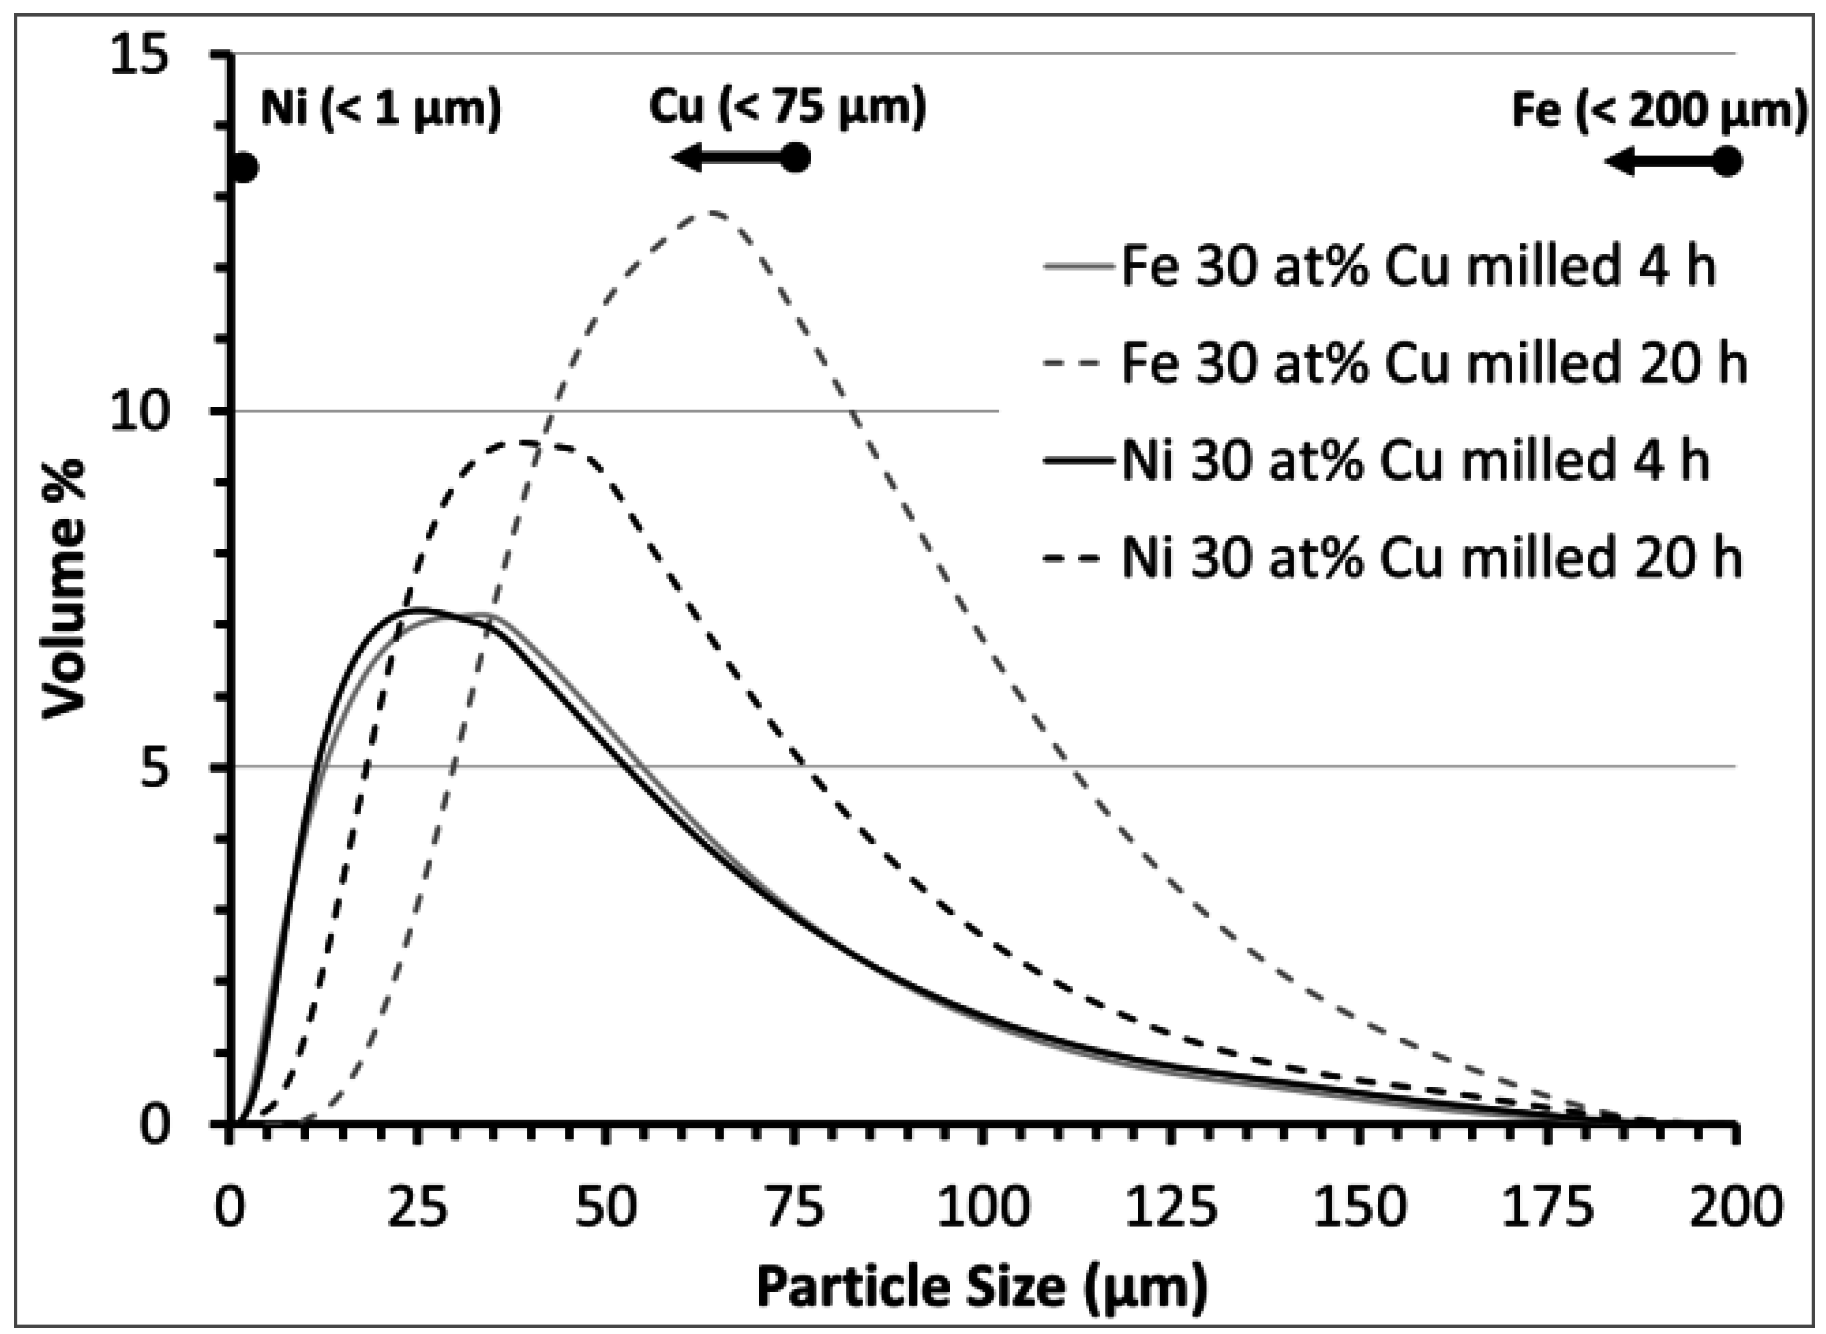
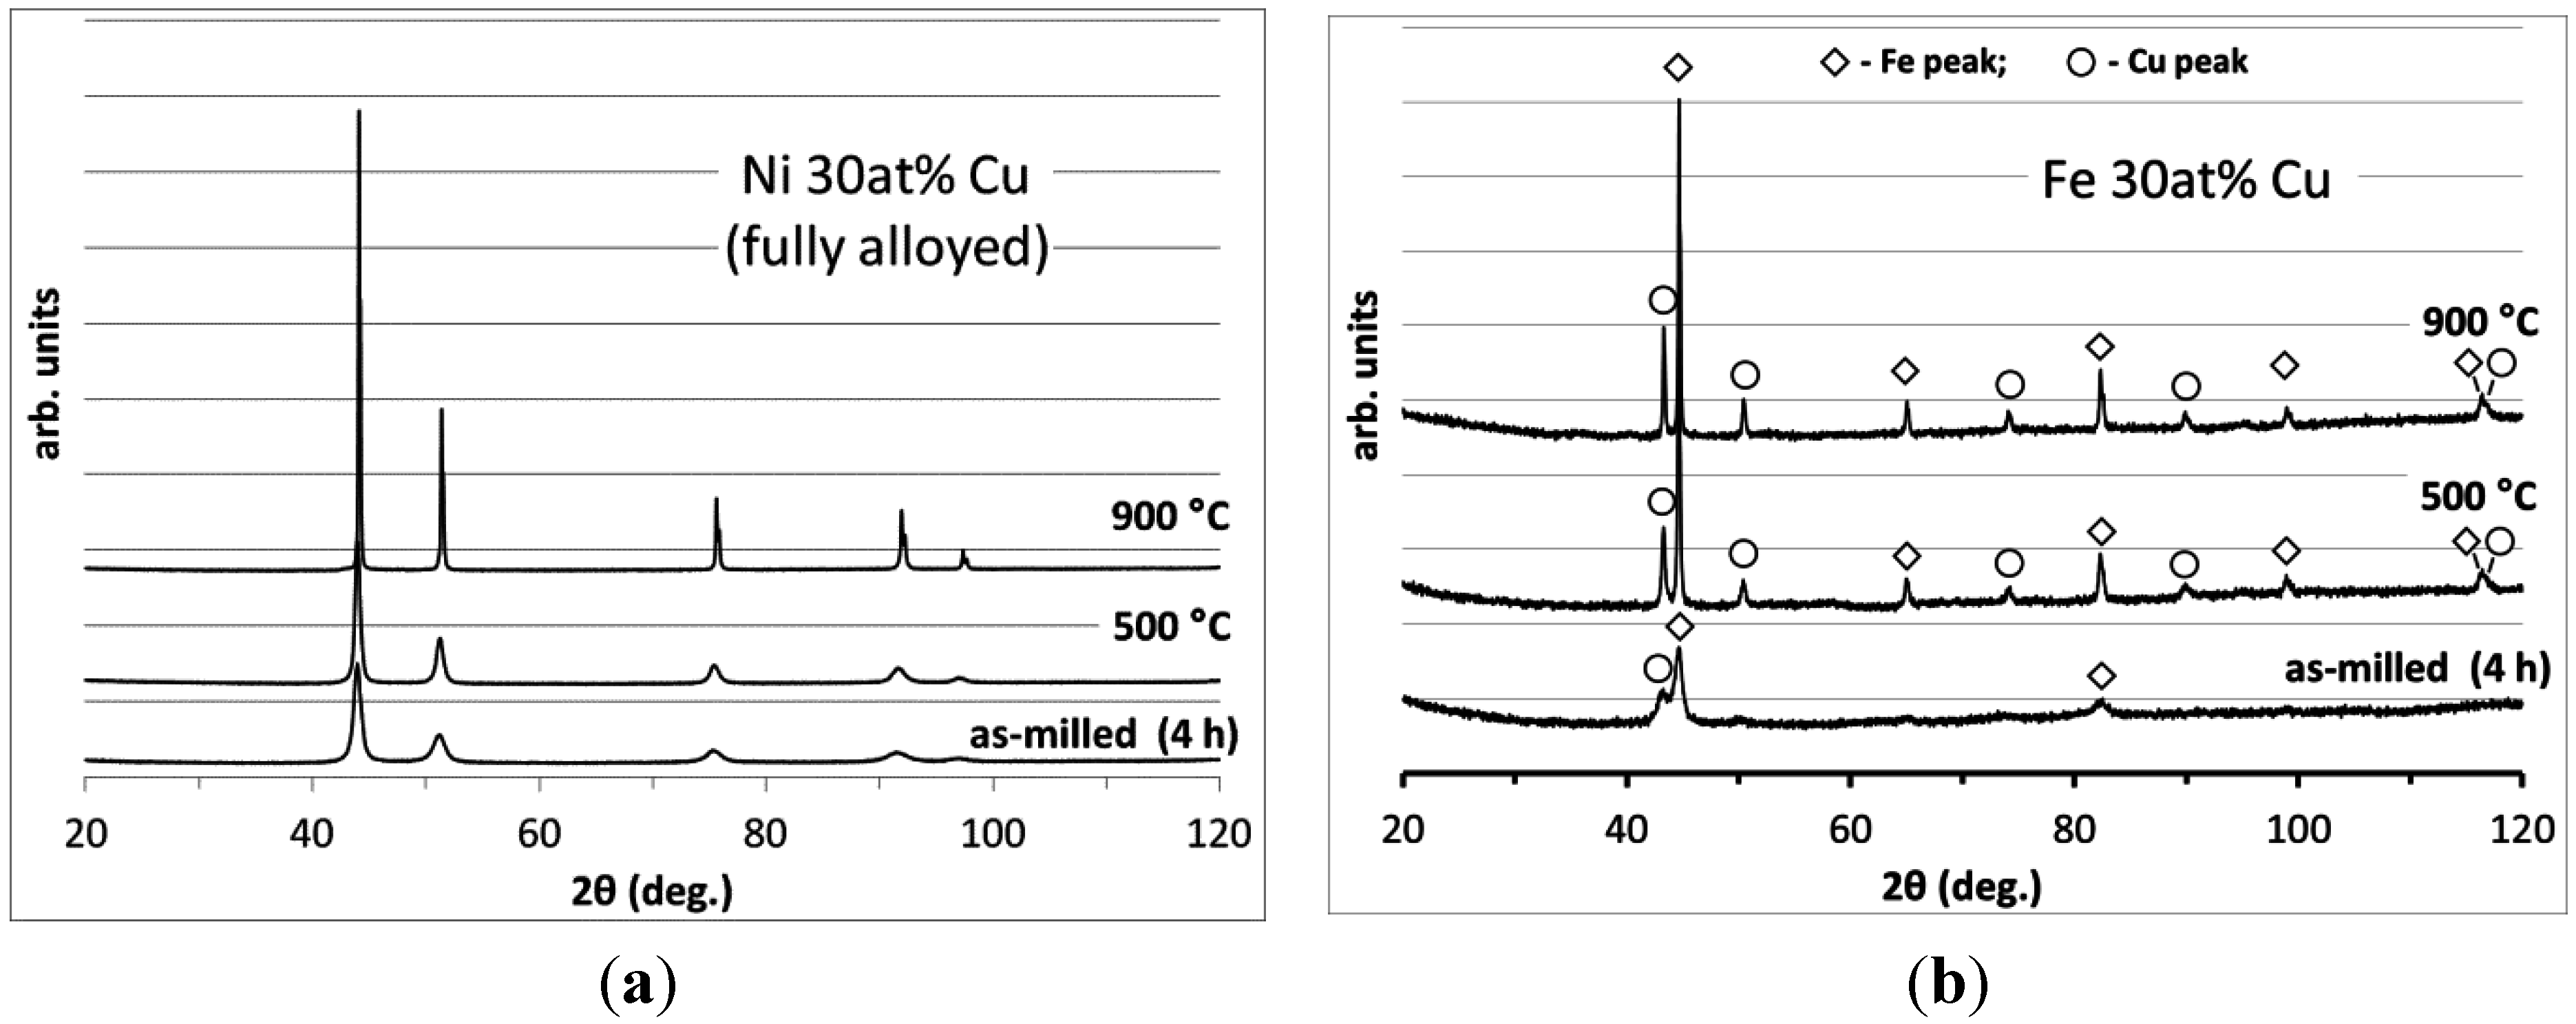
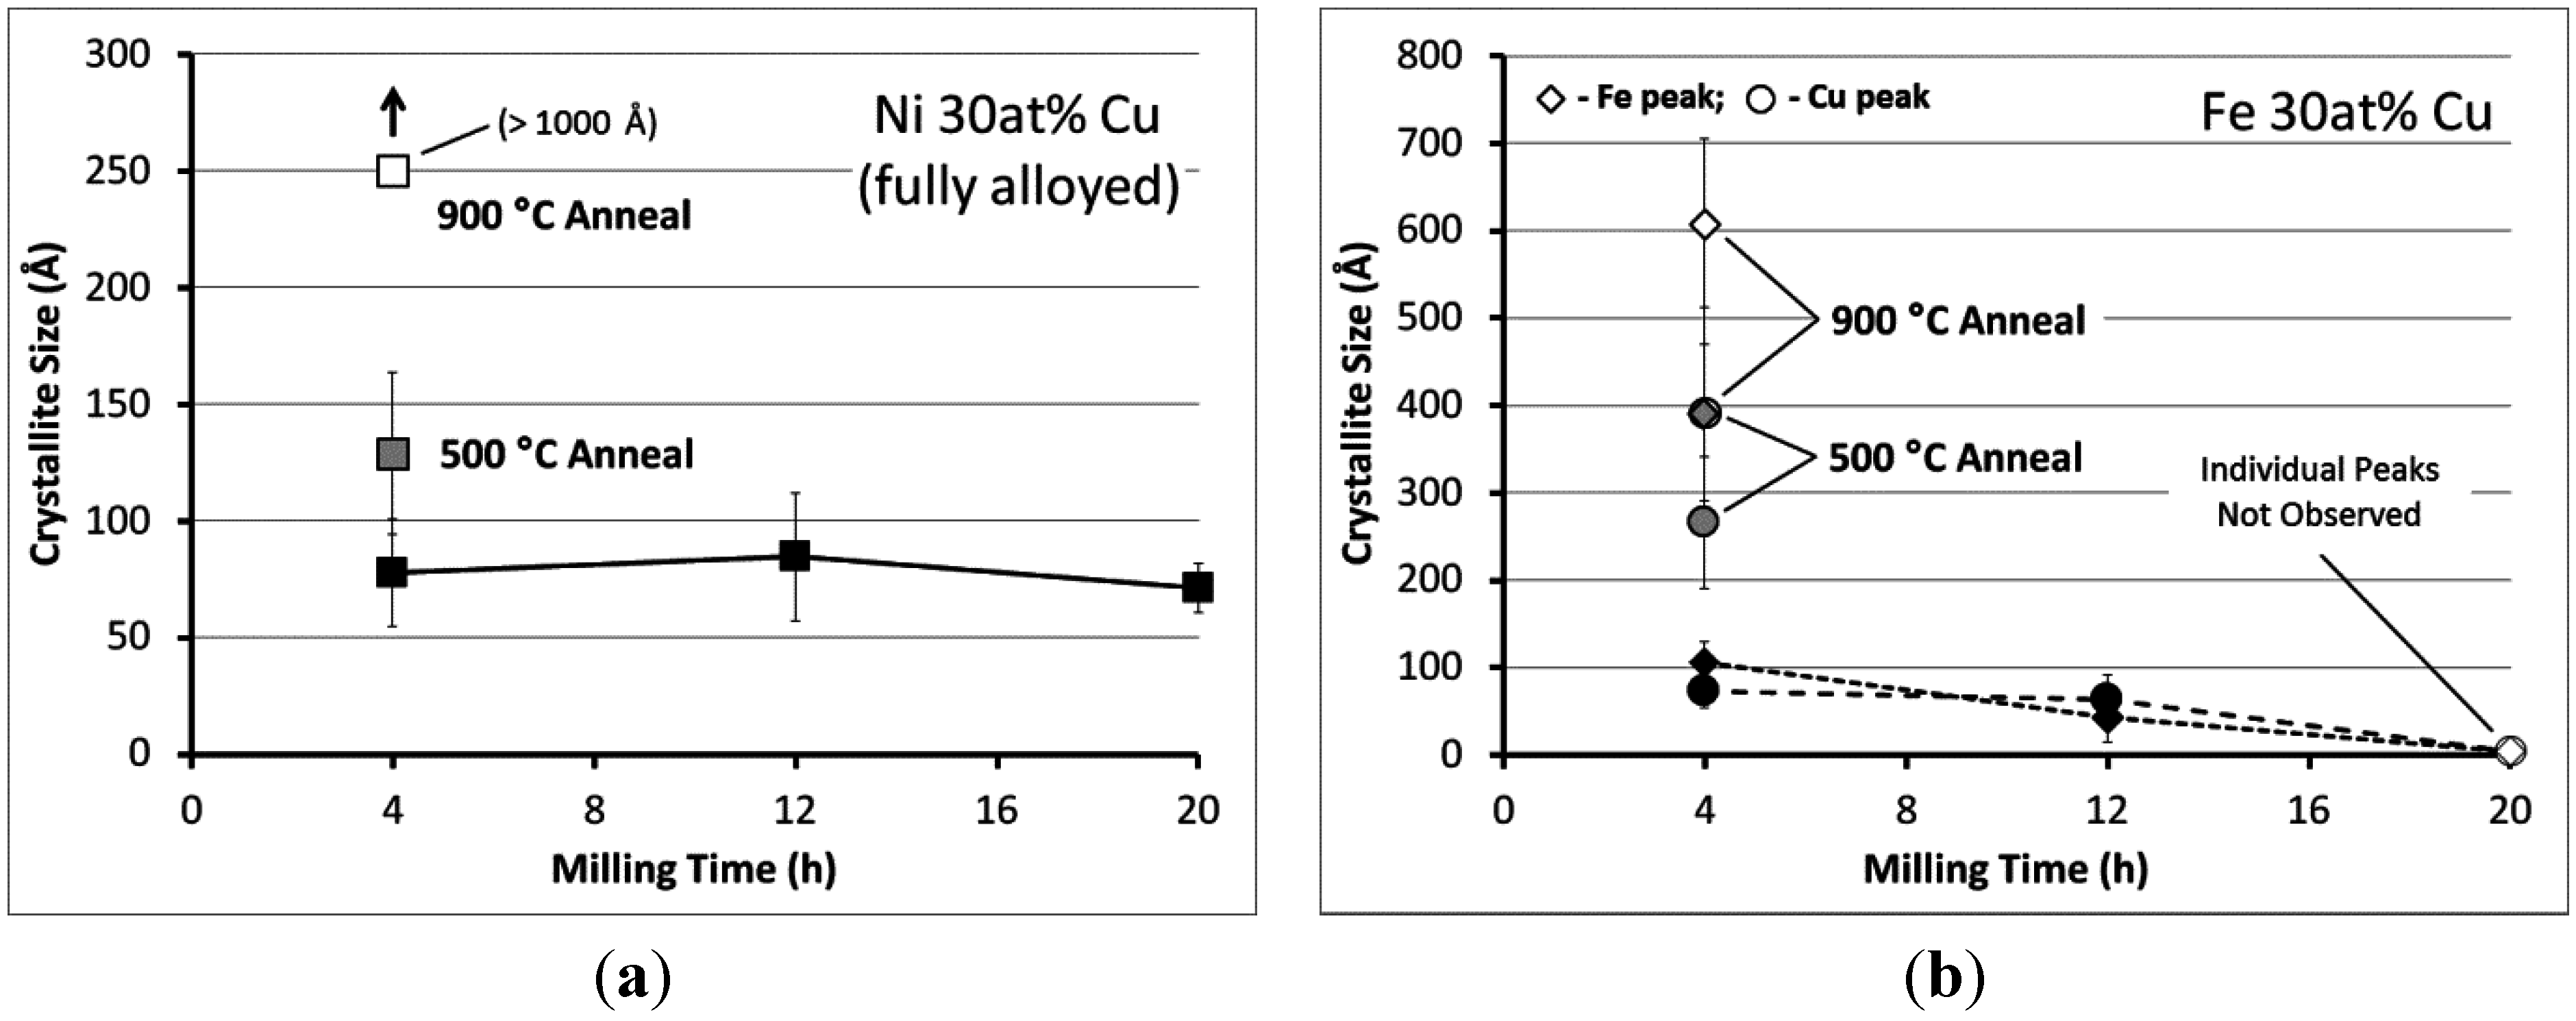
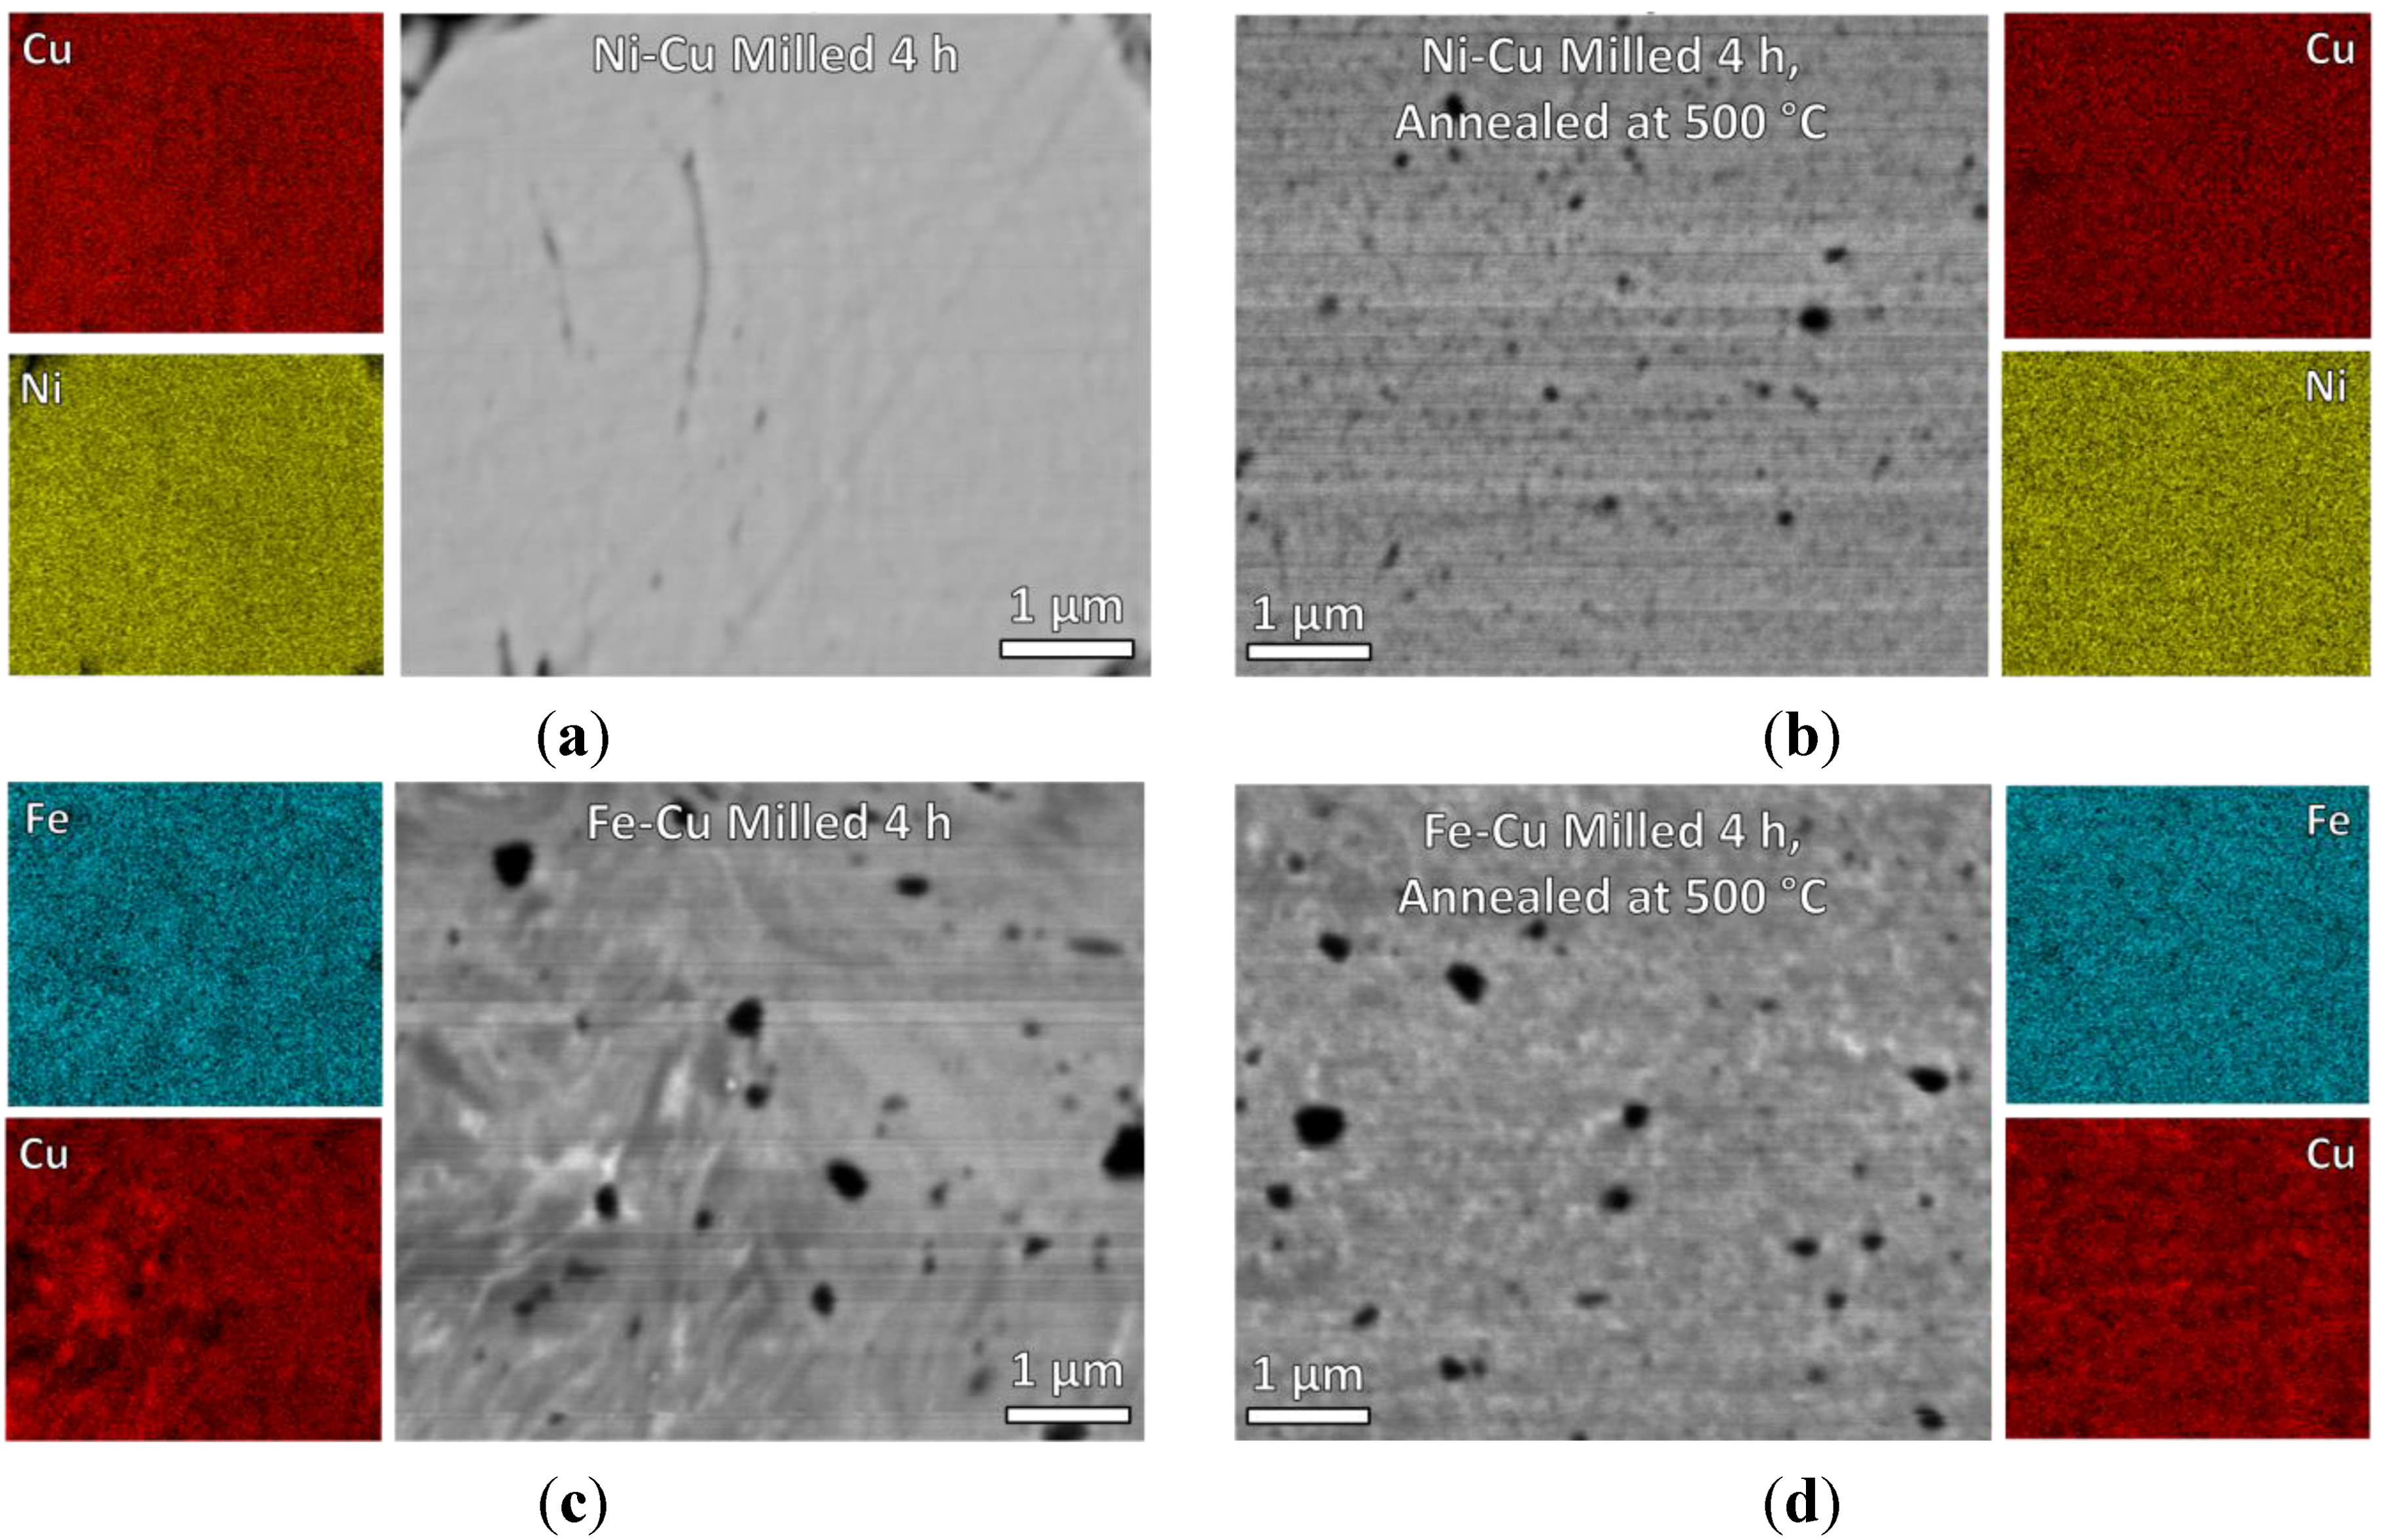
3.1. Catalyst Processing

As shown in Figure 1, XRD patterns of the as-milled powders indicate that the microstructure of the catalysts progresses continually throughout the 20 h milling duration. After 4 h the Ni–Cu alloy is characterized by a single set of broad fcc peaks. As milling time is increased to 20 h, the peaks continue to broaden but remain clearly defined. The Fe–Cu alloy still shows distinct phases for each element after 4 h of milling, but the overall structure is noticeably refined as evidenced by substantial peak broadening and reduction of intensity. As the milling time increases, the higher angle peaks blend into the background and only a single, very broad peak remains. Although quantitative analysis is difficult, it indicates the alloy is progressing to a single-phase amorphous structure, or at least one of very fine crystallite size and/or nanoscale phase distribution.
The as-milled structure is important to determine the efficacy of the milling process, but it does not necessarily provide insight to the structure as it is during carbon deposition. Thermal coarsening is a significant concern in nanostructured metals and alloys (e.g., [54,55,56,57,58,59,60]), so the structure was examined after annealing the alloys milled for 4 h to 500 °C and 900 °C (see Figure 2), which represent the minimum reaction temperature and an extreme upper limit to test the thermal stability and determine the fully coarsened structure. The Ni–Cu alloy shows little change after annealing at 500 °C, but at 900 °C the peaks sharpen drastically indicating that a significant coarsening of the microstructure has occurred. In the Fe–Cu alloy, phase separation is evident after annealing at 500 °C, and annealing at 900 °C only serves to sharpen the already distinct peaks.
Figure 1. XRD patterns at listed milling times for (a) Ni 30 at% Cu and (b) Fe 30 at% Cu.
Fibers 03 00394 g001
Figure 2. XRD patterns for samples milled for 4 h and then annealed at the given temperatures for (a) Ni 30 at% Cu and (b) Fe 30 at% Cu.
Fibers 03 00394 g002
To more quantitatively describe the changes resulting from milling and annealing, the crystallite size was estimated using Scherrer analysis. This method for estimating crystallite size is limited to less than 1000 Å in most cases, even with careful consideration of instrumental broadening and other contributing factors, such as non-uniform strain [61]. Nonetheless, this simple method can provide useful insight into the microstructural evolution in nanostructured alloys. As shown in Figure 3, the Ni–Cu alloy is relatively stable over the milling duration, which suggests 4 h of milling is most likely sufficient.
Figure 3. Scherrer crystallite size estimates for (a) Ni 30 at% Cu and (b) Fe 30 at% Cu as a function of milling time and after annealing the powder milled for 4 h. Data for Fe 30 at% Cu are represented by two points at each condition, one corresponding to Fe peaks (diamonds) and the other to Cu peaks (circles).
Fibers 03 00394 g003
Crystallite size analysis confirms little change in size at 500 °C, but after 900 °C the size is beyond the 1000 Å accuracy limit and may actually be microns in size. The crystallite size in the Fe–Cu alloy drops slightly after 12 h, and by 20 h the peak has become too broad for accurate profile fitting and analysis by whole pattern fitting as used on other samples, but the single, remaining peak was assessed using Gaussian fitting, and the grain size is estimated to be 4 nm. The constituent elements of the Fe–Cu alloy were individually analyzed with the Cu showing less coarsening than the Fe. In the case of a finely-distributed two-phase mixture, the size estimates may actually represent particle size rather than crystallite size. In the 20 h, as-milled alloy, distinct phase analysis could not be completed.
To determine the distribution of elements in the milled and annealed alloys, SEM and corresponding EDS mapping were performed (see Figure 4). The alloys milled for 4 h and those milled for 4 h and annealed at 500 °C were examined. As expected from XRD, the Ni–Cu alloy (Figure 4a,b) starts with and maintains a uniform elemental mixture, but Fe–Cu does not. The Fe–Cu alloy shows distinct Cu-rich and Fe-rich regions in the form of lamellar “streaks” (Figure 4c). After annealing, the Cu-rich lamella form into a distribution of very small (<100 nm) Cu particles in a Fe-rich matrix as evidenced by the mottled shading of the secondary electron image in conjunction with the EDS map (Figure 4d). No larger Cu-rich regions were observed at lower magnifications. Both samples exhibited very small pores which appear as dark regions in the images.
Figure 4. SEM and corresponding EDS mapping for (a) Ni 30 at% Cu milled for 4 h; (b) Ni 30 at% Cu milled for 4 h then annealed at 500 °C; (c) Fe 30 at% Cu milled for 4 h; and (d) Fe 30 at% Cu milled for 4 h then annealed at 500 °C.
Fibers 03 00394 g004
Particle size analysis was also performed (Figure 5), and it was found that the Ni–Cu and Fe–Cu powders are both polydisperse and of similar size distributions after milling for 4 h (maximum volume fraction at 29 µm).
Figure 5. Particle size analysis reveals an increase in size after longer milling time. Starting sizes of the elemental powder sizes are labeled at the top of the graph.
Fibers 03 00394 g005
Although both increased in size after milling for 20 h, the Fe–Cu powder increased to a greater degree (i.e., maximum volume fraction at 58 µm vs. 40 µm for Ni–Cu). This is compared with the manufacturer’s stated sizes of the constituent powders where Ni was less than 1 µm, Cu was less than 75 µm, and Fe is less than 200 µm, with 65%–85% of the powder between 45 and 150 µm. This indicates the stearic acid effectively prevents cold welding of the powders after short durations, but is less effective at longer times. The decomposition of stearic acid during milling has been observed elsewhere (e.g., [62,63]) and may account for the increase in size with milling time. Also observed in SEM (not shown) is that particle surface roughness decreases with time, which reduces the surface area further.

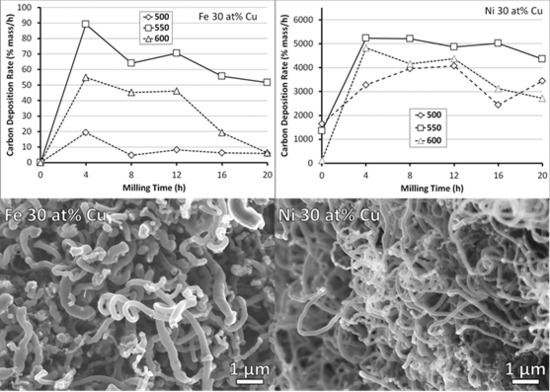
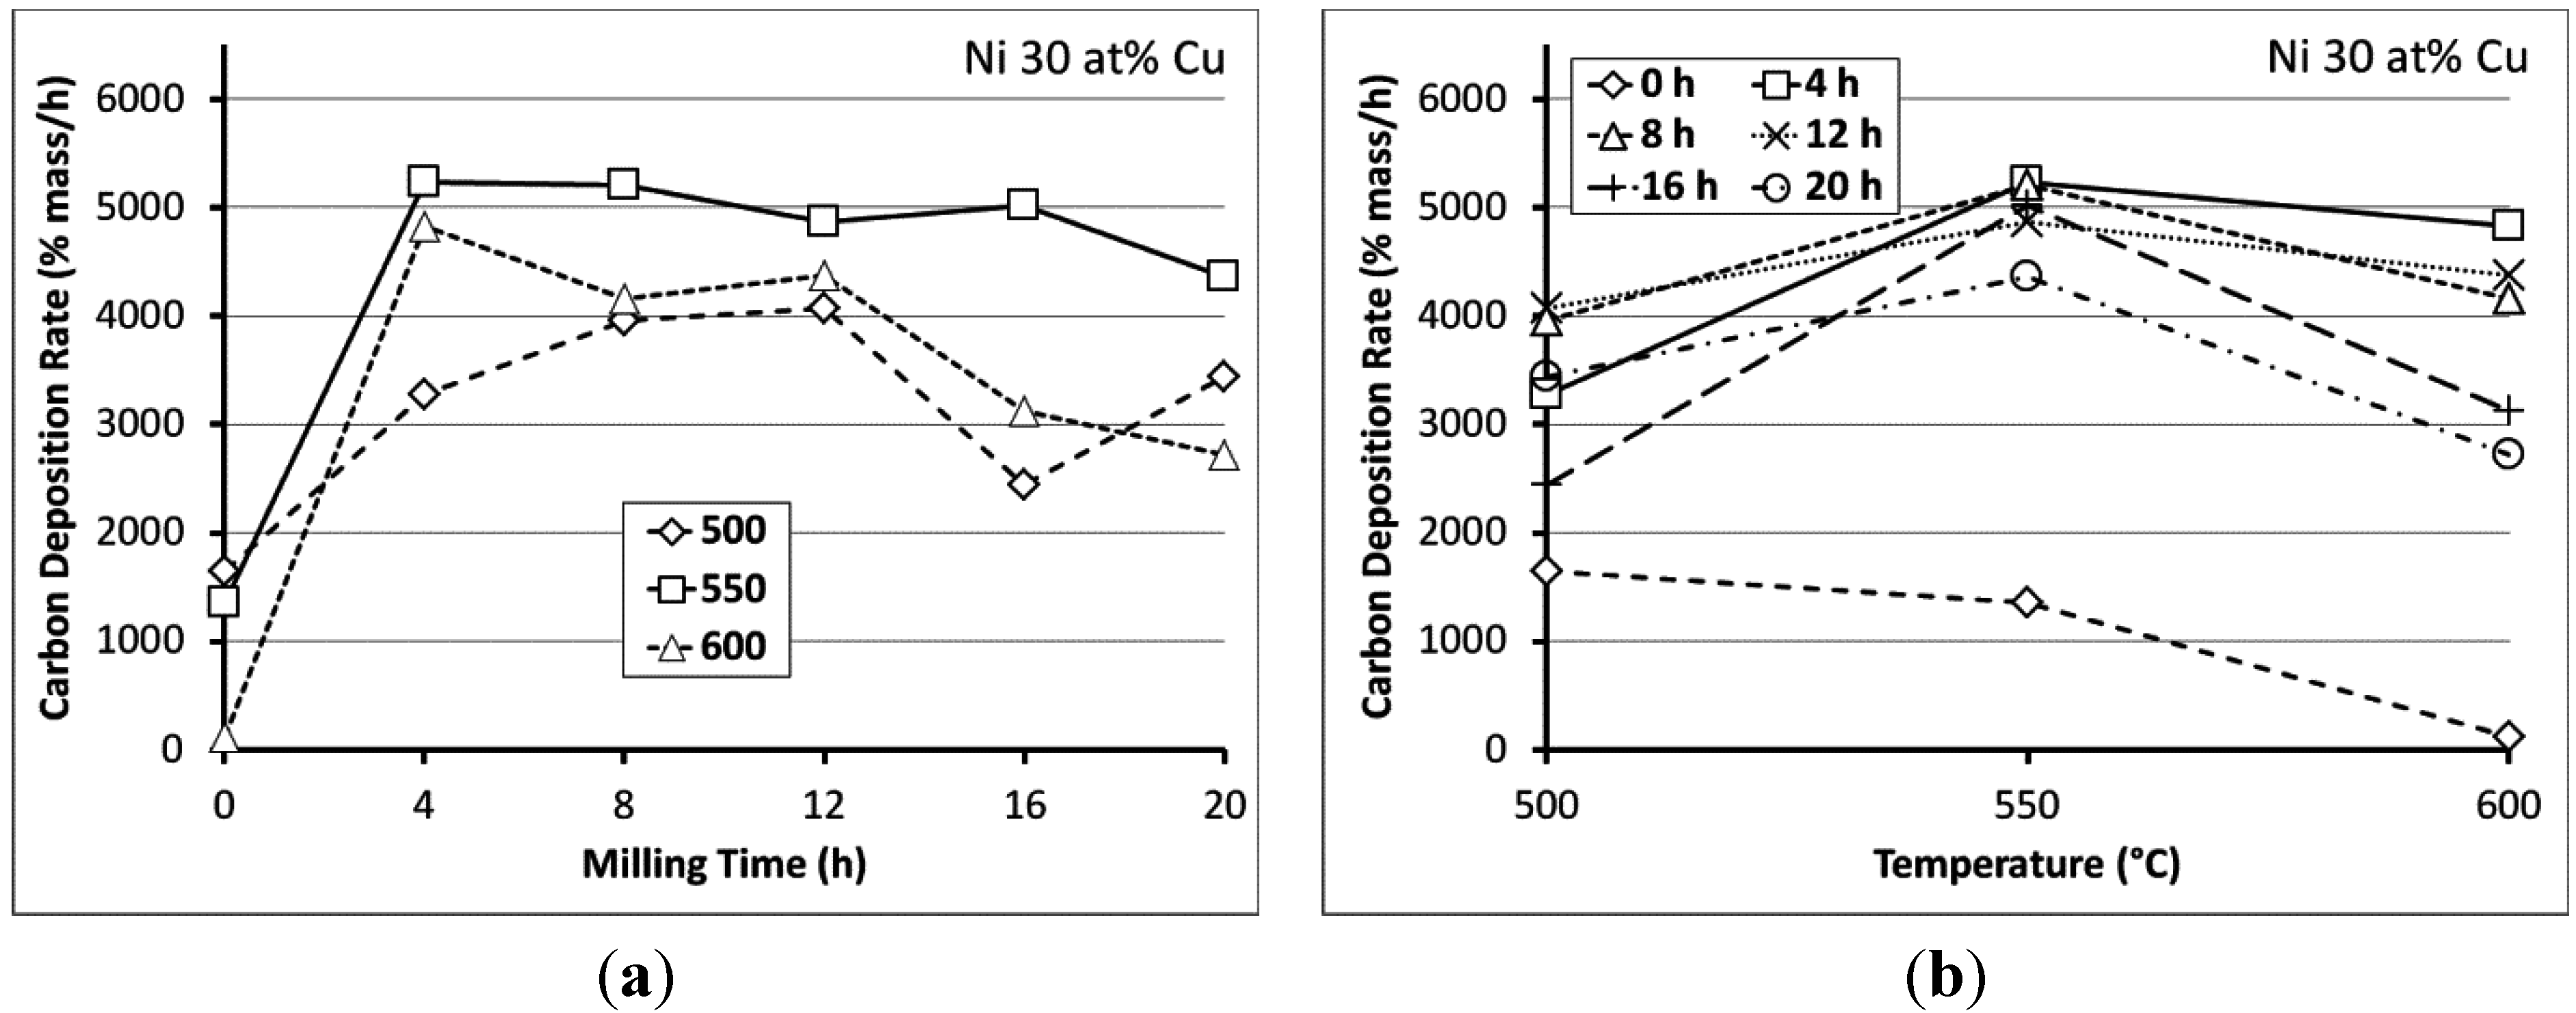
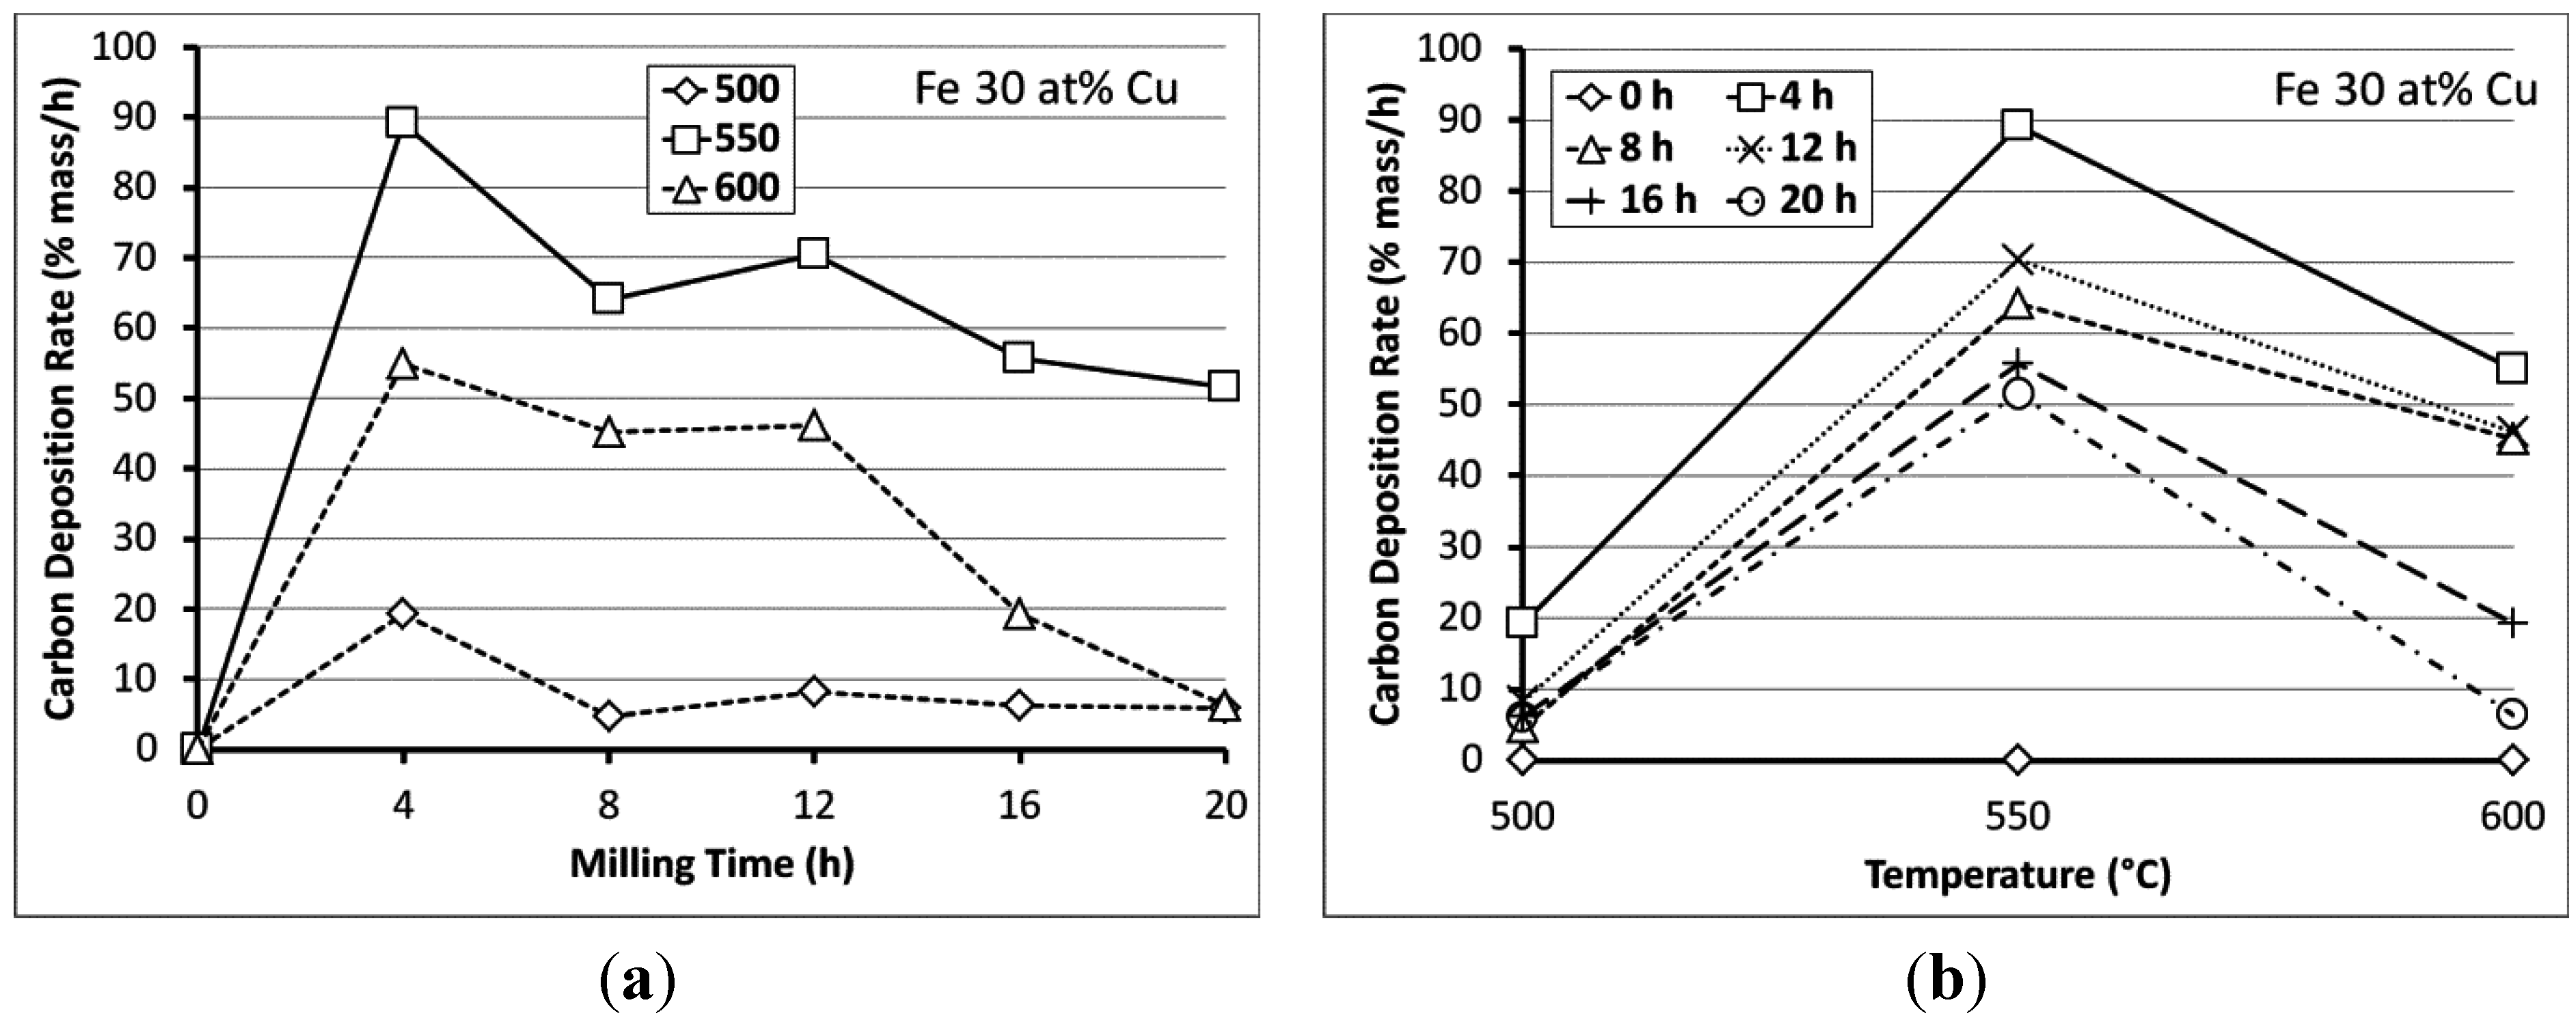
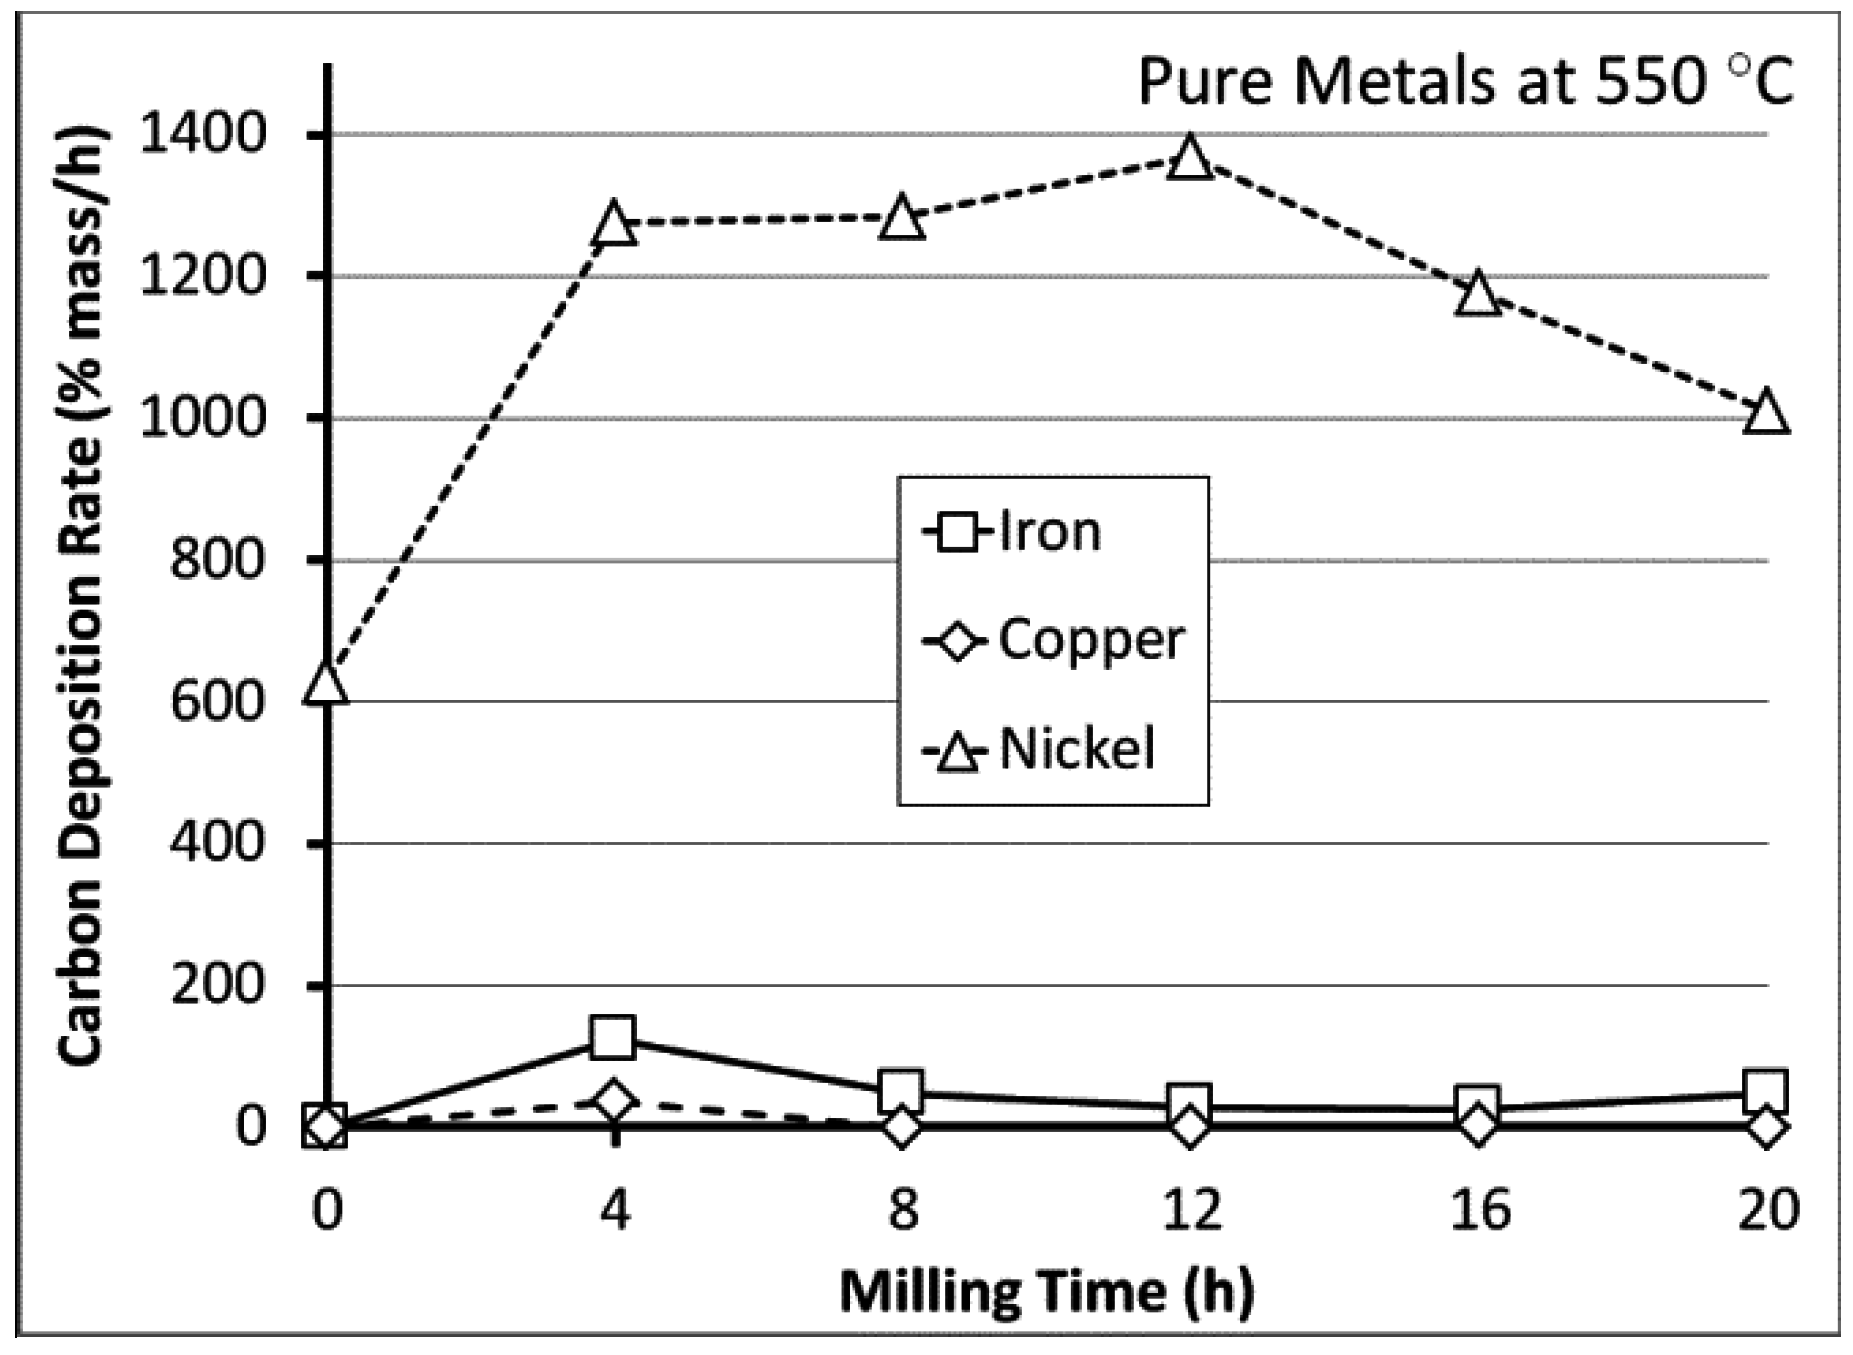
3.2. Carbon Deposition

Notable carbon deposition was achieved using both catalyst alloys (see Figure 6 and Figure 7), but Ni–Cu was far more effective over all conditions of milling and temperature tested here. As shown in Figure 6 and Figure 7, milled samples achieved a deposition rate (mass%/h) of greater than 3000%/h under all conditions, but the optimal rate occurred at 550 °C where all milled alloys achieved a rate near 5000%/h. For example, a 10 mg catalyst load will result in a final mass of 300–500 mg of carbon during a 1 h reaction. The unmilled, blended catalyst powders also achieved growth, but the activity is attributed to Ni alone, which is known to be a catalytic metal for carbon deposition [7,28,64,65,66,67,68,69]. The rate is comparable to pure Ni, which was tested as a control sample with growth rates shown in Figure 8.
Figure 6. Carbon deposition rates catalyzed by Ni 30 at% Cu milled for (a) varying durations and (b) at varying temperatures. Samples “milled” for 0 h are the constituent powders blended in the appropriate ratio with no alloying conducted.
Fibers 03 00394 g006
The Fe–Cu alloy also catalyzed carbon deposition, but the rate was much lower (see Figure 7). Even under the optimum conditions, the growth rates were less than 100%/h, which is about 3% or less of the Ni–Cu alloy. Lower milling times tended to have a slightly improved deposition rate, and 550 °C was the most effective deposition temperature for all milling times. The deposition rates of the unmilled powder blends are negligible as is pure, unmilled iron as shown in Figure 8.
The pure metals were also milled for varying times, and deposition reactions were conducted at 550 °C to determine the possible correlations between the alloys and their constituent elements. As shown in Figure 8, Ni is an effective catalyst by itself. Fe is similar to the Fe–Cu alloy in deposition rate and response to milling time. Cu is ineffective as a catalyst toward carbon deposition under all conditions tested here.
Figure 7. Carbon deposition rates catalyzed by Fe 30 at% Cu milled for (a) varying durations and (b) at varying temperatures. Samples “milled” for 0 h are the constituent powders blended in the appropriate ratio with no alloying conducted.
Fibers 03 00394 g007
Figure 8. Carbon deposition rates catalyzed by pure metals used to create alloys. Samples “milled” for 0 h were used as-is, directly from the supplier.
Fibers 03 00394 g008
The character of the carbon deposited is also of interest, and Ni–Cu and Fe–Cu alloys milled for 4 h and reactions conducted at 550 °C were chosen for further analysis as these were the optimum conditions for both alloys. As shown in Figure 9, the Ni–Cu alloy forms smaller fibers which generally have a smoother, straighter morphology. Due to the large volume of growth observed in the Ni–Cu alloys, it is expected the original catalyst particles are significantly disintegrated and the catalyst is redistributed throughout the fiber mass. Fibers deposited on the Fe–Cu alloy followed closely to the shape of the original particles and are expected to be closer to the catalyst surface.
Figure 9. Carbon nanofibers deposited on Ni 30 at% Cu (a,b) and Fe 30 at% Cu (c,d) at 550 °C with C2H4:H2 (4:1). Both catalysts were milled for 4 h before the reaction.
Fibers 03 00394 g009

3.3. Processing Considerations

Bimetallic catalysts are particularly useful as they can result in significant enhancements in deposition rate, can alter the needed reaction conditions compared to their pure constituents (temperature, reaction gas(es), etc.). This is due to the formation of unique surface compositions which affect the way hydrocarbons adsorb, such as the preferential enrichment of the surface with one element or the other by means of temperature, gas chemistry or both (e.g., [9,22]). These principles have been demonstrated in a variety of systems as briefly described in the introduction, and the benefits have been realized in both miscible and immiscible alloys. The methods used in this study are intended to provide a comparative analysis with previously described work in the Ni–Cu [22,70] and Fe–Cu [24,71] systems. The differences in catalyst form and resulting carbon deposition are central, but the findings can be applied more broadly to other miscible and immiscible metallic catalyst systems.
Mechanical alloying (MA) presents an attractive alternative to precipitation as the process is very simple and the production rate can be much higher. A disadvantage of MA is that it is results in powder with greater size disparity and a larger average particle size overall. That is, chemical methods are more effective at producing nano- or microscale particles. This is important since nanofiber growth is linked to particle size [72]. In larger powders, foils and other “bulk” catalysts, the fiber size is much less than the catalyst dimensions, and this has been associated with surface breakup [10,73,74] where sections of the catalysts are lifted away with the fiber. Catalyst morphology and composition are the controlling factors in carbon deposition, then, and their evolution during processing is critical to the deposition process.
As found during XRD analysis, Cu-Ni alloys were fully mixed and reached a terminal grain size within the first 4 h of milling. Milling for longer times only increased the particle size and caused a slight decrease in deposition rate for the longest times. The application of heat had a very modest effect at 500 °C, and the composition over small volumes is considered to be constant and uniform. Surface breakup of the catalyst is expected to be aided by the refined microstructure [74] and fiber growth is quite efficient, approaching that of co-precipitation methods (25 g of carbon per 100 mg of catalyst over 4 h [24,70], or ~6200 mass%/h as used here), which produce smaller particles.
The Fe–Cu system was much more difficult to fully alloy, and when heated to the minimum reaction temperature, it had already separated into distinct phases of an Fe-rich matrix containing Cu-rich particles, though each phase is still highly refined in terms of the crystallite/particle size. The conversion of an as-milled, lamellar structure into discrete particles can be attributed to shape instability such as discussed in the Cu–Ta system [43], and may be beneficial to stabilizing the nanostructure. Co-precipitation of Fe–Cu alloys has been reported to generate particles 3 µm in diameter, which is much larger than the microstructural features observed here, so mechanical alloying is not thought to be at a significant disadvantage due to initial particle size. Even with distinct phases, the Fe–Cu alloy prepared here exhibits growth rates which are as good as, and in some cases better than, those reported for the co-precipitated alloy (i.e., 1.6 g of carbon per gram of catalyst over 3 h [71], or 53.3 mass%/h, as used here). Determining the composition of the catalyst during surface breakup is more challenging since each active catalyst particle may contain a different concentration of Cu depending on where the particle originates. This could lead to differing growth rates and fiber character as well. The elemental distribution in immiscible systems, before and during carbon deposition, is a topic of continuing study.
Pure metals were also processed to establish the contributions of individual elements and to determine the benefits of alloying. The Ni–Cu and Fe–Cu alloys both exceeded the milled elements from which they were made as well as their unmilled mixtures. This indicates that mechanical alloying is necessary to achieve a catalytic benefit. This is not always the case, as Pd and Co have been found to perform better when the elemental powders are mixed rather than alloyed [52]. Fe benefitted from 4 h of milling, nearly matching the alloy, though it decreased significantly at longer times. That same trend of decreasing activity for longer milling times is seen the Fe–Cu alloy. Cu did not show any notable deposition for any condition, but it is known to be one of the metals that will not catalytically form CNFs under most conditions [9,25].
Ni, on the other hand, catalyzed carbon deposition both in the as-received condition and after milling. Indeed, the Ni powder milled for 4 h performed significantly better than the as-received powder. This is somewhat surprising since the as-received powder had a sub-micron particle size and milling was found to increase the particle size over time. The activity of the pure Ni did decrease with milling time, but even up to 20 h of milling, it maintained a higher deposition rate than without milling.
The improvement after short milling times may be attributed to the breakup of surface oxides and/or the balance between particle size and microstructural refinement. Initially the particle size is reduced (in the case of iron or copper) and microstructural refinement progresses quickly. As milling continues, the microstructure changes more slowly, but the particle size increases and the particles acquire smoother surfaces. Therefore, they have less surface area and lower reactivity, which is expected to hamper deposition rates. A more detailed connection between the microstructure and catalytic activity is ongoing.
SEM imaging of the fibers formed using the Ni–Cu and Fe–Cu alloys shows them have diameters ranging from ~100–150 nm for the Ni–Cu sample to ~150–350 nm for the Fe–Cu sample, but some larger and smaller fibers were observed for both samples. The fibers catalyzed from the Ni–Cu alloy tended to have a more uniform size and a regular morphology, whereas fibers catalyzed using Fe–Cu exhibited irregular surfaces and more varied sizes. Co-precipitation in the Cu–Ni system [70] generated particles ~1 µm in diameter and CNFs 25–100 nm in diameter, and in the Fe–Cu system [71] it resulted in a range of fibers sizes from the 3 µm particle, with the lowest surface area (largest fibers) belonging to the 4:1 (C2H4:H2) deposition product. Therefore, co-precipitated catalysts often carry similar considerations in fiber deposition. Within the context of this study, then, mechanical alloying has been shown to be feasible for catalyst preparation in both miscible and immiscible alloy systems.

4. Conclusions

Mechanical alloying is a versatile technique for creating unique, non-equilibrium alloys. The resulting nanostructured alloys are often studied in the context of structural applications, and their use in catalysis is a relatively unexplored field. The two alloys studied here, Ni 30 at% Cu and Fe 30 at% Cu, represent highly soluble and insoluble systems, respectively. Despite their differences in response to milling duration and thermal treatment, both alloys were found to perform comparably to identical compositions produced using co-precipitation. This establishes that mechanical alloying can be used to rapidly produce effective catalysts.

Acknowledgments

The assistance of the staff scientists at the Pennsylvania State University Materials Characterization Laboratory is gratefully acknowledged, especially Nichole Wonderling (XRD) and Julie Anderson (catalyst SEM/EDS and particle size analysis). We are also grateful for the assistance and training provided by Chaoying Ni, Frank Kriss and Yu Cao at the Keck Electron Microscopy Facility at the University of Delaware. Financial support for this work was provided by the National Science Foundation, Award # 1436444.

Author Contributions

Mark Atwater conceived and directed the research, analyzed data and wrote and edited portions of the manuscript. Laura Guevara performed experiments, SEM and contributed to writing the manuscript, especially on CNFs. Crystal Wanner also performed experiments, SEM and contributed to writing the manuscript, especially on mechanical alloying. Roger Welsh set up experimental equipment, conducted experiments and performed SEM analysis.

Conflicts of Interest

The authors declare no conflict of interest.

References

  1. De Jong, K.P.; Geus, J.W. Carbon nanofiber: Synthesis and applications. Catal. Rev. 2000, 42, 481–510. [Google Scholar] [CrossRef]
  2. Takenaka, S.; Ishida, M.; Serizawa, M.; Tanabe, E.; Otsuka, K. Formation of carbon nanofibers and carbon nanotubes through methane decomposition over supported cobalt catalysts. J. Phys. Chem. B 2004, 108, 11464–11472. [Google Scholar] [CrossRef]
  3. Baird, T.; Fryer, J.R.; Grant, B. Structure of filamentous carbon. Nature 1971, 233, 329–330. [Google Scholar] [CrossRef] [PubMed]
  4. Rodriguez, N.M.; Kim, M.S.; Baker, R.T.K. Promotion effect of carbon monoxide on the deecomposition of ethylene over an iron catalyst. J. Catal. 1993, 144, 93–108. [Google Scholar] [CrossRef]
  5. Terrones, H.; Hayashi, T.; Munoz-Navia, M.; Terrones, M.; Kim, Y.A.; Grobert, N.; Kamalkaran, R.; Dorantes-Davila, J.; Escudero, R.; Dresselhaus, M.S.; et al. Graphitic cones in palladium catalysed carbon nanofibers. Chem. Phys. Lett. 2001, 343, 241–250. [Google Scholar] [CrossRef]
  6. Owens, W.T.; Rodriguez, N.M.; Baker, R.T.K. Carbon filament growth on platinum catalysts. J. Phys. Chem. 1992, 96, 5048–5053. [Google Scholar] [CrossRef]
  7. Baker, R.T.K.; Barber, M.A.; Harris, P.S.; Feates, F.S.; Waite, R.J. Nucleation and growth of carbon deposits from the nickel catalyzed decomposition of acetylene. J. Catal. 1972, 26, 51–62. [Google Scholar] [CrossRef]
  8. Borgna, A.; Moraweck, B.; Massardier, J.; Renouprez, A.J. New supported palladium-chromium catalysts: Characterization and catalytic properties. J. Catal. 1991, 128, 99–112. [Google Scholar] [CrossRef]
  9. Chambers, A.; Rodriguez, N.M.; Baker, R.T.K. Modification of the catalytic behavior of cobalt by the addition of copper. J. Phys. Chem. 1995, 99, 10581–10589. [Google Scholar] [CrossRef]
  10. Jablonski, G.A.; Geurts, F.W.; A. Sacco, J. Carbon deposition over Fe, Ni, and Co foils from CO-H, -CH4-CO2-H2O, CO-CO2, CH4-H2, and CO-H2-H2O gas mixtures: II: Kinetics. Carbon 1992, 30, 99–106. [Google Scholar] [CrossRef]
  11. Kvande, I.; Chen, D.; Yu, Z.; Rønning, M.; Holmen, A. Optimization and scale-up of CNF production based on intrinsic kinetic data obtained from teom. J. Catal. 2008, 256, 204–214. [Google Scholar] [CrossRef]
  12. Park, C.; Baker, R.T.K. Carbon deposition on iron-nickel during interaction with ethylene-carbon monoxide-hydrogen mixtures. J. Catal. 2000, 190, 104–117. [Google Scholar] [CrossRef]
  13. Chambers, A.; Baker, R.T.K. Influence of the nature of the catalyst precursor on the carbon deposition characteristics during ethylene decomposition over copper–cobalt. J. Catal. 1996, 158, 356–360. [Google Scholar] [CrossRef]
  14. Rodriguez, N.M.; Kim, M.-S.; Baker, R.T.K. Carbon nanofibers: A unique catalyst support medium. J. Phys. Chem. 1994, 98, 13108–13111. [Google Scholar] [CrossRef]
  15. Bartholomew, C.H. Mechanisms of catalyst deactivation. Appl. Catal. A Gen. 2001, 212, 17–60. [Google Scholar] [CrossRef]
  16. Wu, N.L.; Phillips, J. Catalytic etching of platinum during ethylene oxidation. J. Phys. Chem. 1985, 89, 591–600. [Google Scholar] [CrossRef]
  17. Wu, N.L.; Phillips, J. Carbon deposition on platinum during ethylene oxidation. J. Catal. 1988, 113, 383–397. [Google Scholar] [CrossRef]
  18. Phillips, J.; Shiina, T.; Nemer, M.; Lester, K. Graphitic structures by design. Langmuir 2006, 22, 9694–9703. [Google Scholar] [CrossRef] [PubMed]
  19. Atwater, M.A.; Phillips, J.; Doorn, S.K.; Luhrs, C.C.; Fernandez, Y.; Menendez, J.A.; Leseman, Z.C. The production of carbon nanofibers and thin films on palladium catalysts from ethylene–oxygen mixtures. Carbon 2009, 47, 2269–2280. [Google Scholar] [CrossRef]
  20. Atwater, M.A.; Phillips, J.; Leseman, Z.C. Formation of carbon nanofibers and thin films catalyzed by palladium in ethylene-hydrogen mixtures. J. Phys. Chem. C 2010, 114, 5804–5810. [Google Scholar] [CrossRef]
  21. Park, C.; Baker, R.T.K. Carbon deposition on iron-nickel during interaction with ethylene-hydrogen mixtures. J. Catal. 1998, 179, 361–374. [Google Scholar] [CrossRef]
  22. Rodriguez, N.M.; Kim, M.S.; Baker, R.T.K. Deactivation of copper-nickel catalysts due to changes in surface composition. J. Catal. 1993, 140, 16–29. [Google Scholar] [CrossRef]
  23. Klein, K.L.; Melechko, A.V.; Rack, P.D.; Fowlkes, J.D.; Meyer, H.M.; Simpson, M.L. Cu–Ni composition gradient for the catalytic synthesis of vertically aligned carbon nanofibers. Carbon 2005, 43, 1857–1863. [Google Scholar] [CrossRef]
  24. Rodriguez, N.M.; Chambers, A.; Baker, R.T.K. Catalytic engineering of carbon nanostructures. Langmuir 1995, 11, 3862–3866. [Google Scholar] [CrossRef]
  25. Chambers, A.; Rodriguez, N.M.; Baker, R.T.K. Influence of copper on the structural characteristics of carbon nanofibers produced from the cobalt-catalyzed decomposition of ethylene. J. Mater. Res. 1996, 11, 430–438. [Google Scholar] [CrossRef]
  26. Park, C.; Rodriguez, N.M.; Baker, R.T.K. Carbon deposition on iron-nickel during interaction with carbon monoxide-hydrogen mixtures. J. Catal. 1997, 169, 212–227. [Google Scholar] [CrossRef]
  27. Rodriguez, N.M.; Kim, M.S.; Baker, R.T.K. Deactivation of copper-nickel catalysts due to changes in surface composition. J. Catal. 2003, 140, 16–29. [Google Scholar] [CrossRef]
  28. Li, Y.; Zhang, B.; Xie, X.; Liu, J.; Xu, Y.; Shen, W. Novel Ni catalysts for methane decomposition to hydrogen and carbon nanofibers. J. Catal. 2006, 238, 412–424. [Google Scholar] [CrossRef]
  29. Ngo, Q.; Cassell, A.M.; Radmilovic, V.; Li, J.; Krishnan, S.; Meyyappan, M.; Yang, C.Y. Palladium catalyzed formation of carbon nanofibers by plasma enhanced chemical vapor deposition. Carbon 2007, 45, 424–428. [Google Scholar] [CrossRef]
  30. Melechko, A.V.; Merkulov, V.I.; McKnight, T.E.; Guillorn, M.A.; Klein, K.L.; Lowndes, D.H.; Simpson, M.L. Vertically aligned carbon nanofibers and related structures: Controlled synthesis and directed assembly. J. Appl. Phys. 2005, 97. [Google Scholar] [CrossRef]
  31. Palumbo, M.; Curiotto, S.; Battezzatia, L. Thermodynamic analysis of the stable and metastable Co–Cu and Co–Cu–Fe phase diagrams. Calphad 2006, 30, 171–178. [Google Scholar] [CrossRef]
  32. Turchanin, M.A.; Agraval, P.G.; Nikolaenko, I.V. Thermodynamics of alloys and phase equilibria in the copper-iron system. J. Phase Equilib. 2003, 24, 307–319. [Google Scholar] [CrossRef]
  33. Suryanarayana, C.; Ivanob, E.; Boldyrev, V.V. The science and technology of mechanical alloying. Mater. Sci. Eng. A 2001, 304–306, 151–158. [Google Scholar] [CrossRef]
  34. Suryanarayana, C. Mechanical alloying and milling. Prog. Mater. Sci. 2001, 46, 1–184. [Google Scholar] [CrossRef]
  35. Suryanarayana, C.; Koch, C.C. Nanocrystalline materials—Current research and future directions. Hyperfine Interact. 2000, 130, 5–44. [Google Scholar] [CrossRef]
  36. Koch, C.C. Materials synthesis by mechanical alloying. Annu. Rev. Mater. Sci. 1989, 19, 121–143. [Google Scholar] [CrossRef]
  37. Koch, C.C. The synthesis and structure of nanocrystalline materials produced by mechanical attrition: A review. Nanostruct. Mater. 1993, 2, 109–129. [Google Scholar] [CrossRef]
  38. Koch, C.C.; Cho, Y.S. Nanocrystals by high energy ball milling. Nanostruct. Mater. 1992, 1, 207–212. [Google Scholar] [CrossRef]
  39. Lü, L.; Lai, M.O. Mechanical Alloying; Kluwer Academic Publishers: Boston, MA, USA, 1998; pp. 1–6. [Google Scholar]
  40. Yavari, A.R.; Desre, P.J.; Benameur, T. Mechanically driven alloying of immiscible elements. Phys. Rev. Lett. 1992, 68, 2235–2238. [Google Scholar] [CrossRef] [PubMed]
  41. Carsley, J.E.; Fisher, A.; Milligan, W.W.; Aifantis, E.C. Mechanical behavior of a bulk nanostructured iron alloy. Metall. Mater. Trans. A 1998, 29A, 2261–2271. [Google Scholar] [CrossRef]
  42. Benjamin, J.S. Mechanical alloying. Sci. Am. 1976, 234, 40–49. [Google Scholar] [CrossRef]
  43. Darling, K.A.; Roberts, A.J.; Mishin, Y.; Mathaudhu, S.N.; Kecskes, L.J. Grain size stabilization of nanocrystalline copper at high temperatures by alloying with tantalum. J. Alloys Compd. 2013, 573, 142–150. [Google Scholar] [CrossRef]
  44. Frolov, T.; Darling, K.A.; Kecskes, L.J.; Mishin, Y. Stabilization and strengthening of nanocrystalline copper by alloying with tantalum. Acta Mater. 2012, 60, 2158–2168. [Google Scholar] [CrossRef]
  45. Atwater, M.A.; Roy, D.; Darling, K.A.; Butler, B.G.; Scattergood, R.O.; Koch, C.C. The thermal stability of nanocrystalline copper cryogenically milled with tungsten. Mater. Sci. Eng. A 2012, 558, 226–233. [Google Scholar] [CrossRef]
  46. Raghu, T.; Sundaresan, R.; Ramakrishnan, P.; Mohan, T.R.R. Synthesis of nanocrystalline copper–tungsten alloys by mechanical alloying. Mater. Sci. Eng. A 2001, 304–306, 438–441. [Google Scholar] [CrossRef]
  47. Aboud, T.; Weiss, B.-Z.; Chaim, R. Mechanical alloying of the immiscible system W-Cu. Nanostruct. Mater. 1995, 6, 405. [Google Scholar] [CrossRef]
  48. Sahani, P.; Mula, S.; Roy, P.K.; Kang, P.C.; Koch, C.C. Structural investigation of vacuum sintered Cu–Cr and Cu–Cr–4% SiC nanocomposites prepared by mechanical alloying. Mater. Sci. Eng. A 2011, 528, 7781–7789. [Google Scholar] [CrossRef]
  49. Patel, A.N.; Diamond, S. The effects of non-equilibrium processing in the development of copper alloys. Mater. Sci. Eng. A 1988, 98, 329–334. [Google Scholar] [CrossRef]
  50. Aguilara, C.; Ordonez, S.; Guzman, D.; Rojas, P.A. Mechanical alloying of Cu–xCr (x = 3, 5 and 8 wt.%) alloys. J. Alloys Compd. 2010, 504, 102–109. [Google Scholar] [CrossRef]
  51. Miettinen, J. Thermodynamic description of Cu–Mg–Ni and Cu–Mg–Zn systems. Calphad 2008, 32, 389–398. [Google Scholar] [CrossRef]
  52. Atwater, M.A.; Phillips, J.; Leseman, Z.C. Accelerated growth of carbon nanofibers using physical mixtures and alloys of Pd and Co in an ethylene–hydrogen environment. Carbon 2011, 49, 1058–1066. [Google Scholar] [CrossRef]
  53. Black, D.R.; Windover, D.; Henins, A.; Gil, D.; Filliben, J.; Cline, J.P. Certification of nist standard reference material 640d. Powder Diffr. 2010, 25, 187–190. [Google Scholar] [CrossRef]
  54. Koch, C.C.; Scattergood, R.O.; Darling, K.A.; Semones, J.E. Stabilization of nanocrystalline grain sizes by solute additions. J. Mater. Sci. 2008, 43, 7264–7272. [Google Scholar] [CrossRef]
  55. Krill, C.E.; Ehrhardt, H.; Birringer, R. Thermodynamic stabilization of nanocrystallinity. Z. Metallkd. 2005, 96, 1134–1141. [Google Scholar] [CrossRef]
  56. Millett, P.C.; Selvam, R.P.; Saxena, A. Molecular dynamics simulations of grain size stabilization in nanocrystalline materials by addition of dopants. Acta Mater. 2006, 54, 297–303. [Google Scholar] [CrossRef]
  57. Chookajorn, T.; Murdoch, H.A.; Schuh, C.A. Design of stable nanocrystalline alloys. Science 2012, 337, 951–954. [Google Scholar] [CrossRef] [PubMed]
  58. Murdoch, H.A.; Schuh, C.A. Stability of binary nanocrystalline alloys against grain growth and phase separation. Acta Mater. 2013, 61, 2121–2132. [Google Scholar] [CrossRef]
  59. Darling, K.A.; Tschopp, M.A.; VanLeeuwen, B.K.; Atwater, M.A.; Liu, Z.K. Mitigating grain growth in binary nanocrystalline alloys through solute selection based on thermodynamic stability maps. Comp. Mater. Sci. 2014, 84, 255–266. [Google Scholar] [CrossRef]
  60. Andrievski, R.A. Review of thermal stability of nanomaterials. J. Mater. Sci. 2014, 49, 1449–1460. [Google Scholar] [CrossRef]
  61. Cullity, B.D.; Stock, S.R. Elements of X-ray Diffraction, 3rd ed.; Prentice Hall: Upper Saddle River, NJ, USA, 2001; p. 170. [Google Scholar]
  62. Kleiner, S.; Bertocco, F.; Khalid, F.A.; Beffort, O. Decomposition of process control agent during mechanical milling and its influence on displacement reactions in the Al–TiO2 system. Mater. Chem. Phys. 2005, 89, 362–366. [Google Scholar] [CrossRef]
  63. Zhang, Y.F.; Lu, L.; Yap, S.M. Prediction of the amount of pca for mechanical milling. J. Mater. Process Tech. 1999, 89–90, 260–265. [Google Scholar] [CrossRef]
  64. Jarrah, N.A.; Ommen, J.G.V.; Lefferts, L. Mechanistic aspects of the formation of carbon-nanofibers on the surface of Ni foam: A new microstructured catalyst support. J. Catal. 2006, 239, 460–469. [Google Scholar] [CrossRef]
  65. Martin-Gullon, I.; Vera, J.; Conesa, J.A.; Gonzalez, J.L.; Merino, C. Differences between carbon nanofibers produced using Fe and Ni catalysts in a floating catalyst reactor. Carbon 2006, 44, 1572–1580. [Google Scholar] [CrossRef]
  66. Anderson, P.E.; Rodriguez, N.M. Influence of the support on the structural characteristics of carbon nanofibers produced from the metal-catalyzed decomposition of ethylene. Chem. Mater. 2000, 12, 823–830. [Google Scholar] [CrossRef]
  67. Boellaard, E.; Bokx, P.K.D.; Kock, A.J.H.M.; Geus, J.W. The formation of filamentous carbon on iron and nickel catalysts—III morphology. J. Catal. 1985, 96, 481–490. [Google Scholar] [CrossRef]
  68. Bokx, P.K.D.; Kock, A.J.H.M.; Boellaard, E.; Klop, W.; Geus, J.W. The formation of filamentous carbon on iron and nickel catalysts: I. thermodynamics. J. Catal. 1985, 96, 454–467. [Google Scholar]
  69. Kock, A.J.H.M.; Bokx, P.K.D.; Boellaard, E.; Klop, W.; Geus, J.W. The formation of filamentous carbon on iron and nickel catalysts. J. Catal. 1985, 96, 468–480. [Google Scholar] [CrossRef]
  70. Kim, M.S.; Rodriguez, N.M.; Baker, R.T.K. The interaction of hydrocarbons with copper-nickel and nickel in the formation of carbon filaments. J. Catal. 1991, 131, 60–73. [Google Scholar] [CrossRef]
  71. Carneiro, O.C.; Rodriguez, N.M.; Baker, R.T.K. Growth of carbon nanofibers from the iron–copper catalyzed decomposition of CO/C2H4/H2 mixtures. Carbon 2005, 43, 2389–2396. [Google Scholar] [CrossRef]
  72. Rodriguez, N.M. A review of catlytically grown carbon nanofibers. J. Mater. Res. 1993, 8, 3233–3250. [Google Scholar] [CrossRef]
  73. Jablonski, G.A.; Geurts, F.W.; Sacco, J.A.; Biederman, R.R. Carbon deposition over Fe, Ni, and Co foils from CO-H, -CH4-CO2-H2O, CO-CO2, CH4-H2, and CO-H2-H2O gas mixtures: I. Morphology. Carbon 1992, 30, 87–98. [Google Scholar] [CrossRef]
  74. Yang, X.F.; Lu, J. A new way to synthesize carbon nanofiber film on bulk titanium via hybrid surface mechanical attrition treatment. Appl. Surf. Sci. 2013, 264, 191–196. [Google Scholar] [CrossRef]

