Article

Thermal Analysis of Tantalum Carbide-Hafnium Carbide Solid Solutions from Room Temperature to 1400 °C

Plasma Forming Laboratory, Department of Mechanical and Materials Engineering, Florida International University, Miami, 33139 FL, USA
*
Author to whom correspondence should be addressed.
Coatings 2017, 7(8), 111; https://doi.org/10.3390/coatings7080111
Submission received: 5 June 2017 / Revised: 10 July 2017 / Accepted: 25 July 2017 / Published: 28 July 2017
(This article belongs to the Special Issue Ultrahigh Temperature Ceramic Coatings and Composites)

Abstract

:
The thermogravimetric analysis on TaC, HfC, and their solid solutions has been carried out in air up to 1400 °C. Three solid solution compositions have been chosen: 80TaC-20 vol % HfC (T80H20), 50TaC-50 vol % HfC (T50H50), and 20TaC-80 vol % HfC (T20H80), in addition to pure TaC and HfC. Solid solutions exhibit better oxidation resistance than the pure carbides. The onset of oxidation is delayed in solid solutions from 750 °C for pure TaC, to 940 °C for the T50H50 sample. Moreover, T50H50 samples display the highest resistance to oxidation with the retention of the initial carbides. The oxide scale formed on the T50H50 sample displays mechanical integrity to prevent the oxidation of the underlying carbide solid solution. The improved oxidation resistance of the solid solution is attributed to the reaction between Ta2O5 and HfC, which stabilizes the volume changes induced by the formation of Ta2O5 and diminishes the generation of gaseous products. Also, the formation of solid solutions disturbs the atomic arrangement inside the lattice, which delays the reaction between Ta and O. Both of these mechanisms lead to the improved oxidation resistances of TaC-HfC solid solutions.

1. Introduction

The interest in tantalum carbide (TaC) and hafnium carbide (HfC) has been growing in recent years due to their extremely high melting points, high hardness, and elastic moduli, and more importantly, their ability to form solid solutions [1,2,3,4]. The major applications of these two carbides are leading edges of reentry vehicles and lining materials for rocket thrusters. In both cases, excellent oxidation resistance is required. However, gaseous products like CO and CO2 are inevitably formed during oxidation, which leads to porous oxide scales that delaminate and spall. The major oxide of TaC is Ta2O5, which has a melting point of ~1900 °C, lower than the desired application temperature of 2000 °C or more [5,6,7]. As a result, the resultant oxide would melt and lose its structural integrity, and fail catastrophically. To reduce the gaseous products as well as retain the integrity of oxide scales under extremely high temperatures, Hafnium diboride (HfB2) and its composites have been investigated as promising candidate materials for use on next-generation hypersonic vehicles [8,9]. During oxidation, HfB2 forms a solid scaffold-like structure that mainly consists of HfO2 and molten B2O3 infiltrated between the HfO2. The resultant oxide scale is dense and crack-free, which provides exceptional oxidation resistance. Unfortunately, the B2O3 starts to evaporate around 700 °C and therefore its protection of the underlying materials is lost. The SiC addition was used to stabilize the B2O3 by forming a borosilicate glass phase, which increases the onset evaporation temperature to 1400 °C. However, 1400 °C is still not high enough to withstand higher application temperatures of 2000 °C or more.
The studies on the solid solutions of TaC-HfC began with the discovery of a TaC0.8HfC0.2 phase that possesses the highest melting point (~4000 °C) of known substances [10]. Preliminary oxidation studies have been carried out on TaC0.8HfC0.2 and HfC-rich compositions, but no improvement in the oxidation behavior was observed compared to pure carbides [11,12,13,14]. Additionally, sintering aids were inevitable in those studies, which introduced secondary phases that clouded the understanding of oxidation behaviors. Although TaC and HfC can form solid solutions above 887 °C in all compositions, as shown in the phase diagram in Figure 1, oxidation studies on TaC-HfC solid solutions have barely been investigated.
Recently, Cedillos-Barraza et al. as well as our research group sintered TaC-HfC solid solutions without sintering additions by spark plasma sintering (SPS) [16,17]. The compositions cover the full spectrum of TaC-HfC solid solutions, and both studies noticed that TaC0.5HfC0.5 has the highest hardness and elastic modulus among the solid solutions. Our group conducted oxidation testing using a plasma jet by exposing these solid solutions and pure carbides to a temperature of ~3000 °C at a gas flow rate of sonic speed [18]. In general, the solid solutions showed better oxidation resistance than the pure carbides. The best oxidation resistance was found in the TaC0.5HfC0.5 composition. After 300 s of exposure to such extreme oxidation conditions, the thickness of the oxide scale in TaC0.5HfC0.5 was only 28 μm, which is 1/6 and 1/10 of the oxide scale thickness in pure HfC and TaC, respectively [18]. The improved oxidation mechanism was explained by a newly formed Hf6Ta2O17 phase. More importantly, we found a similar dense solid scaffold and liquid phase structure as reported in HfB2-SiC/HfB2-B4C systems that protect the underlying materials [18]. In the case of TaC-HfC solid solutions, the solid scaffold consists of HfO2 and Hf6Ta2O17, and the liquid phase is made of molten Ta2O5. Compared to the B2O3 and borosilicate phase in the diboride system, molten Ta2O5 is a much more stable phase with a higher melting point of 1900 °C. Hence, the carbide solid solutions exhibit exceptional oxidation resistance.
One question arises after the investigation on the plasma jet oxidation behavior of the carbide solid solutions: How would the carbide solid solutions behave below 1800 °C, where the temperature is not high enough to melt the resultant Ta2O5? To address this question, we sought to understand the oxidation behavior of the carbide solid solutions from room temperature to 1400 °C using thermogravimetric analysis (TGA). Five samples, namely pure TaC, 80TaC-20 vol % HfC (T80H20), 50TaC-50 vol % HfC (T50H50), 20TaC-80 vol % HfC (T20H80), and pure HfC, were chosen. A detailed analysis of the oxidation behavior is carried out in the present study using TGA followed by scanning electron microscopy (SEM).

2. Experimental Details

2.1. Materials

Commercial TaC powder (Inframat Advanced Materials LLC, Manchester, CT, USA) and hafnium carbide powder (Materion LLC, Cleveland, OH, USA) were used as starting powders. Powders for solid solutions were mixed by a high-energy vibratory ball milling machine (Across International LLC, Livingston, NJ, USA) according to their stoichiometric ratio. Pure powders were milled for one hour separately in a tungsten carbide (WC) jar to breakdown the agglomeration. Subsequently, TaC and HfC powders were mixed for another hour. The ball to powder ratio was 1:3, using a 6-mm diameter WC ball. The mixed TaC-HfC powders were consolidated by a spark plasma sintering (SPS) machine (Model 10-4, Thermal Technologies, Santa Rose, CA, USA). The powders were sintered at 1850 °C with a heating rate of 100 °C/min and a maximum uniaxial pressure of 60 MPa. The holding time was 10 min to ensure the densification. The environment in the vacuum was set at a pressure of 4 Pa. The details of the processing can be found in our previous study [17].

2.2. TGA Testing and Post-Oxidation Characterization

The TGA oxidation testing was conducted on a small portion (~30 mg) of the sintered pellets. A thermogravimetric analysis (TGA) analyzer (SDT-Q600, TA Instruments, New Castle, DE, USA) was used to evaluate the oxidation performance of TaC, HfC, and TaC-HfC solid solution samples. Samples were tested in the air at a heating rate of 5 °C/min. The maximum temperature was 1400 °C for all samples. The morphologies of the post-oxidation samples were examined by a field emission SEM (JSM-6330F, JEOL Ltd., Tokyo, Japan).

3. Results and Discussions

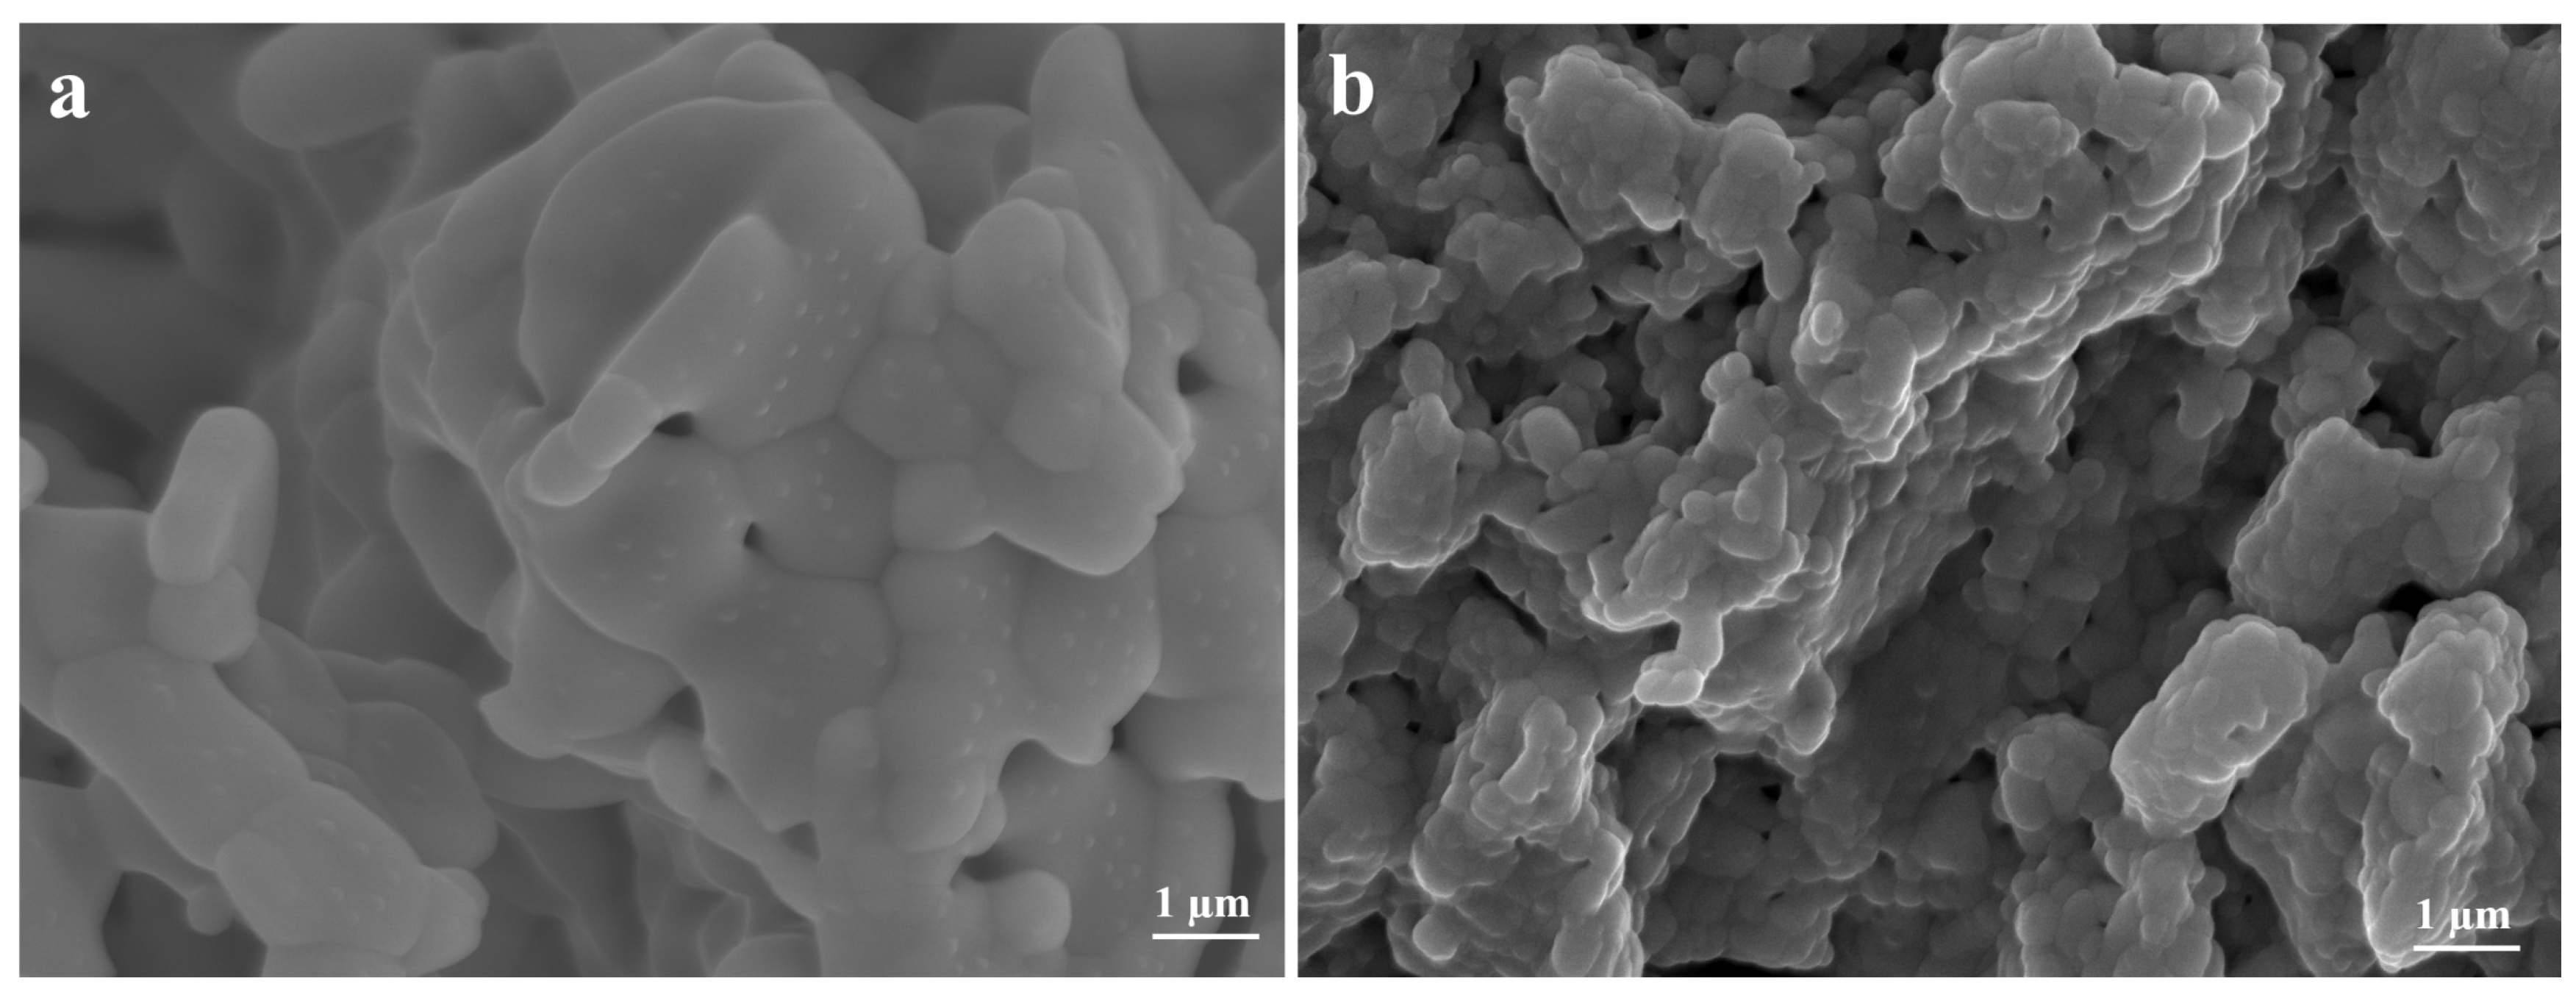
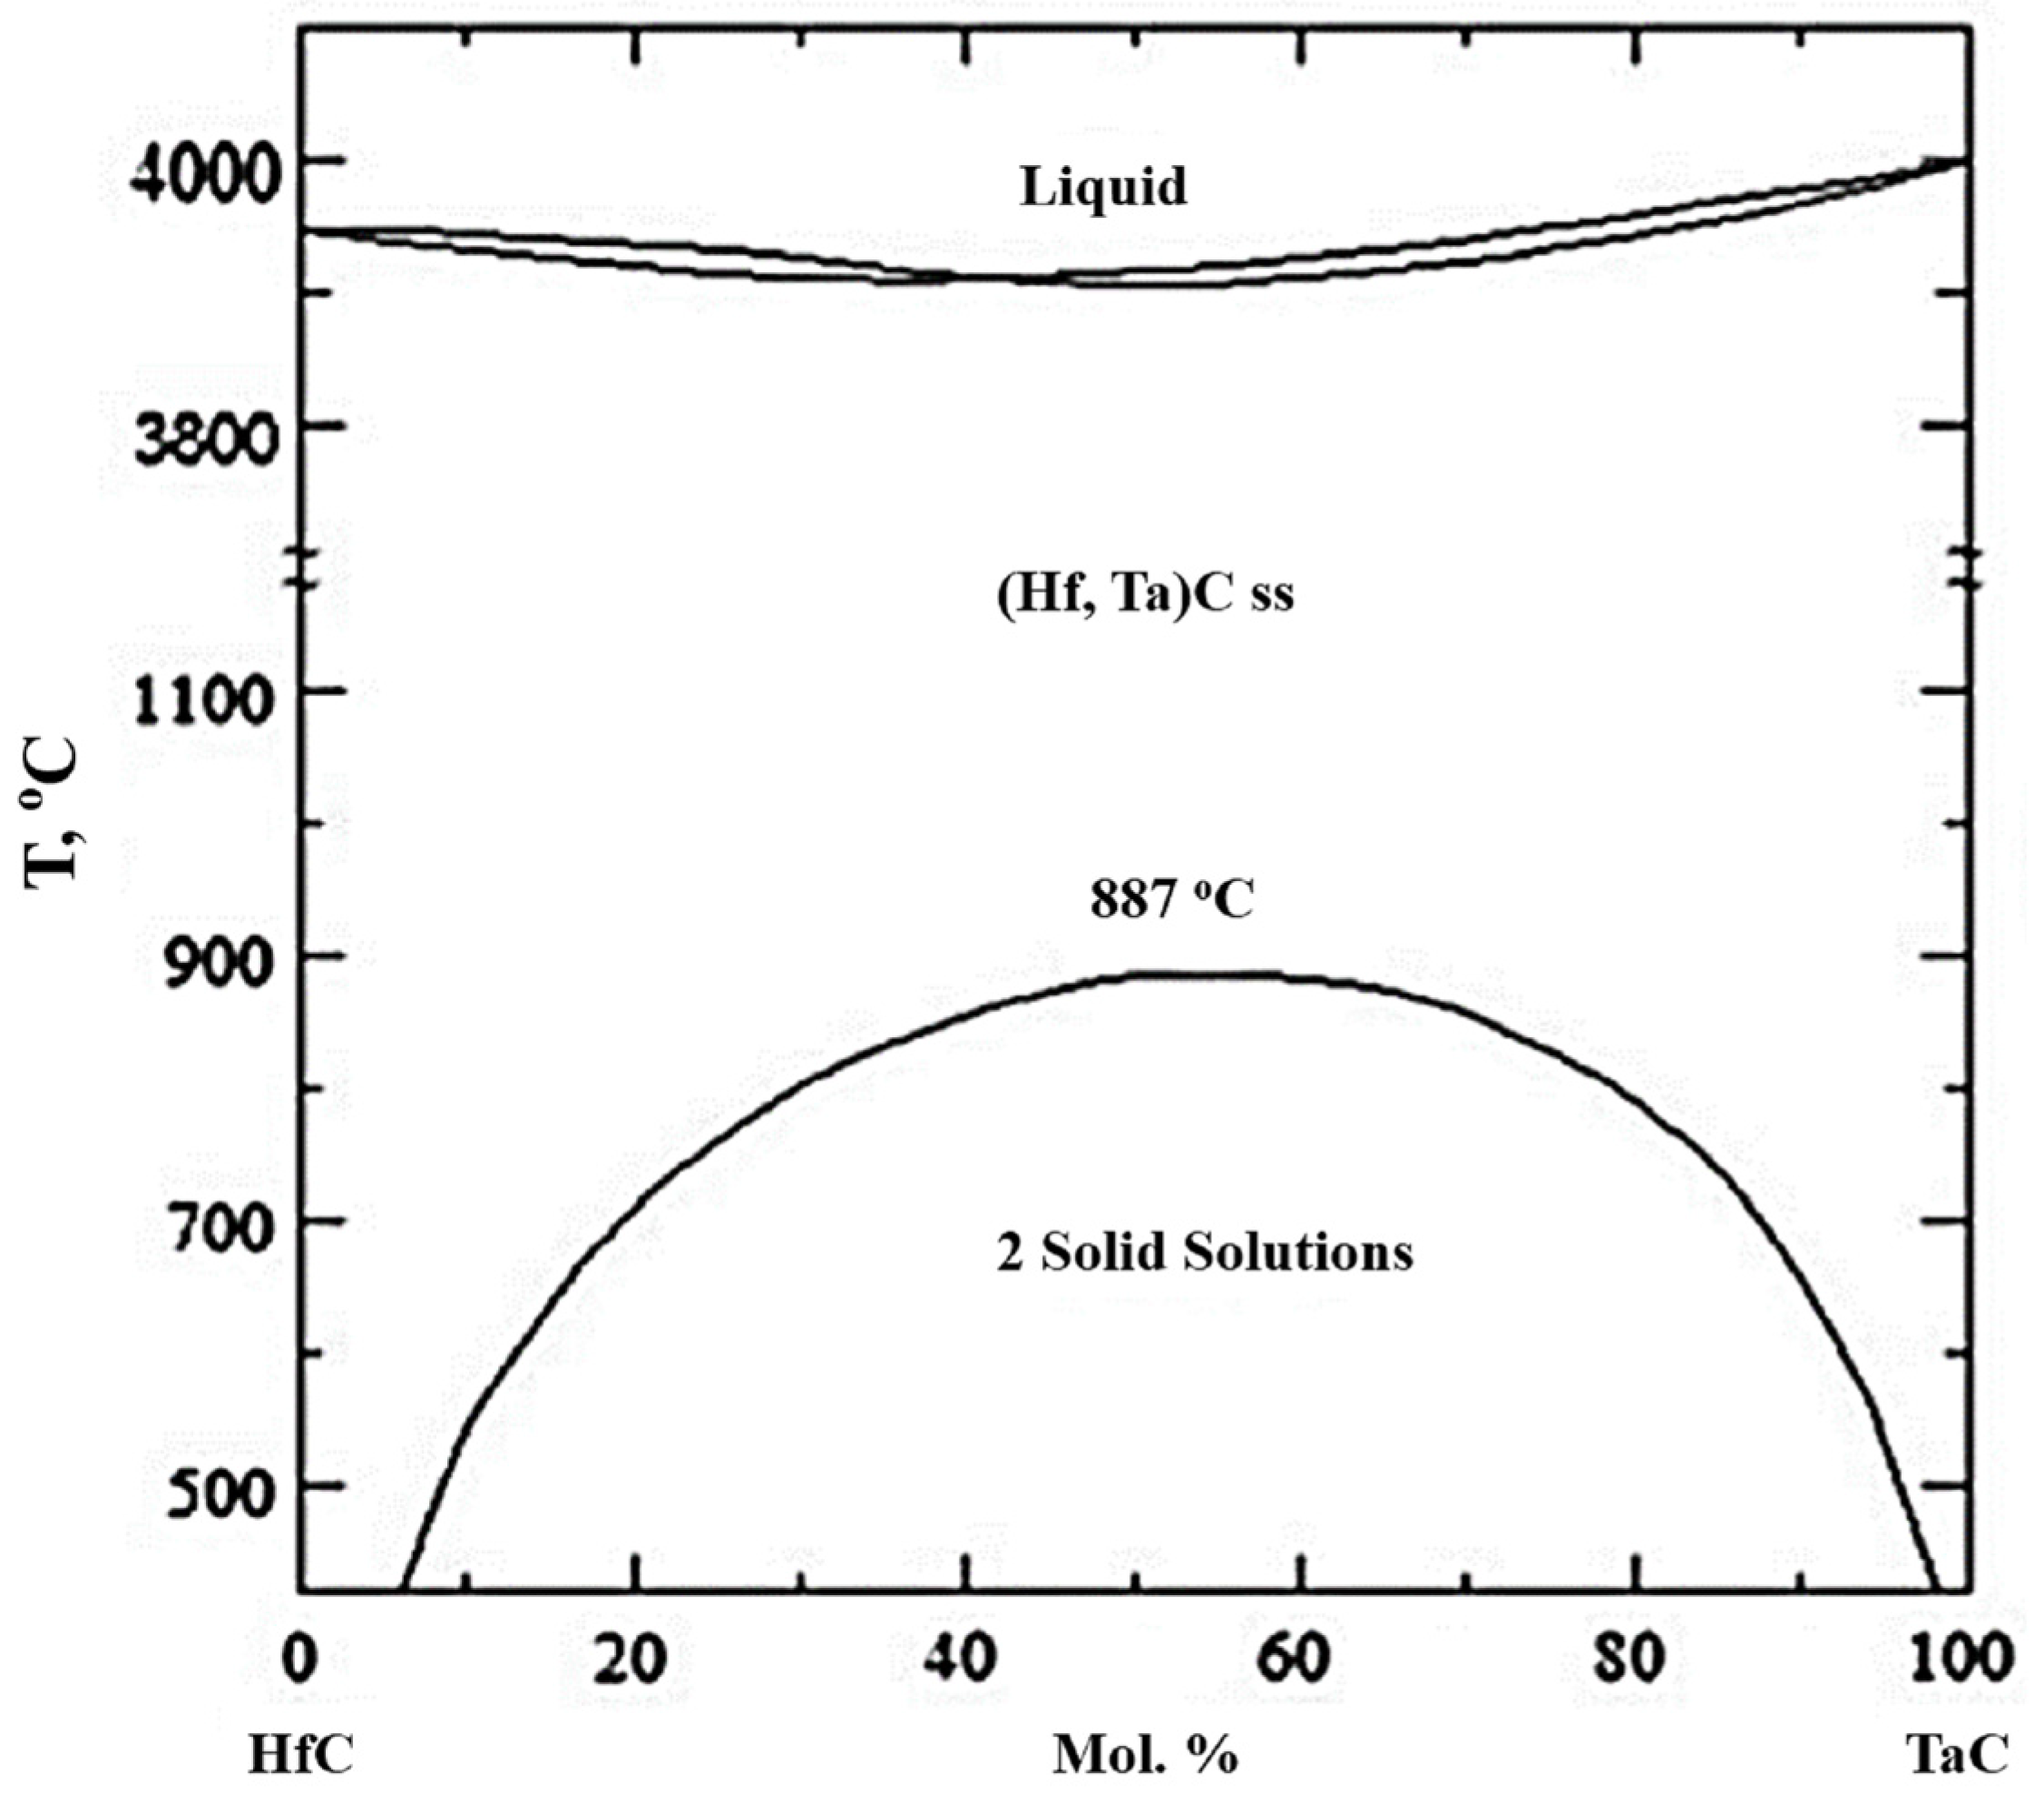
3.1. Microstructure and Phases in Sintered TaC, HfC, and TaC-HfC Solid Solutions

The detailed characterization results of the microstructures and phases formed in spark plasma-sintered TaC-HfC solid solutions were published in our previous paper [17]. For the reader’s convenience and the sake of completeness, a summary of the key results is listed in Table 1. All five samples had high densities varying between 97% and 99%. With the addition of HfC, the samples’ densification increases and the highest densification is found in T20H80 sample. The average grain size also decreased with the HfC additions. The lattice parameters of the formed solid solutions matched the theoretical values calculated according to Vegard’s Law. [17]

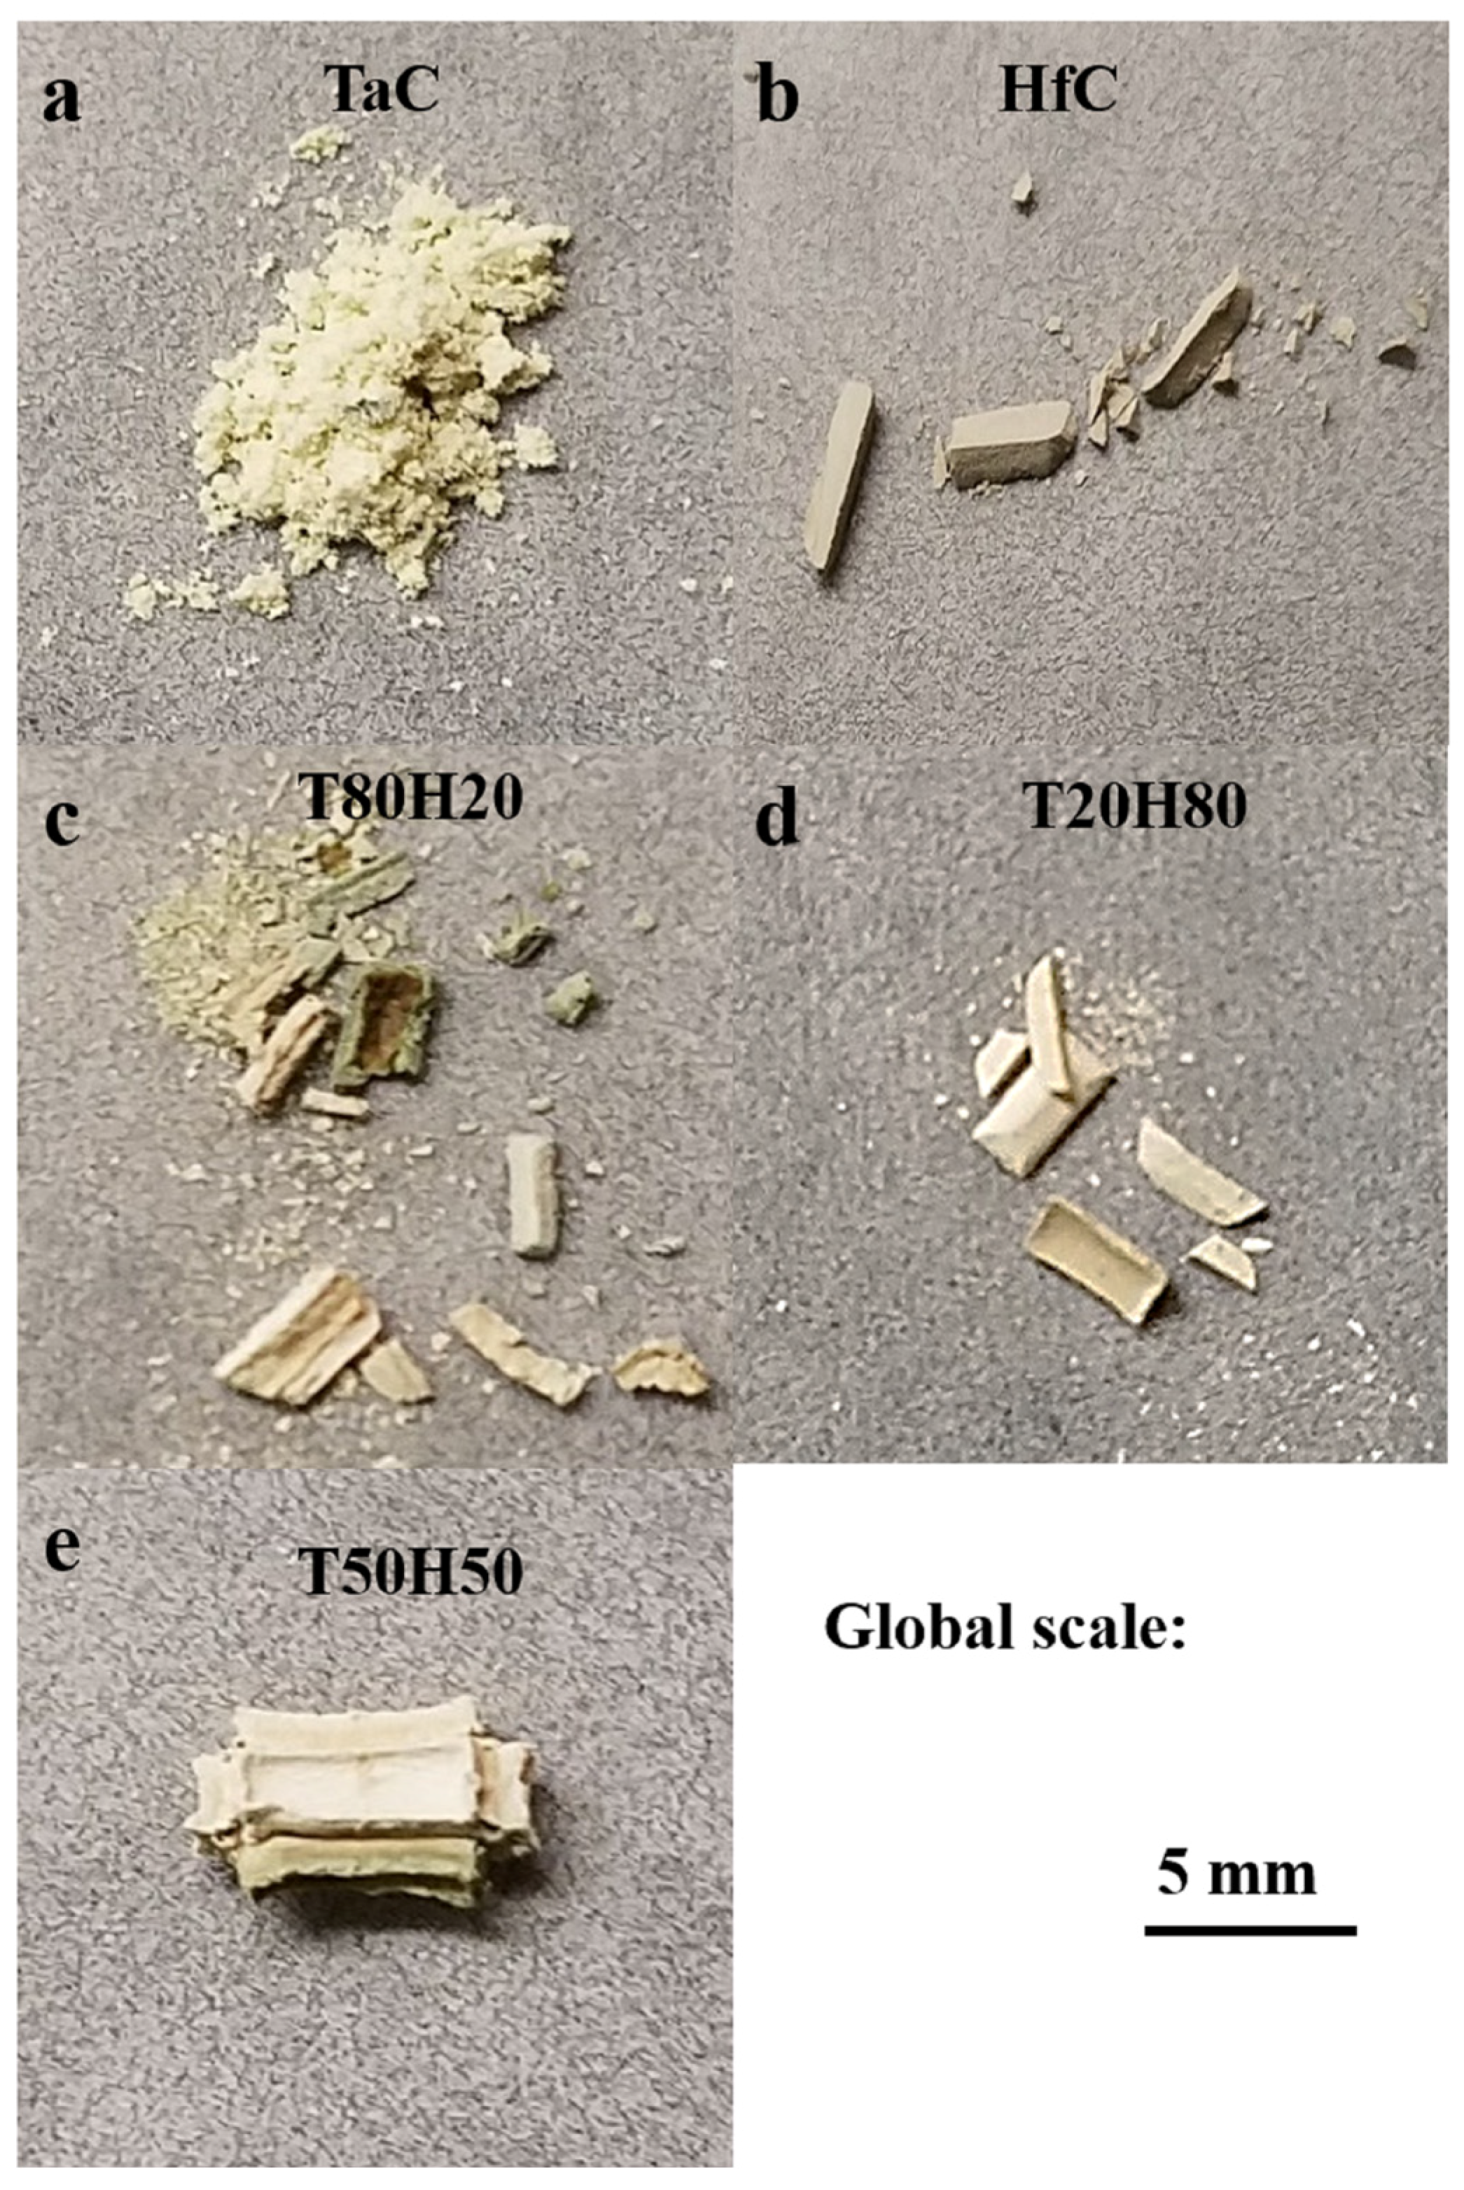
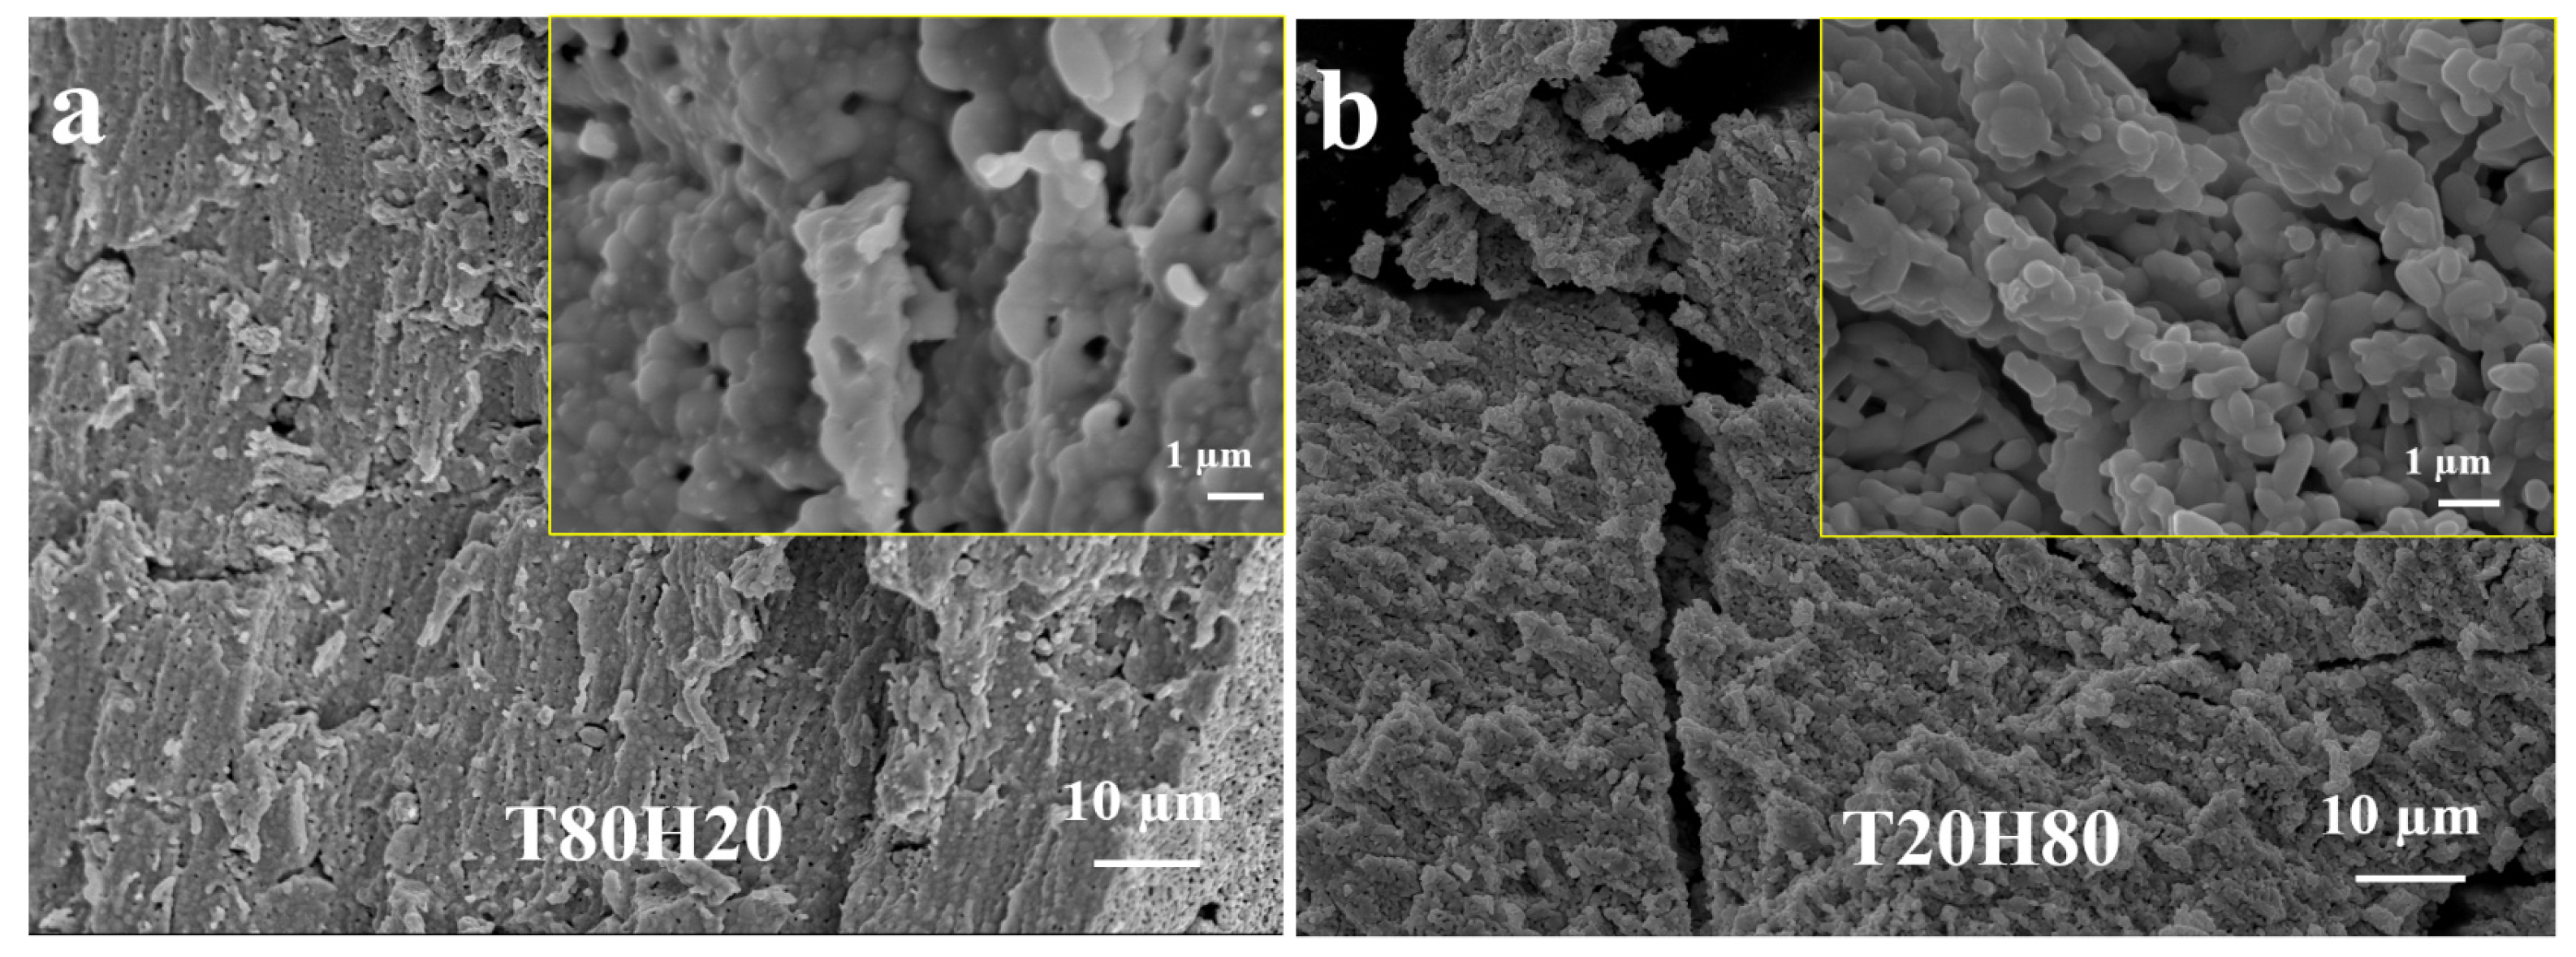
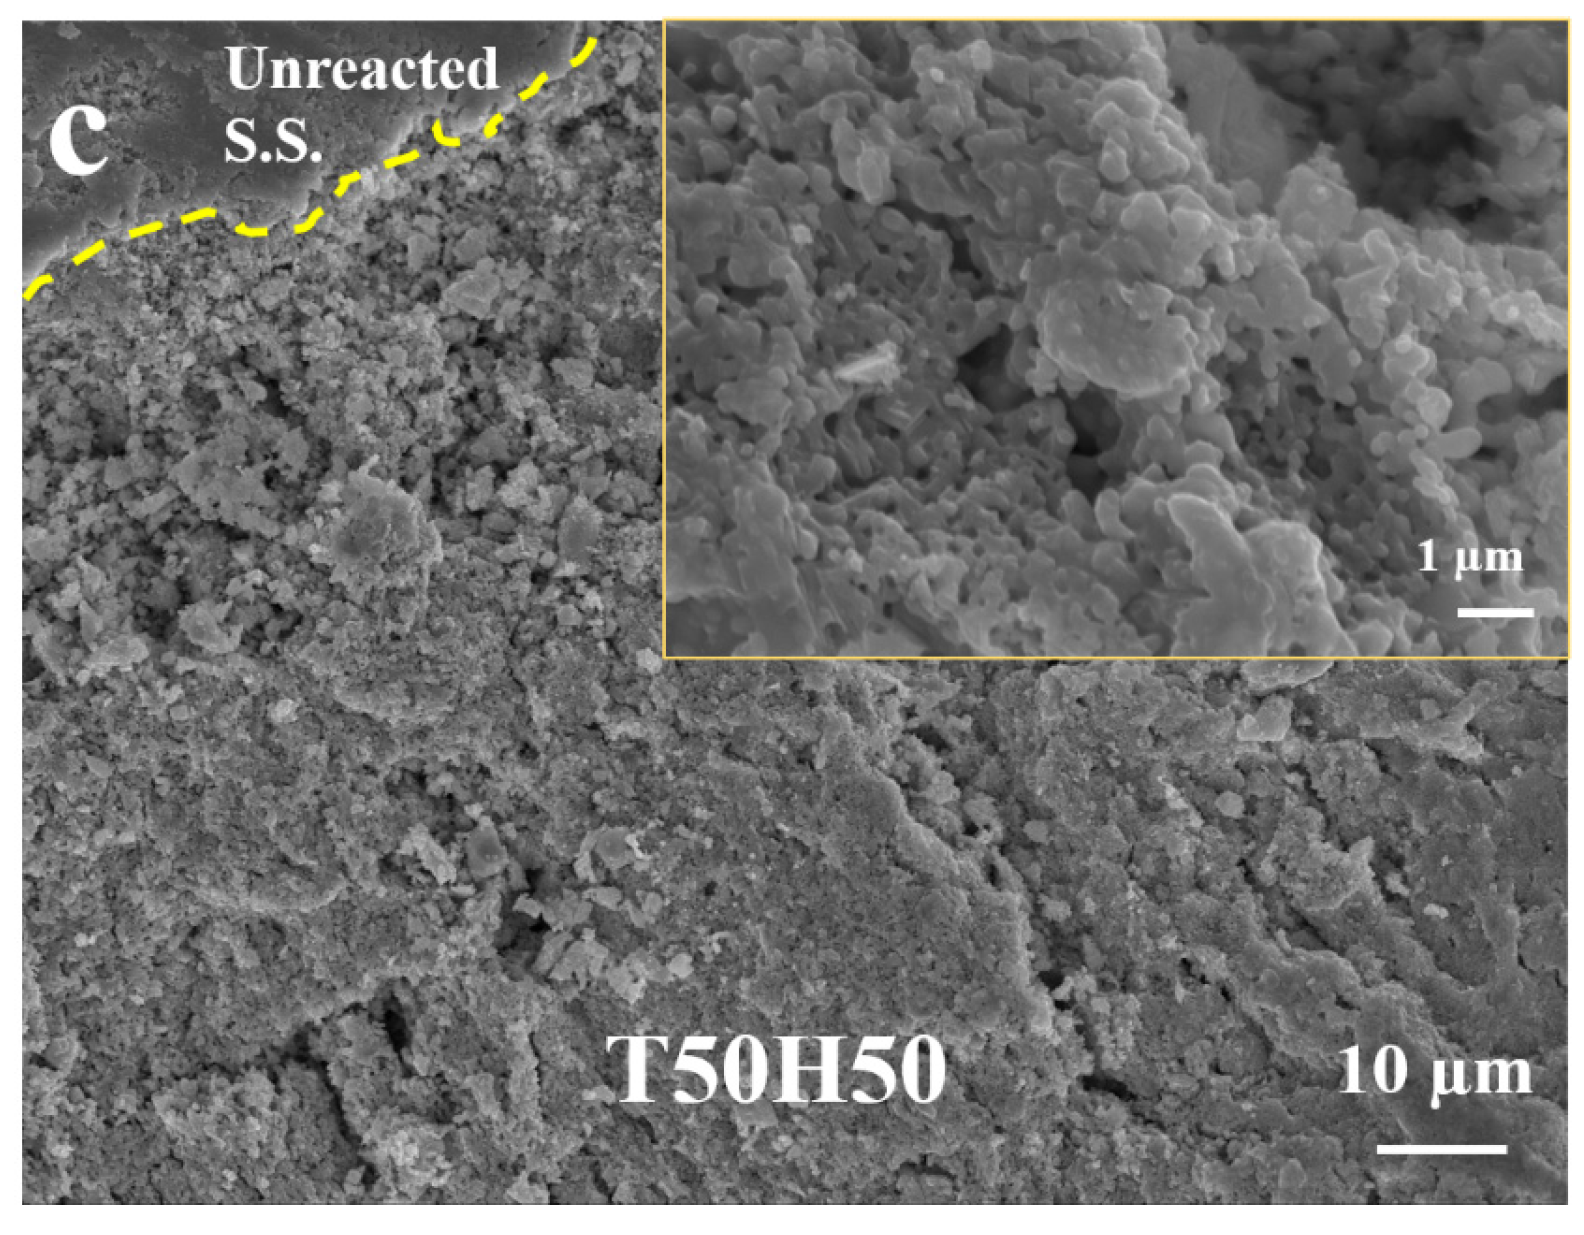
3.2. Macro State Morphology of Post-Oxidation TaC-HfC Solid Solutions

The overall qualitative oxidation resistance of TaC, HfC, and their solid solutions can be inferred by the morphology of the post-oxidation samples. Appearances of the post-oxidation samples from the TGA testing are shown in Figure 2. The pure TaC sample showed the worst oxidation resistance, as it turned into a powdery form with no mechanical integrity (Figure 2a). The oxidized pure HfC, on the other hand, displayed a much better oxidation resistance. Structural integrity can still be seen even though the oxidized sample broke into several pieces (Figure 2b). The post-oxidation samples’ appearances of T80H20 and T20H80 is the combination of oxidation morphology exhibited by pure TaC and HfC. In the oxidized T80H20 sample (Figure 2c), a large amount of powder is noticed with a few solid broken pieces. The appearance of the post-oxidation T20H80 (Figure 2d) is analogous to pure HfC with a small amount of powder. T50H50 is the only sample which does not show significant spallation and delamination. This suggests that outer layer oxide scale has good mechanical integrity and can protect the underlying carbide solid solution.

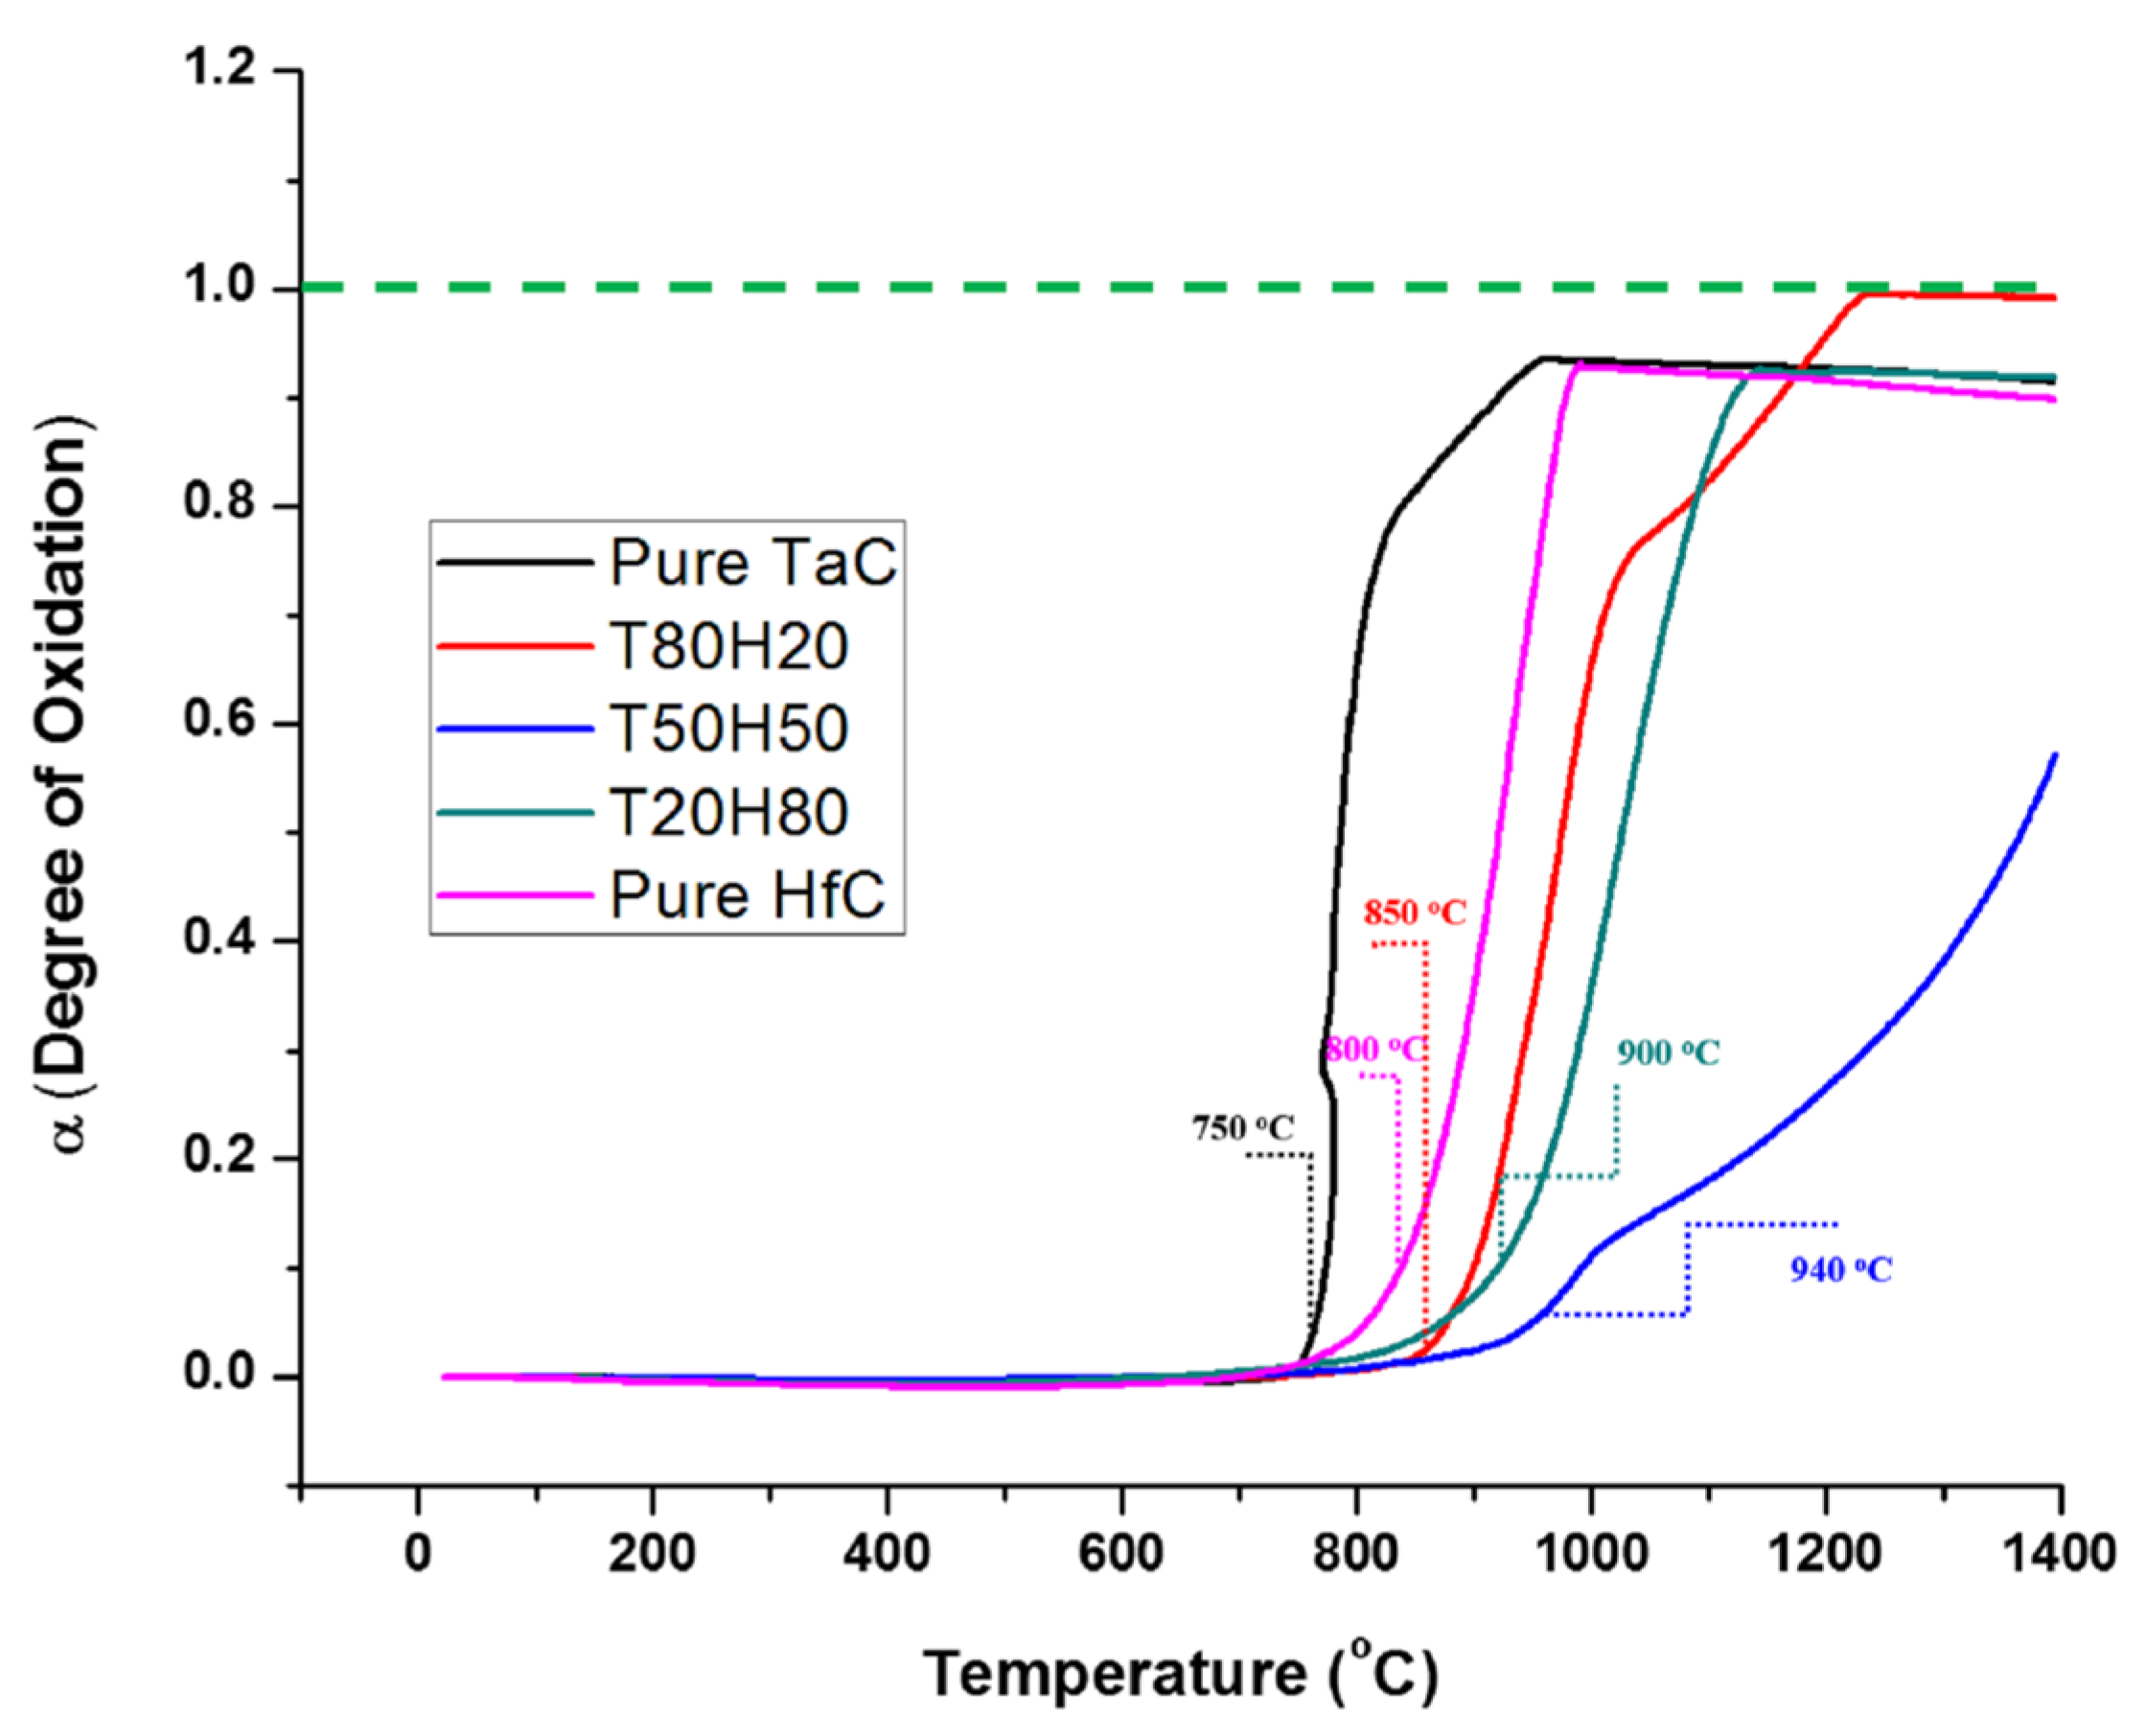
3.3. Mass Change during Thermogravimetric Analysis of Carbide Solid Solutions

The weight change curves of TaC-HfC solid solutions are presented in Figure 3 as the degree of oxidation (α) with the onset oxidation temperatures for five samples. The degree of oxidation (α) is defined as the ratio of the measured weight change over the theoretical weight change at 100% conversion. The degree of oxidation (α) is calculated by the following equation:
= Δ m Δ m = m i n s m i m t m i
where Δ m is the measured weight change, Δ m is the theoretical weight change, m i n s is the real-time measured weight, m i is the initial weight, and m t is the theoretical weight. The theoretical weight change is based on the below reactions:
2 TaC + 9 2 O 2 Ta 2 O 5 + 2 CO 2
HfC + O 2 HfO 2 + CO 2
The onset oxidation temperature is defined in Figure 3 when the degree of oxidation increases sharply. Pure TaC starts to oxidize around 750 °C, followed by pure HfC which starts around 800 °C. The solid solution samples showed improved oxidation resistance, as the oxidation processes have been delayed compared to the pure carbides, as shown in Figure 2. T80H20 began its oxidation process at 850 °C, and T20H80 started around 900 °C. Further delay was observed in T50H50, where the onset oxidation temperature was around 940 °C.
The oxidation process of pure TaC matches the literature description [19,20]. The degree of oxidation increases sharply around 750 °C and is completed near 950 °C. The transformation from TaC to Ta2O5 involves tremendous volume changes. According to the Pilling-Bedworth (PB) ratio theory, the PB ratio for Ta to Ta2O5 is 2.5 [21]. Such large volume mismatch leads to spallation and delamination. Without any anchoring structure, the resultant oxide will lose its mechanical integrity, and thus it cannot protect the underlying materials. Consequently, the final product mainly consists of fine powder, as shown in Figure 2a. One spike at 780 °C is observed in the TaC oxidation curve in Figure 3. The measured temperature dropped during the oxidation process. The morphology of the oxidation product suggests that the oxide would delaminate and expose unreacted TaC during oxidation. The unreacted TaC has a lower temperature than the surface of the delaminated oxide, so the measured temperature dropped.
Figure 3 shows that oxidation process of HfC starts at 800 °C. Comparing to the oxidation of pure TaC, the weight increases gradually instead of exhibiting a sharp increase, as evident from the slope. Such behavior is in accordance with the literature description of the oxidation behavior of HfC [12,22]. HfC has the ability to absorb oxygen without transforming into oxide. The dissolved oxygen sits on the carbon vacancies and forms an oxy-carbide layer. The formed HfO2, unlike Ta2O5, does not experience much volume change from the HfC. The PB ratio is only 1.7 [21], which explains the mechanically stable morphology of HfO2 in Figure 2b.
The morphologies of the oxidized TaC and HfC are studied by SEM and shown in Figure 4. The grain size of oxidized TaC is larger than oxidized HfC. Distinct grains can be spotted in the oxidized HfC sample, but the surface of oxidized TaC is relatively smooth with coalesced grains due to localized sintering. Conventionally, sintering occurs at 0.6 Tm (where Tm is the melting point). The melting point (Tm) of Ta2O5 is 1872 °C; hence, the sintering of Ta2O5 will start around 1250 °C. No sintering is expected in HfO2, as its melting point is around 2800 °C [5]. The pores in the oxidized HfC are from the formation of a gaseous product during oxidation.
Although the post-oxidation samples of T80H20 and T20H80 do not have sufficient mechanical integrity to protect the underlying materials (Figure 2c,d), these two solid solutions showed improved oxidation resistance by delaying the onset of oxidation temperature, as shown in Figure 3. The oxidation onset temperatures of T80H20 and T20H80 are 850 and 900 °C, respectively, which is significantly delayed as compared to pure TaC and HfC. However, both T80H20 and T20H80 still reached near 100% oxidation. The T50H50 solid solution displayed the best oxidation resistance. Not only did the onset temperature for oxidation increase to near 940 °C for the T50H50 samples, only 60% of the oxidation was completed when the temperature reached 1400 °C.
To further understand the mechanism of improved oxidation resistance in the solid solution samples, especially in the T50H50 sample, the morphologies of the post-oxidation samples of the solid solutions are investigated by SEM and presented in Figure 5. As described earlier, the oxide morphologies of pure TaC and HfC (Figure 4) are highly porous due to gaseous products resulting in prominent volume change. The key factor in improving the oxidation resistance of the TaC-HfC solid solutions is to suppress the formation of the Ta2O5 phase. In Figure 5a, the main post-oxidation product has large elongated grains as compared to the grains in Figure 5b,c. The inset shows the top view of the elongated grains where grains look more equiaxial. The grain enlargement is caused by the dramatic volume change associated with the formation of Ta2O5 and the very high Pilling-Bedworth ratio of 2.5. Additionally, TaC has a cubic crystal structure, whereas Ta2O5 has an orthorhombic crystal structure. The transformation from cubic to orthorhombic leads to elongation in one direction, which is also the reason why Ta2O5 has large grain size. Larger grain size is also possible due to grain growth because of the earlier onset of oxidation in the T80H20 sample as compared to the other two solid solutions. In the oxidation of the TaC-HfC solid solutions, especially in the T80H20 sample, the formed Ta2O5 can react with the unreacted HfC. The reaction (Reaction (3)) replaces the Ta2O5 with HfO2, so the volume change during the oxidation process is reduced.
The consumption of Ta2O5 reduced the volume change and increased the mechanical integrity of the post-oxidation samples in solid solutions.
3 Ta 2 O 5 + 7 HfC 7 HfO 2 + 6 TaC + CO ( Δ G   ( kJ ) = 0.14 T 759.76    T :   500 2000   ° C )   [ 17 ]
The oxidation behavior of T20H80 is similar to that of pure HfC, as shown in Figure 5b. Another beneficial effect of reaction 3 is the delay of the formation of gaseous products in the early oxidation stage. Reaction 2 shows that one mole of HfC would react with one mole of oxygen to form one mole of gaseous products (CO or CO2). However, in reaction 3, Ta2O5 would consume seven moles of HfC to generate one mole of gaseous product, so the gases produced by HfC can be reduced or at least delayed. The Gibbs free energy for reaction 3 is computed using Factsage [17]. The delay of the gaseous product diminishes the cracking within the oxides and enhances the mechanical integrity of the oxide scales in solid solutions. The well-adhered oxide scale can serve as a protection layer against the further oxidation of solid solutions. The morphology of the post-oxidation sample of T50H50 is a vivid proof of this concept, as shown in Figure 5c. The oxide scale of the oxidized T50H50 solid solution is much denser as compared to the other samples. The oxide grains are mostly equiaxed, suggesting the moderate volume increase. No large cracks are noticeable in the oxidized T50H50 sample. Thus, the T50H50 solid solution shows the best oxidation resistance among all the solid solutions.
It must be noted that oxidation onset temperature for T50H50 is 940 °C. The onset temperature reveals the interaction between the carbides and oxygen. The study of the absorption of oxygen on TaC and HfC (001) planes suggests that the oxygen tends to sit on the Hf–C bridge [23]. In the case of TaC, the preferential oxygen site was on the Ta–Ta bridge. After forming a solid solution, the Ta atoms are partially replaced by Hf atoms, so the availability of Ta–Ta is disturbed, and the oxidation of the Hf element remains unaffected. Thus, the formation of Ta2O5 is retarded. As discussed earlier, the formation of Ta2O5 is detrimental to oxidation performance, so the solid solutions are expected to have superior oxidation resistances. Among the five samples, abrupt weight increase is observed only in the pure TaC sample. The weight change in the HfC-contained samples increases steadily, which corresponds to the adsorption of oxygen, a unique feature of HfC. The solid solutions should have an abrupt weight increase at a lower temperature similar to pure TaC if the oxidation of TaC has not been retarded. The maximum delay in the onset of oxidation is found in the T50H50 sample, which is expected as the Ta–Ta bridges have been disturbed the most by forming solid solutions.

4. Conclusions

Through TGA analyses, we investigated the oxidation behavior of pure TaC and HfC as well as their solid solutions. The solid solutions exhibit improved oxidation resistance compared to the pure carbides. T50H50 is found to have the best oxidation resistance, followed by T20H80 and T80H20. The onset of oxidation in T50H50 increases by 170 and 120 °C as compared to pure TaC and pure HfC, respectively. The improved oxidation resistance can be attributed to the formation of the solid solutions that disturbs the atomic arrangement. Such disturbance delays the formation of Ta2O5 and does not affect the formation of HfO2. The reaction between Ta2O5 and HfC is also responsible for the superior oxidation performances in the solid solution samples. It diminishes the generation of gaseous products during oxidation, which reduces the porosity of the oxide scales and leads to the better protection of the underlying materials. The present study showcases SPS-sintered solid solutions as a new class of oxidation-resistant materials within ultrahigh temperature ceramics (UHTCs).

Acknowledgments

Cheng Zhang thanks the Florida International University Graduate School for the Dissertation Year Fellowship (DYF) award. Advanced Materials Engineering Research Institute (AMERI), FIU is acknowledged for the research facilities used and the support from its staff in this study.

Author Contributions

Benjamin Boesl and Arvind Agarwal conceived and designed experiments; Archana Loganathan performed the experiments; Cheng Zhang, Archana Loganathan, Benjamin Boesl and Arvind Agarwal analyzed data; Cheng Zhang wrote the paper.

Conflicts of Interest

The authors declare no conflict of interest.

References

  1. Fahrenholtz, W.G.; Wuchina, E.J.; Lee, W.E.; Zhou, Y. Ultra-High Temperature Ceramics: Materials for Extreme Environment Applications; John Wiley & Sons, Inc.: Hoboken, NJ, USA, 2014. [Google Scholar]
  2. Louis, L.E. Transition Metal Carbides and Nitrides; Academic Press: New York, NY, USA, 1971. [Google Scholar]
  3. Upadhya, K.; Yang, J.; Hoffman, W.P. Materials for Ultrahigh Temperature Structural Applications. Am. Ceram. Soc. Bull. 1997, 76, 51–56. [Google Scholar]
  4. Pierson, H.O. Handbook of Refractory Carbides and Nitrides; William Andrew Publishing: Westwood, NJ, USA, 1996. [Google Scholar]
  5. Opeka, M.M.; Talmy, I.G.; Zaykoski, J.A. Oxidation-based Materials Selection for 2000 °C + Hypersonic Aerosurfaces: Theoretical Considerations and Historical Experience. J. Mater. Sci. 2004, 39, 5887–5904. [Google Scholar] [CrossRef]
  6. Simonenko, E.P.; Sevast’yanov, D.V.; Simonenko, N.P.; Sevast’yanov, V.G.; Kuznetsov, N.T. Promising Ultra-high Temperature Ceramic Materials for Aerospace Applications. Russ. J. Inorg. Chem. 2013, 58, 1669–1693. [Google Scholar] [CrossRef]
  7. Gary, S.P.; Krishnamurthy, N.; Awasthi, A.; Venkatraman, M. The O-Ta (Oxygen-Tantalum) System. J. Phase Equilib. 1996, 17, 63–77. [Google Scholar]
  8. Fahrenholtz, W.G.; Hilmas, G.E. Oxidation of Ultra-high Temperature Transition Metal Diboride Ceramics. Int. Mater. Rev. 2012, 57, 61–72. [Google Scholar] [CrossRef]
  9. Gasch, M.; Ellerby, D.; Irby, E.; Beckman, S.; Gusman, M.; Johnson, S. Processing, Properties and Arc Jet Oxidation of Hafnium Diboride/Silicon Carbide Ultra High Temperature Ceramics. J. Mater. Sci. 2004, 39, 5925–5937. [Google Scholar] [CrossRef]
  10. Agte, C.; Alterhum, H. Investigations of the High-Melting Carbide Systems Connected with Problem of the Carbon Melting. Z. Technol. Phyzik 1930, 11, 182–191. [Google Scholar]
  11. Coutright, E.L.; Prater, J.T.; Holcomb, G.R.; Stpierre, G.R.; Rapp, R.A. Oxidation of Hafnium Carbide and Hafnium Carbide with Additions of Tantalum and Praseodymium. Oxid. Met. 1991, 36, 423–437. [Google Scholar] [CrossRef]
  12. Ghaffari, S.A.; Faghihi-Sani, M.A.; Golestani-Fard, F.; Ebrahimi, S. Pressureless Sintering of Ta0.8Hf0.2C UHTC in the Presence of MoSi2. Ceram. Int. 2013, 39, 1985–1989. [Google Scholar] [CrossRef]
  13. Patterson, M.C.L. Advanced HfC-TaC Oxidation Resistance Composite Rocket Thruster. Mater. Manuf. Process. 1996, 11, 367–379. [Google Scholar] [CrossRef]
  14. Rudy, E. Ternary Phase Equilibria in Transition Metal-Boron-Carbon-Silicon System. Part II. Ternary Systems, Vol I. Ta-HfC-C System; Technical Report: AFML-TR-65-2 Part II Vol. 1; Wright-Patterson Air Force Base, Air Force Systems Command, Air Force Materials Laboratory: Dayton, OH, USA, 1969. [Google Scholar]
  15. Ghaffari, S.A.; Faghihi-Sani, M.A.; Golestani-Fard, F.; Nojabayy, M. Diffusion and Solid Solution Formation Between the Binary Carbides of TaC, HfC, ZrC. Int. J. Refract. Met. Hard Mater. 2013, 41, 180–184. [Google Scholar] [CrossRef]
  16. Cedillos-Barraza, O.; Grasso, S.; Nasiri, N.A.; Jayaseelan, D.D.; Reece, M.J.; Lee, W.E. Sintering Behavior, Solid Solution Formation and Characterization of TaC, HfC and TaC-HfC Fabricated by Spark Plasma Sintering. J. Eur. Ceram. Soc. 2016, 36, 1539–1548. [Google Scholar] [CrossRef]
  17. Zhang, C.; Gupta, A.; Seal, S.; Boesl, B.; Agarwal, A. Solid Solution Synthesis of Tantalum Carbide-Hafnium Carbide by Spark Plasma Sintering. J. Am. Ceram. Soc. 2017, 100, 1773–2308. [Google Scholar] [CrossRef]
  18. Zhang, C. High Temperature Oxidation Study of Tantalum Carbide-Hafnium Carbide Solid Solutions Synthesized By Spark Plasma Sintering. Ph.D. Thesis, Florida International University, Miami, FL, USA, 18 October 2016. [Google Scholar]
  19. Desmaison-Brut, M.; Alexandre, N.; Desmaison, J. Comparison of the Oxidation Behavior of Two Dense Hot Isostatically Pressed Tantalum Carbide (TaC and Ta2C) Materials. J. Eur. Ceram. Soc. 1997, 17, 1325–1334. [Google Scholar] [CrossRef]
  20. Zhang, X.; Hilmas, G.E.; Fahrenholtz, W.G. Densification, Mehcanical Properties, and Oxidation Reistance of TaC-TaB2 Creamics. J. Am. Ceram. Soc. 2008, 91, 4129–4132. [Google Scholar]
  21. Cramer, S.D.; Covino, B.S., Jr. ASM Handbook Volume 13A: Corrosion: Fundamentals, Testing, and Protection; ASM International: Geauga County, OH, USA, 2013. [Google Scholar]
  22. Bargeron, C.B.; Benson, R.C.; Jette, A.N.; Phillips, T.E. Oxidation of Hafnium Carbide in the Temperature Range 1400° to 2060 °C. J. Am. Ceram. Soc. 1993, 76, 1040–1046. [Google Scholar] [CrossRef]
  23. Liu, D.; Deng, J.; Jin, Y.; He, C. Adsorption of Atomic Oxygen on HfC and TaC (110) Surface From Firtst Principles. Appl. Surf. Sci. 2012, 261, 214–218. [Google Scholar] [CrossRef]
Figure 1. Phase diagram of TaC and HfC [15]. Copyright 2013 Elsevier.
Coatings 07 00111 g001
Figure 2. Post-oxidation samples: (a) Pure TaC; (b) Pure HfC; (c) T80H20; (d) T20H80; and (e) T50H50.
Coatings 07 00111 g002
Figure 3. TG curve of TaC, HfC, and TaC-HfC solid solutions.
Coatings 07 00111 g003
Figure 4. Post-oxidation SEM images of (a) pure TaC and (b) pure HfC.
Coatings 07 00111 g004
Figure 5. Post-oxidation SEM images of (a) T80H20 (inset showing the top view of the elongated grains); (b) T20H80; and (c) T50H50. (Insets are high magnification images).
Coatings 07 00111 g005aCoatings 07 00111 g005b
Table 1. Basic characterizations of the TaC, HfC, and TaC-HfC solid solutions.
NamePellet Density (×103 kg/m3)Densification (%)Average Grain Size (µm)
Pure TaC14.1496.76.8 ± 1.4
T80H2013.8597.86.2 ± 2.1
T50H5013.2698.23.8 ± 1.2
T20H8012.6898.83.1 ± 1.1
Pure HfC12.2198.52.3 ± 0.7

