1. Introduction
The use of metal alloys in dental practice has evolved considerably in recent decades, especially in the field of prosthetics, where durability, biocompatibility, and structural stability are essential for the clinical success of restorations. AISI 420 martensitic stainless steel is one of the options used to make prosthetic keys due to its mechanical properties, such as high hardness, abrasion resistance, and the ability to maintain fine dimensional tolerances [
1]. However, in the complex and variable oral environment, this material is subject to electrochemical degradation processes that can affect the functionality and lifespan of prosthetic components [
2].
The oral environment is a dynamic system characterised by pH variations, the presence of aggressive ions such as chlorides, temperature fluctuations, and continuous interaction with the bacterial biofilm [
3]. All these factors can influence the formation, stability, and regeneration of the passive film on the surface of stainless steel. The literature indicates that AISI 420, although capable of forming a passive layer, is still susceptible to pitting corrosion, stress cracking, and accelerated degradation under simulated oral conditions [
4]. In particular, its martensitic composition and relatively low chromium content compared to austenitic stainless steels may limit the material’s performance in long-term dental applications.
A central topic of discussion in the recent literature is the influence of heat treatment on the corrosion behaviour of martensitic stainless steels used in dentistry [
5]. Processes such as quenching, tempering, normalisation, and cryogenic treatment modify the phase balance, carbide distribution, and internal stress state, thereby directly influencing the corrosion resistance of the material [
6]. Studies have shown that controlled tempering can generate a more stable microstructure, reducing the risk of local anodic regions, whereas insufficiently optimised quenching can promote the formation of heterogeneous microstructures, with adverse consequences for electrochemical stability [
7].
In addition to microstructure, the literature also highlights the importance of surface properties, such as material roughness and topography [
8]. Rough surfaces are more susceptible to biofilm accumulation and can facilitate the initiation of localised etching, leading to pitting corrosion. This phenomenon is particularly relevant in dental practice, where prosthetic keys are repeatedly subjected to mechanical and chemical cycles that can alter the surface finish [
9,
10].
The interaction between metal alloys and substances used in oral hygiene has become a major topic of interest in contemporary research. Exposure to fluorinated solutions, oxidising agents, or disinfectants used in clinical practice can accelerate degradation of the passive film on AISI 420. These changes can have direct consequences for the mechanical performance of prosthetic keys, affecting both the retention of the device and its biocompatibility through the release of metal ions [
11].
In a clinical context, the electrochemical degradation of prosthetic keys is not only a structural problem but can also have implications for oral health, patient comfort, and the lifespan of prosthetic restorations. Studies have emphasised the importance of correlating laboratory electrochemical analyses with long-term clinical data to better understand how corrosion affects the performance of metal restorations [
12].
Current research indicates that assessing the corrosion behaviour of AISI 420 requires a complex, multidimensional approach, including studies of microstructure, surface properties, the influence of heat treatments, interaction with the oral environment, and behaviour under actual clinical conditions [
13,
14]. Such an integrated assessment is essential for optimising prosthetic applications and developing clinical and technological procedures that minimise the risks associated with corrosion [
15].
In the medical field, it is important to prevent all forms of corrosion caused by chemical, electrochemical, or biological factors. Corrosion products are harmful to the human body and are strictly prohibited in this industry. Accordingly, the production of metallic materials with exceptional chemical stability, such as stainless steel, gold alloy, platinum, and titanium, is widespread.
In the manufacture of medical instruments, it is essential to consider multiple criteria, such as resistance to high or low temperatures, resistance to high or low pressures, hardness, machinability, and biocompatibility.
Currently, there is a variety of medical instruments available, some made from metallic materials and others from plastic, textiles, and even wood. These alternative materials cannot be sterilised and are intended for single use. The materials most commonly used in the manufacture of medical equipment and instruments are martensitic, ferritic, and austenitic stainless steels. For example, surgical instruments used for cutting and striking are made of martensitic stainless steels alloyed with Cr, Mo-Cr, and V-Mo-Cr. Syringe needles, on the other hand, are made of austenitic stainless steels alloyed with Ni-Cr and Ni-Cr-Mo. Clamps, probes, tweezers, and spatulas are usually made of ferritic steels alloyed with Cr, Al-Cr, and Ti-Cr [
1].
Martensitic steels are characterised by a chromium content ranging from 12% to 17% and a carbon content exceeding 0.1% or, in some cases, 0.4%–0.5% or even 1% in rare cases.
Silicon is added to increase their resistance to high-temperature oxidation, and they are alloyed with nickel (2%–4%) to improve toughness.
Martensitic stainless steels are classified according to their carbon, chromium, and other element content and are also characterised by their specific hardness values [
6].
This paper aims to understand the causes of corrosion on the studied components, namely prosthetic keys made of AISI 420 martensitic stainless steel. This type of steel is commonly used in dental practice due to its high mechanical strength, good machinability, and low cost compared to noble alloys [
16,
17].
However, martensitic stainless steels feature lower corrosion resistance than austenitic ones, especially when their surfaces are affected by inclusions, residual stresses, or ferric contamination introduced during the machining process [
8]. Along with the process flow of key manufacturing, one of the critical stages is the washing and passivation of parts after mechanical processing [
18]. In the analysed case, pitting corrosion was observed on some parts, a phenomenon that may be promoted by metal residues, inadequate passivation, or contaminated washing water [
7,
11].
To avoid this undesirable effect, an experimental laboratory study was conducted to identify the factors responsible for initiating the corrosion process and to propose technological measures for its prevention.
2. Materials and Methods
The material used in this study was EN 1.4021 (AISI 420) martensitic stainless steel (Metal Inox SRL, Bucharest, Romania).
Martensitic stainless steels have a lower and more competitive price, as well as higher mechanical strength, than other stainless steels.
Their tensile strength ranges from 275 MPa in the annealed state to 1900 MPa in the quenched and tempered state. AISI 420 contains 0.16% min. C and 12%–14% Cr; thus, the carbon content and strength of this steel are greater than those of AISI 410. AISI 420 is used for cutlery, corrosion-resistant plastic molds, structural parts, dental and surgical instruments, and vehicle braking systems. Recently, these steels have also been used in the mining sector for wear-resistant parts.
The chemical composition was compared to the standardised composition specified in SR EN 10088-1:2005 [
19].
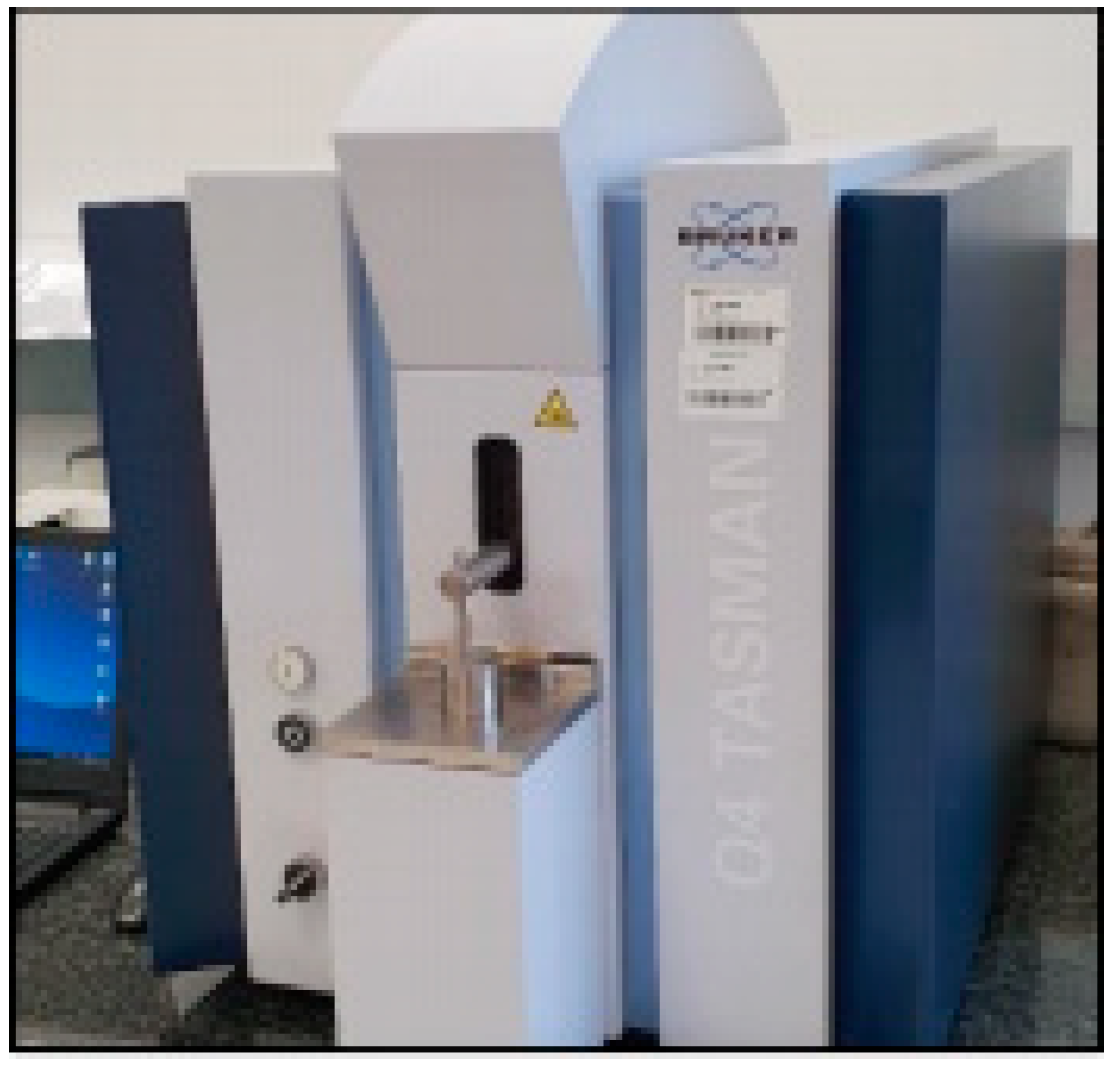
The equipment used to determine the chemical composition was the Q4 TASMAN spectrometer Q4 TASMAN Optical Emission Spectrometer (Bruker AXS GmbH, Karlsruhe, Germany). (
Figure 1), designed to investigate metallographic samples in order to identify and quantify the chemical elements present in the samples. The spectrometer was connected to an argon cylinder, which was required to drive the rod and to purge/clean the combustion chamber, where the electric arc is generated.
In order to determine the chemical composition, the samples were polished on a machine using abrasive paper to prepare their surfaces. The samples must have a rough surface in order to analyse the chemical composition. The sample was fastened to the work table using the rod.
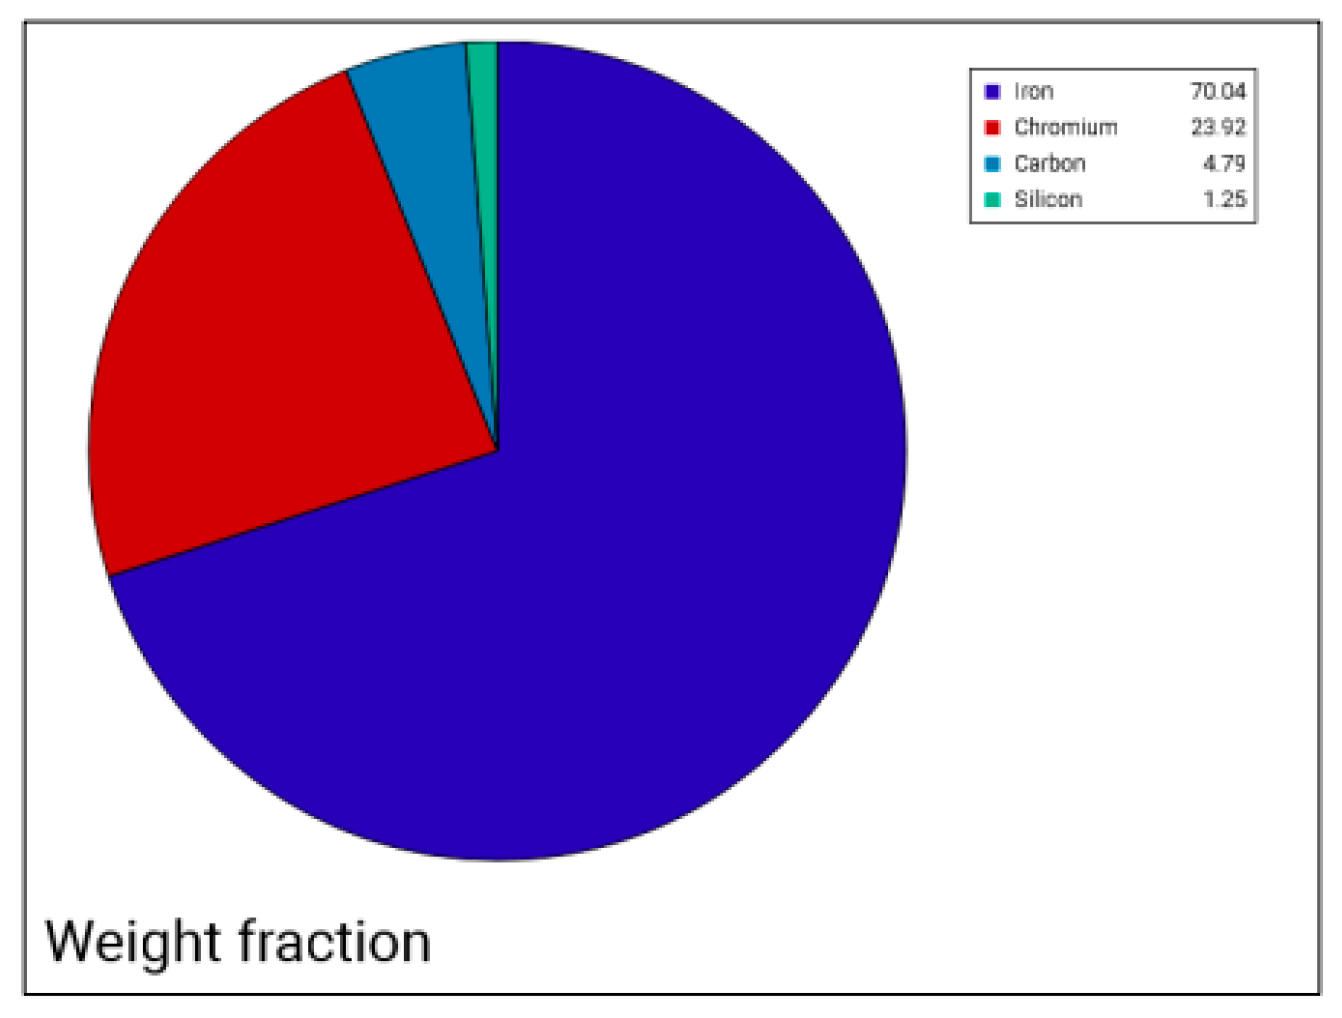
Table 1 presents the chemical composition of the AISI 420 steel used in this research.
This 1.4021 steel is used to make dental and surgical instruments, vehicle braking systems, cutlery, etc. [
6].
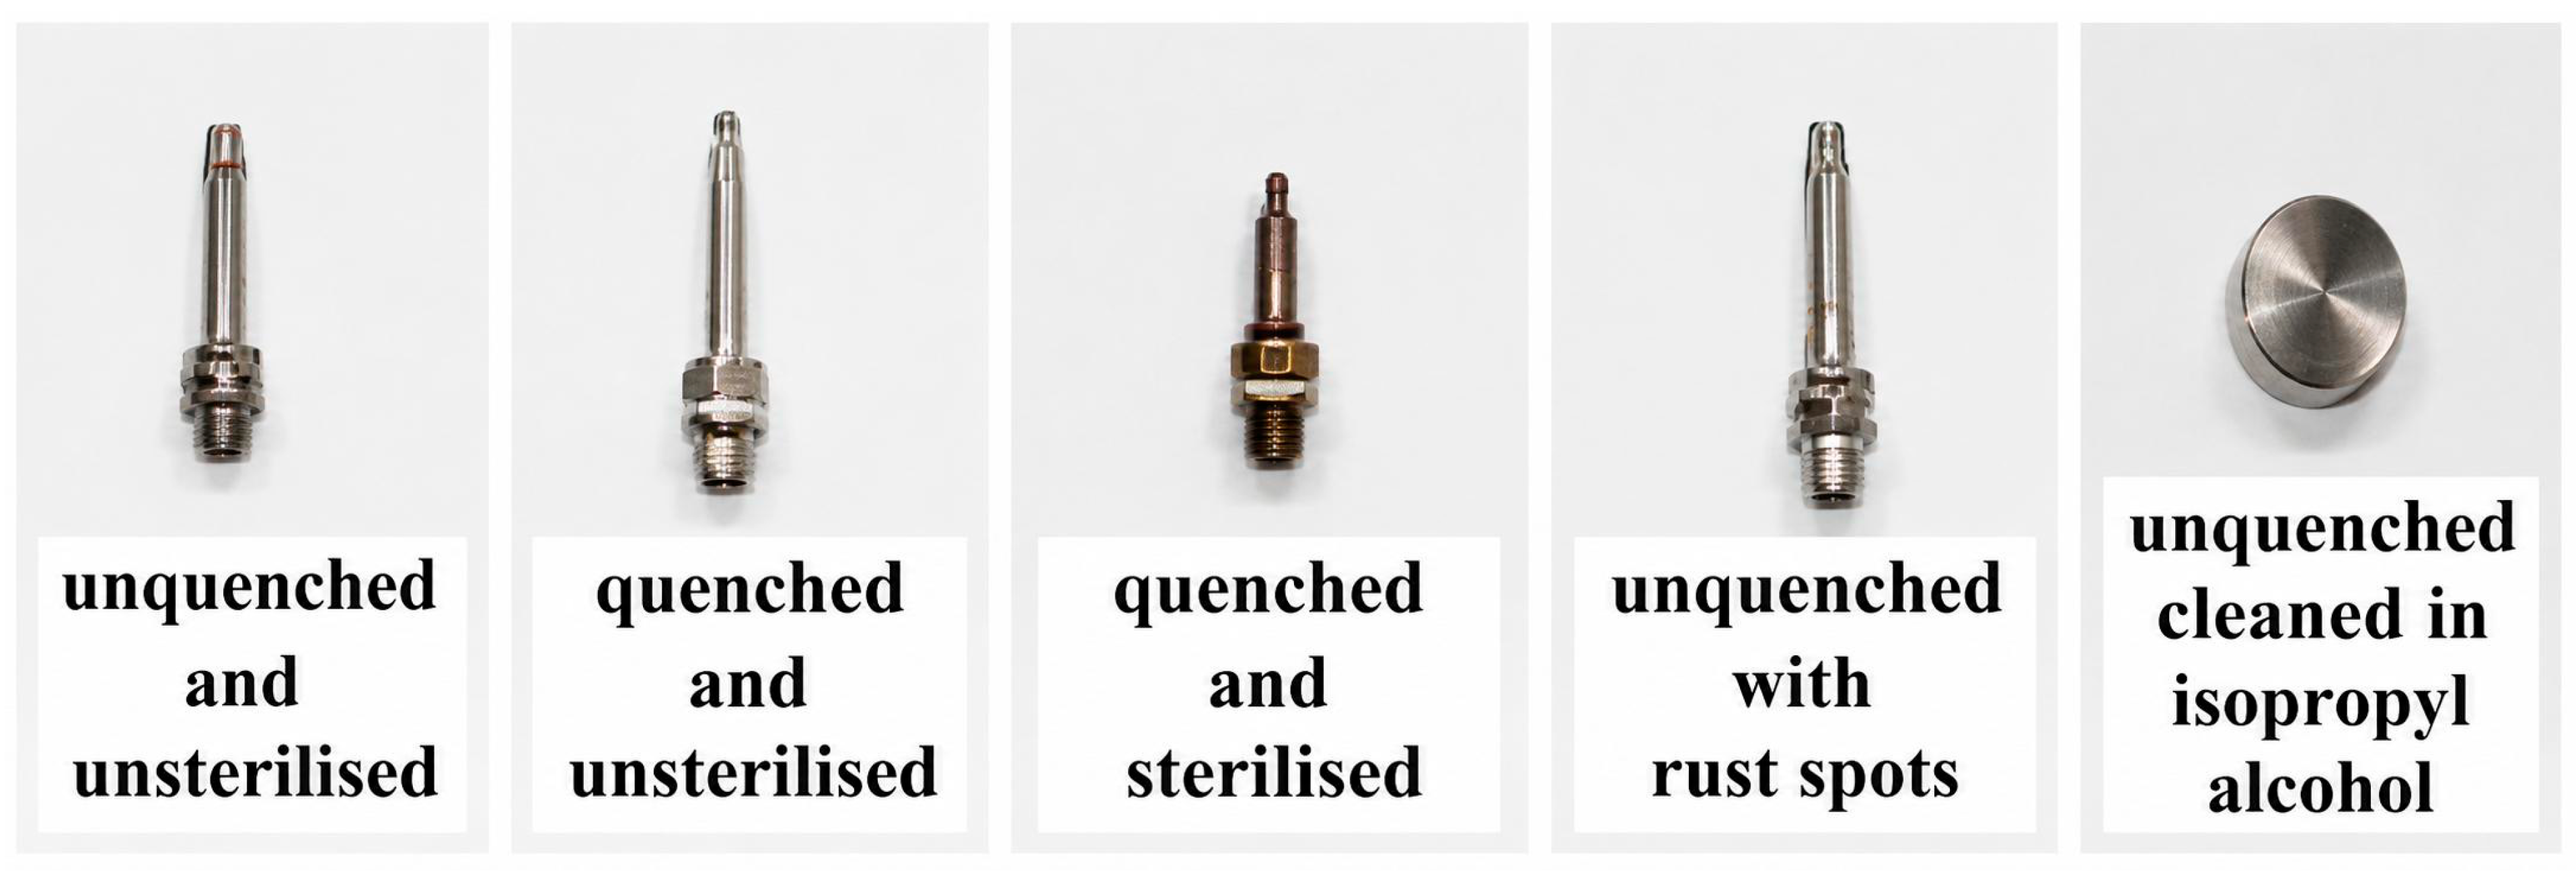
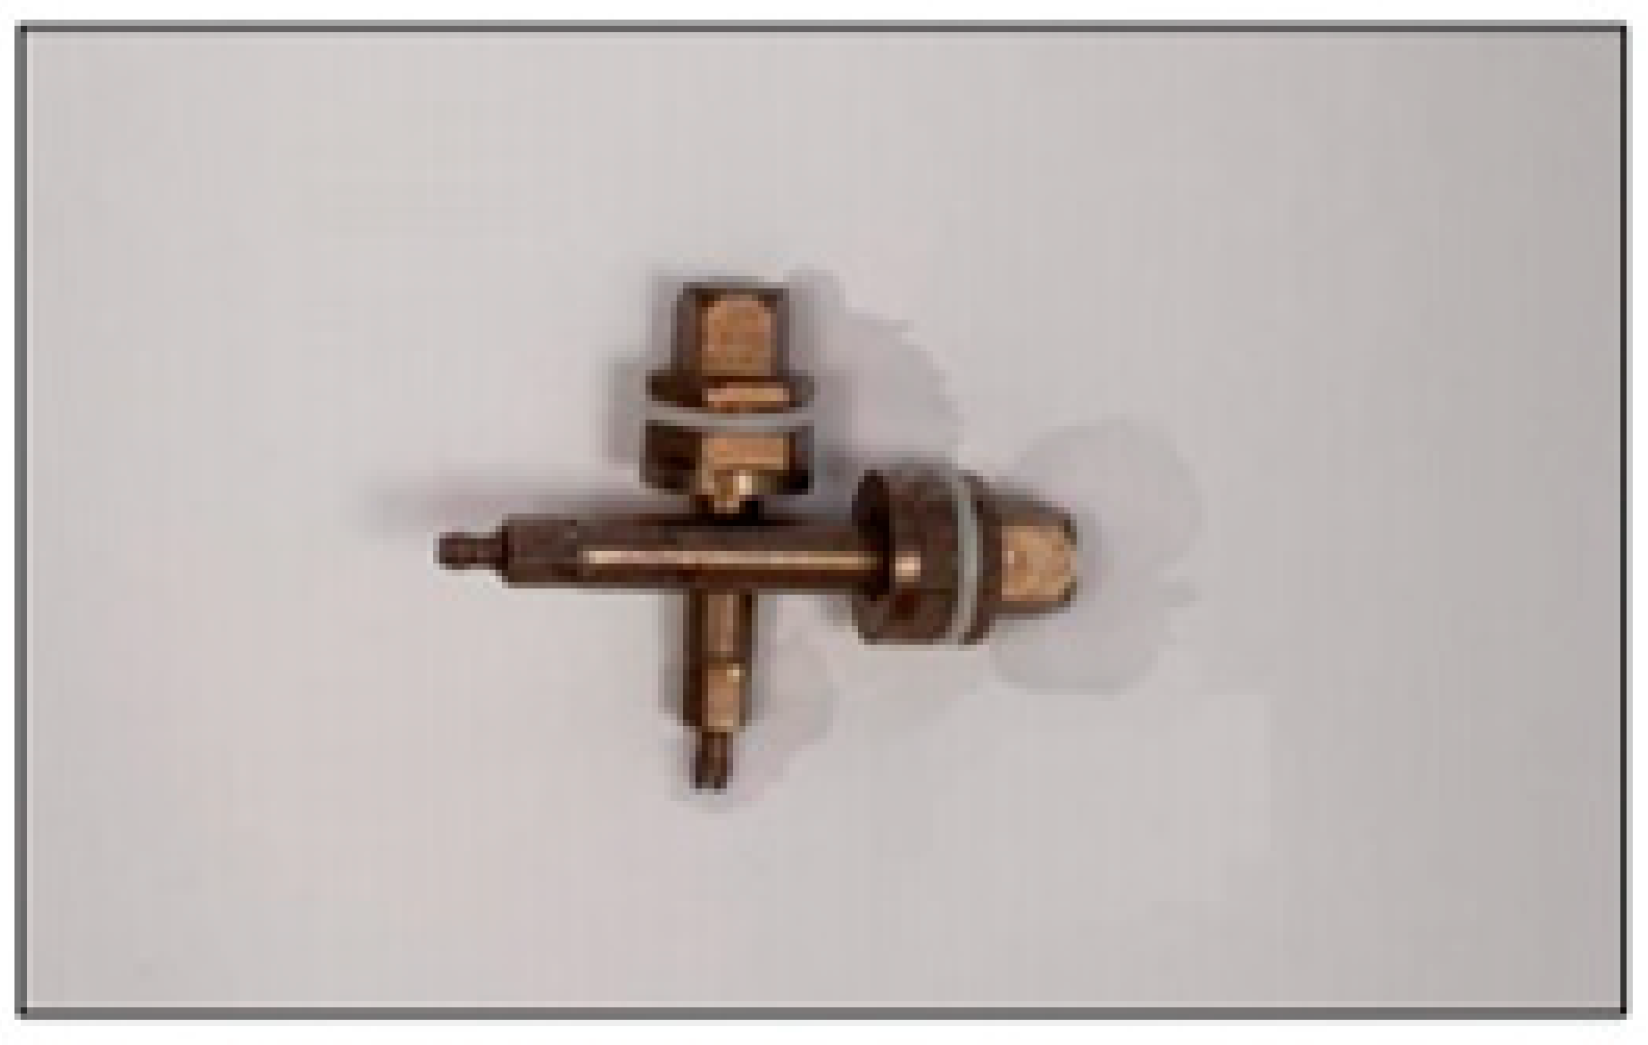
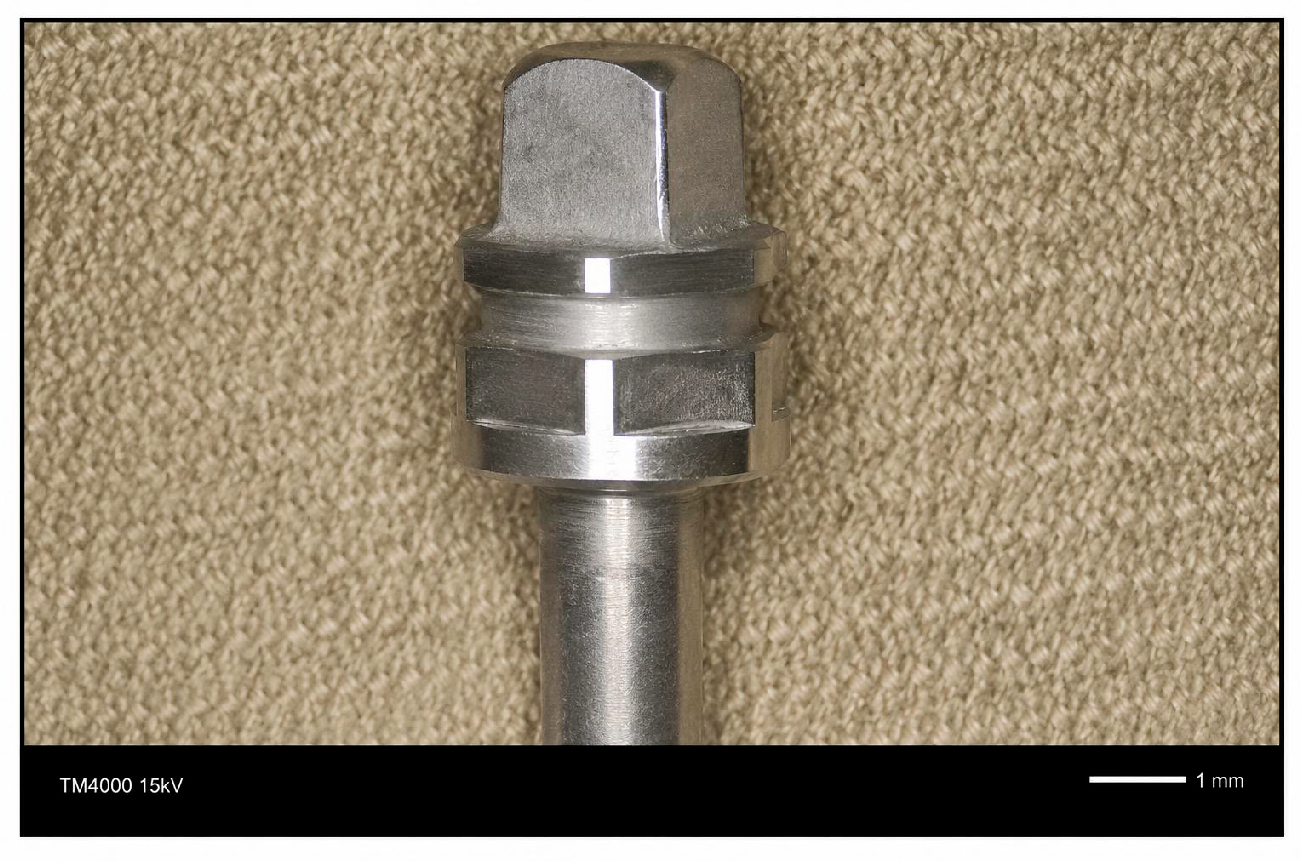
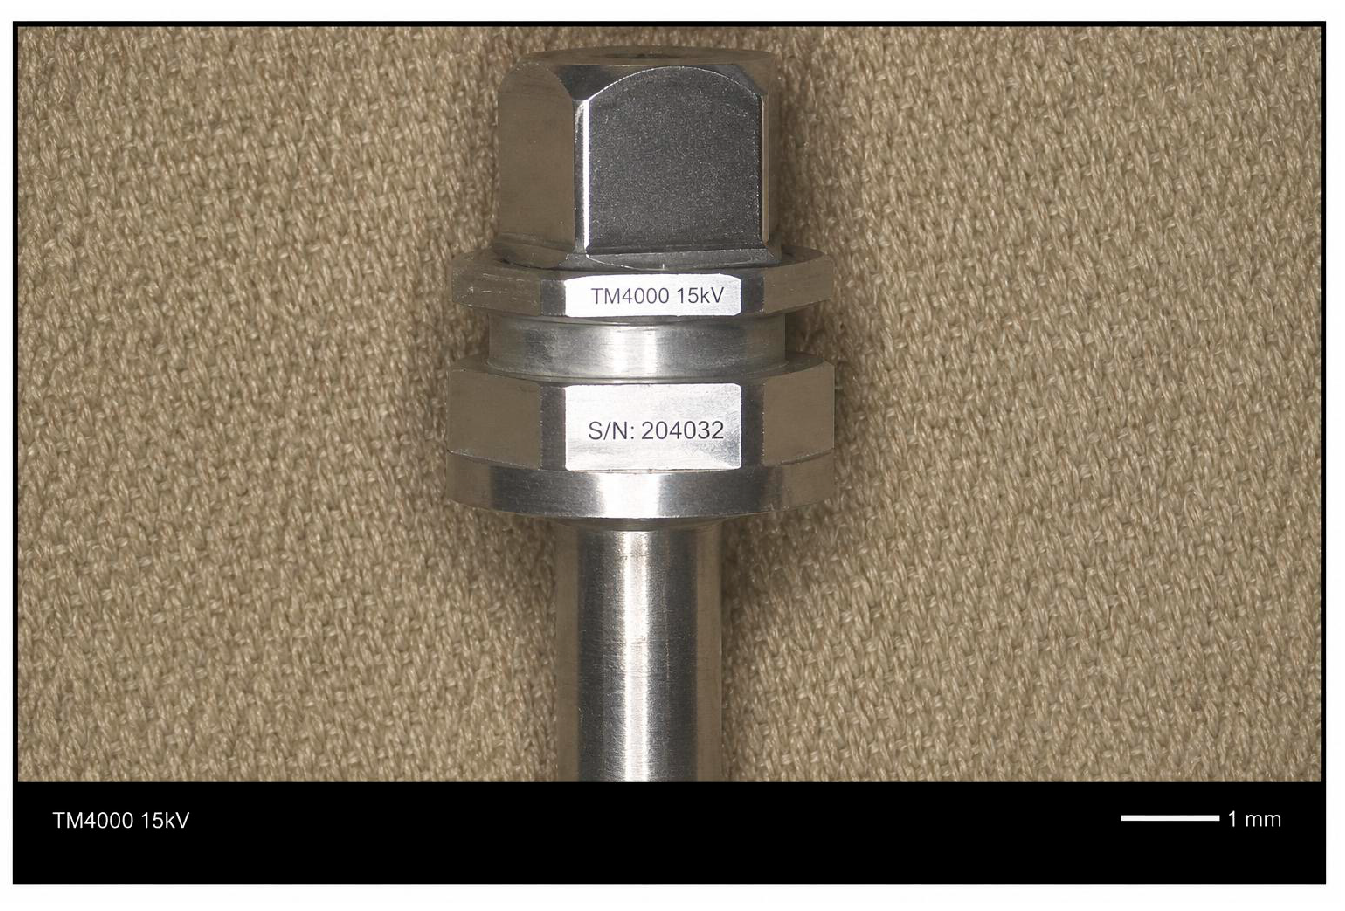
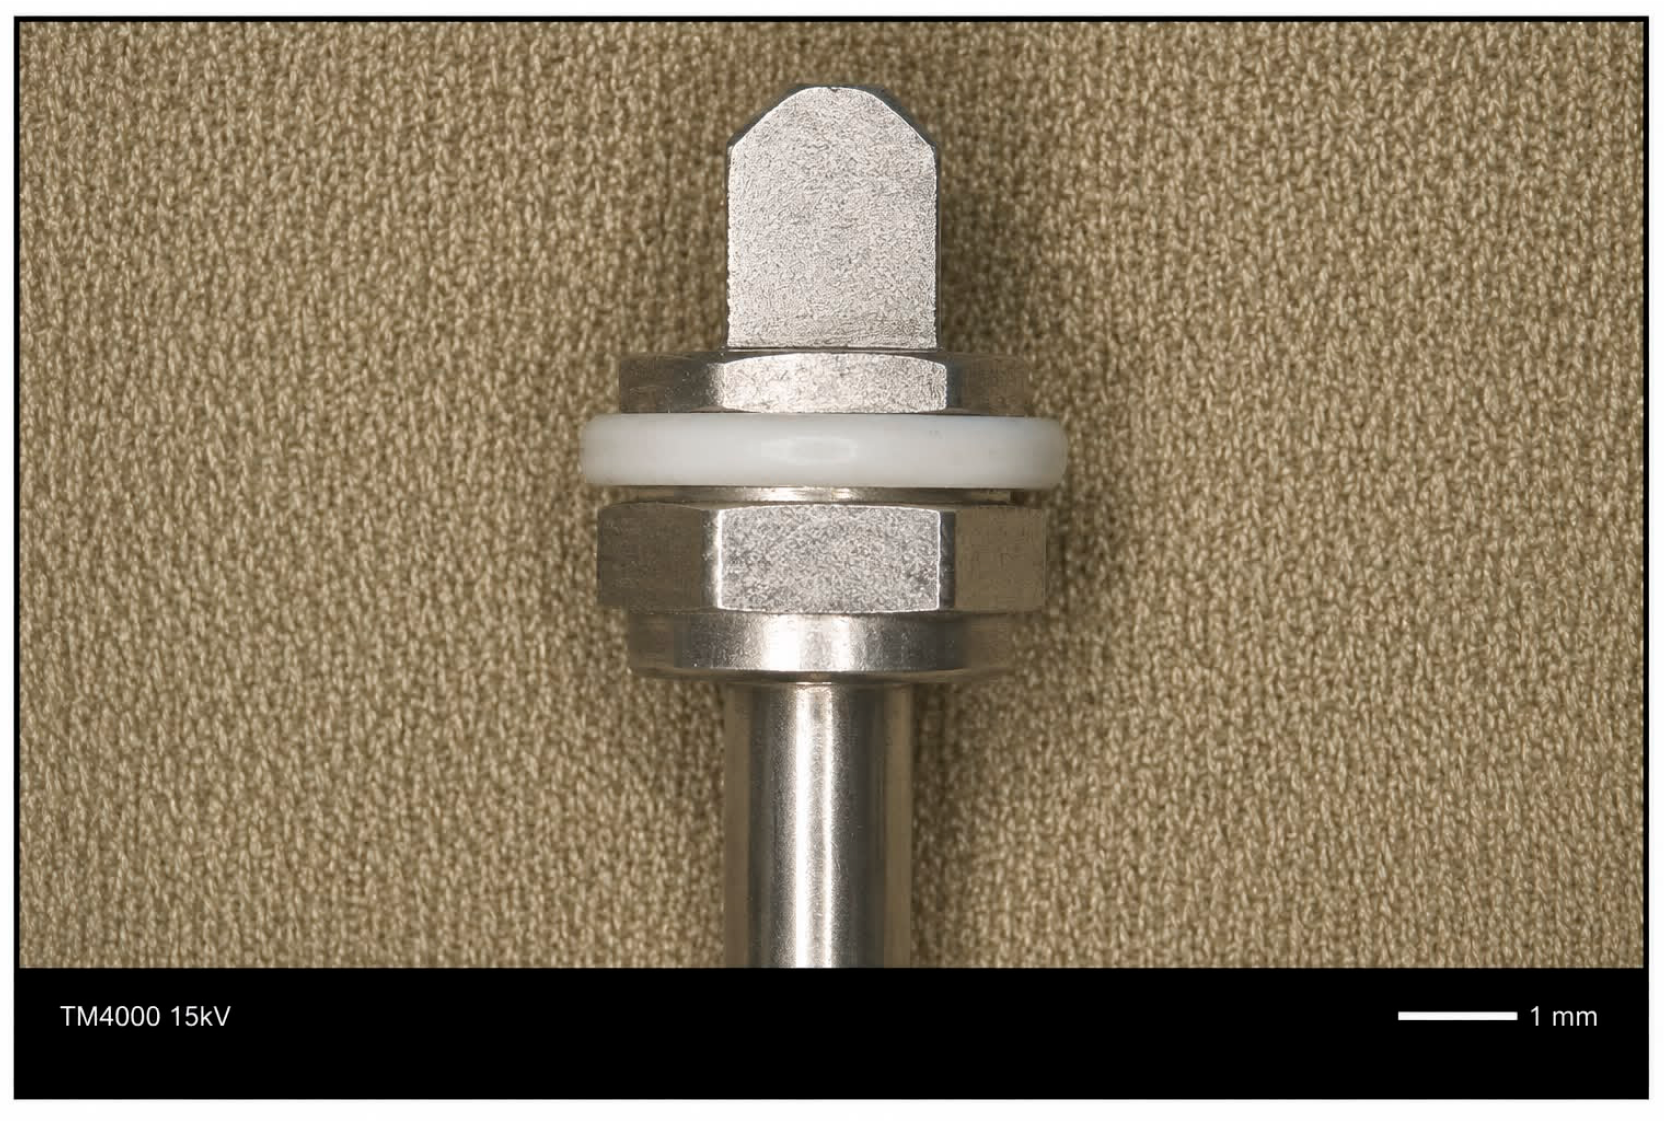
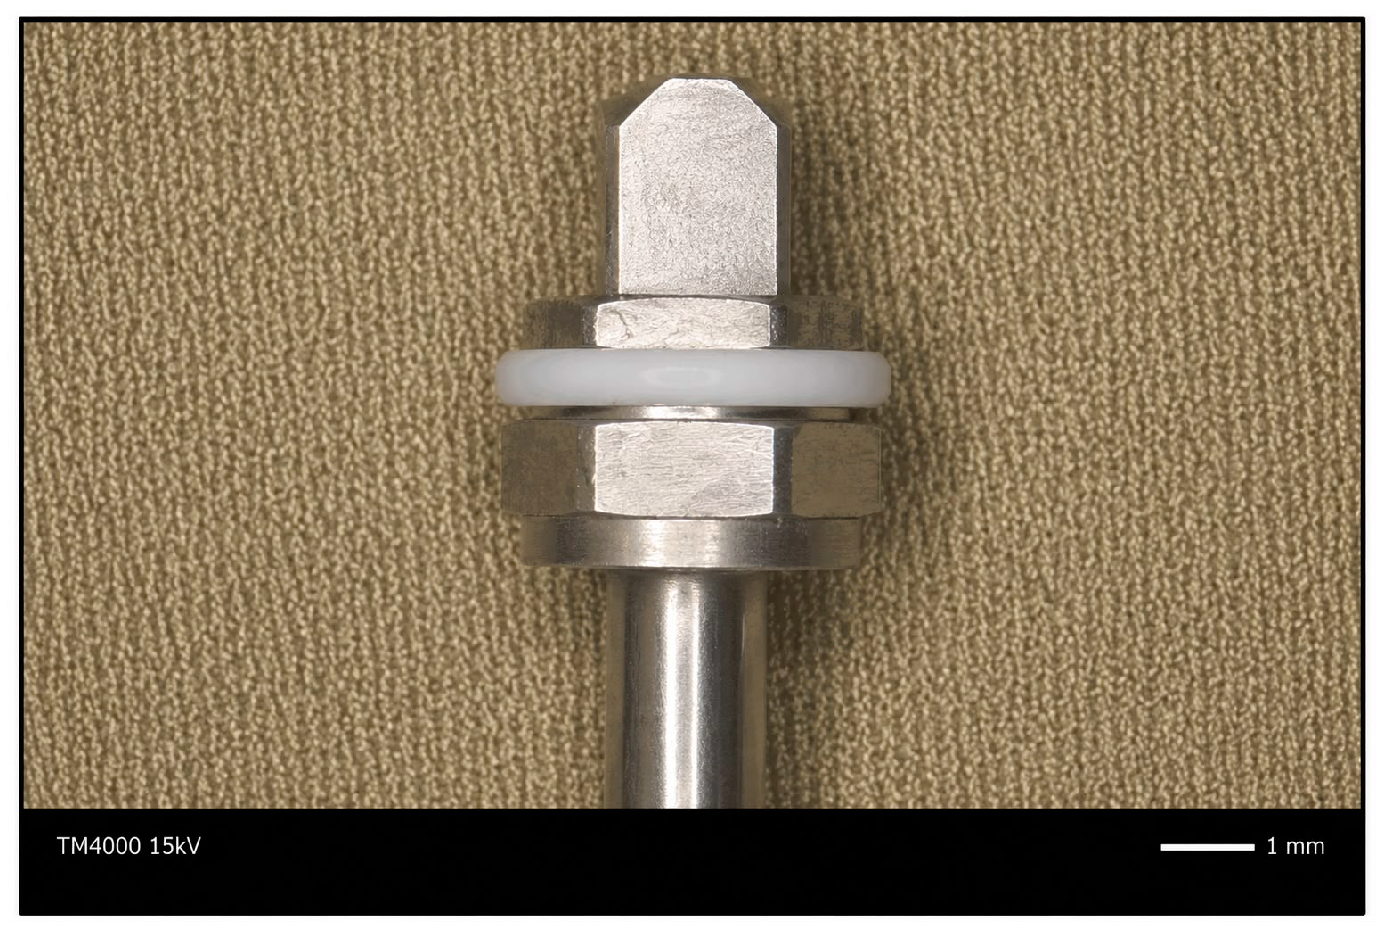
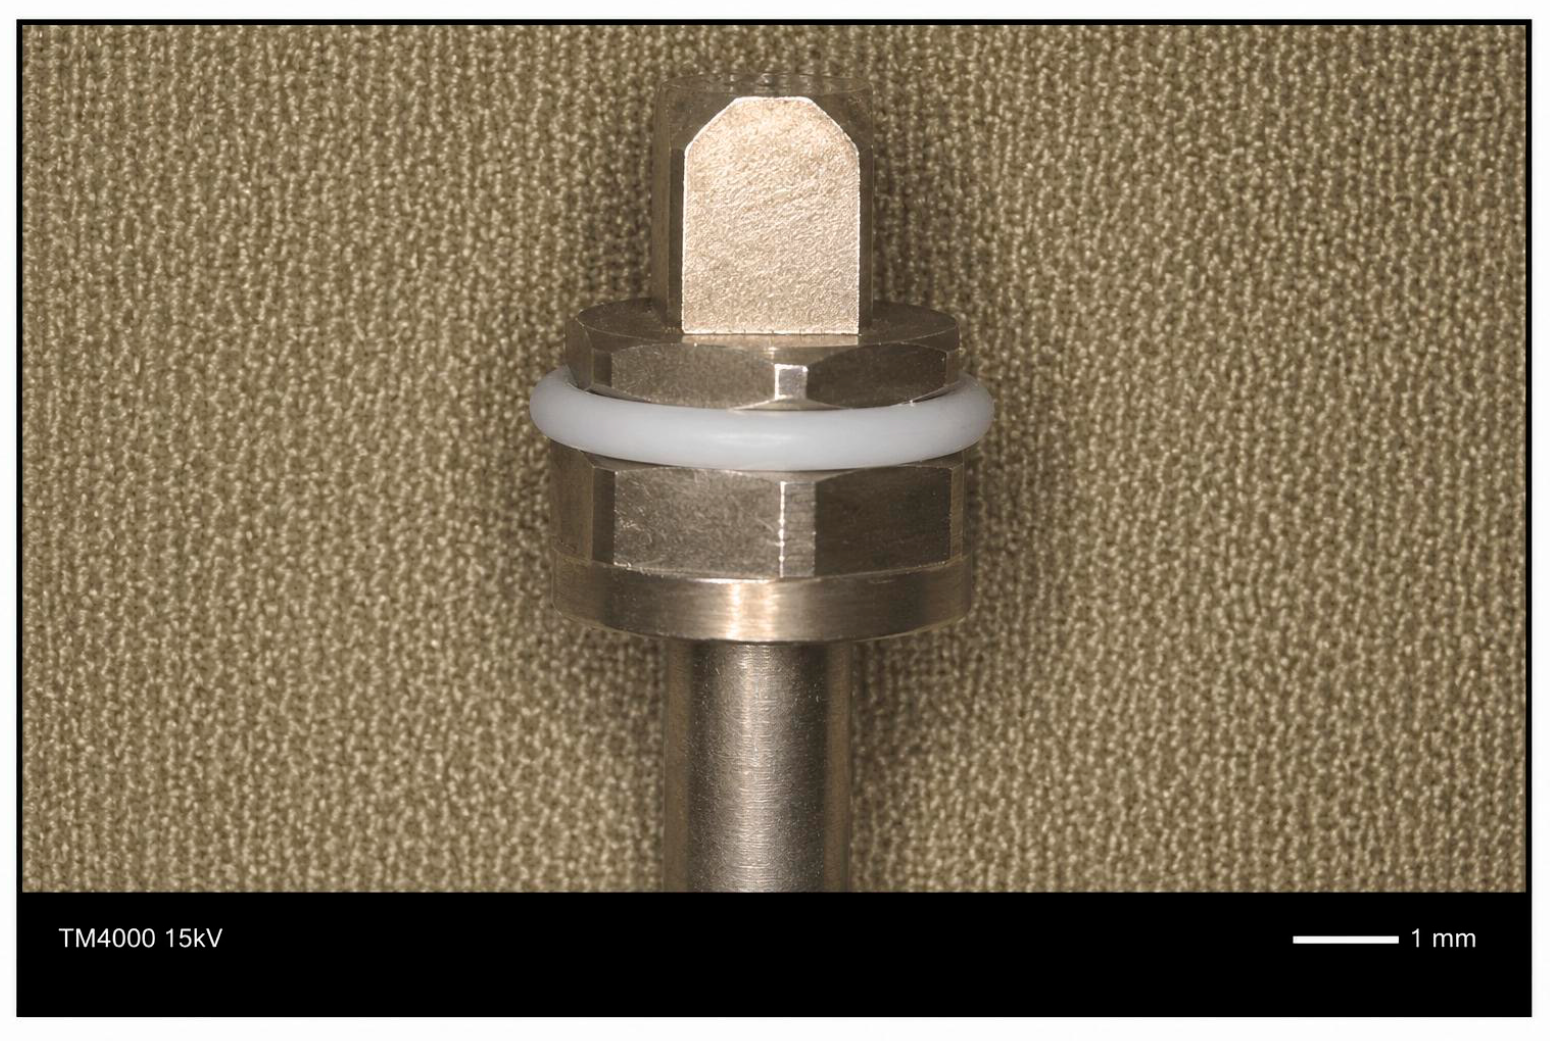
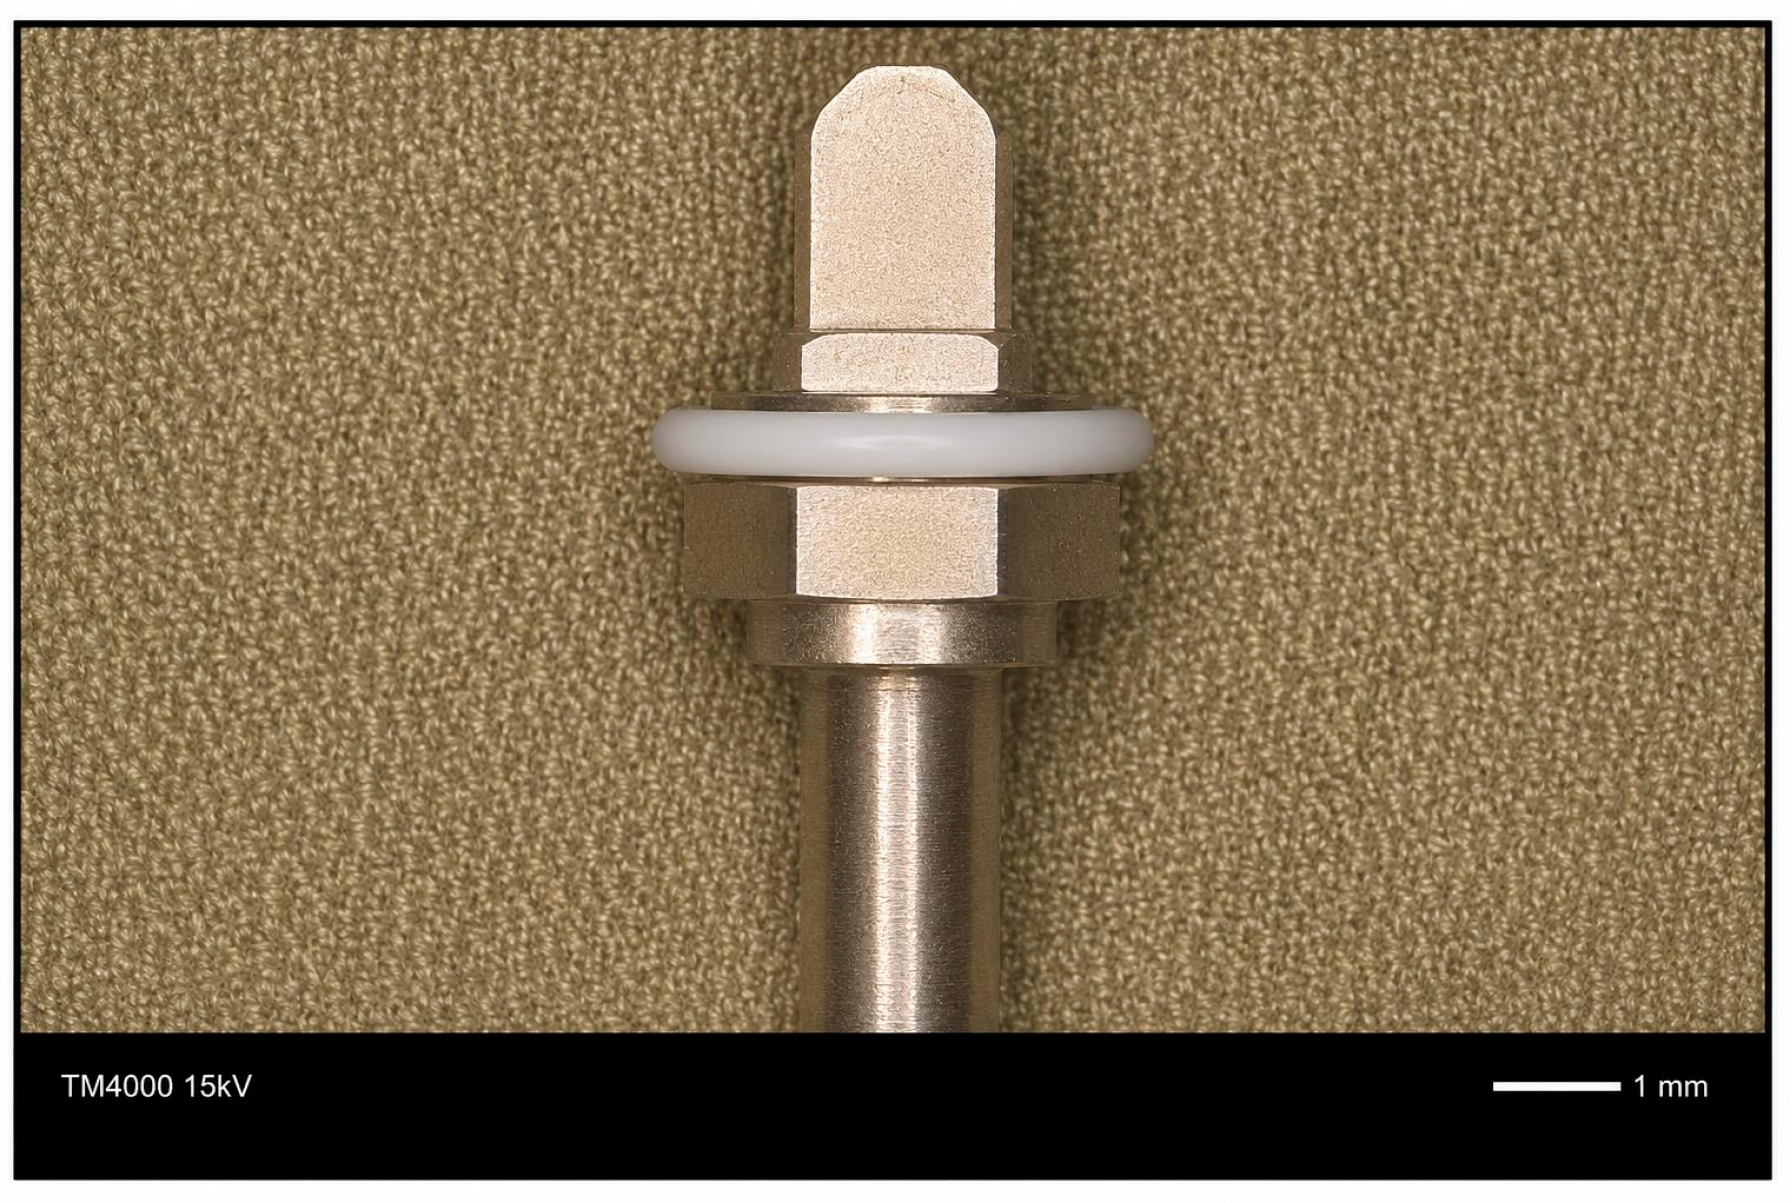
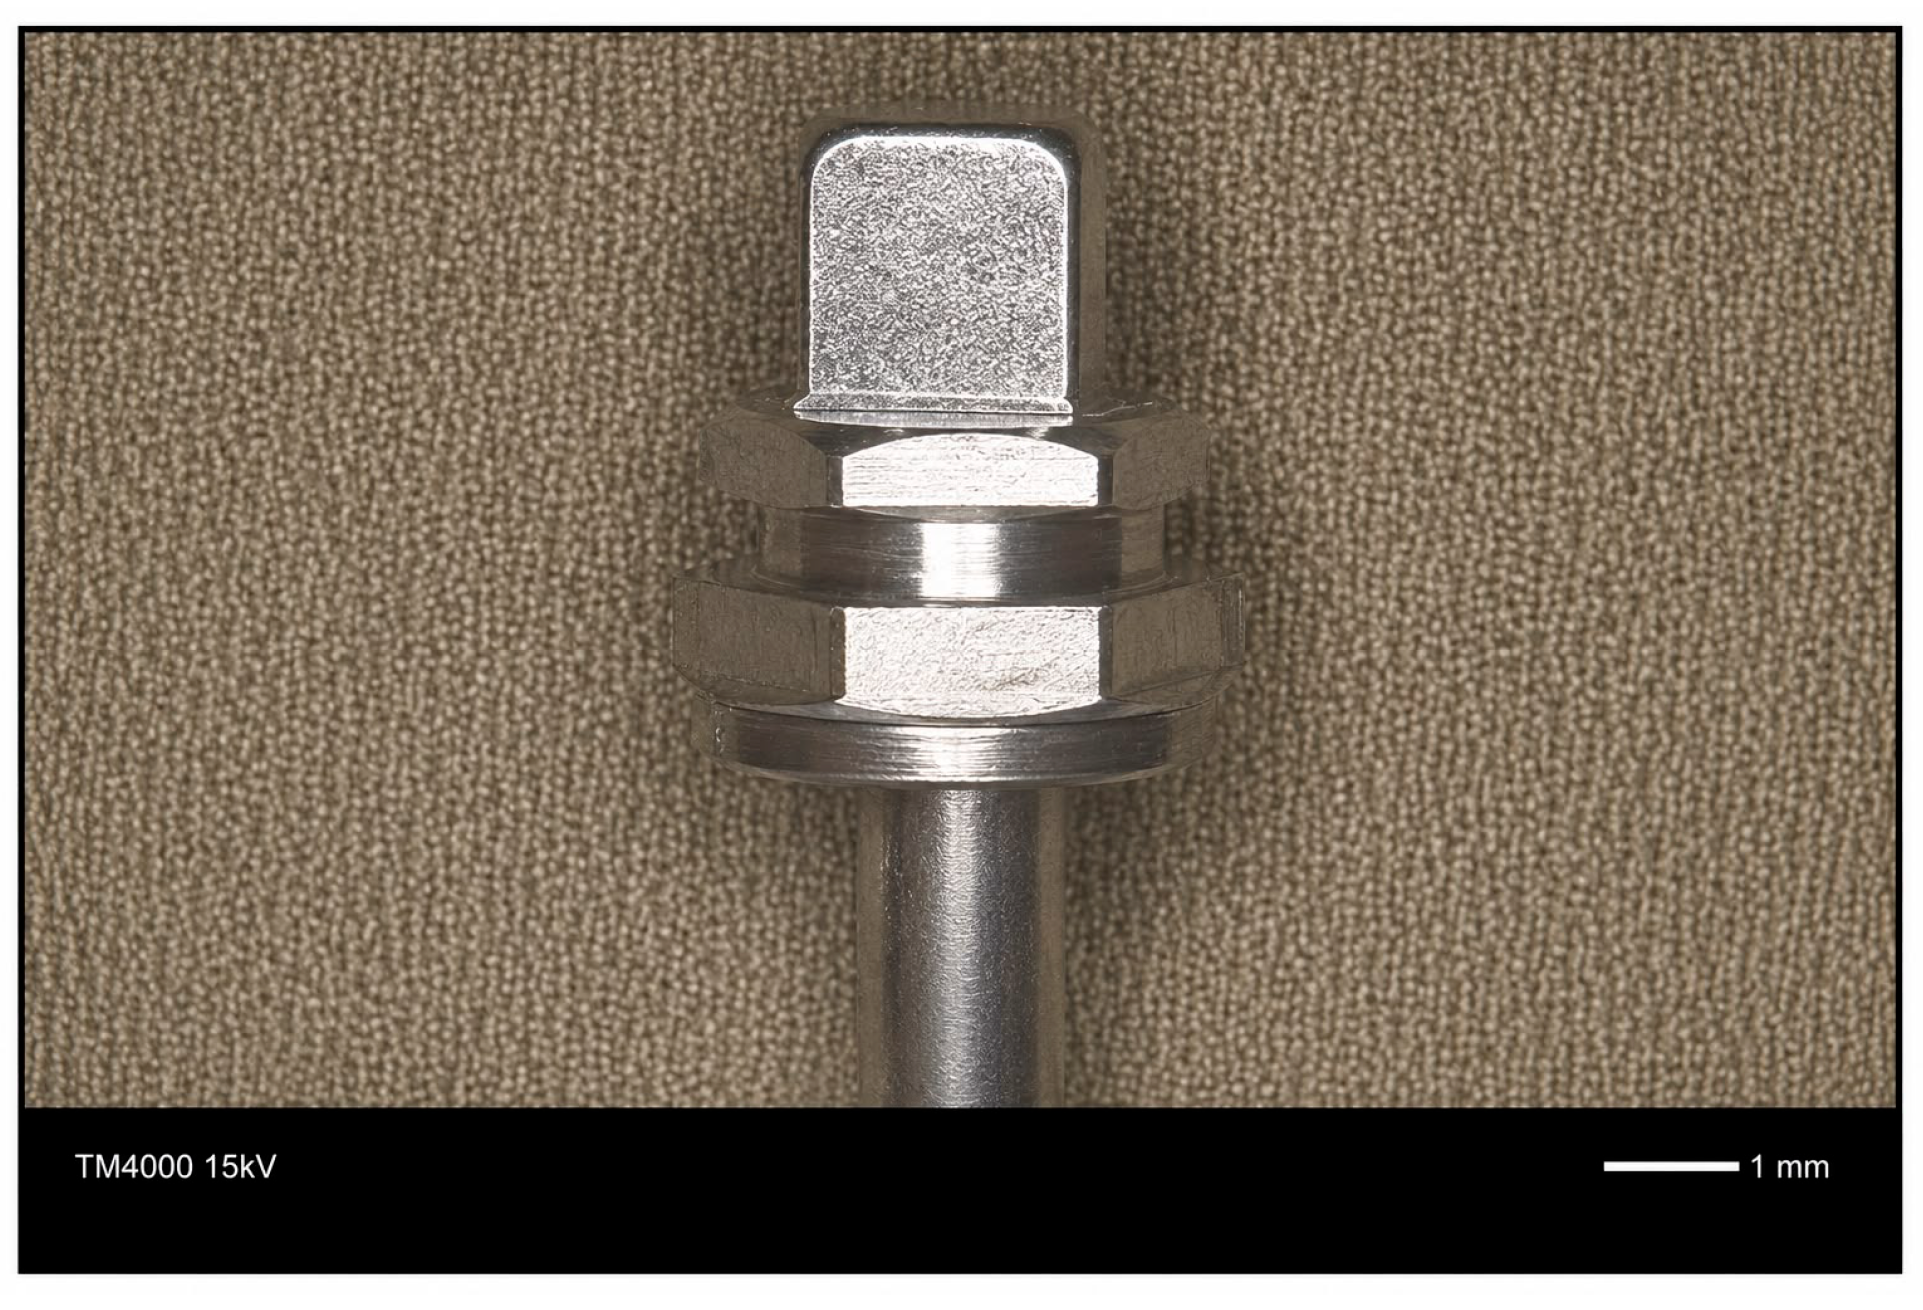
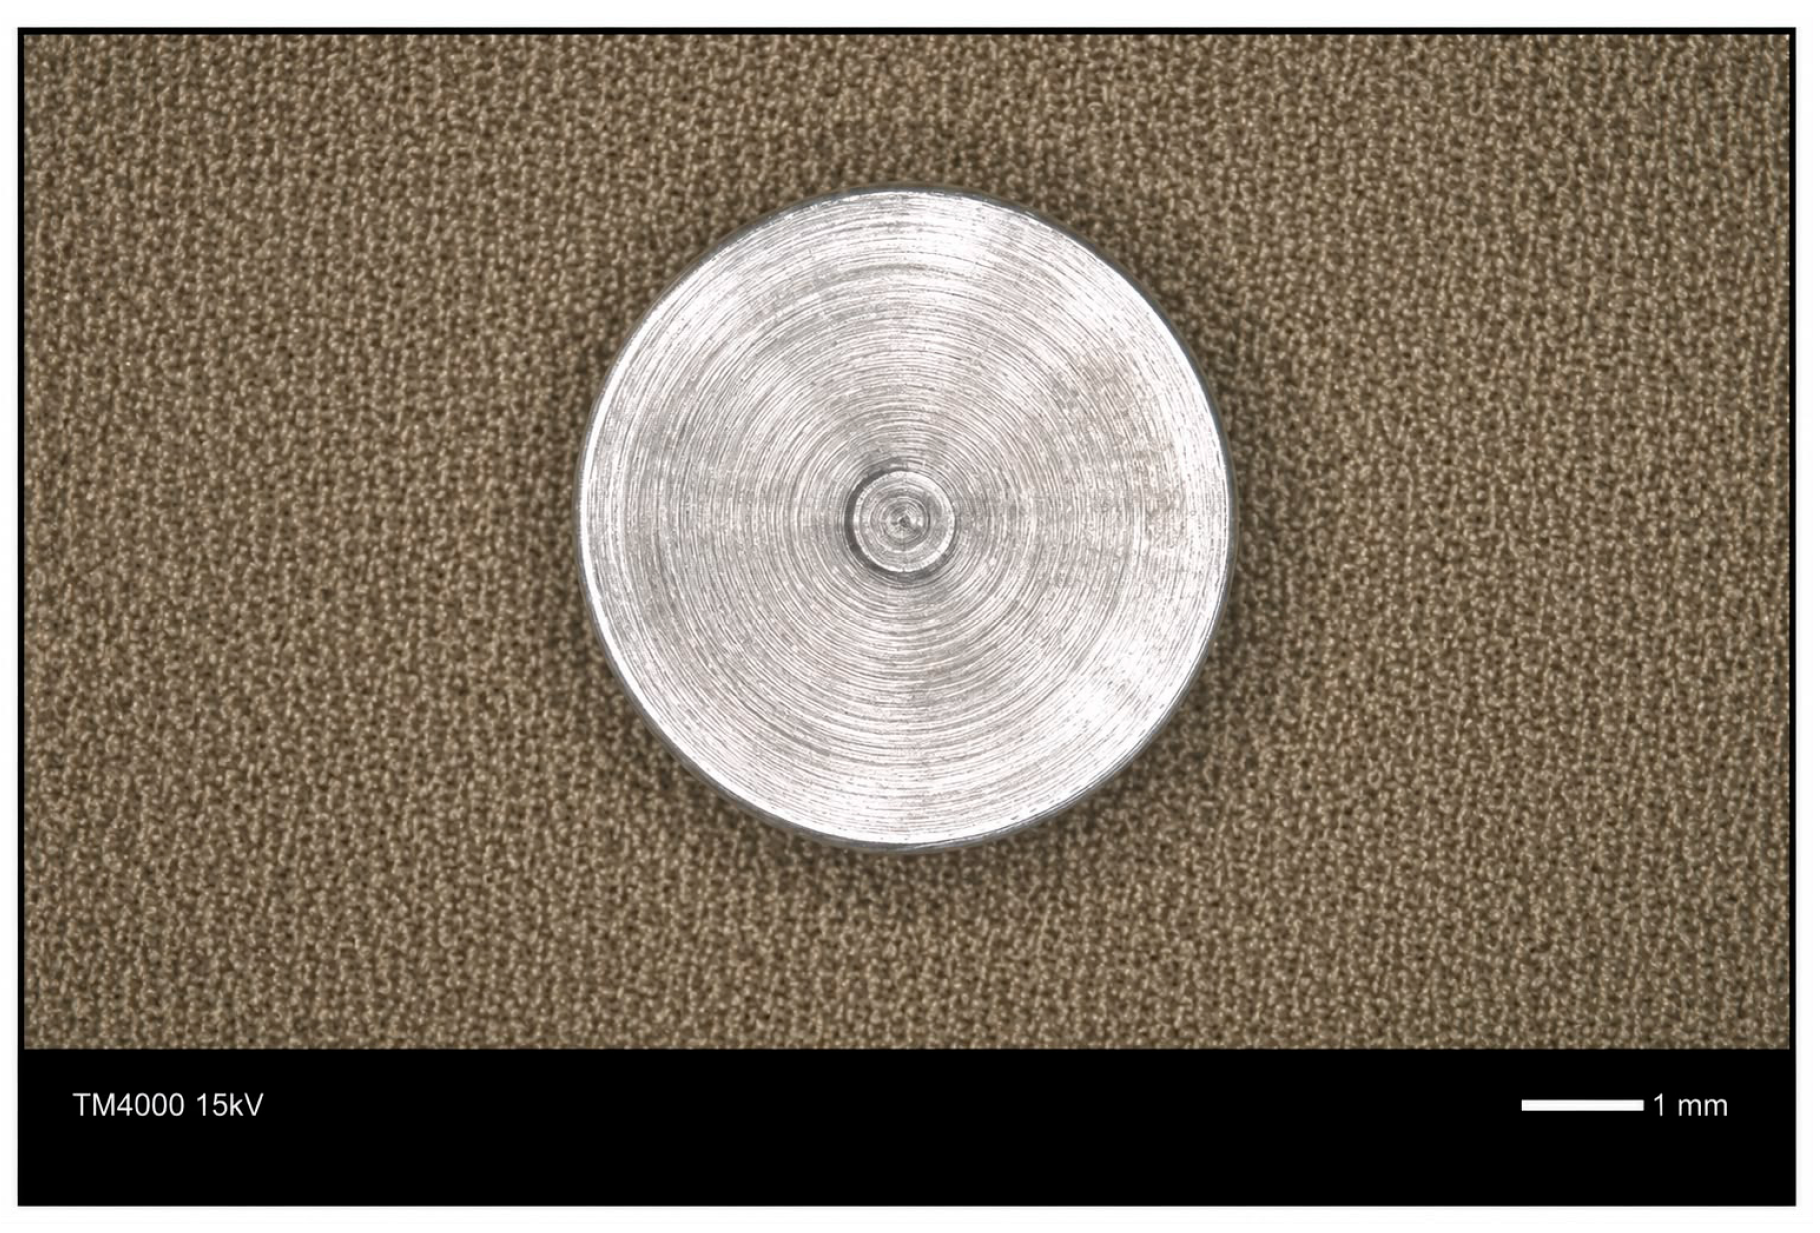
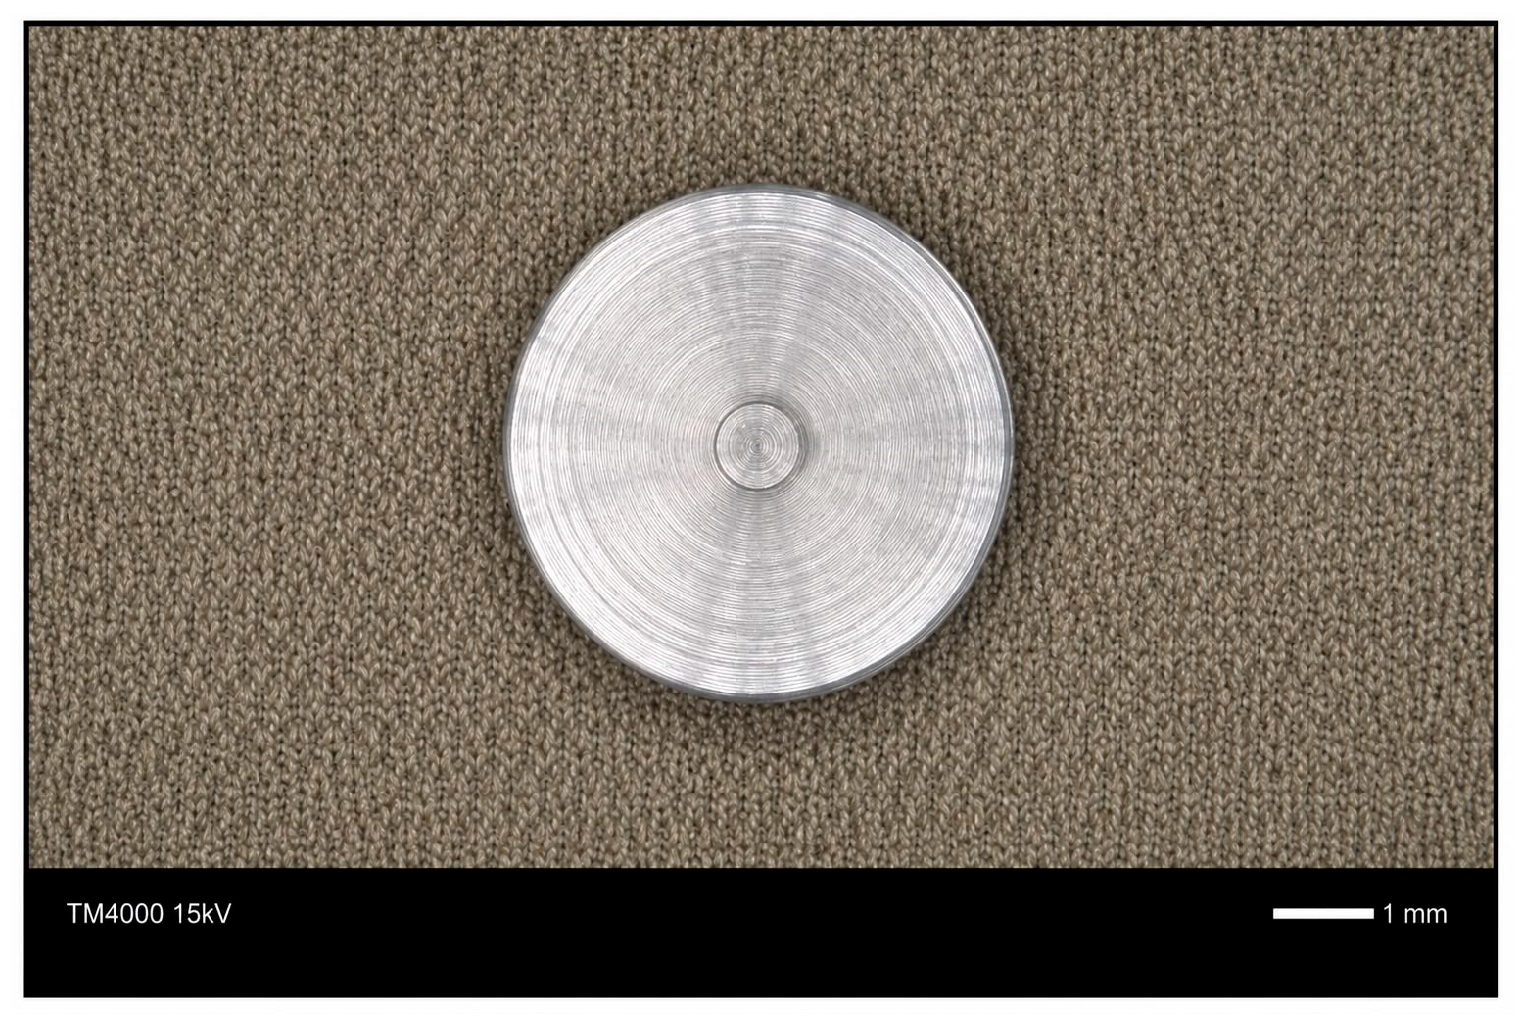
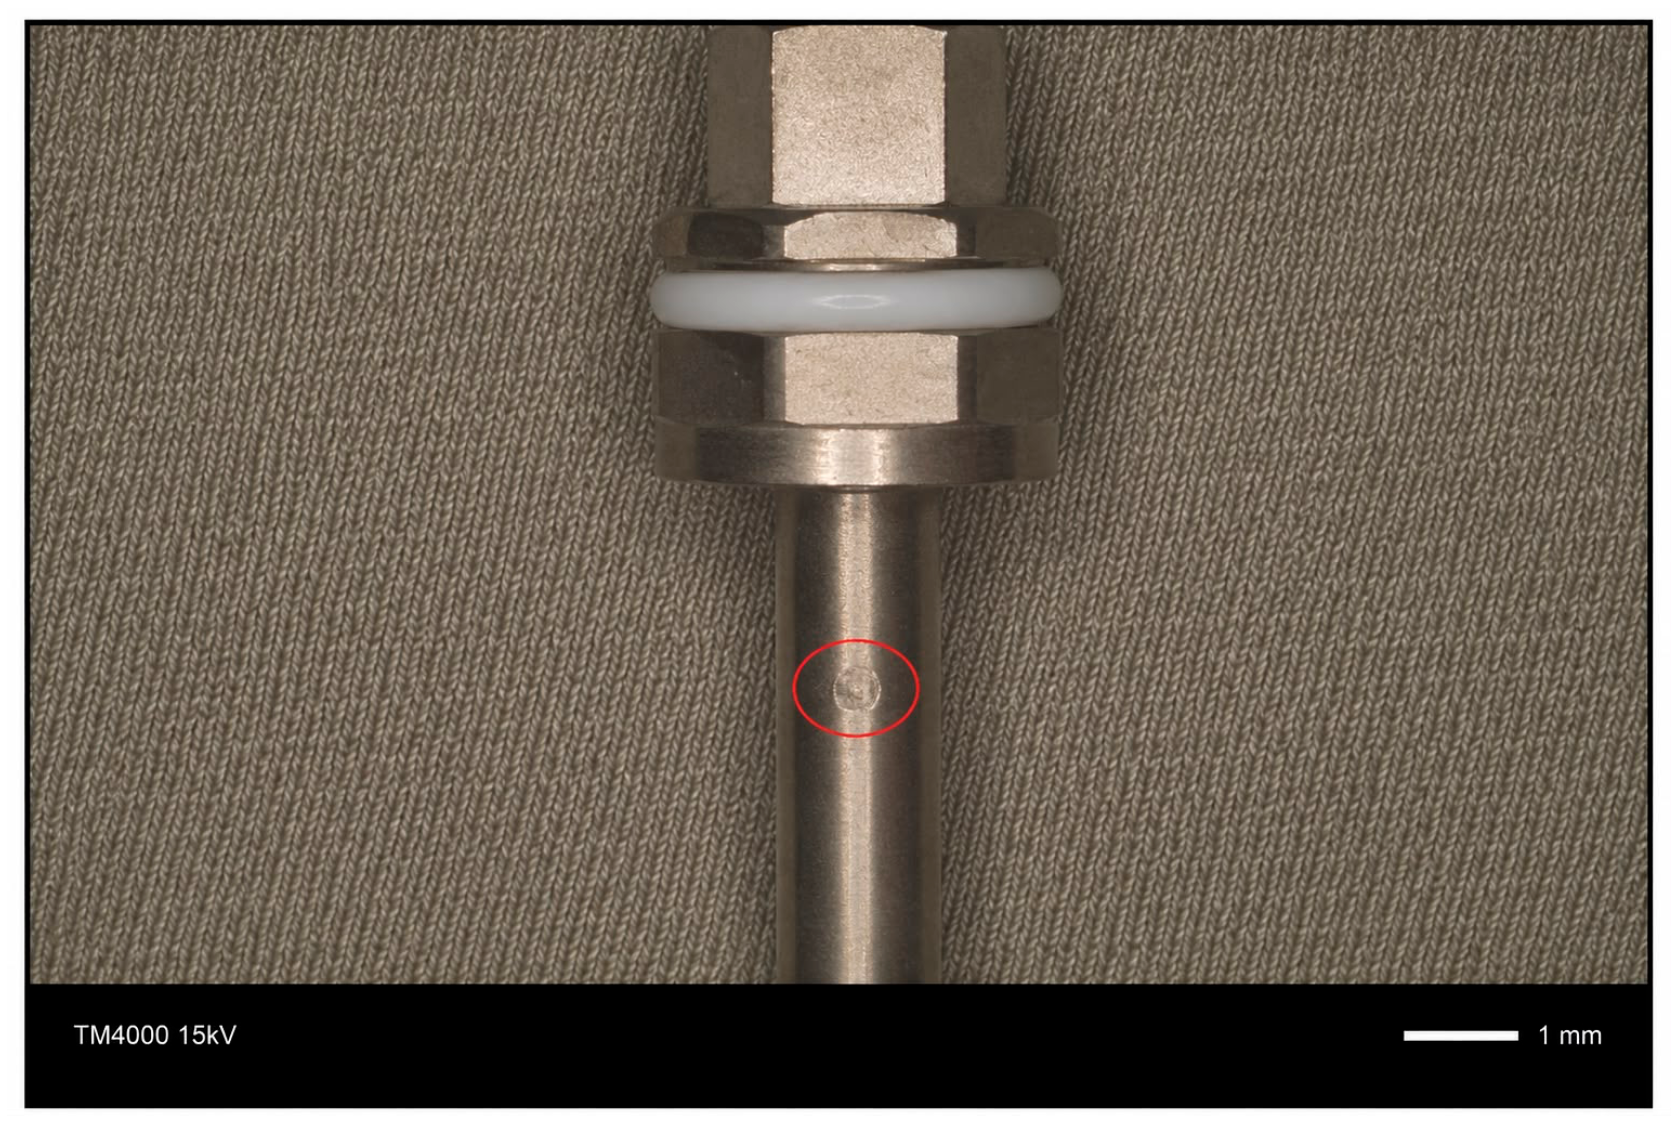
The following samples were used in this study (as presented in
Figure 2—prosthetic keys and base material):
1.4021 martensitic stainless steel sample—unquenched and unsterilised;
1.4021 martensitic stainless steel sample—quenched and unsterilised;
1.4021 martensitic stainless steel sample—quenched and sterilised;
1.4021 martensitic stainless steel sample—unquenched with rust spots;
1.4021 martensitic stainless steel sample—unquenched and cleaned in isopropyl alcohol.
A batch of the tested samples underwent low-temperature quenching and tempering heat treatment in order to increase their hardness and corrosion resistance.
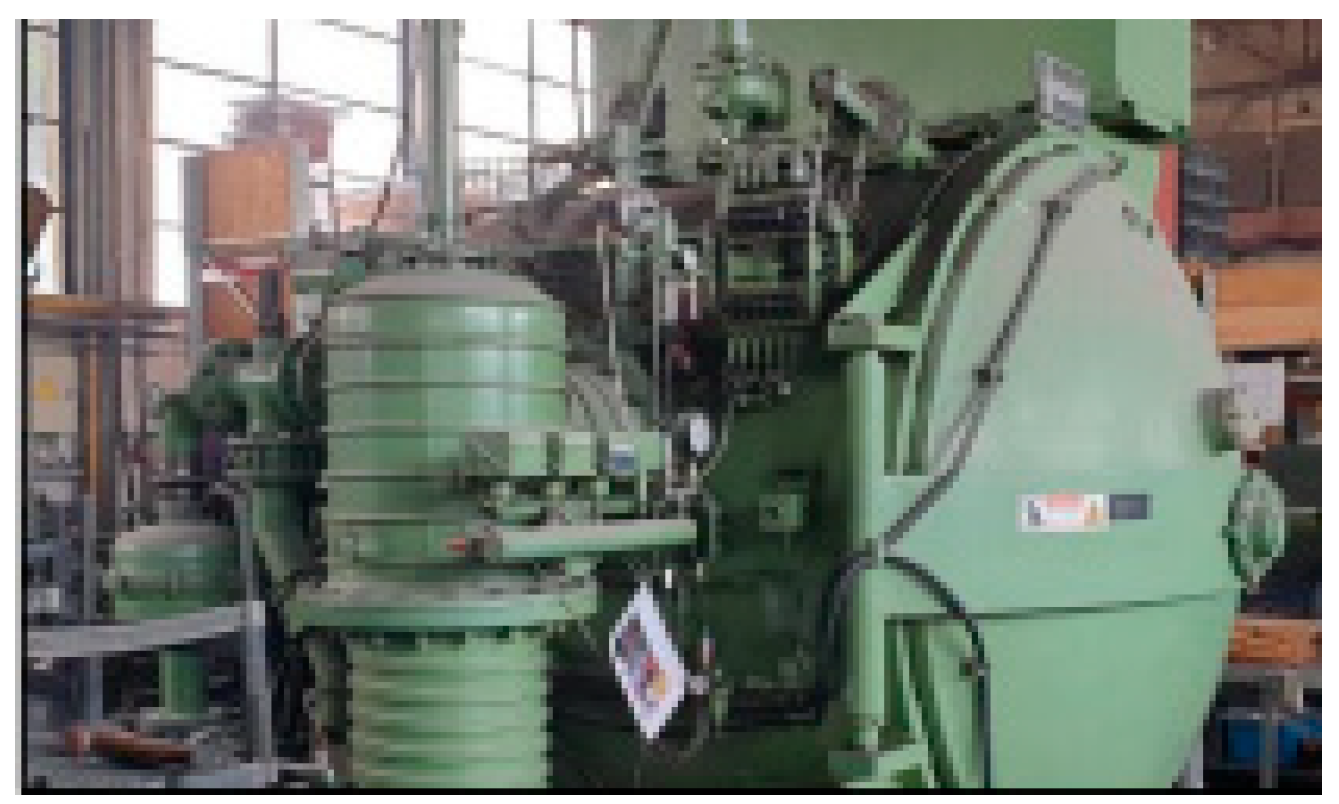
The equipment used to perform the heat treatment is a Vacuum furnace (ALD Vacuum Technologies GmbH, Hanau, Germany) shown in
Figure 3.
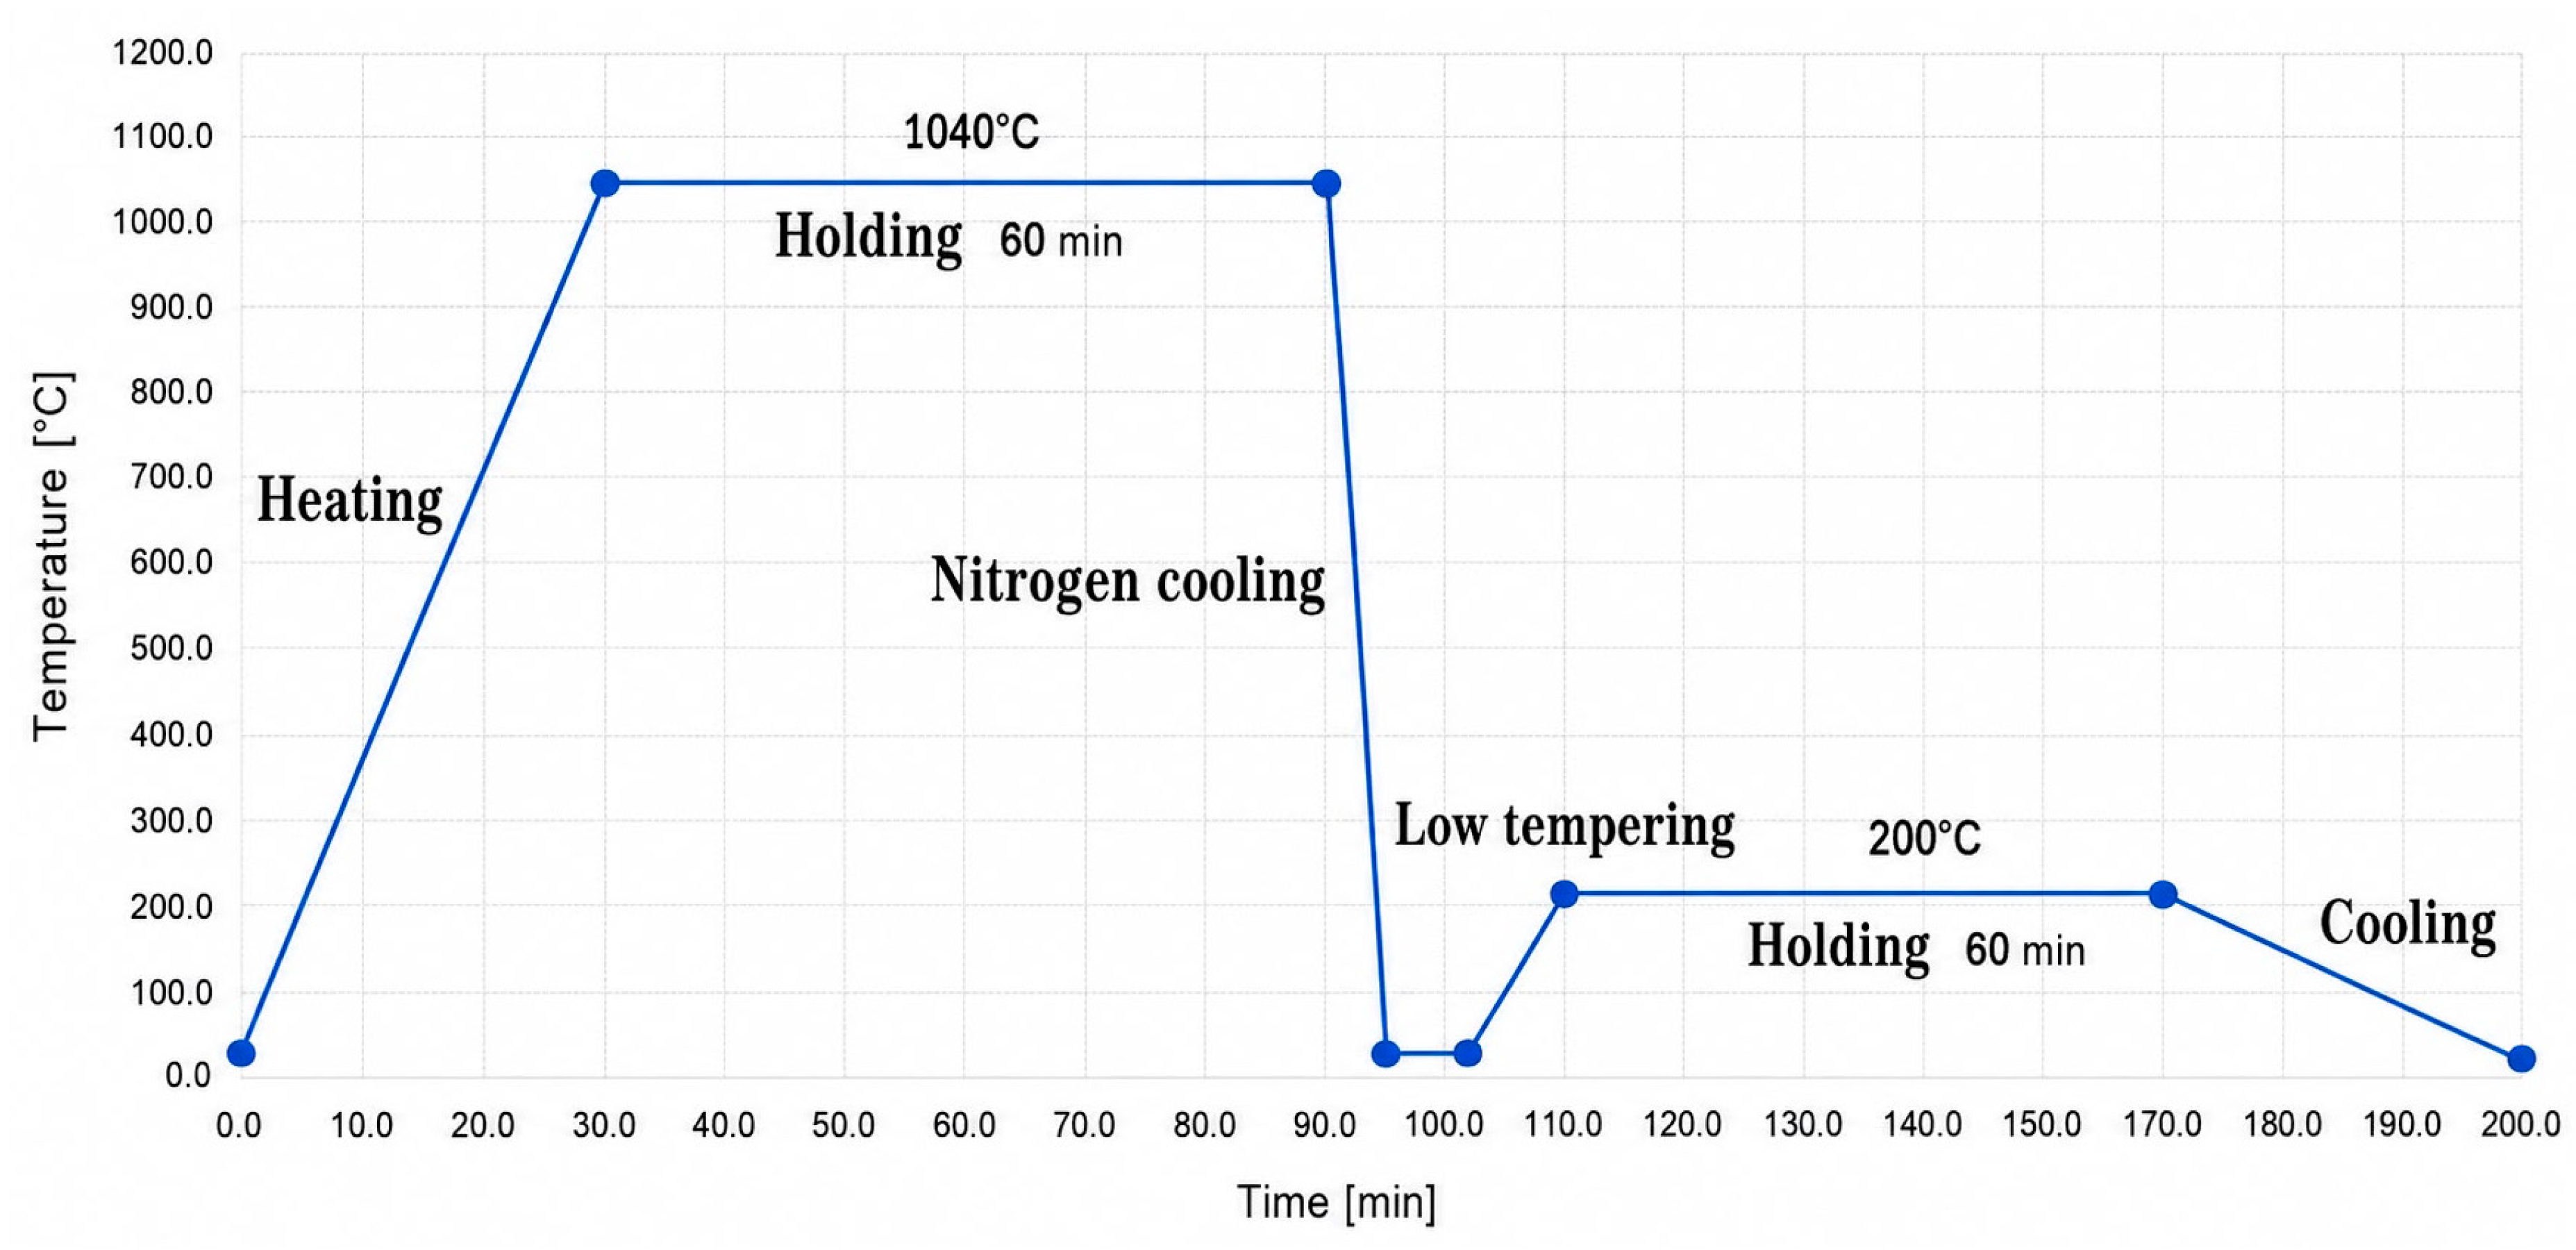
After austenitising at 1040 °C, the samples were quenched in a vacuum furnace by cooling with recirculated nitrogen at a pressure of 8 bar. In the case of small parts, this regime ensured rapid cooling, characteristic of high-pressure gas quenching processes. Based on the literature and the process conditions, the cooling rate in the critical range was estimated to be approximately 10–15 °C/s. In the present case, the cooling rate was estimated to be approximately 12 °C/s—a value based on the literature [
20,
21,
22], not an experimentally determined value.
Quenching was carried out in vacuum—the material was heated to 1040 °C, held at this temperature for 60 min, and then cooled in nitrogen. For low-temperature tempering, the material was heated to 200 °C, held for 60 min, and then cooled in air, as shown in
Figure 4.
In addition to microscopic metallographic analysis, the hardness of the samples was assessed using the Vickers method to determine whether hardness differed according to the process/treatment applied.
The samples then underwent microscopic analysis. The purpose of this metallographic structural analysis was to observe the occurrence of defects on the surfaces and in the cores of the samples, as well as differences in structure among the analysed samples—defects that could explain the occurrence of corrosion on the prosthetic keys.
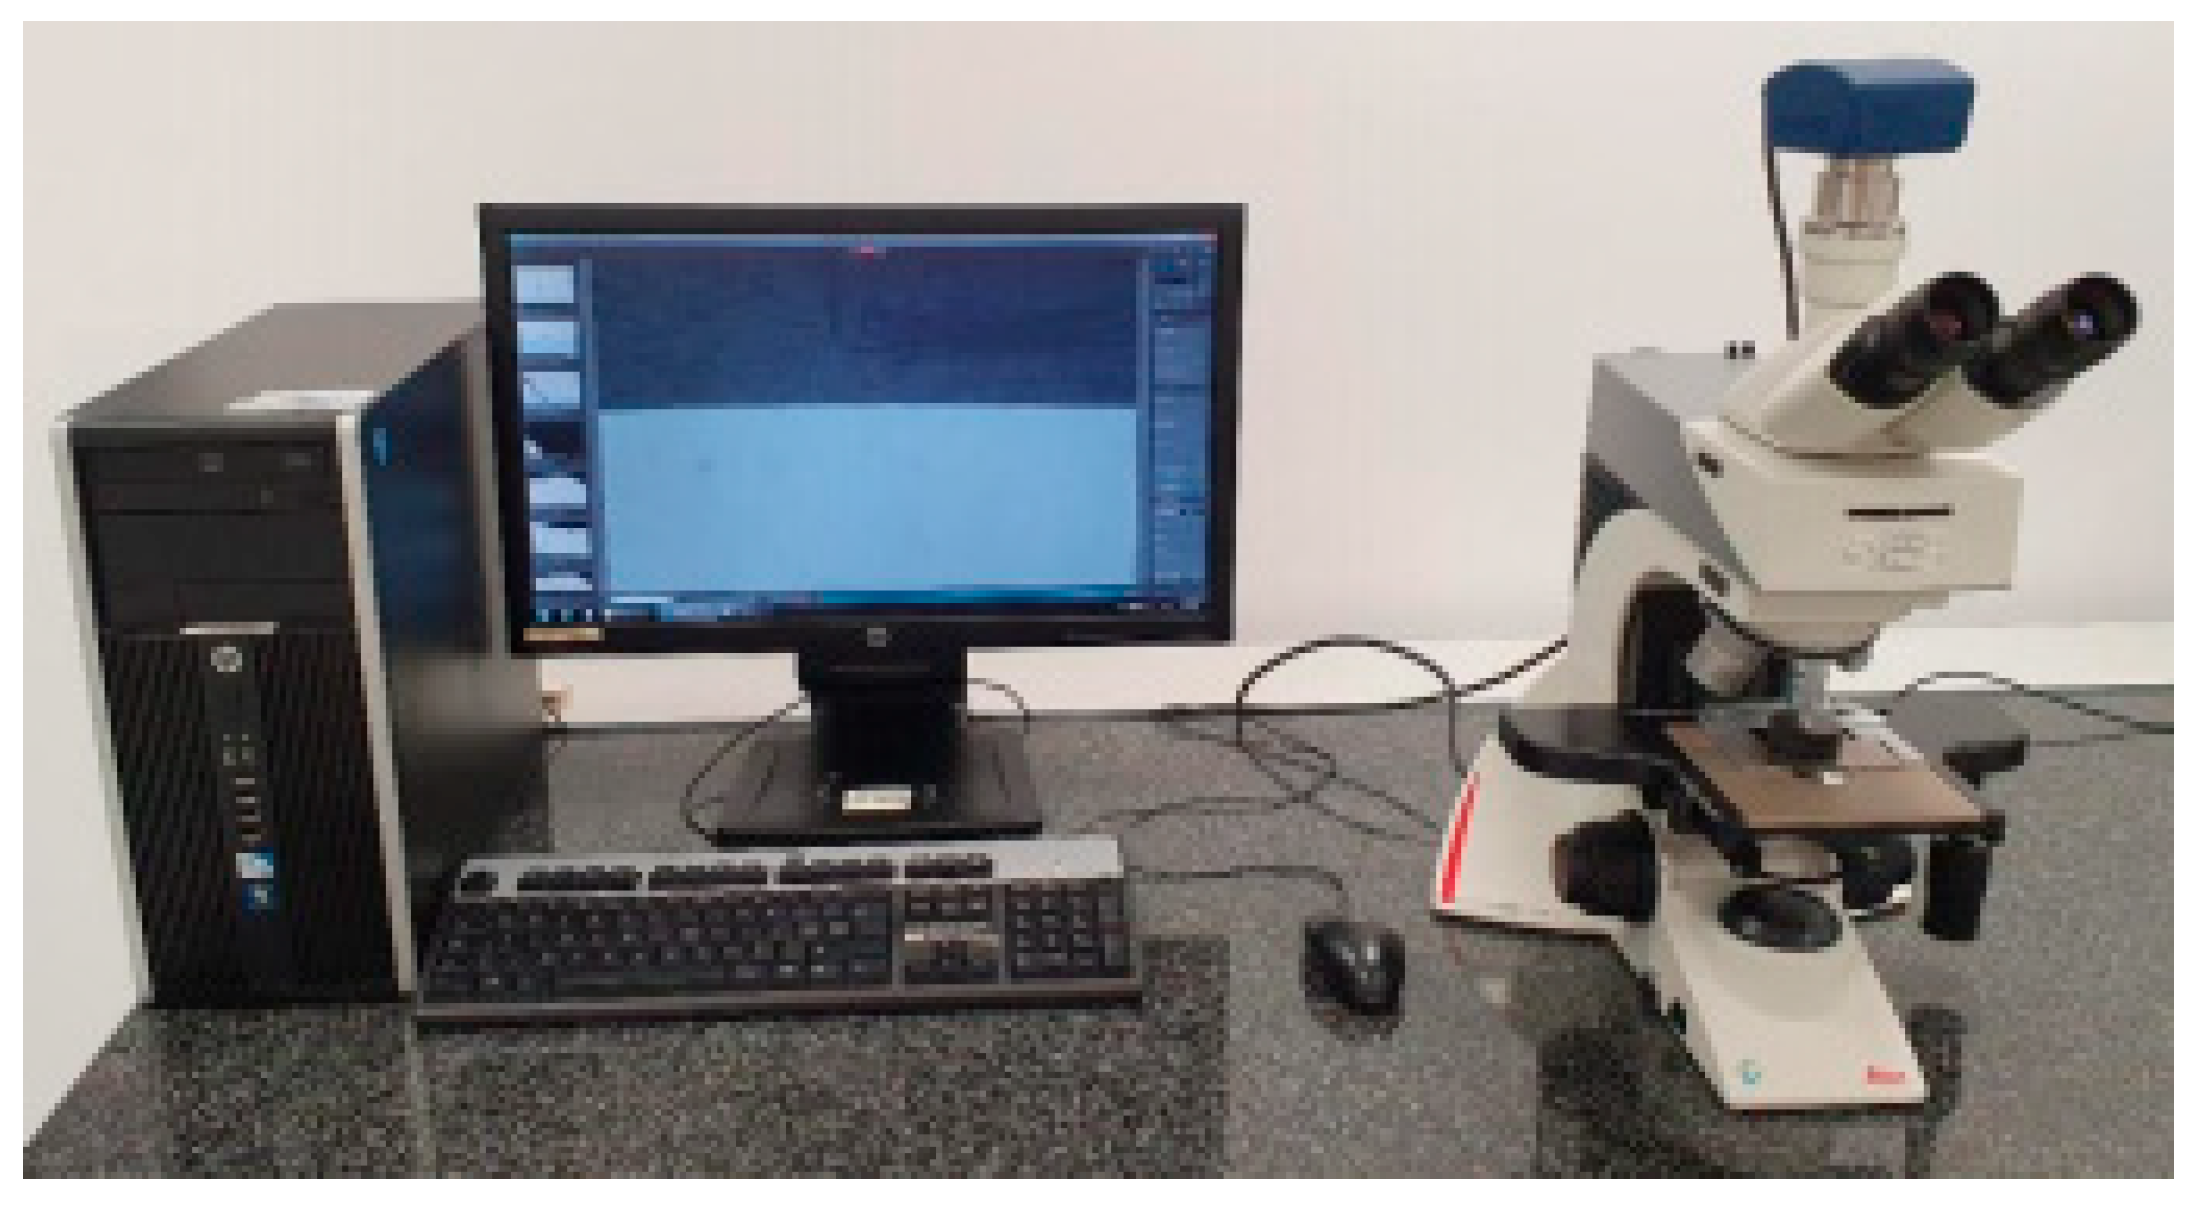
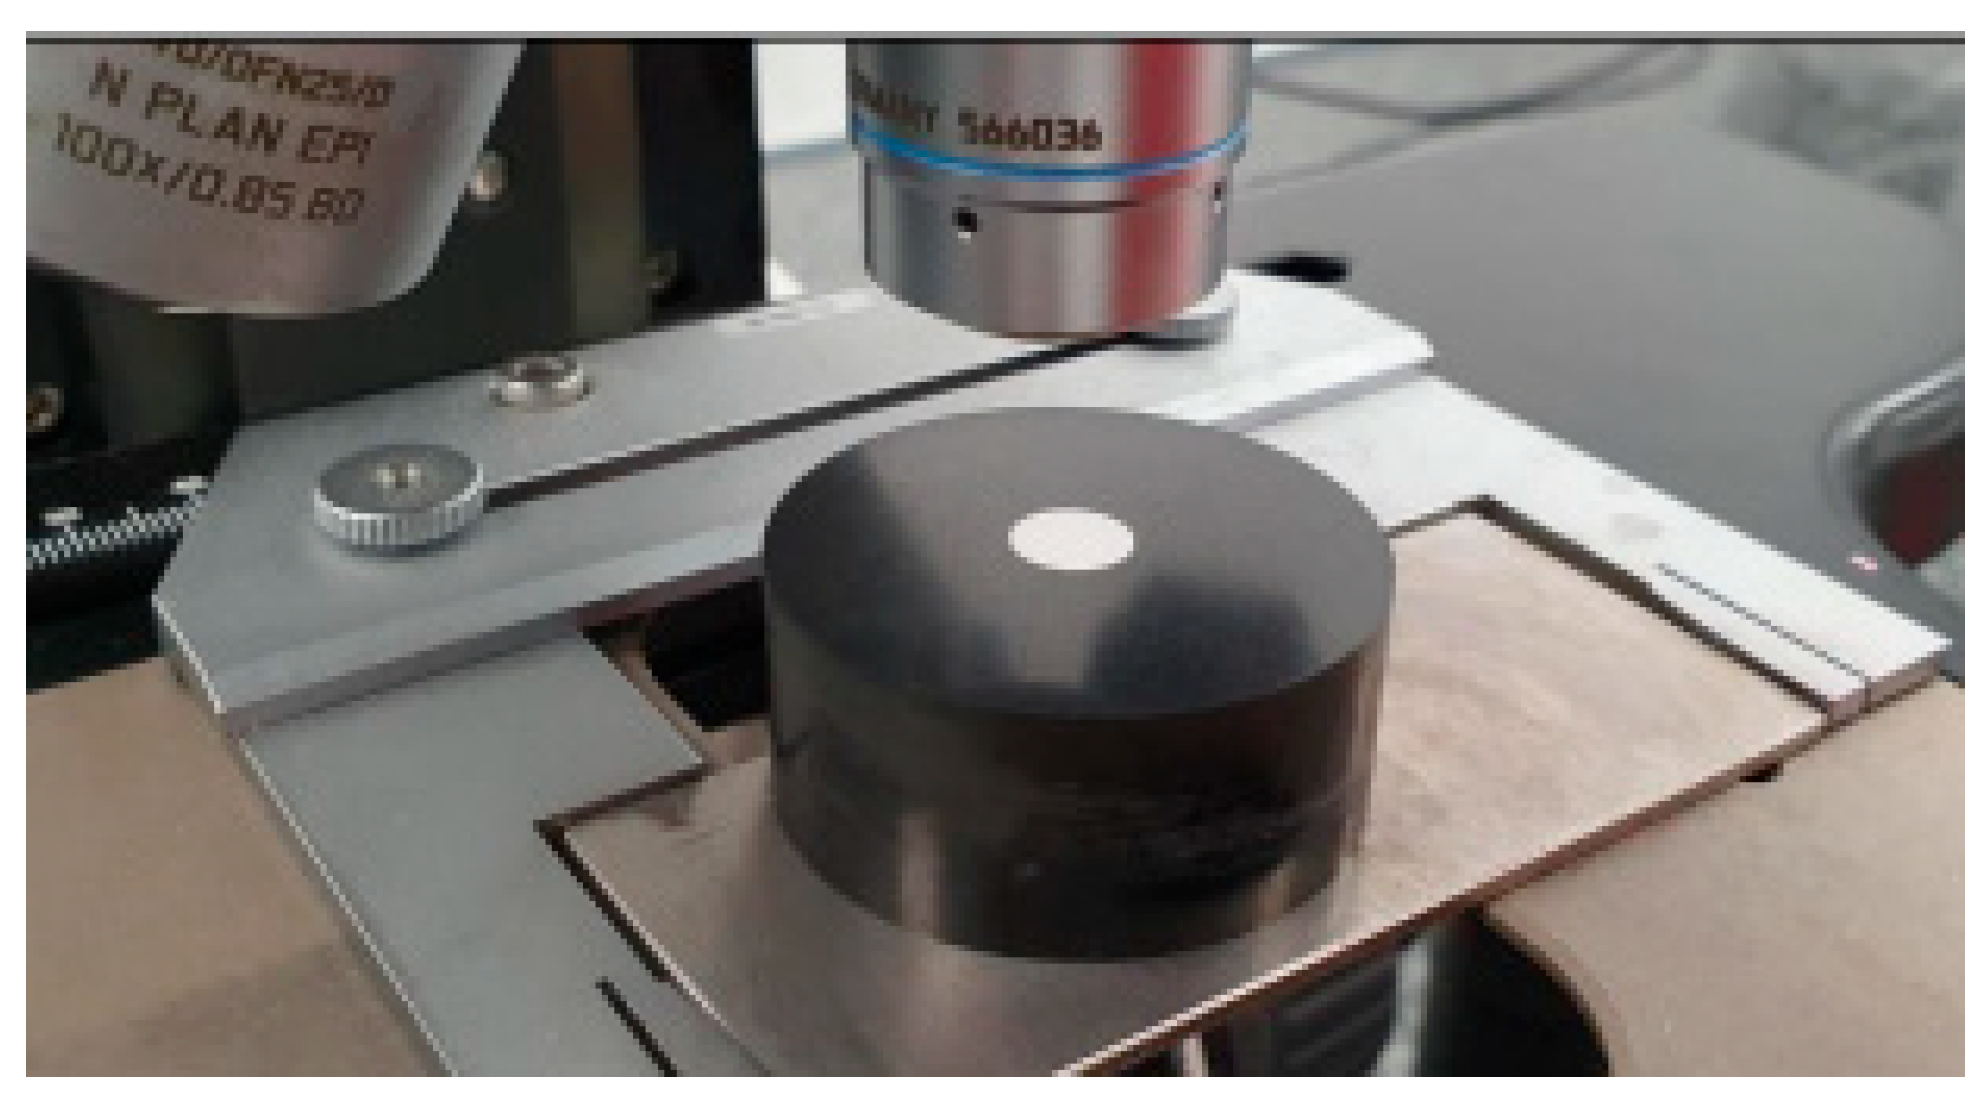
The equipment used was a LEICA DM2700M optical microscope (Leica Microsystems GmbH, Wetzlar, Germany). (
Figure 5). This microscope is equipped with an achromatic lens, providing magnification from 5× to 100× and a field of view of 22 mm.
The first step in determining the metallographic structure consisted of etching the samples with an acid mixture of the following composition:
- -
100 mL 36.5% hydrochloric acid (HCl) (SILAL TRADING SRL, Bucharest, Romania);
- -
100 mL distilled water;
- -
10 mL 63% nitric acid (HNO3) (SILAL TRADING SRL, Bucharest, Romania).
For the actual etching process, the reagent was heated in a Berzelius beaker to approximately 65 °C using an electric hotplate, after which the samples were immersed in the Berzelius beaker one by one and held for 10 s. The etching was deemed successful when the surface of the samples became matte. After etching, the samples were rinsed under running water, rinsed with isopropyl alcohol, and dried using a hot air gun.
To prevent any inhalation of chemical vapours, the chemical etching process was carried out using a fume cupboard.
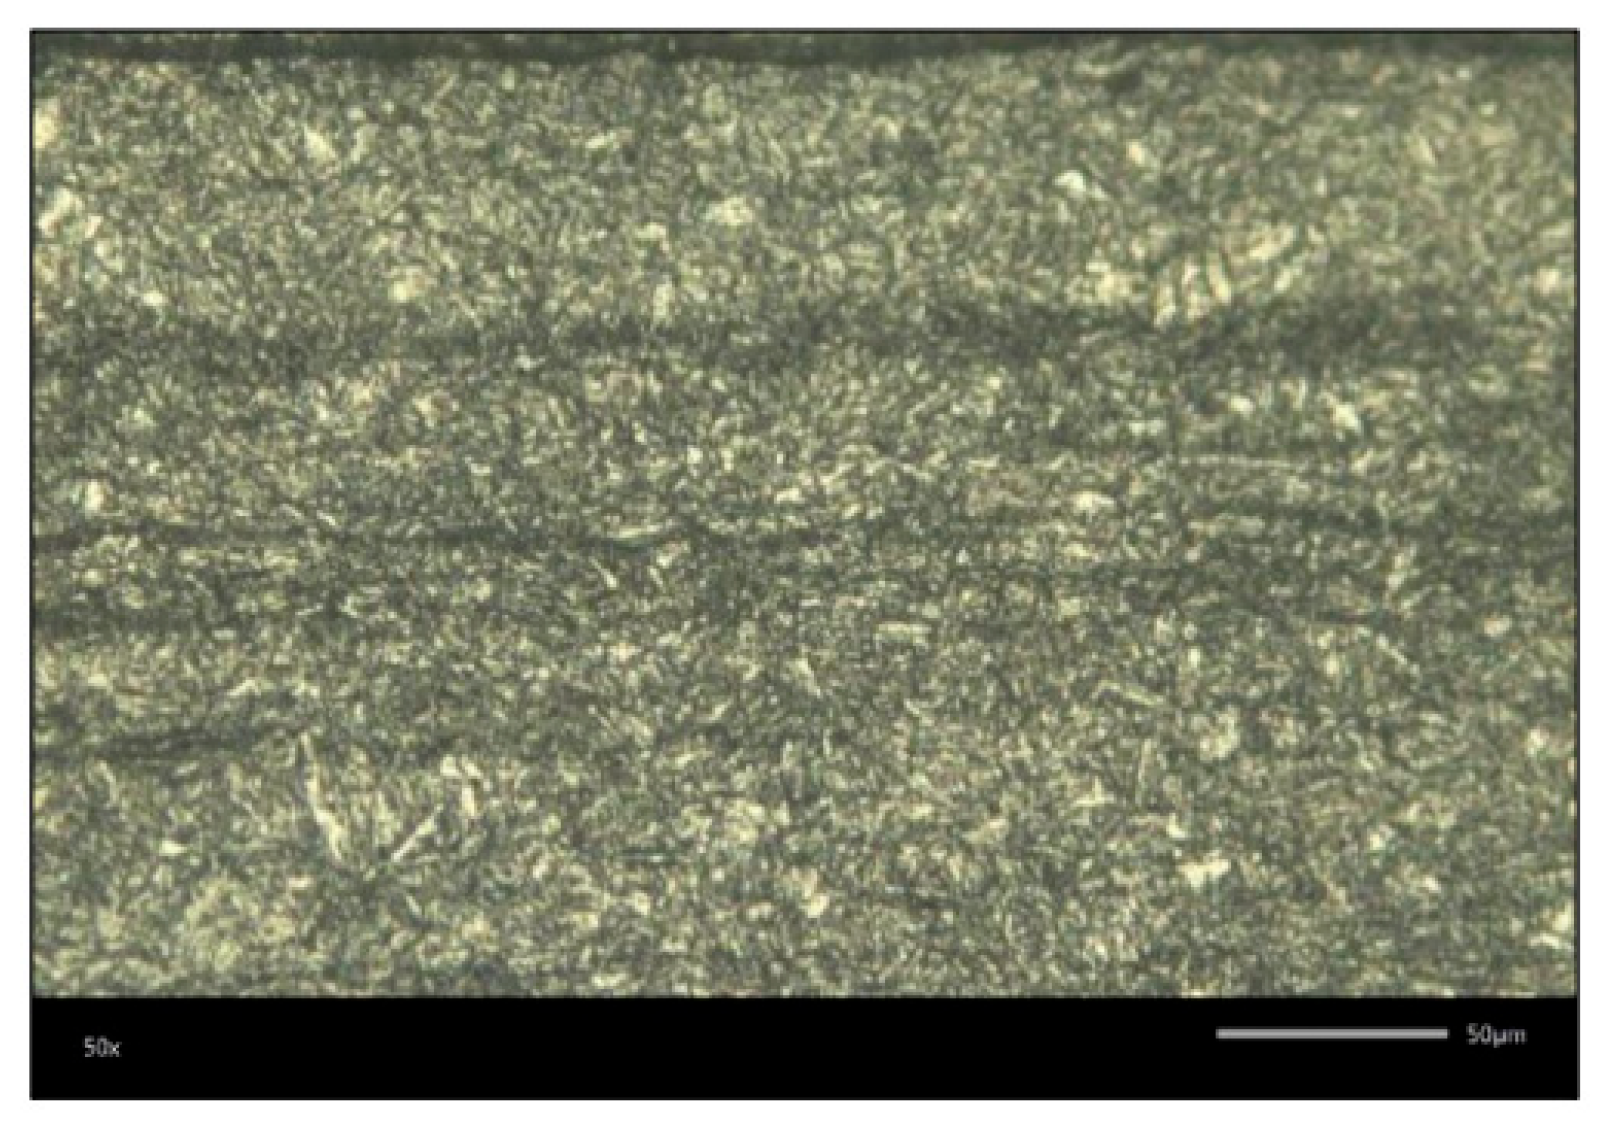
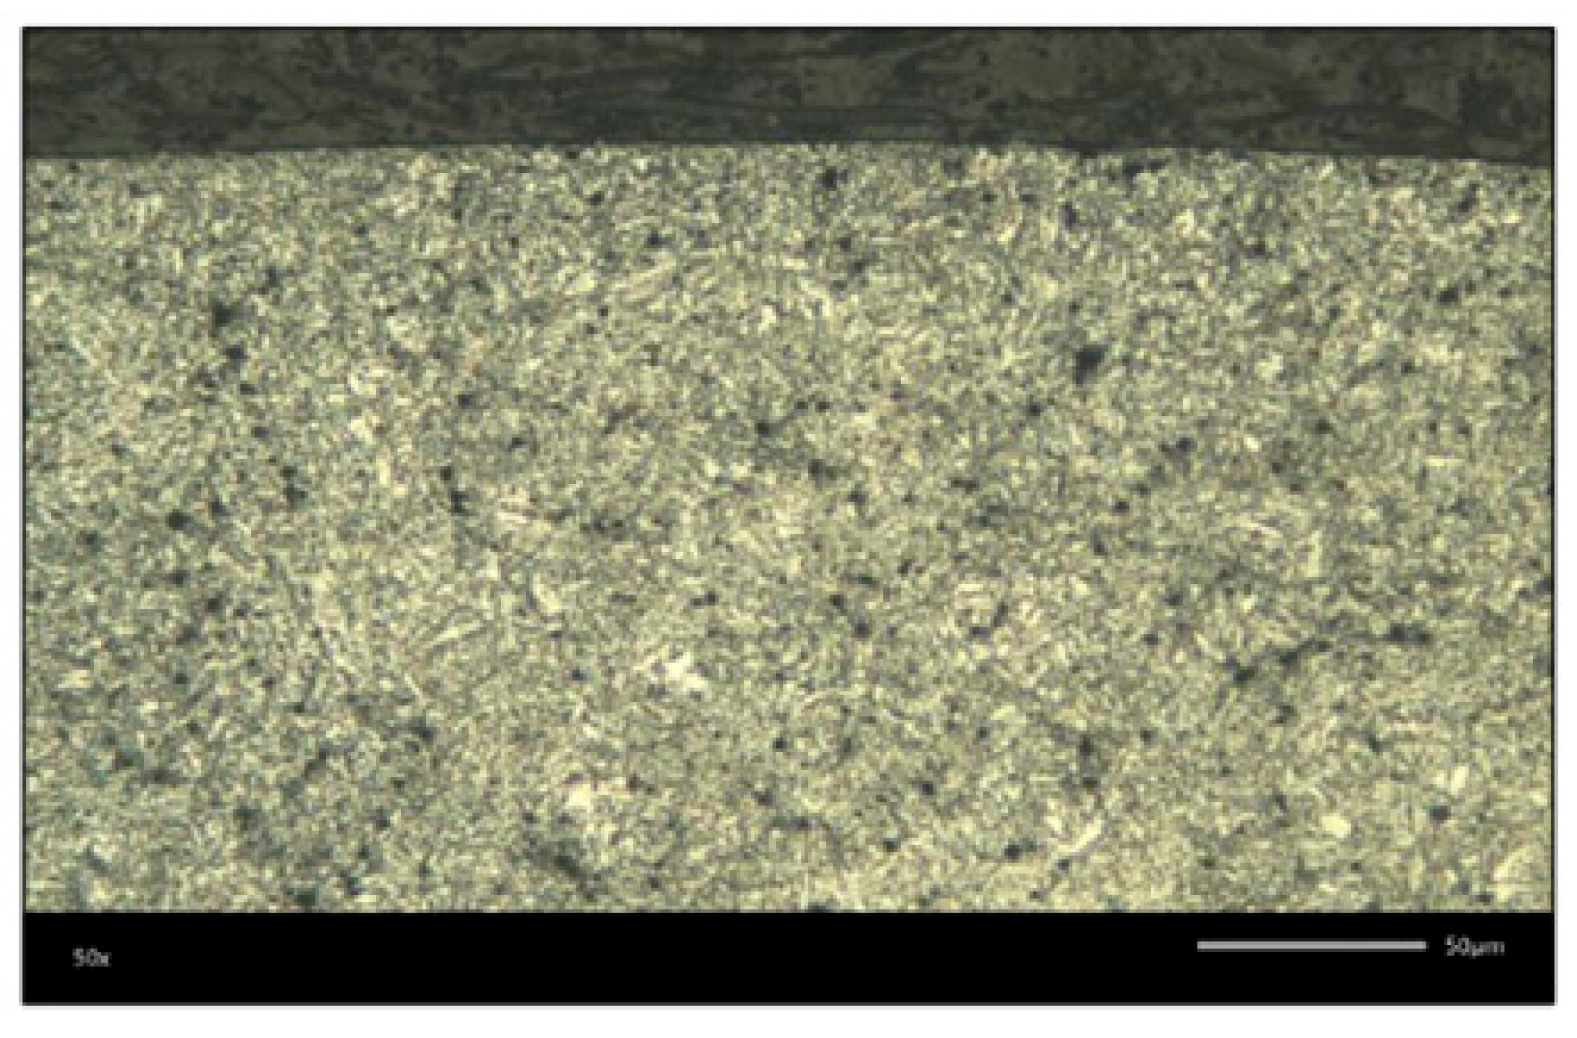
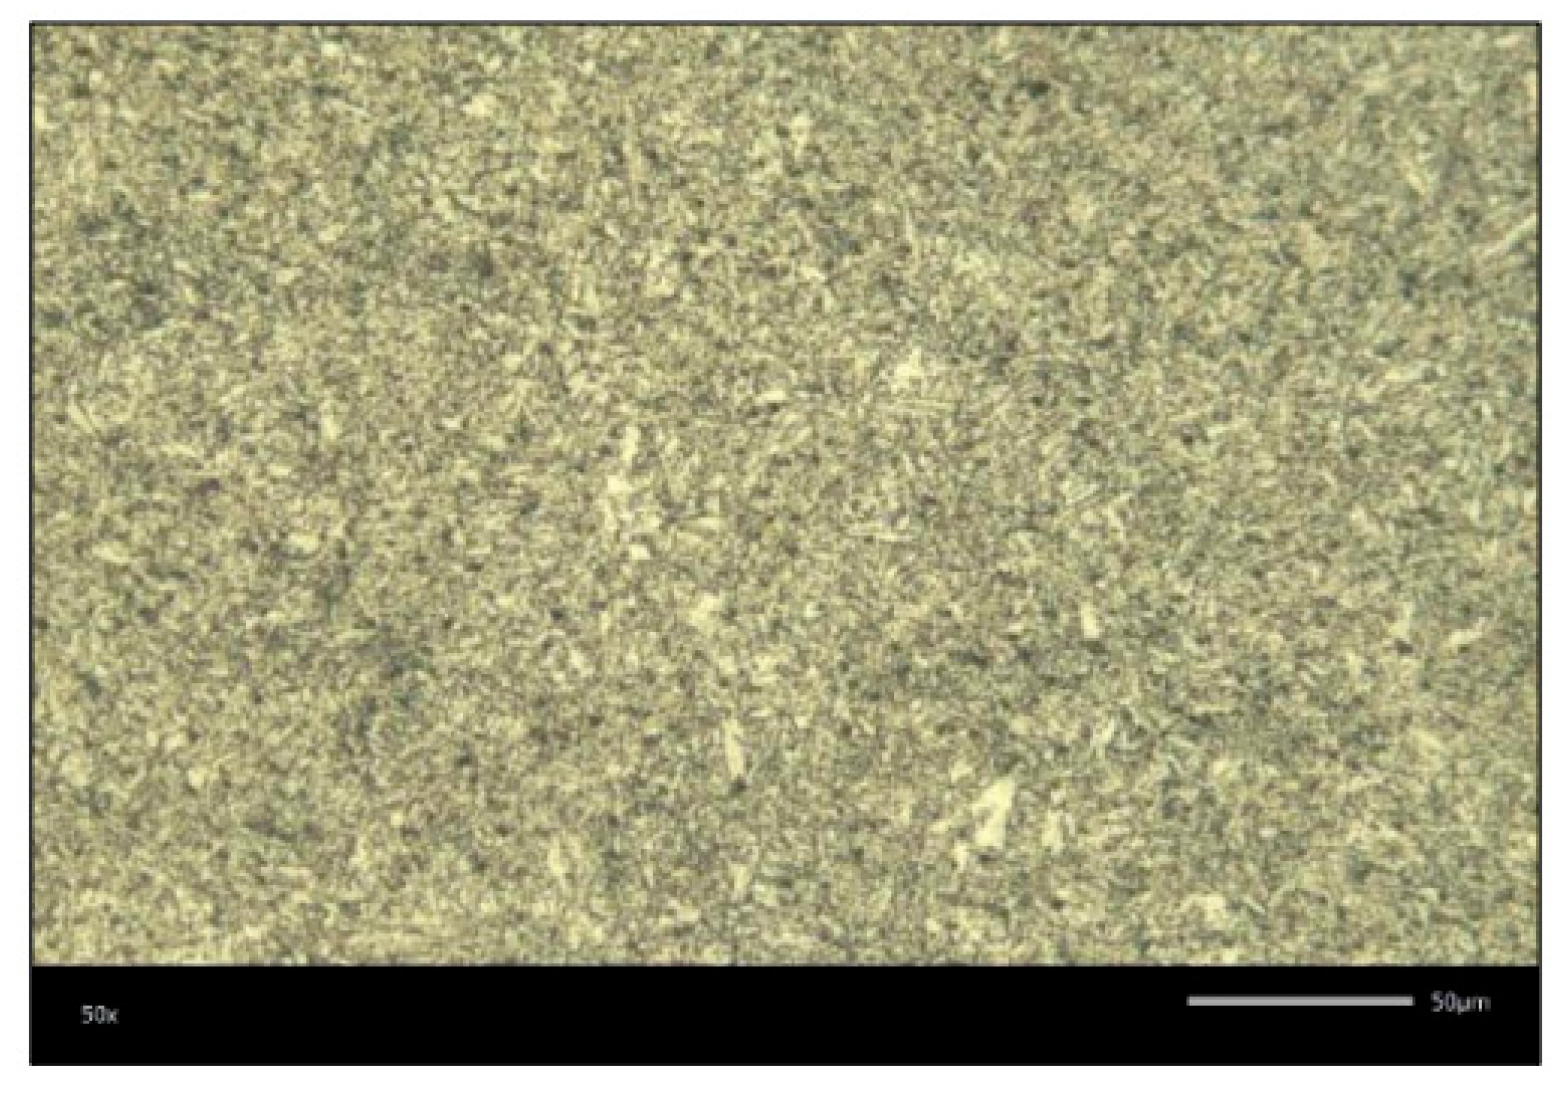
After etching, the samples were assessed under a LEICA DM2700M microscope (
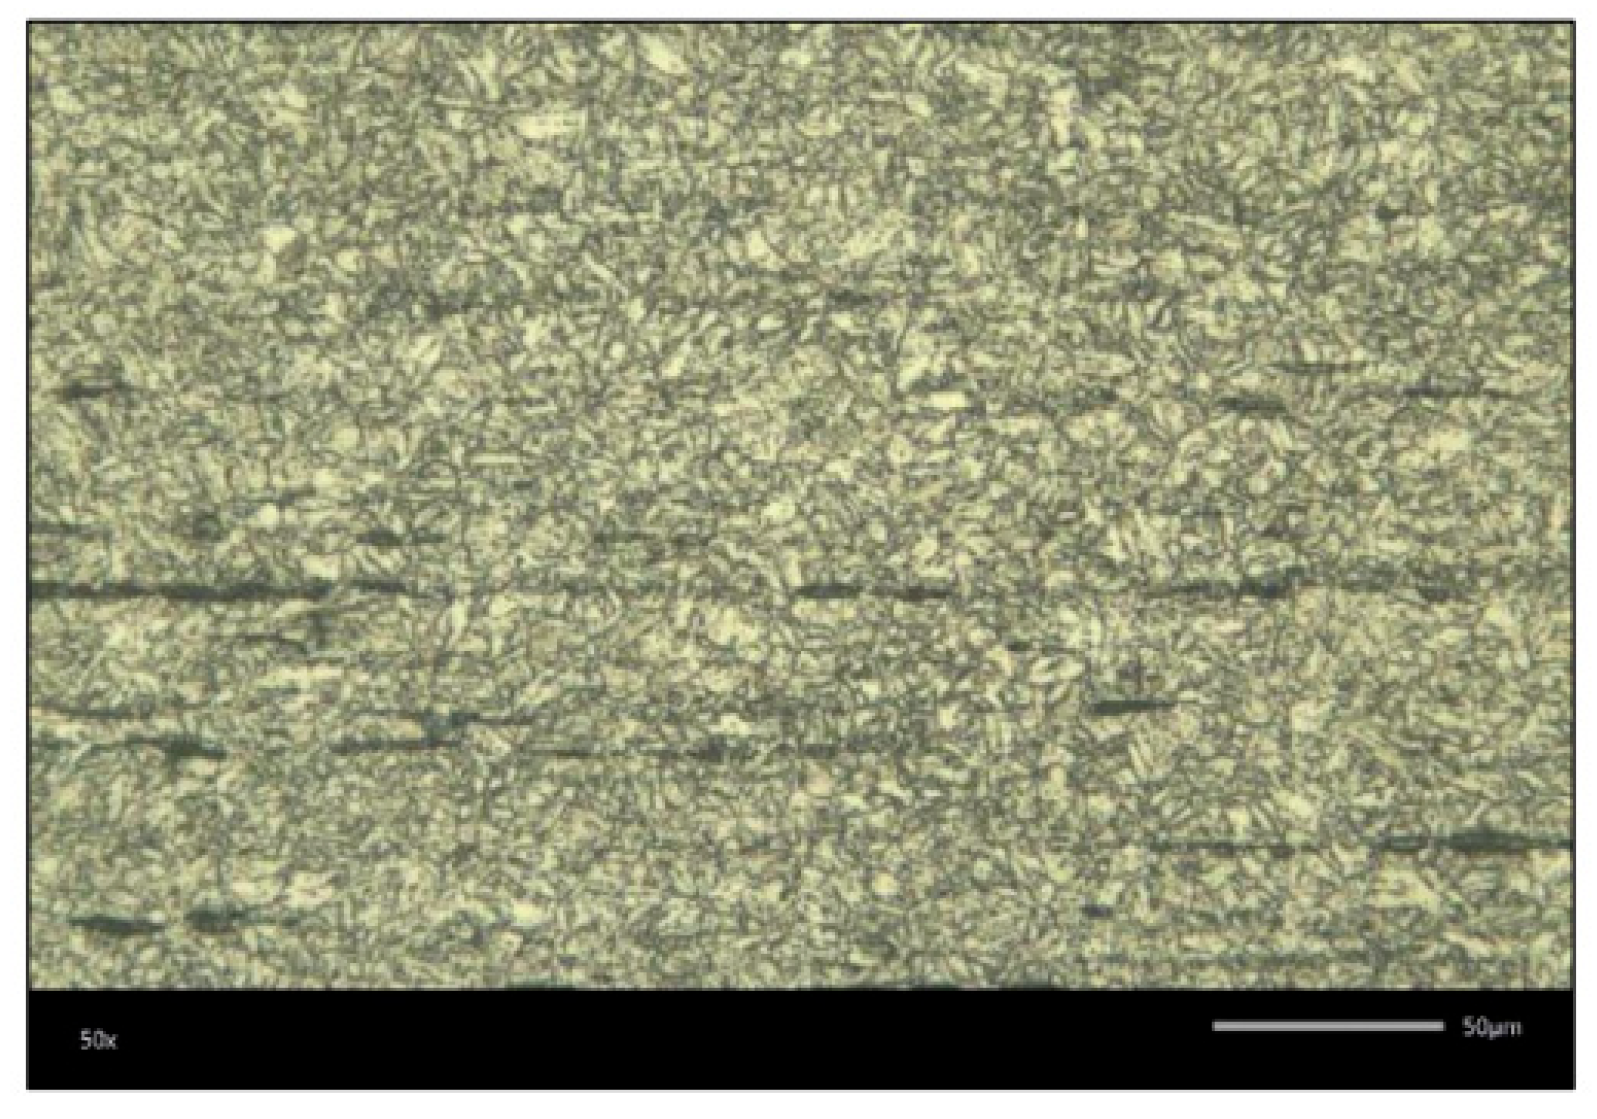
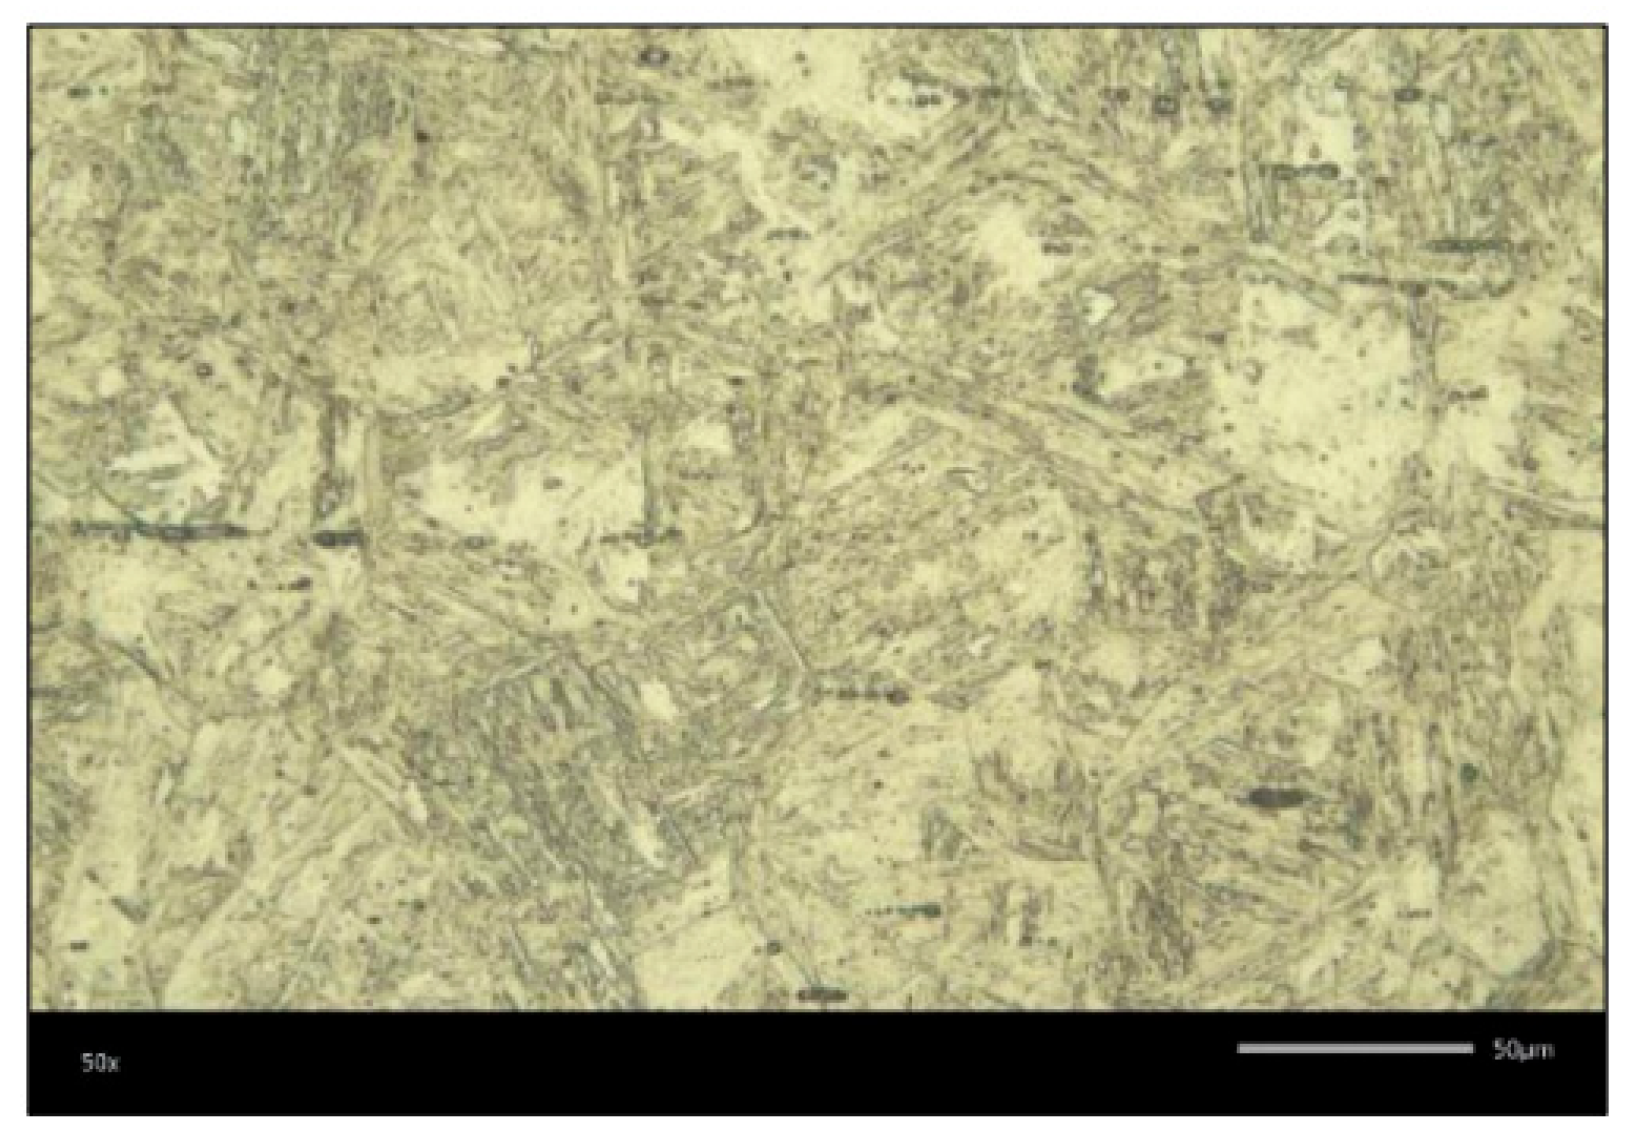
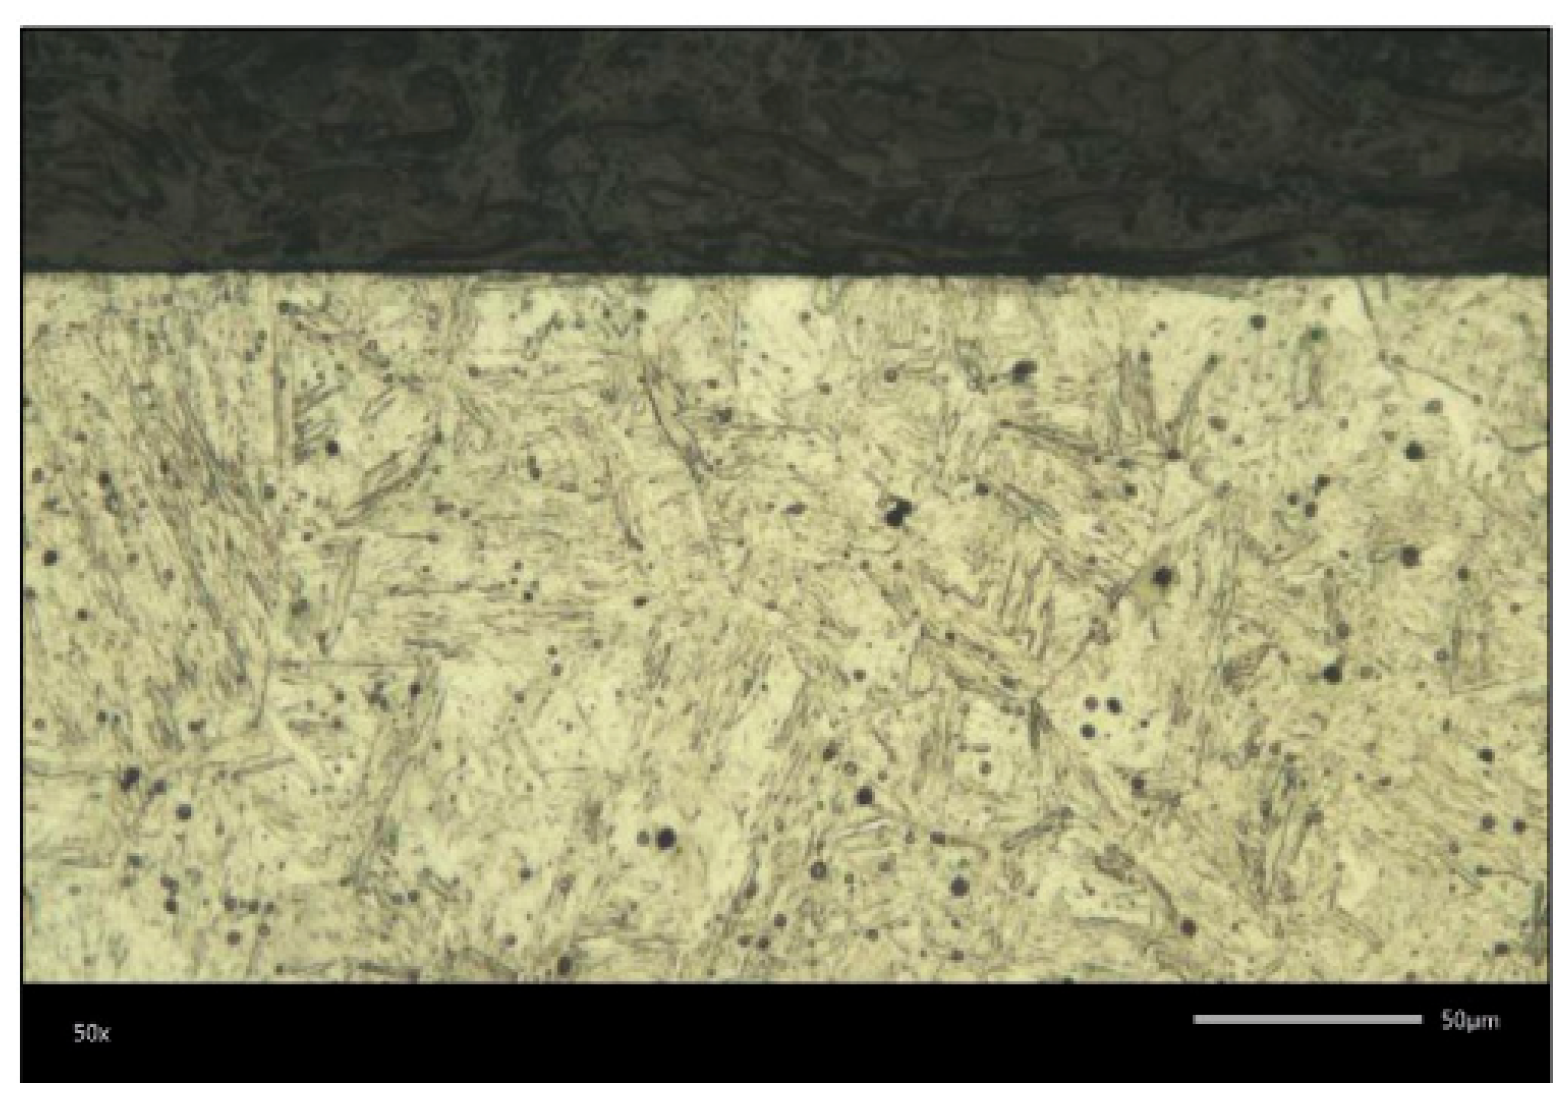
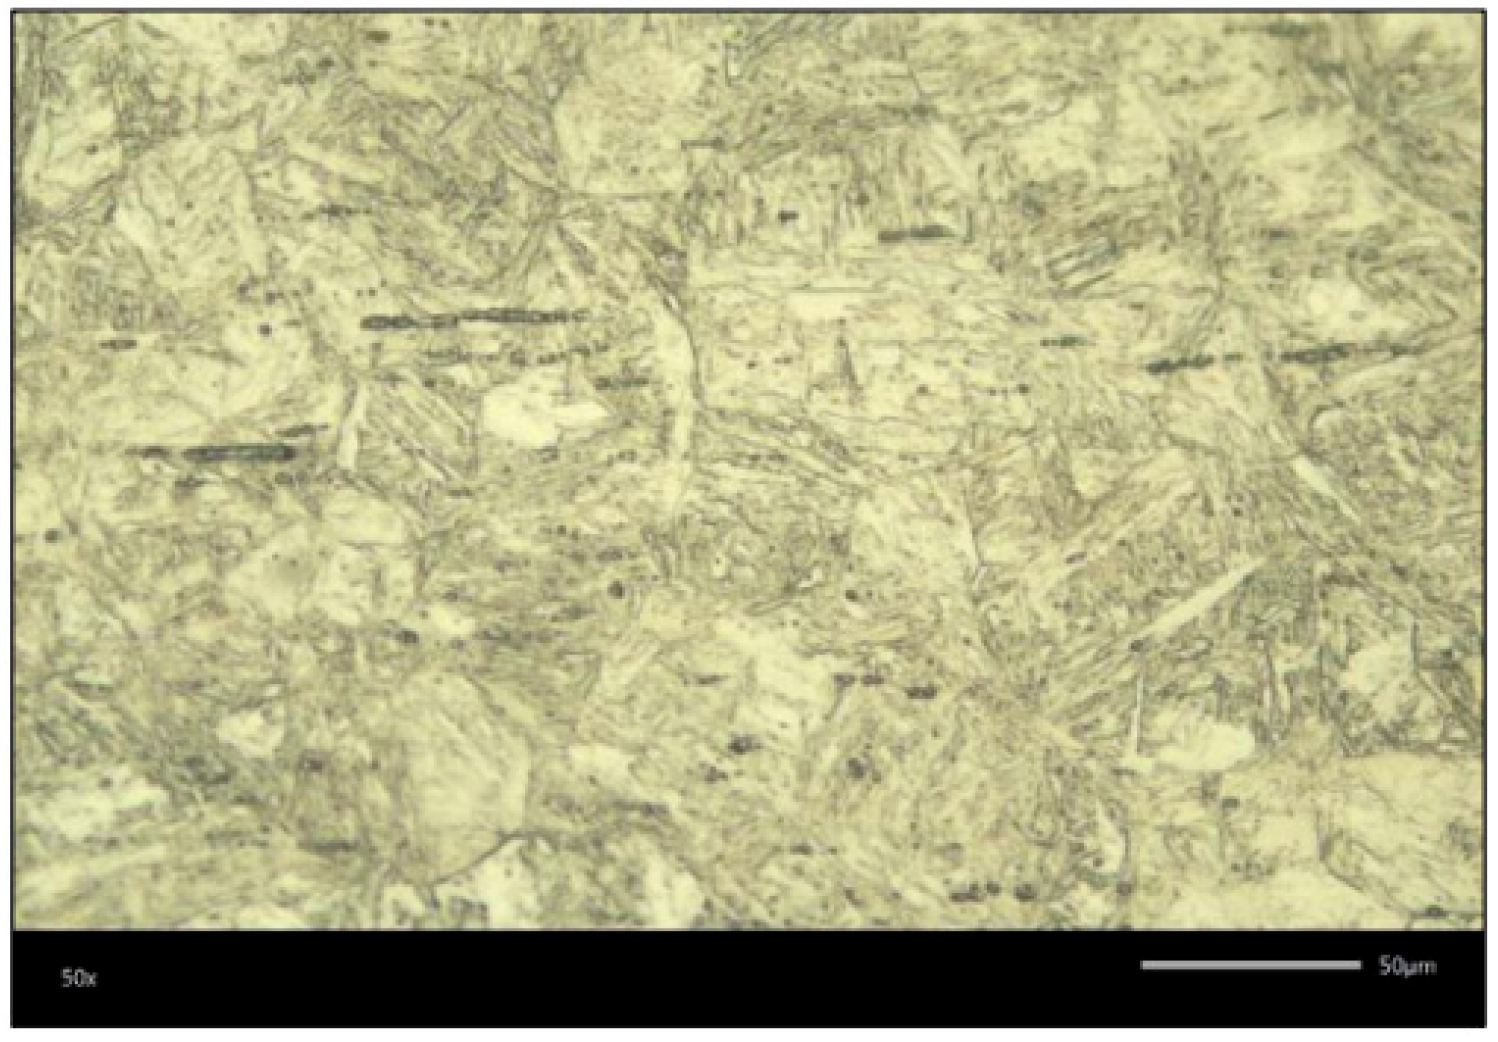
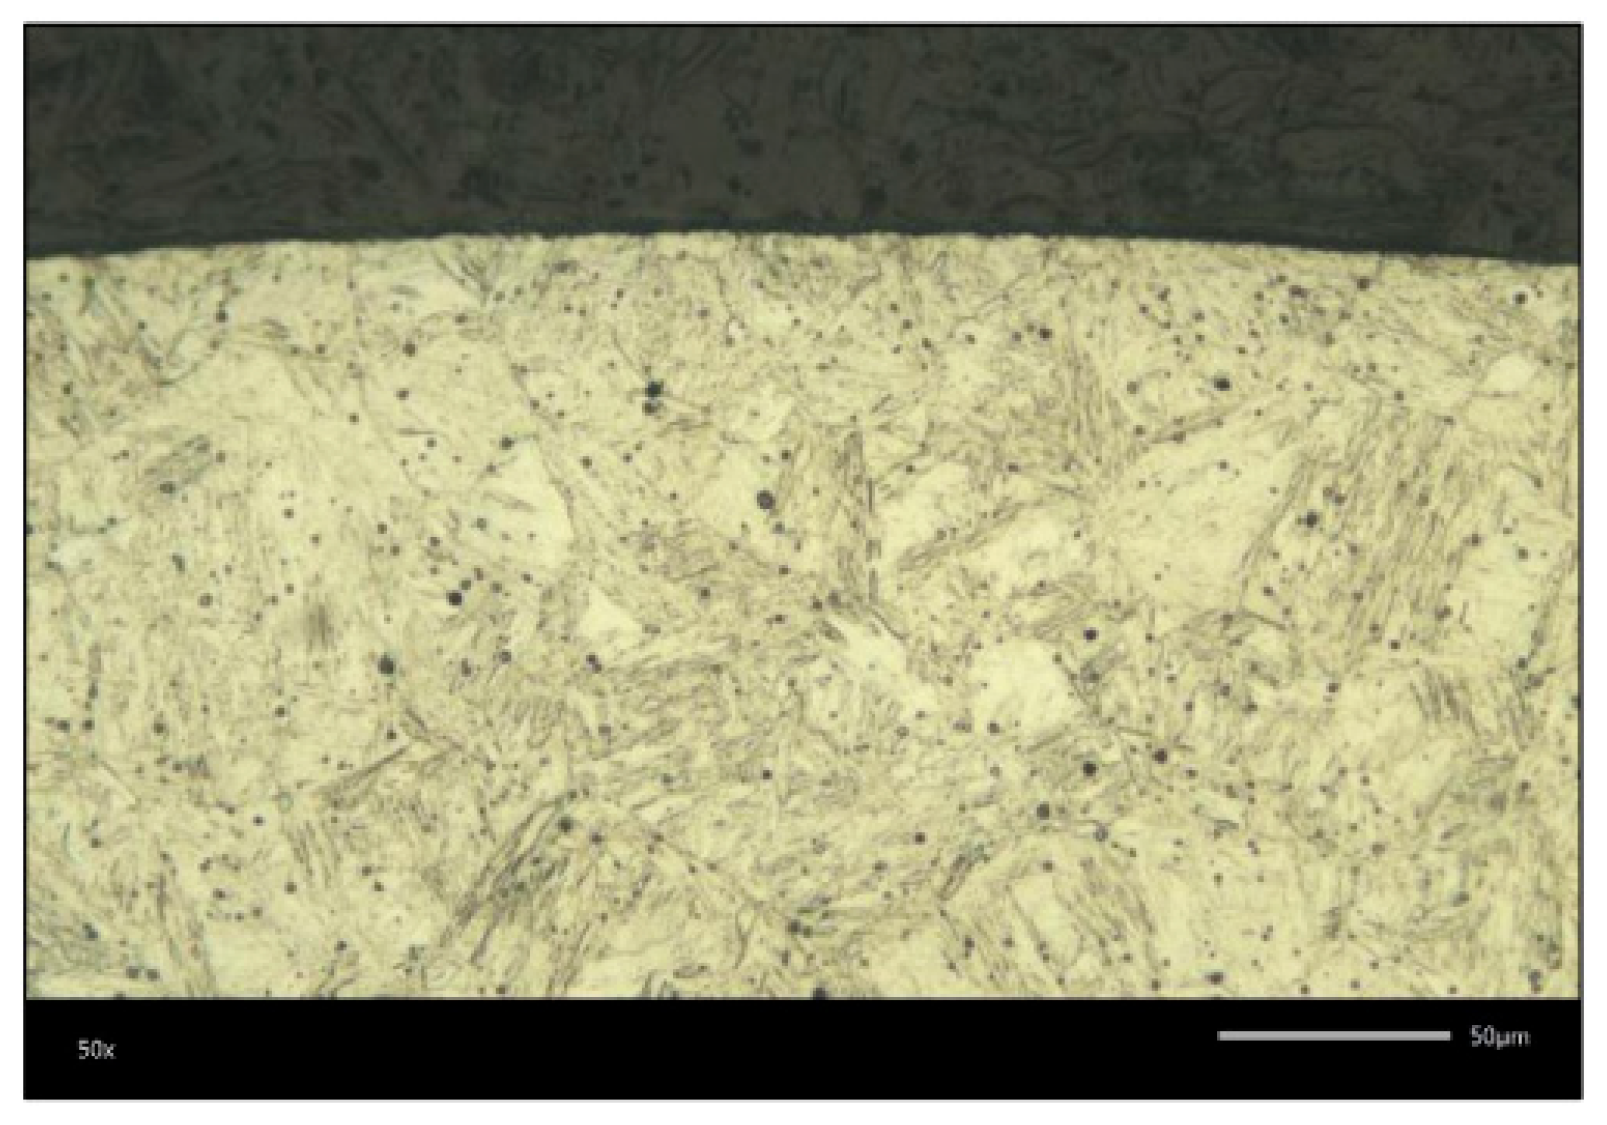
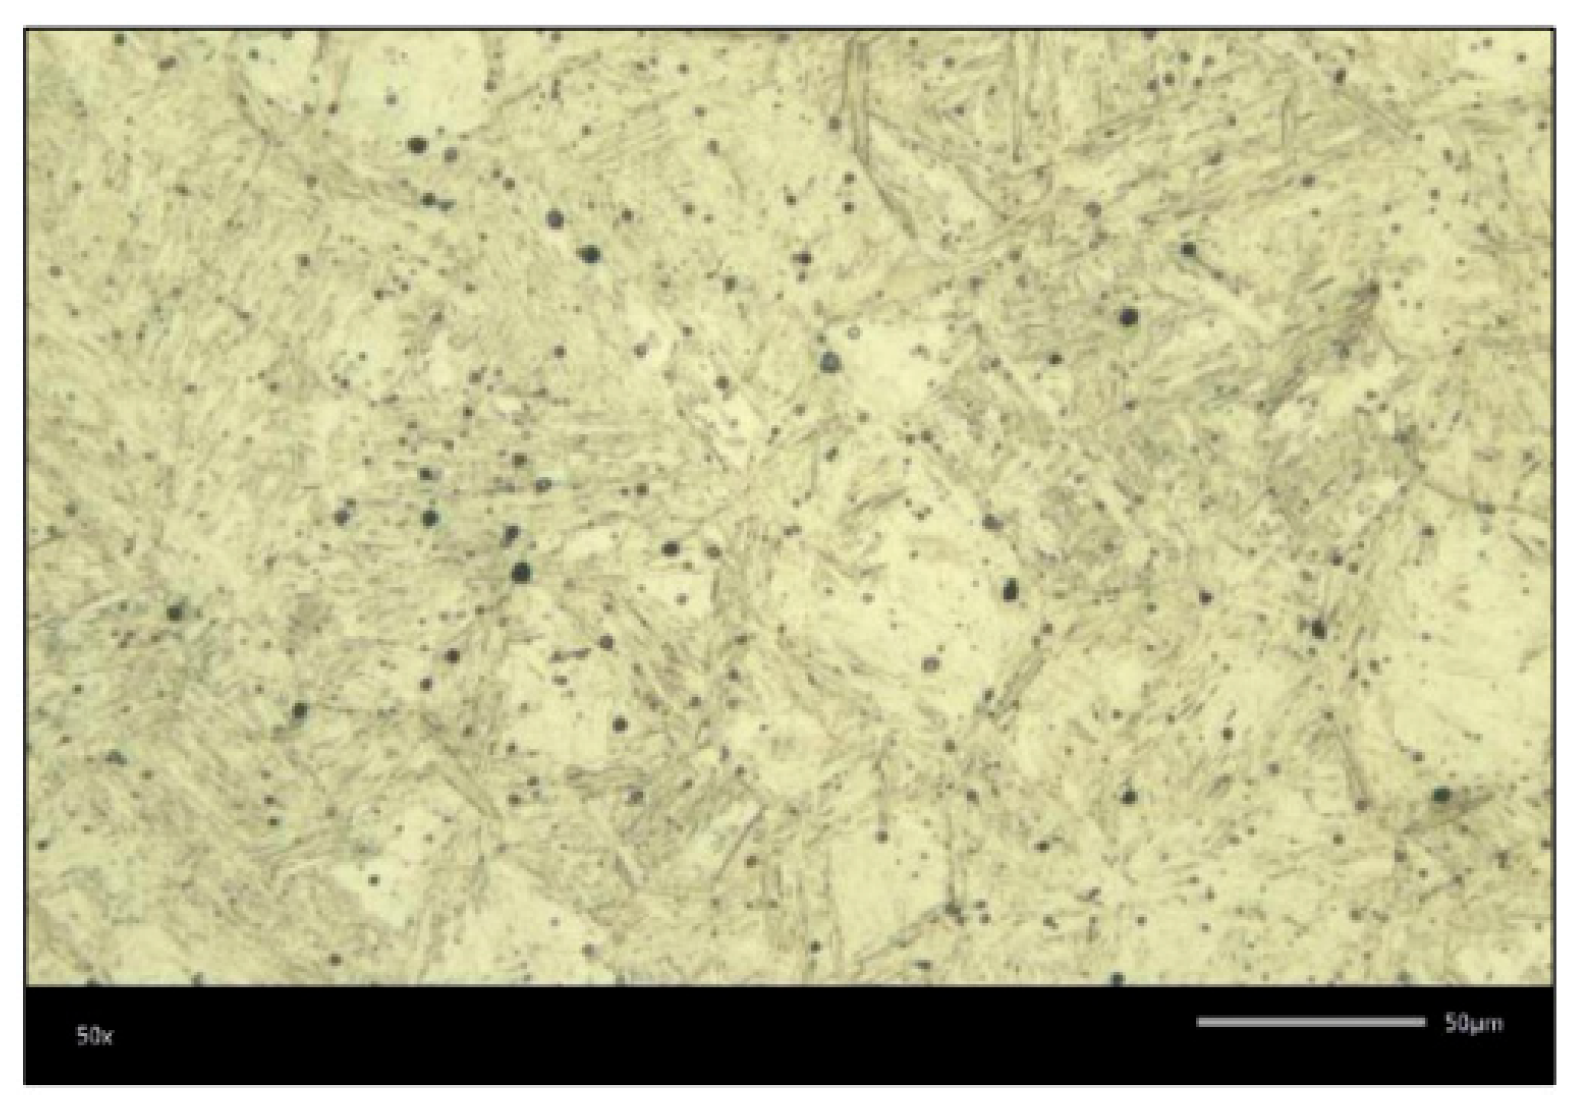
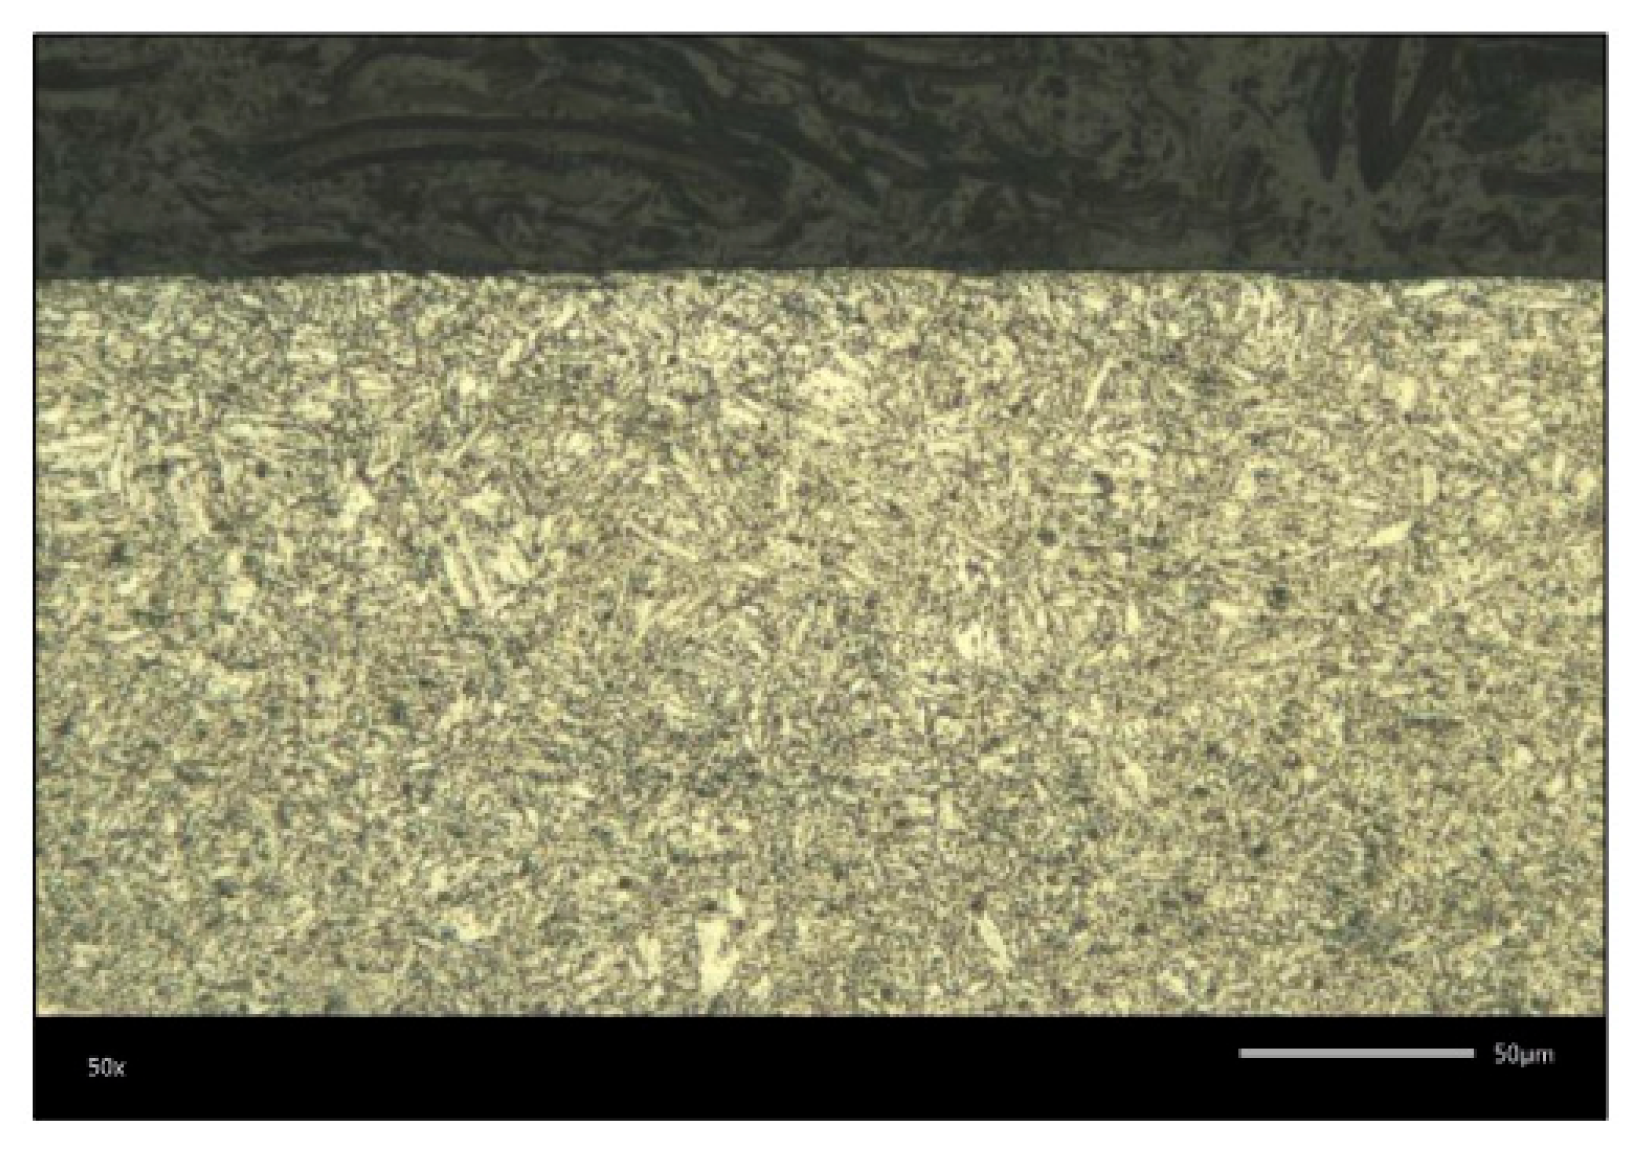
Figure 6) on two zones each (rod and head), both on the surface and in depth (in the core).
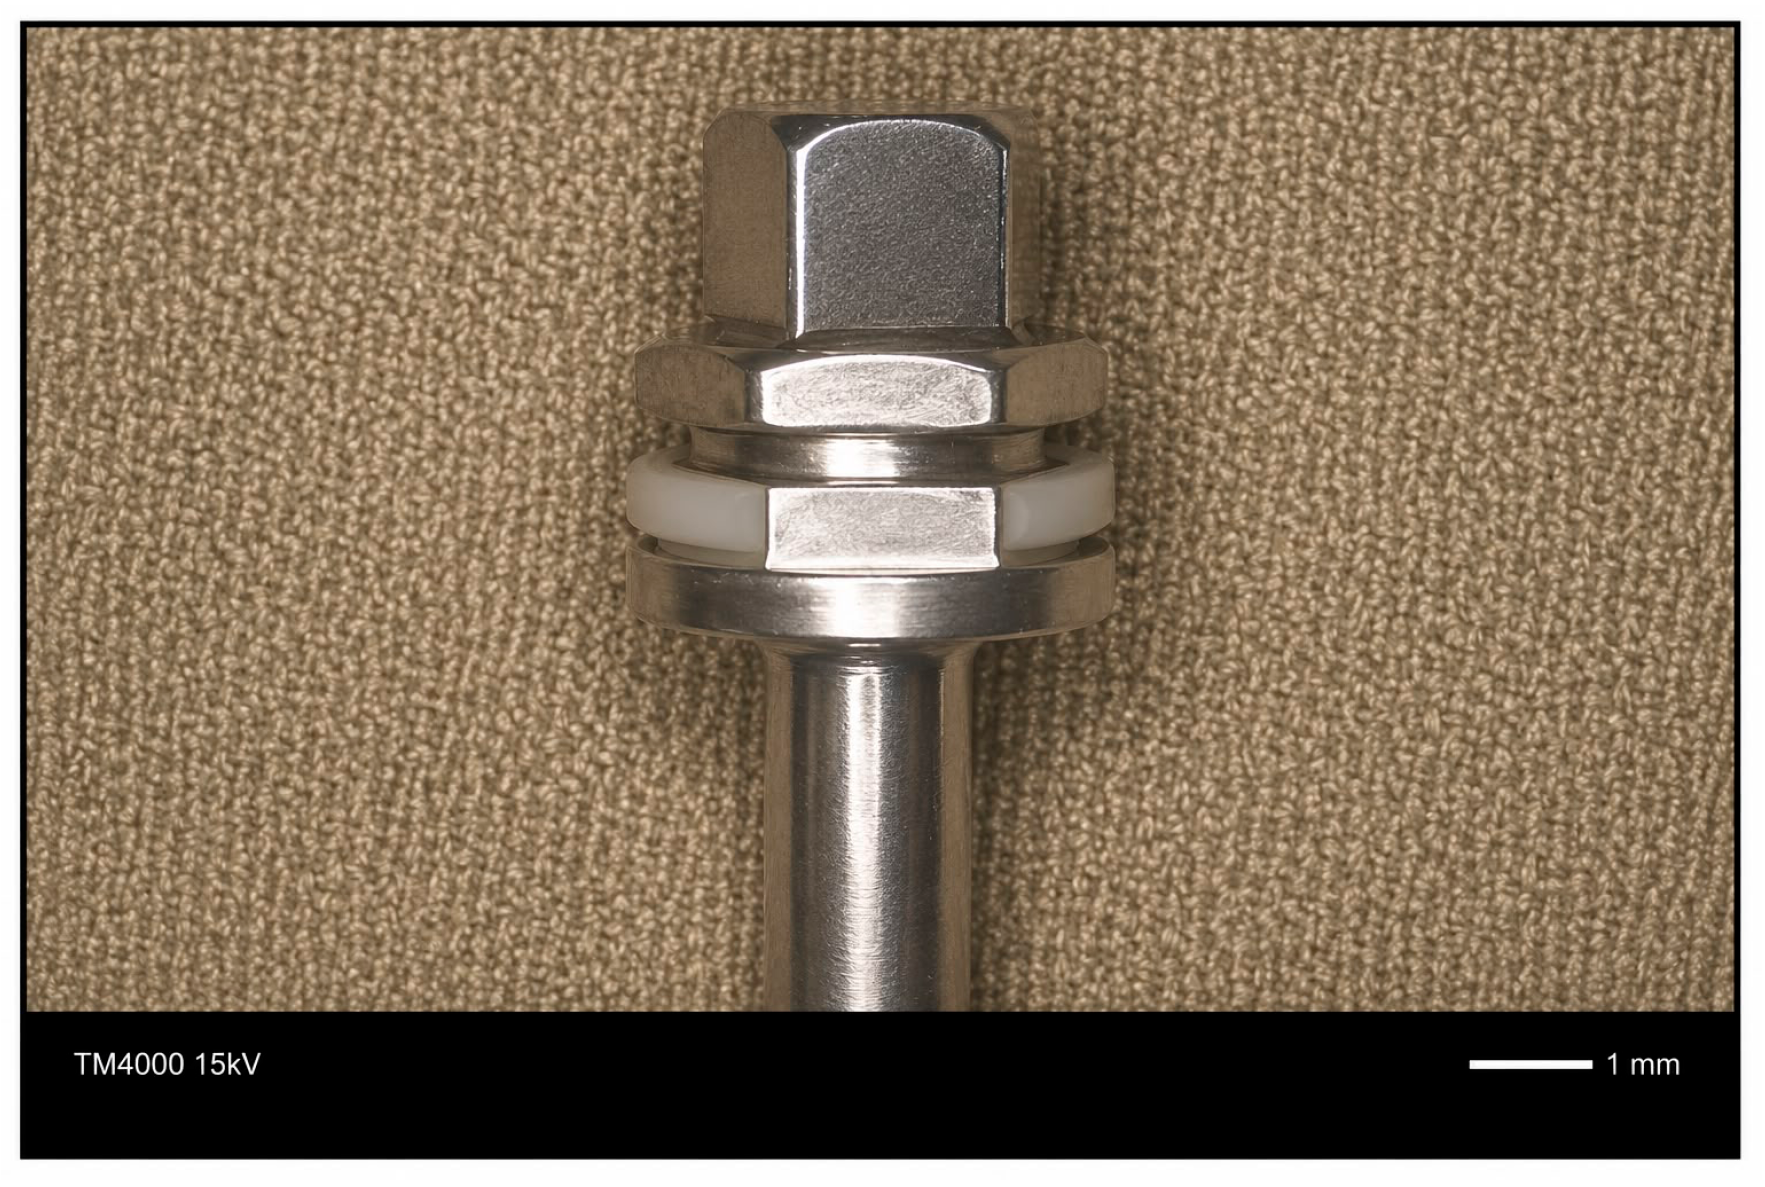
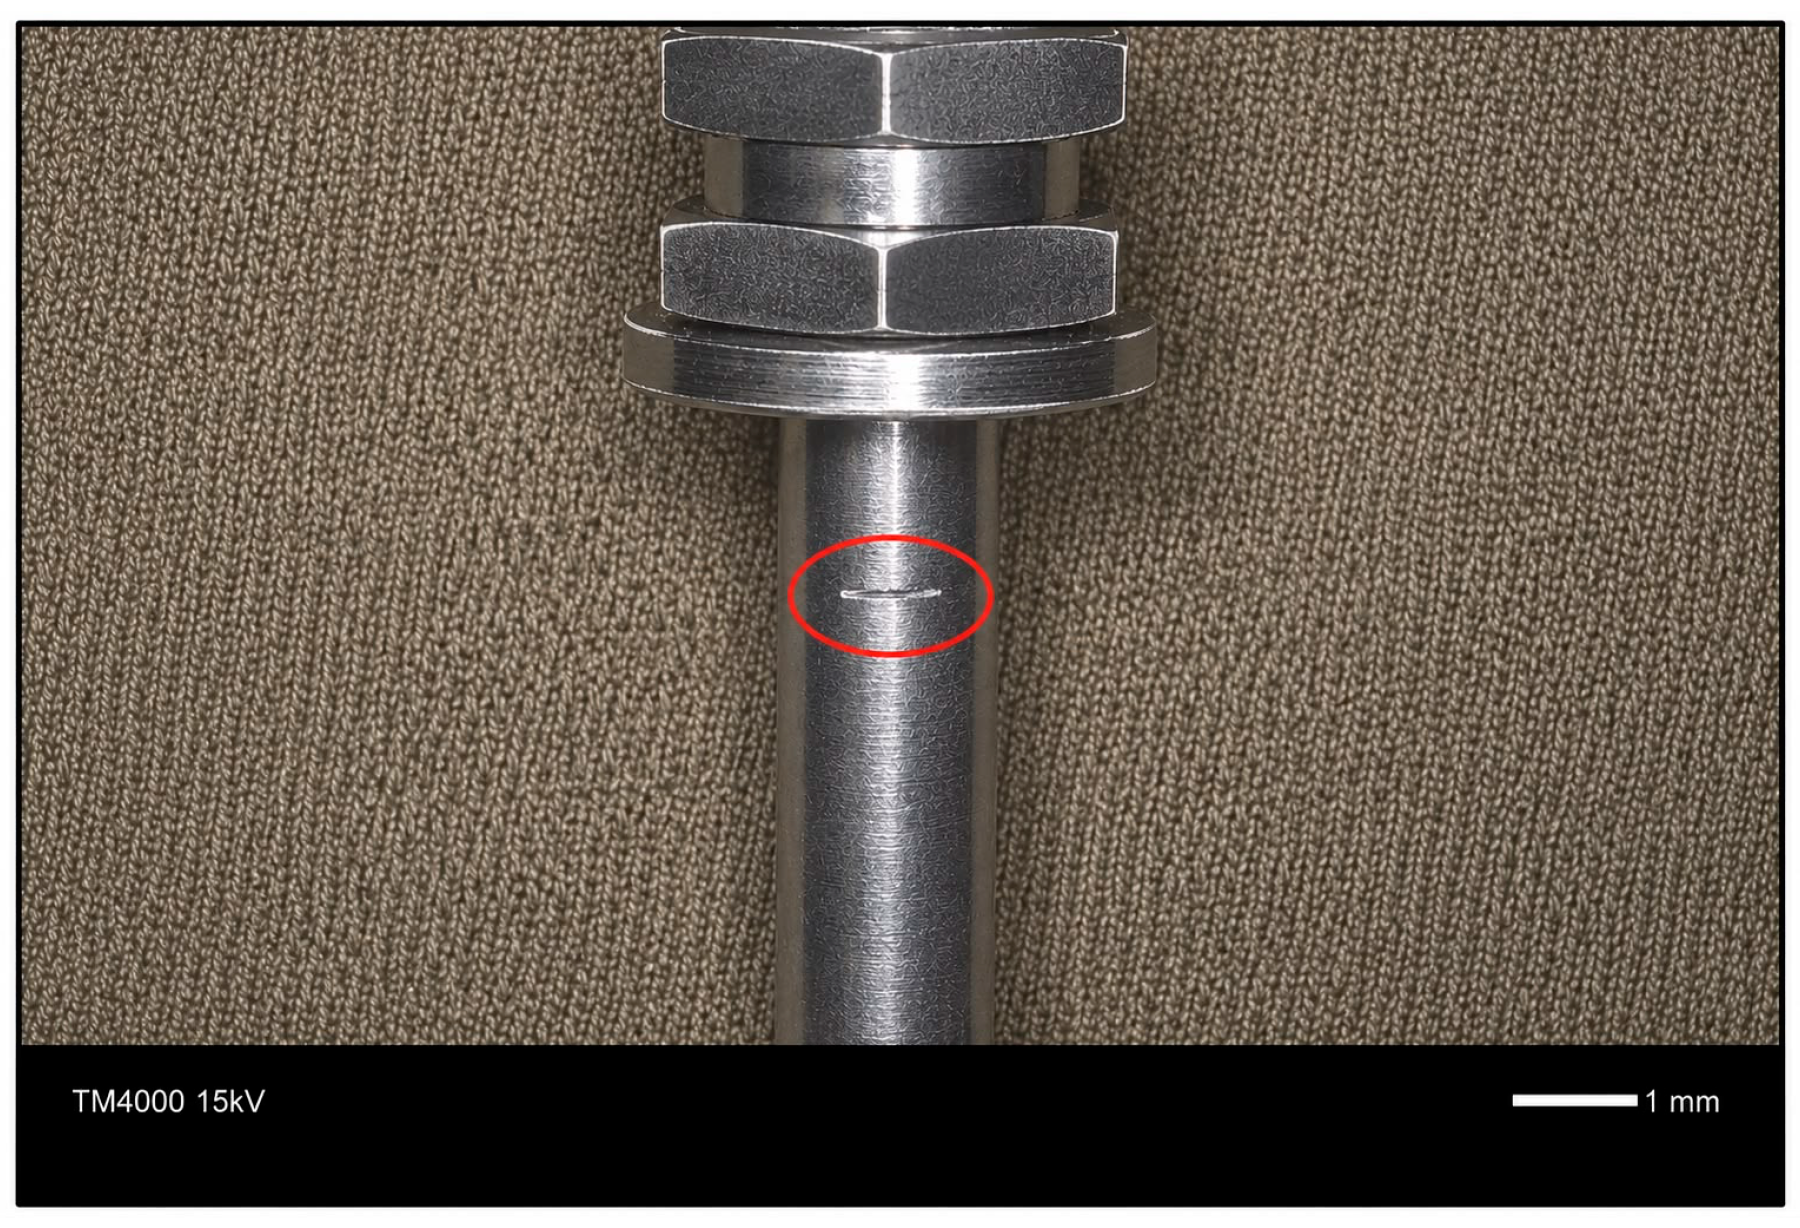
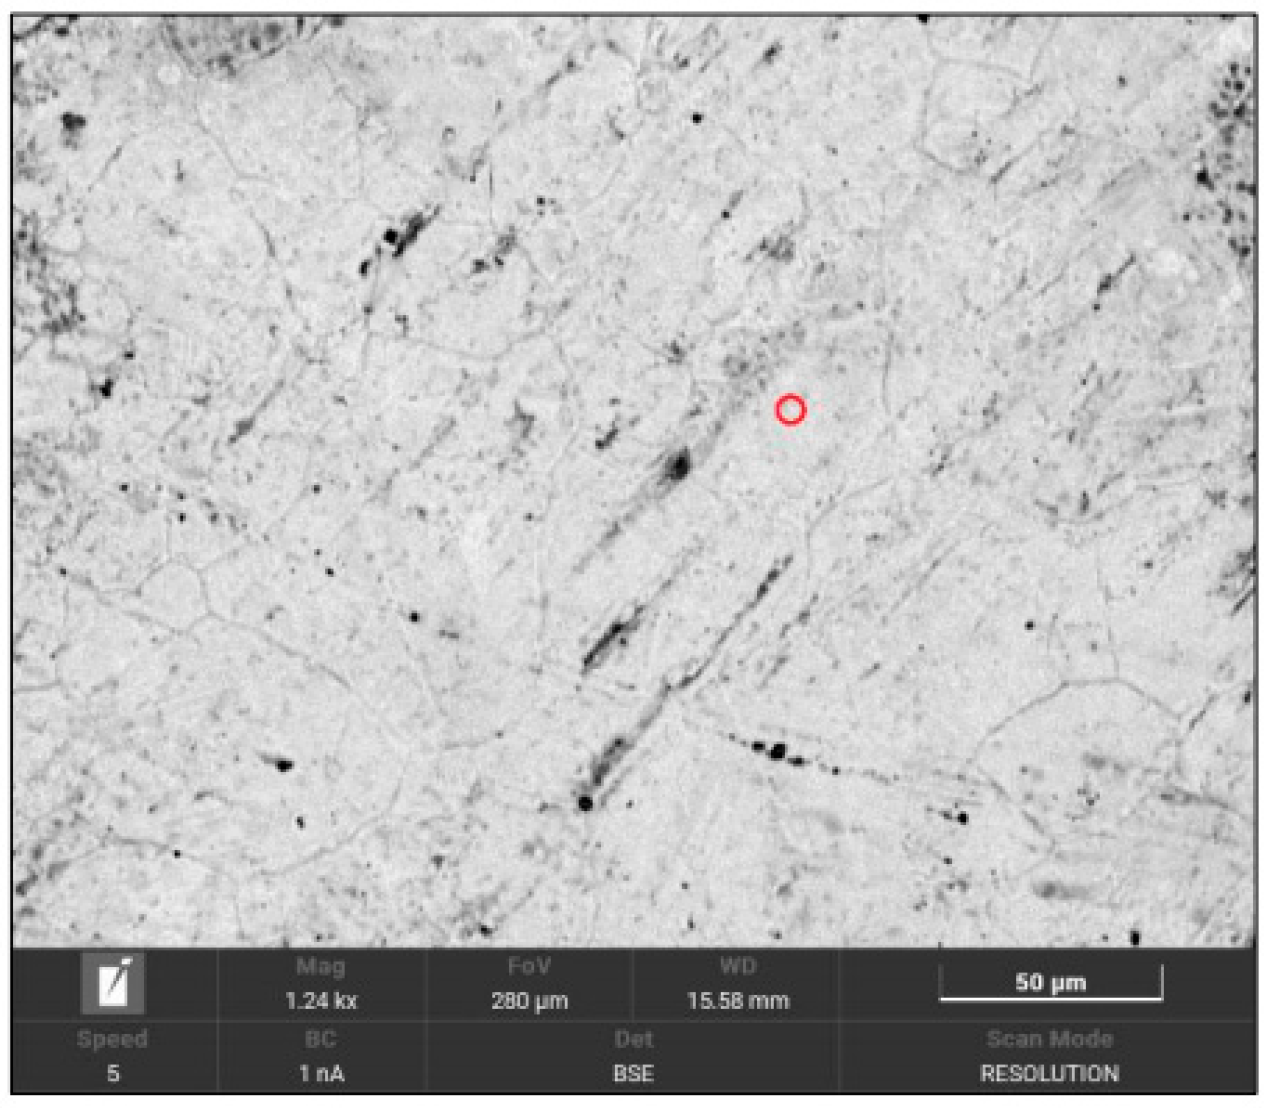
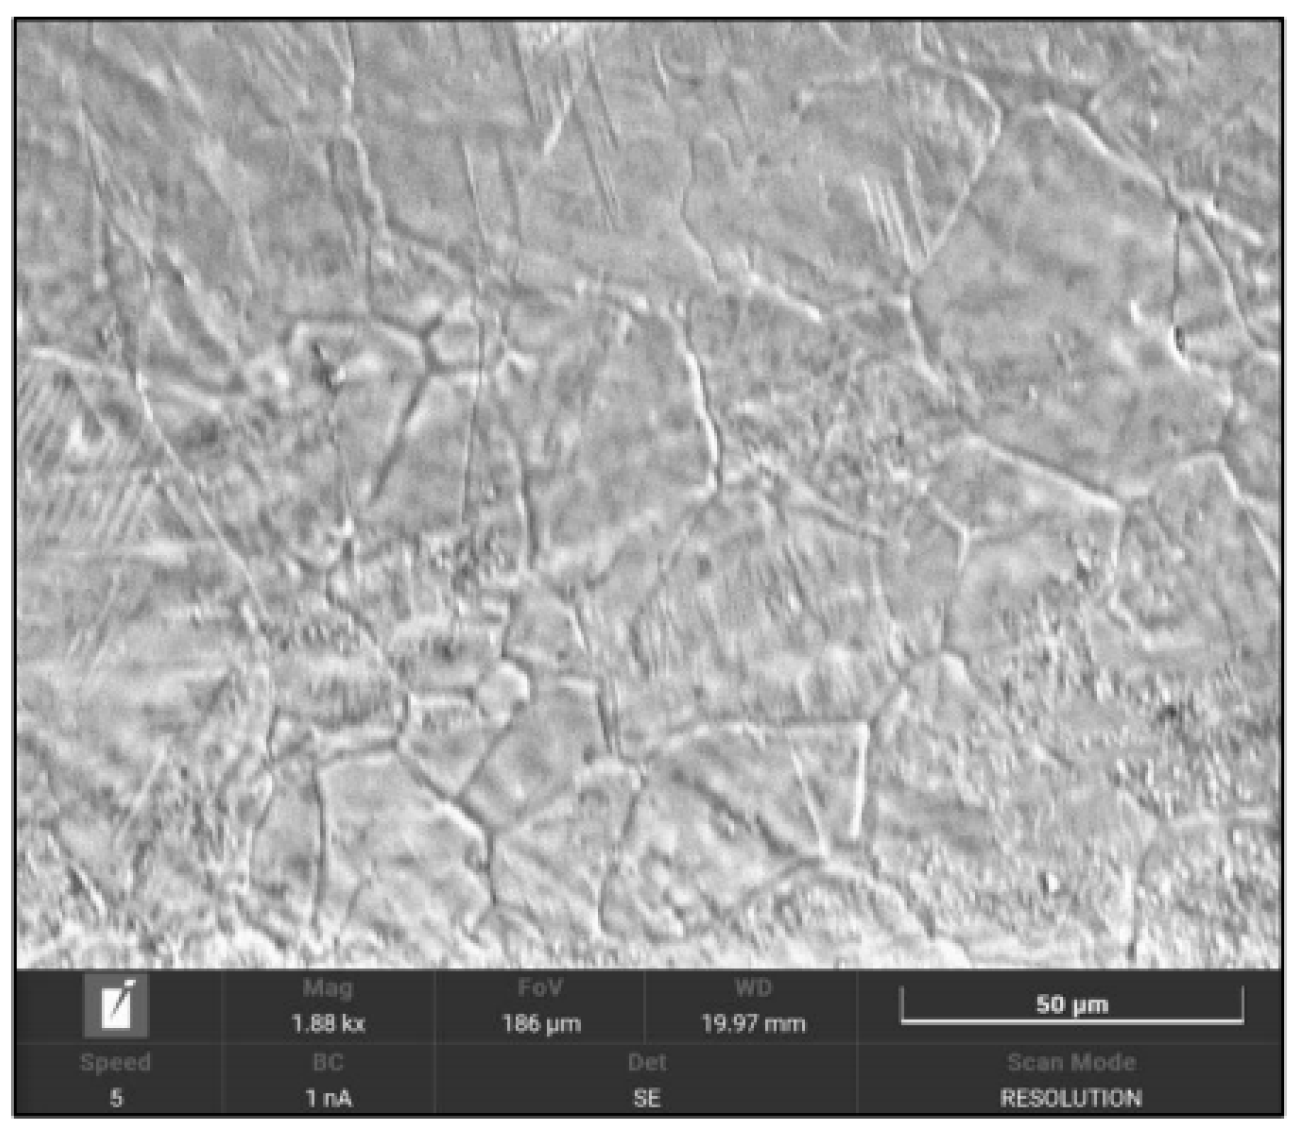
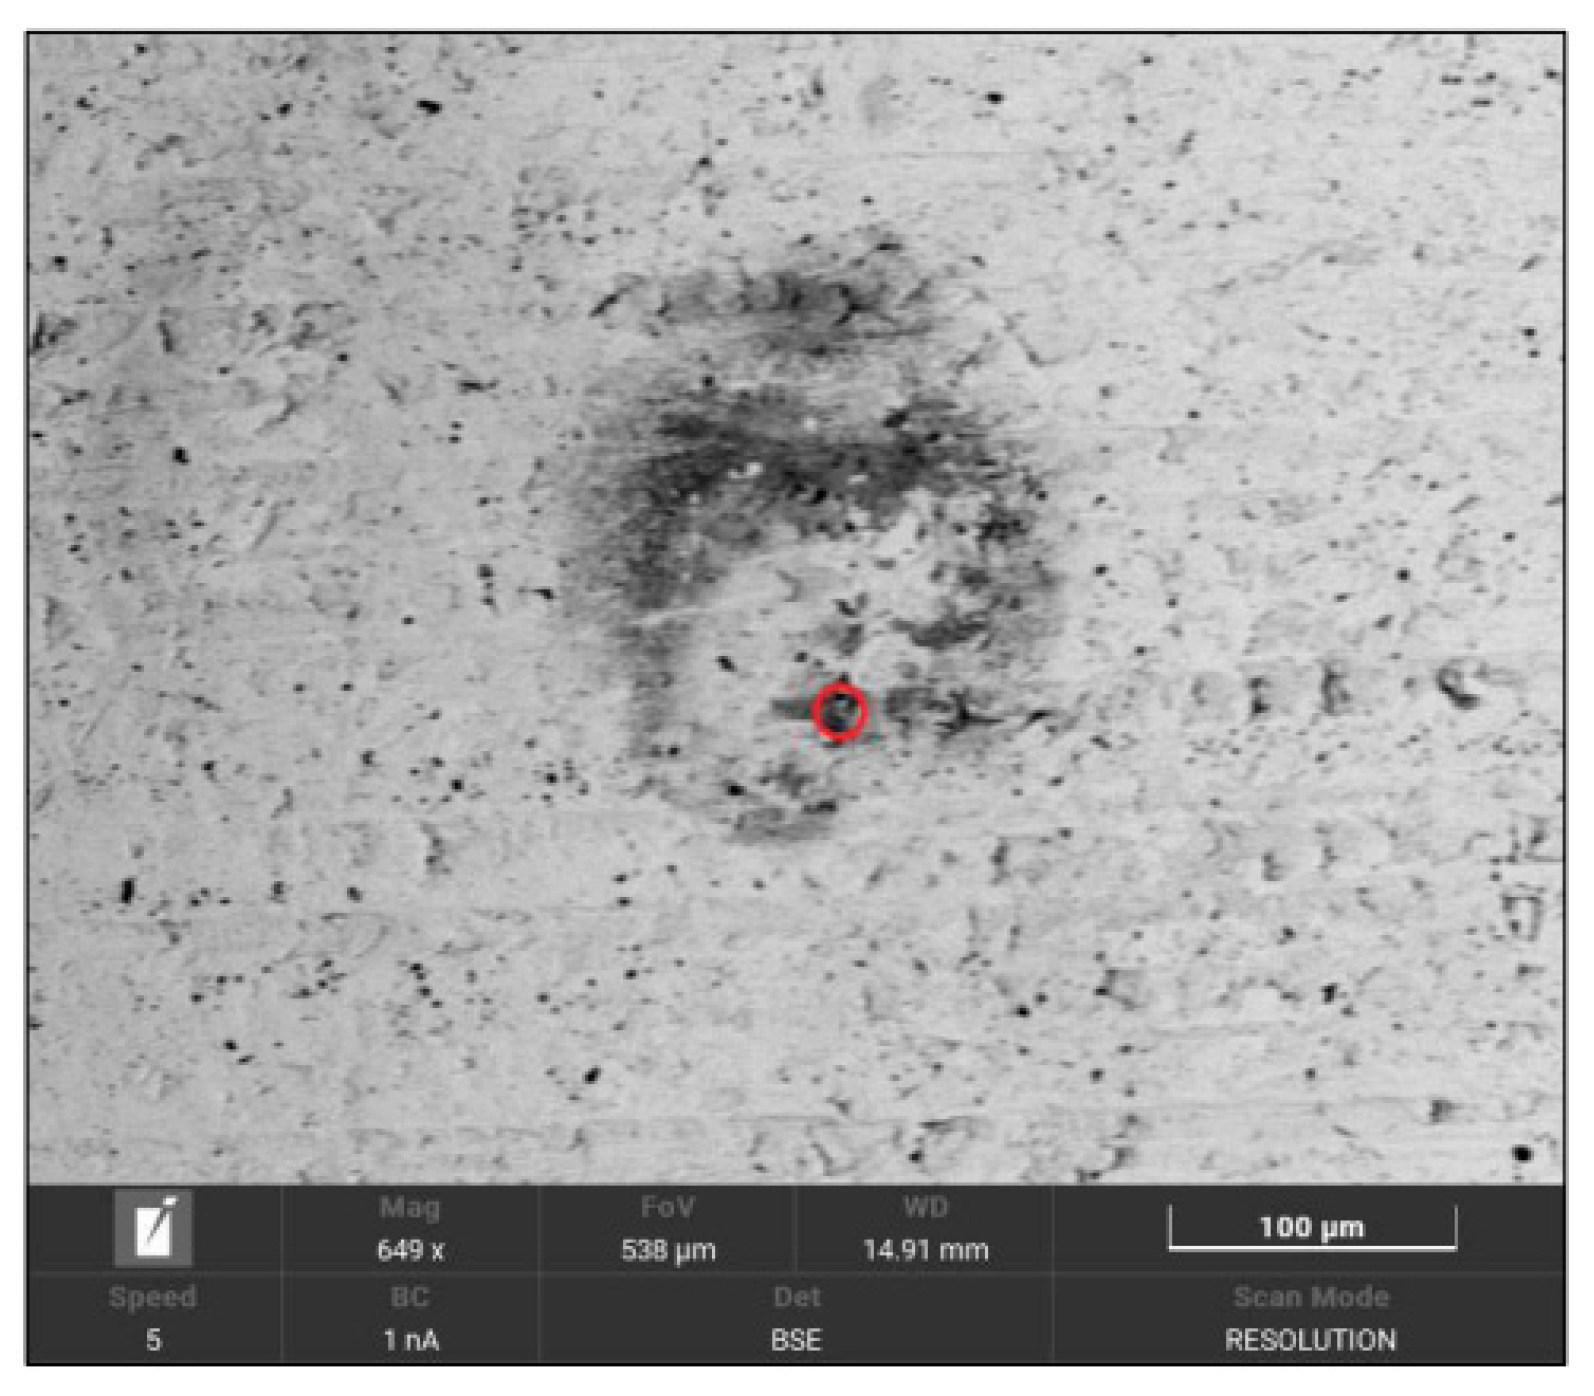
The scanning electron microscopy (SEM) images presented in Figures 25, 26, 29, 32 and 35 were acquired using working distances (WDs) from 14.91 to 19.97 mm. The accelerating voltage (high voltage (HV)) used for image acquisition was estimated to be approximately 20 kV based on the typical operating conditions of the SEM instrument.
3. Results
The results of the structural analyses are presented in
Figure 7,
Figure 8,
Figure 9,
Figure 10,
Figure 11,
Figure 12,
Figure 13,
Figure 14,
Figure 15,
Figure 16,
Figure 17,
Figure 18,
Figure 19,
Figure 20,
Figure 21,
Figure 22 and
Figure 23.
Figure 7.
Rod surface in the delivery condition. Aqua regia etching; 1000:1 magnification.
Figure 7.
Rod surface in the delivery condition. Aqua regia etching; 1000:1 magnification.
Figure 8.
Rod core in the delivery condition. Aqua regia etching; 1000:1 magnification.
Figure 8.
Rod core in the delivery condition. Aqua regia etching; 1000:1 magnification.
Figure 9.
Head surface in the delivery condition. Aqua regia etching; 1000:1 magnification.
Figure 9.
Head surface in the delivery condition. Aqua regia etching; 1000:1 magnification.
Figure 10.
Head core in the delivery condition. Aqua regia etching; 1000:1 magnification.
Figure 10.
Head core in the delivery condition. Aqua regia etching; 1000:1 magnification.
- 2.
Quenched and unsterilised sample.
Figure 11.
Metallographic structure of the rod surface following quenching at 1040 °C and tempering at 200 °C. Aqua regia etching; 1000:1 magnification.
Figure 11.
Metallographic structure of the rod surface following quenching at 1040 °C and tempering at 200 °C. Aqua regia etching; 1000:1 magnification.
Figure 12.
Metallographic structure of the rod core following quenching at 1040 °C and tempering at 200 °C. Aqua regia etching; 1000:1 magnification.
Figure 12.
Metallographic structure of the rod core following quenching at 1040 °C and tempering at 200 °C. Aqua regia etching; 1000:1 magnification.
Figure 13.
Metallographic structure of the head surface following quenching at 1040 °C and tempering at 200 °C. Aqua regia etching; 1000:1 magnification.
Figure 13.
Metallographic structure of the head surface following quenching at 1040 °C and tempering at 200 °C. Aqua regia etching; 1000:1 magnification.
Figure 14.
Metallographic structure of the head core following quenching at 1040 °C and tempering at 200 °C. Aqua regia etching; 1000:1 magnification.
Figure 14.
Metallographic structure of the head core following quenching at 1040 °C and tempering at 200 °C. Aqua regia etching; 1000:1 magnification.
- 3.
Quenched and sterilised sample.
Figure 15.
Metallographic structure of the rod surface following quenching at 1040 °C and tempering at 200 °C. Aqua regia etching; 1000:1 magnification.
Figure 15.
Metallographic structure of the rod surface following quenching at 1040 °C and tempering at 200 °C. Aqua regia etching; 1000:1 magnification.
Figure 16.
Metallographic structure of the rod core following quenching at 1040 °C and tempering at 200 °C. Aqua regia etching; 1000:1 magnification.
Figure 16.
Metallographic structure of the rod core following quenching at 1040 °C and tempering at 200 °C. Aqua regia etching; 1000:1 magnification.
Figure 17.
Metallographic structure of the head surface following quenching at 1040 °C and tempering at 200 °C. Aqua regia etching; 1000:1 magnification.
Figure 17.
Metallographic structure of the head surface following quenching at 1040 °C and tempering at 200 °C. Aqua regia etching; 1000:1 magnification.
Figure 18.
Metallographic structure of the head core following quenching at 1040 °C and tempering at 200 °C. Aqua regia etching; 1000:1 magnification.
Figure 18.
Metallographic structure of the head core following quenching at 1040 °C and tempering at 200 °C. Aqua regia etching; 1000:1 magnification.
- 4.
Unquenched sample with rust spots.
Figure 19.
Rod surface in the delivery condition. Aqua regia etching; 1000:1 magnification.
Figure 19.
Rod surface in the delivery condition. Aqua regia etching; 1000:1 magnification.
Figure 20.
Rod core in the delivery condition. Aqua regia etching; 1000:1 magnification.
Figure 20.
Rod core in the delivery condition. Aqua regia etching; 1000:1 magnification.
Figure 21.
Head surface of EN 1.4021 steel in the delivery condition. Aqua regia etching; 1000:1 magnification.
Figure 21.
Head surface of EN 1.4021 steel in the delivery condition. Aqua regia etching; 1000:1 magnification.
- 5.
Unquenched sample (disk) cleaned in isopropyl alcohol.
Figure 22.
Disk surface in the delivery condition. Aqua regia etching; 1000:1 magnification.
Figure 22.
Disk surface in the delivery condition. Aqua regia etching; 1000:1 magnification.
Figure 23.
Disk core in the delivery condition. Aqua regia etching; 1000:1 magnification.
Figure 23.
Disk core in the delivery condition. Aqua regia etching; 1000:1 magnification.
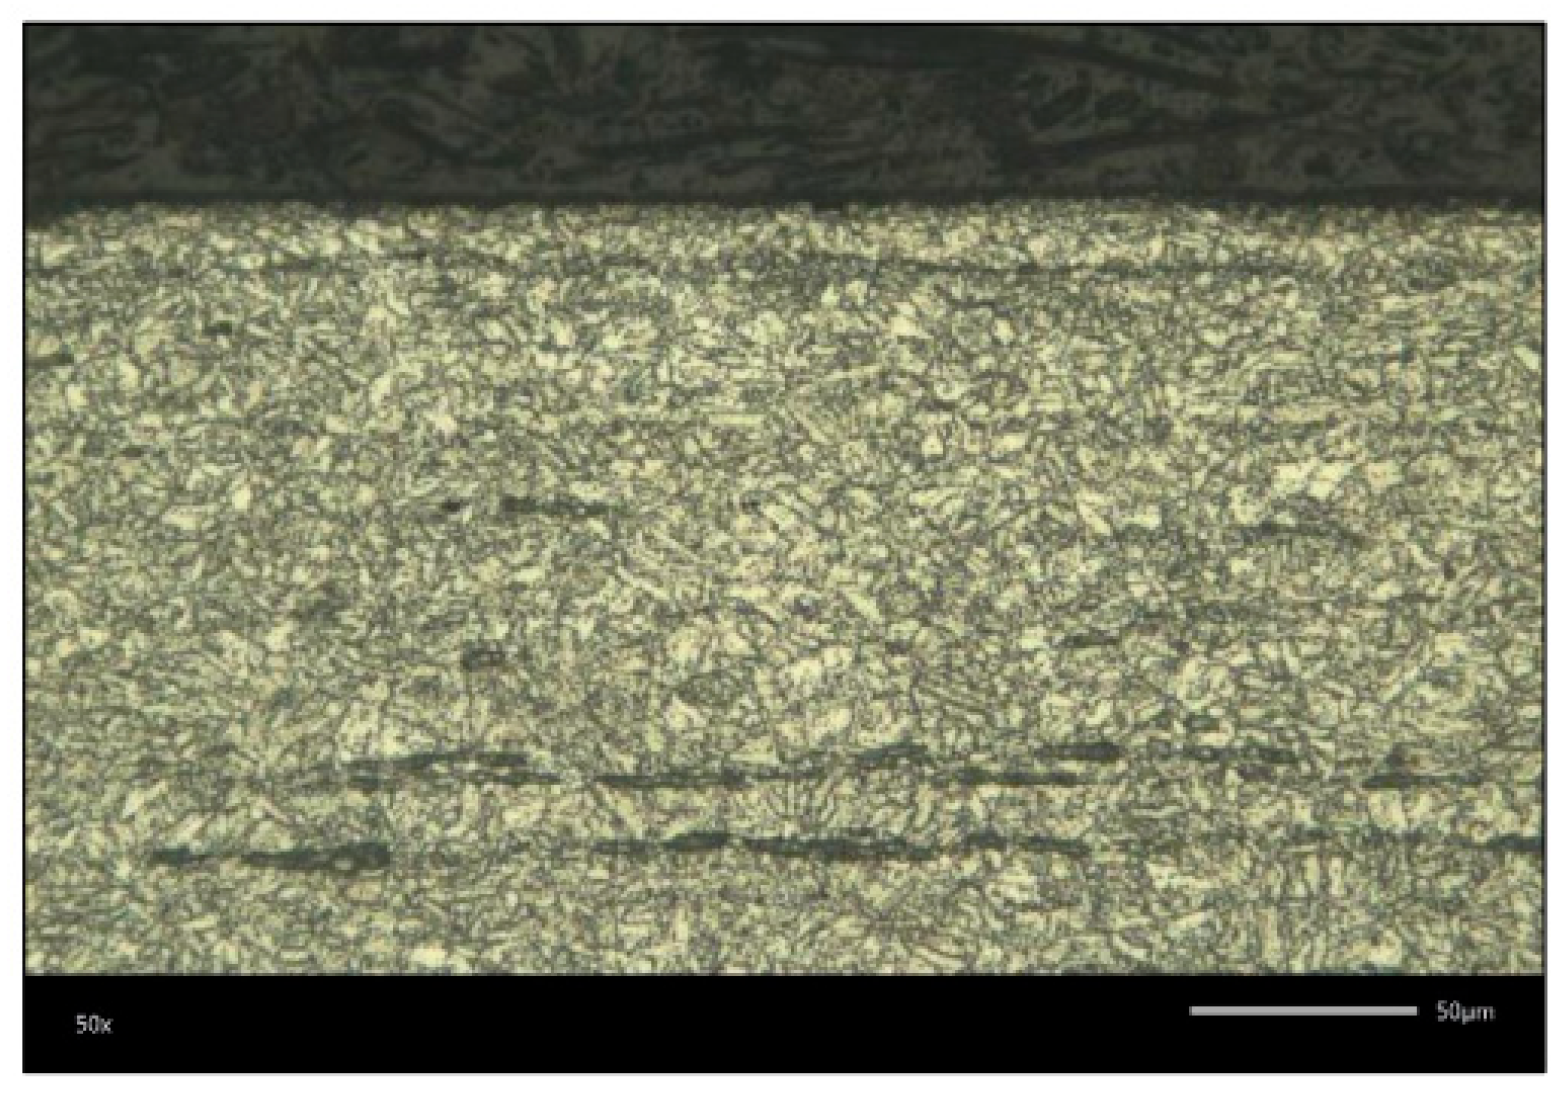
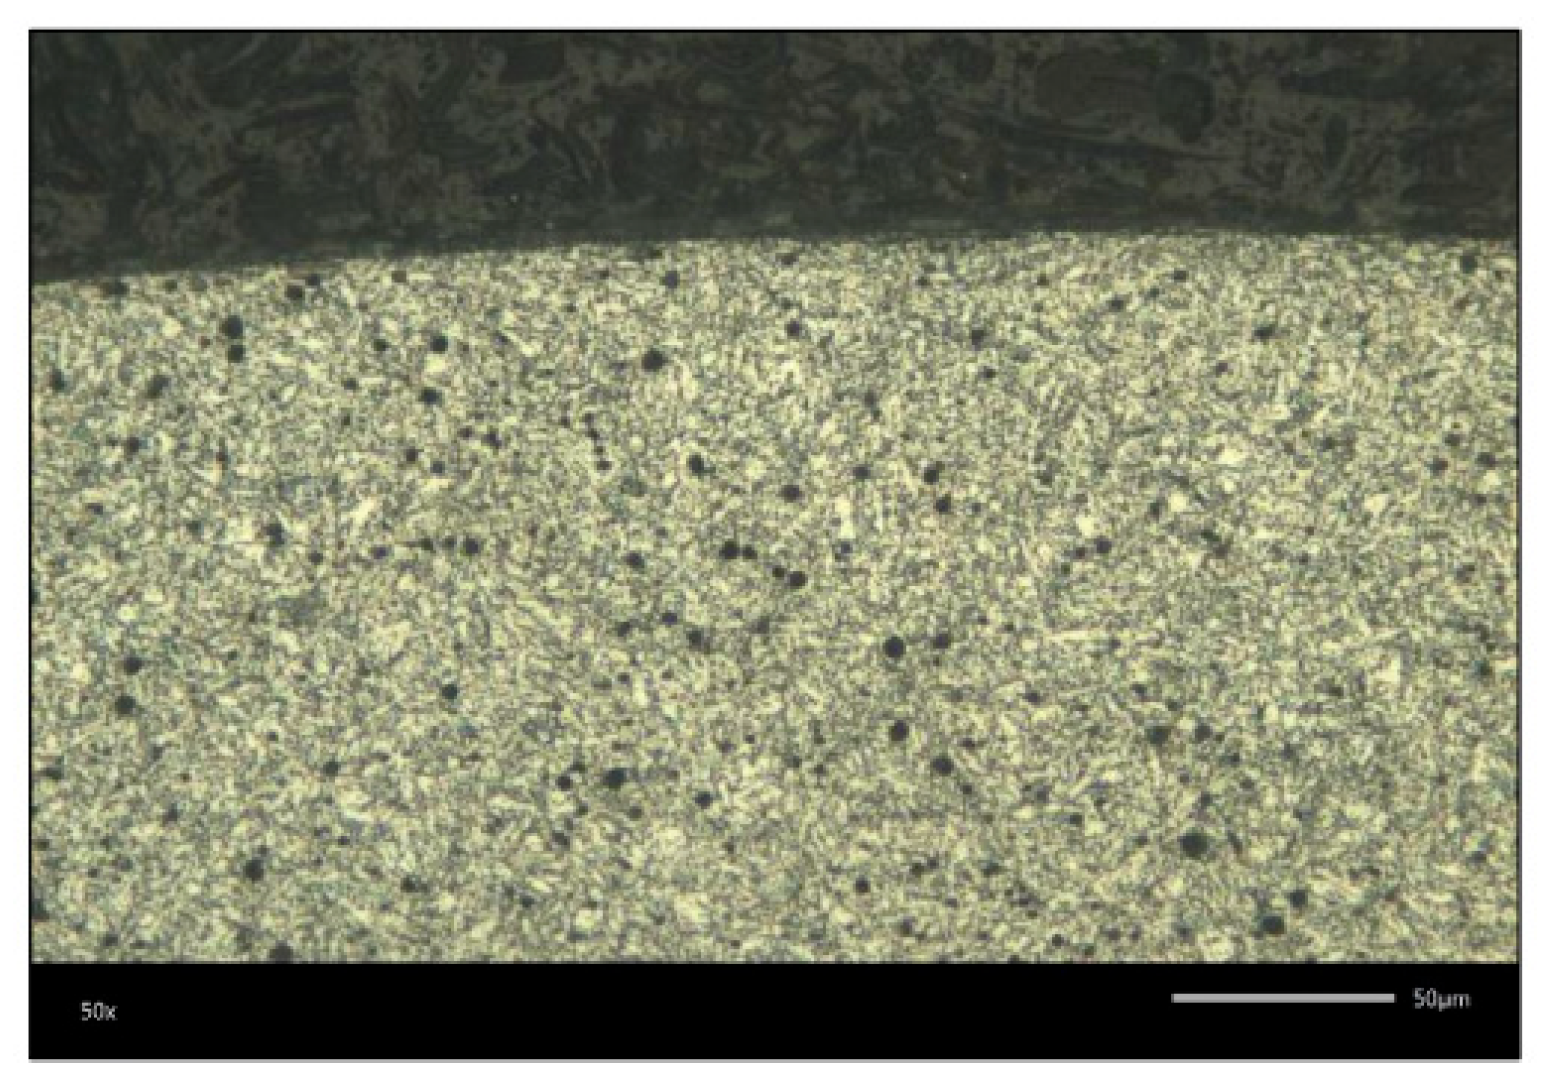
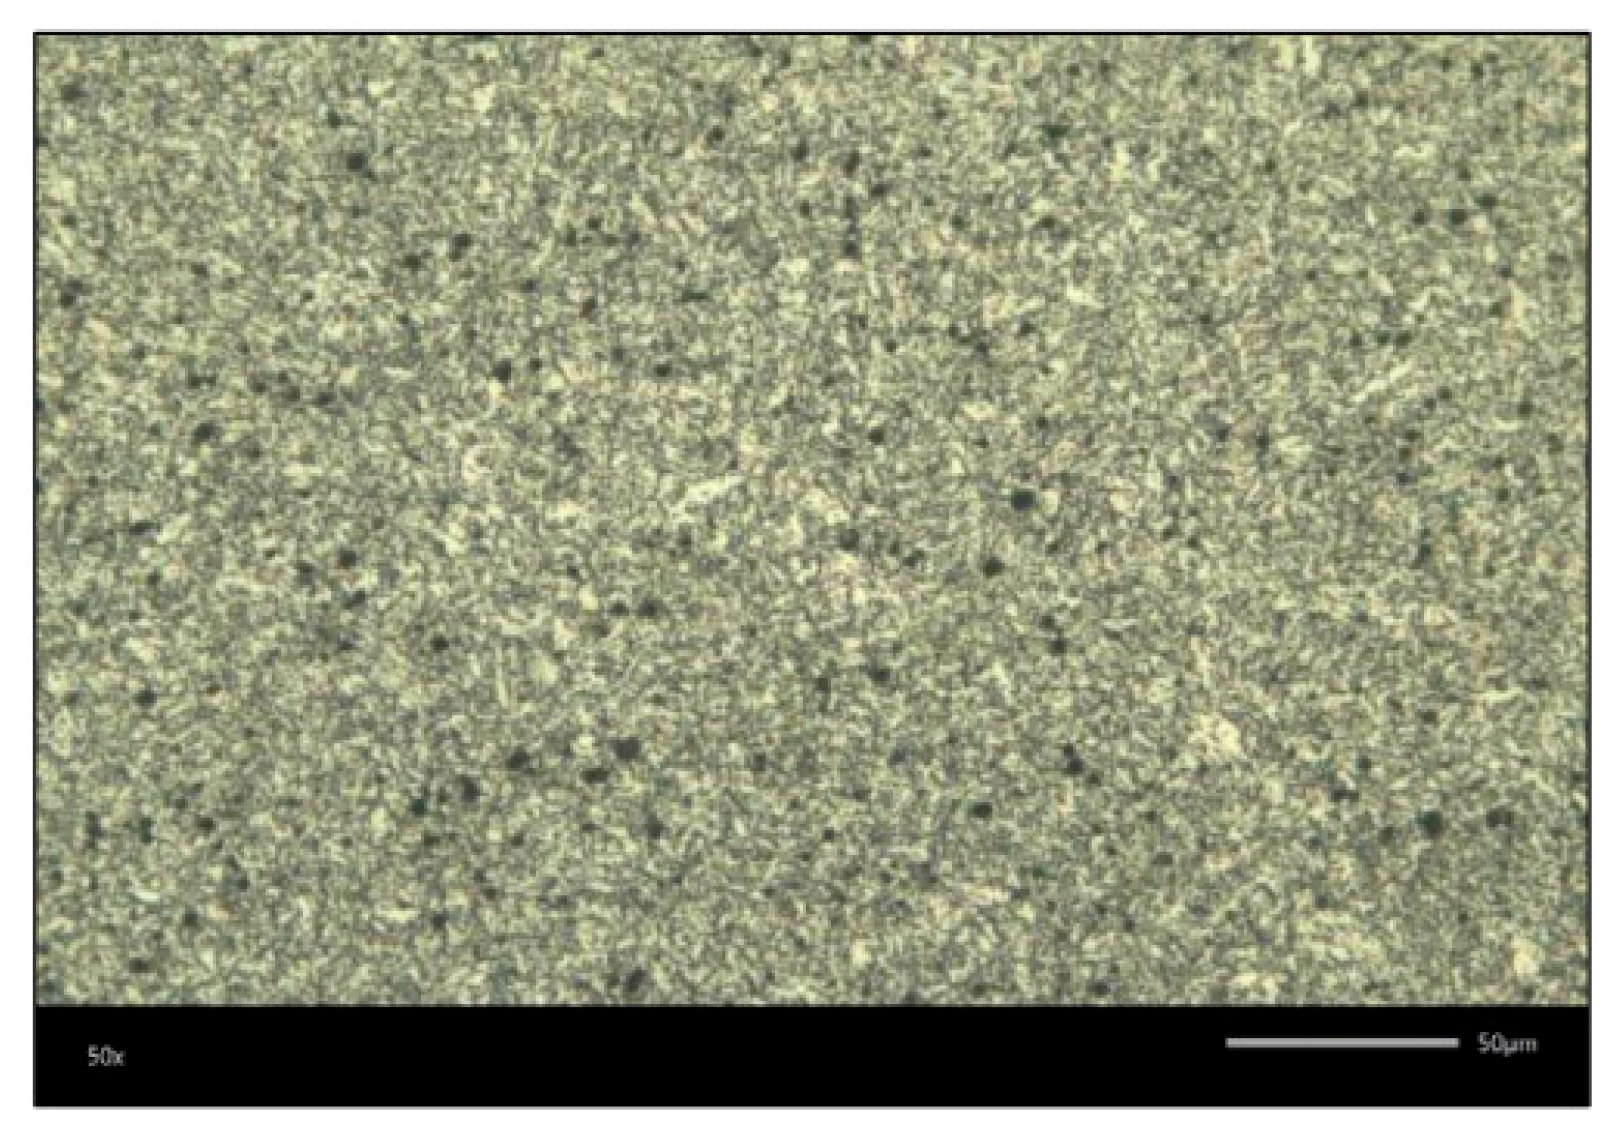
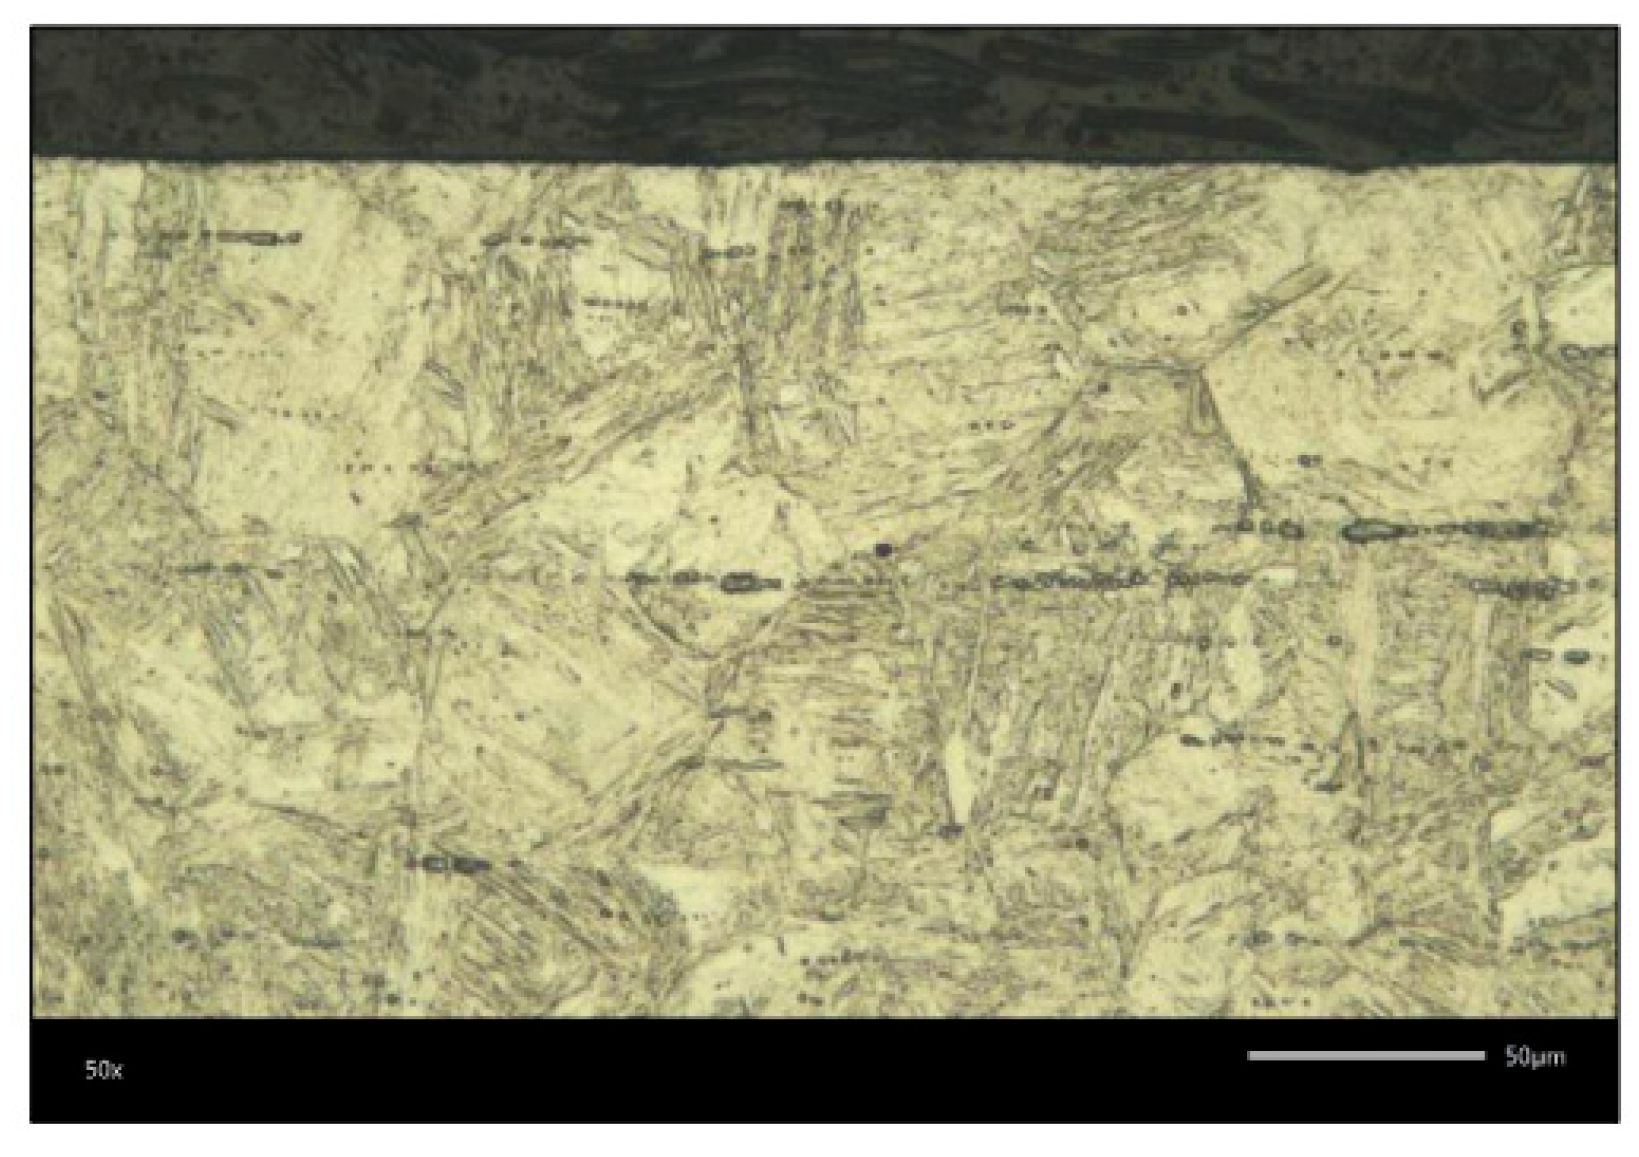
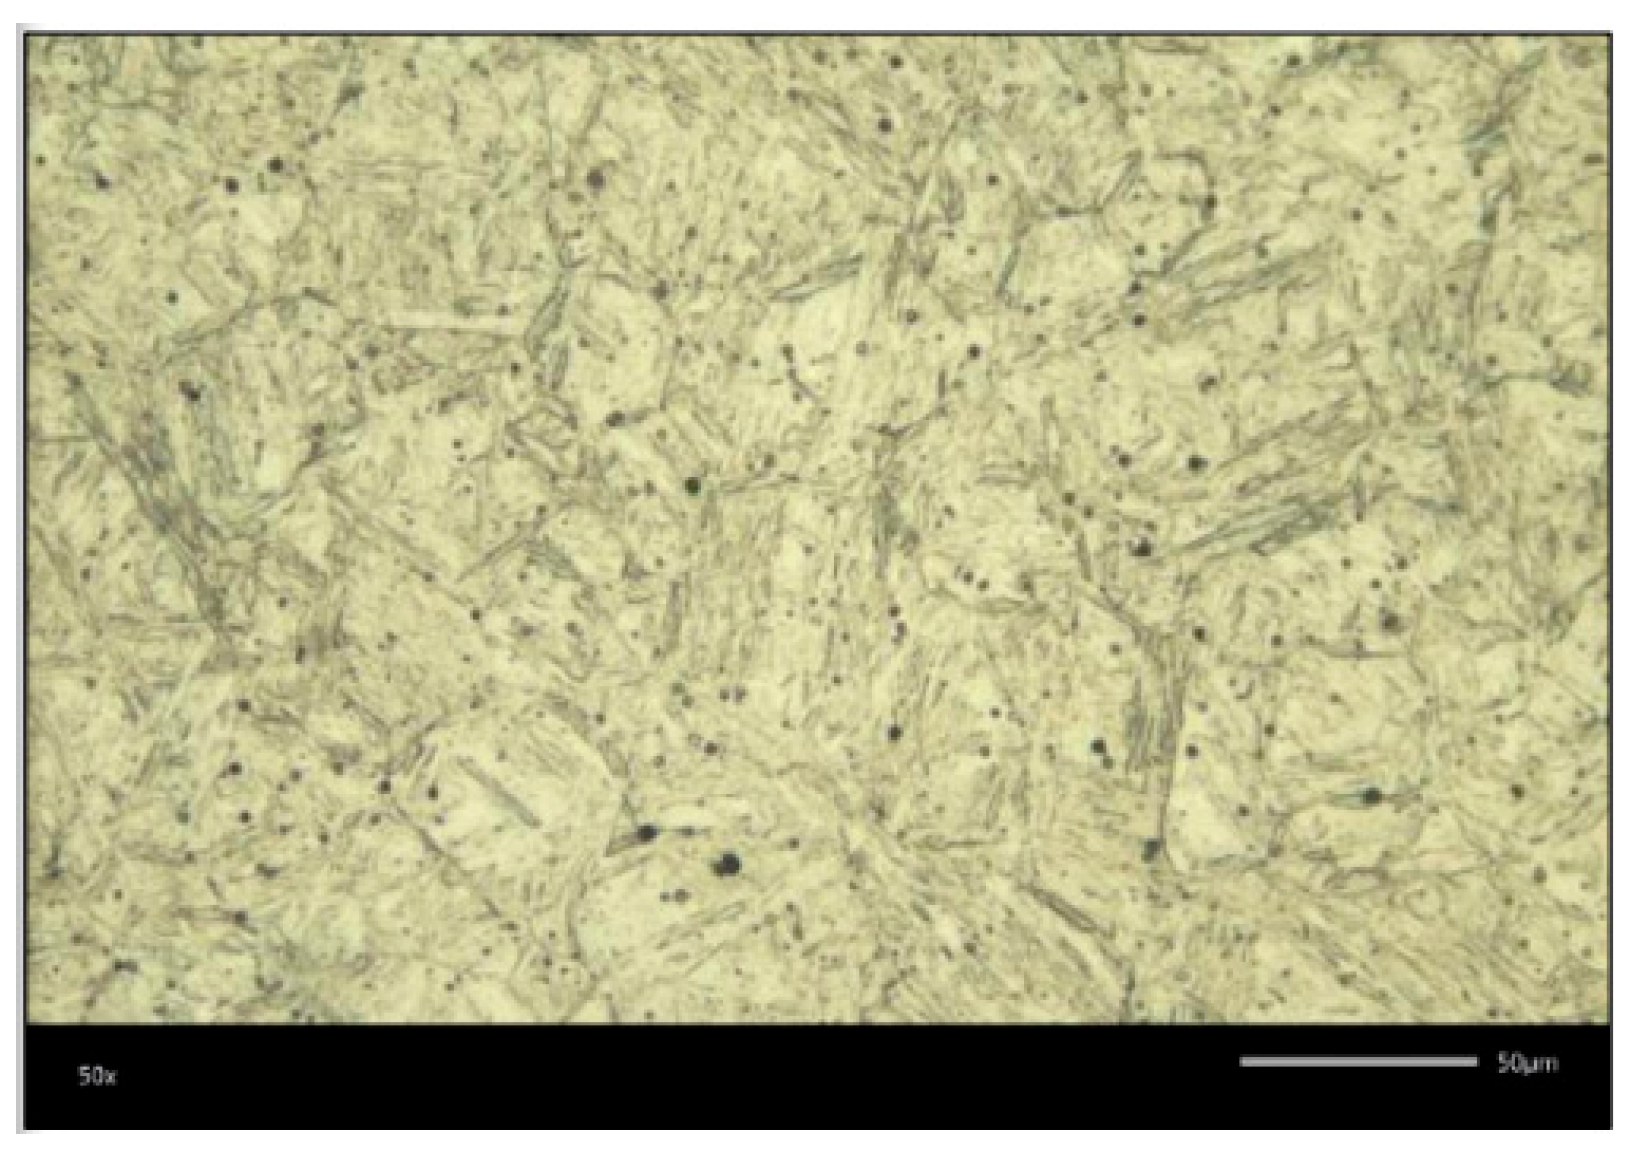
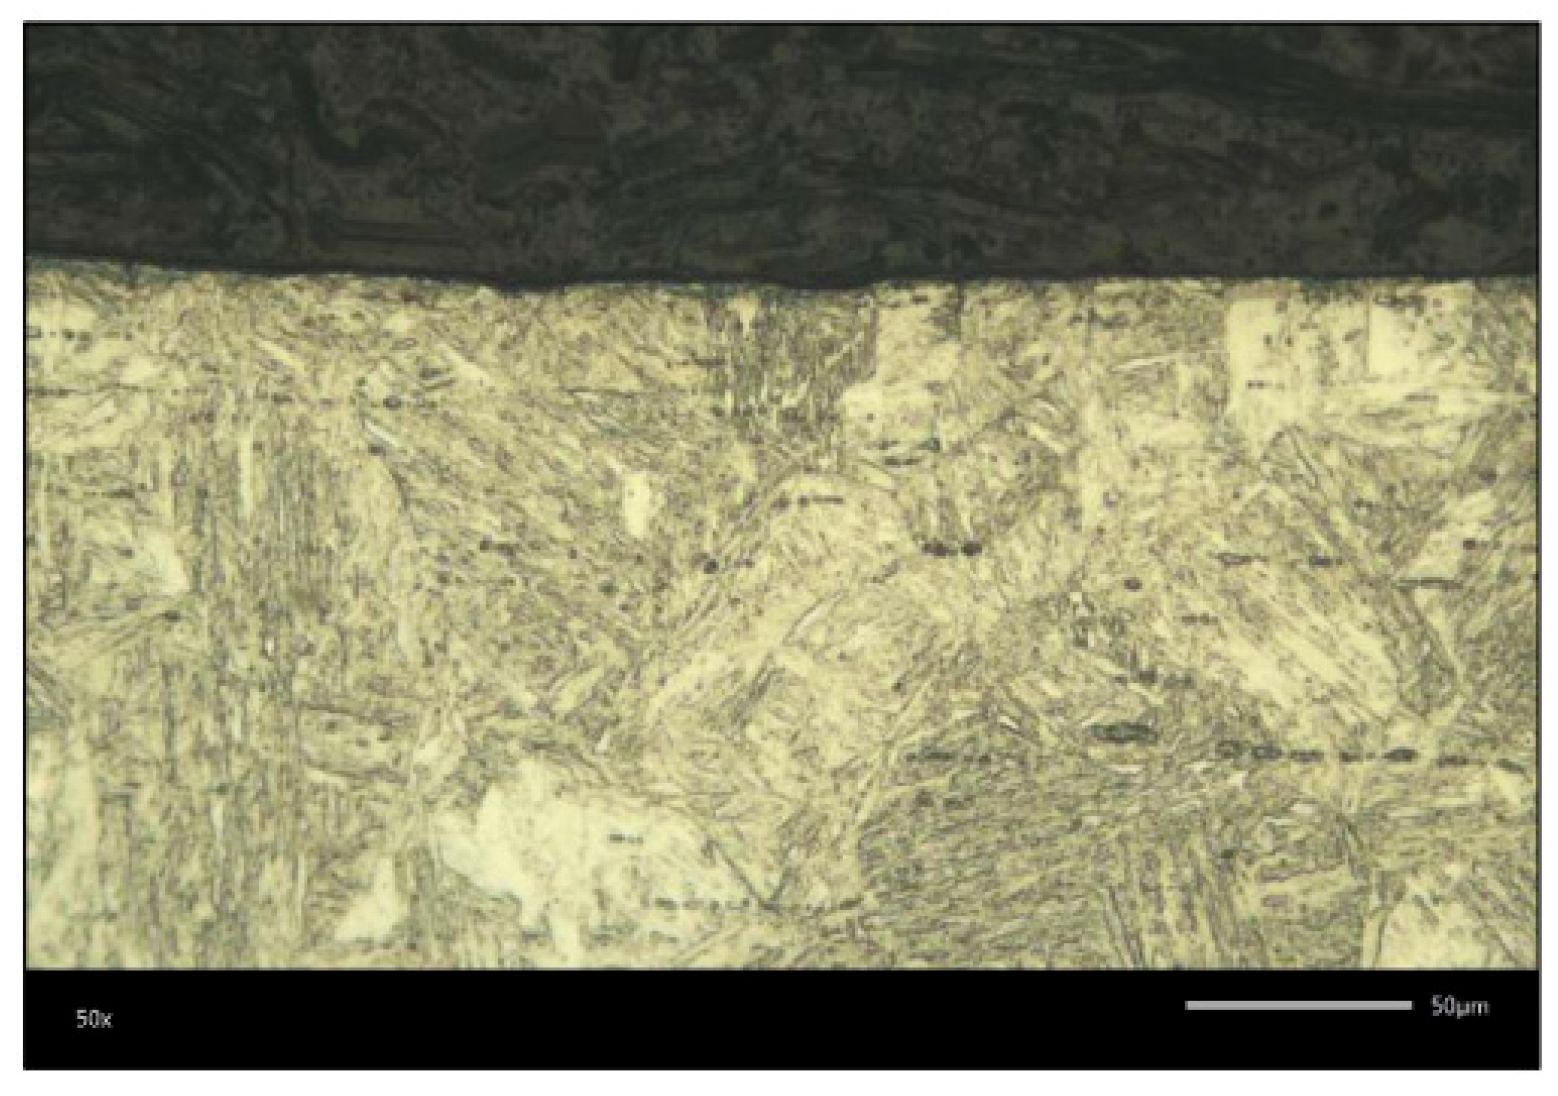
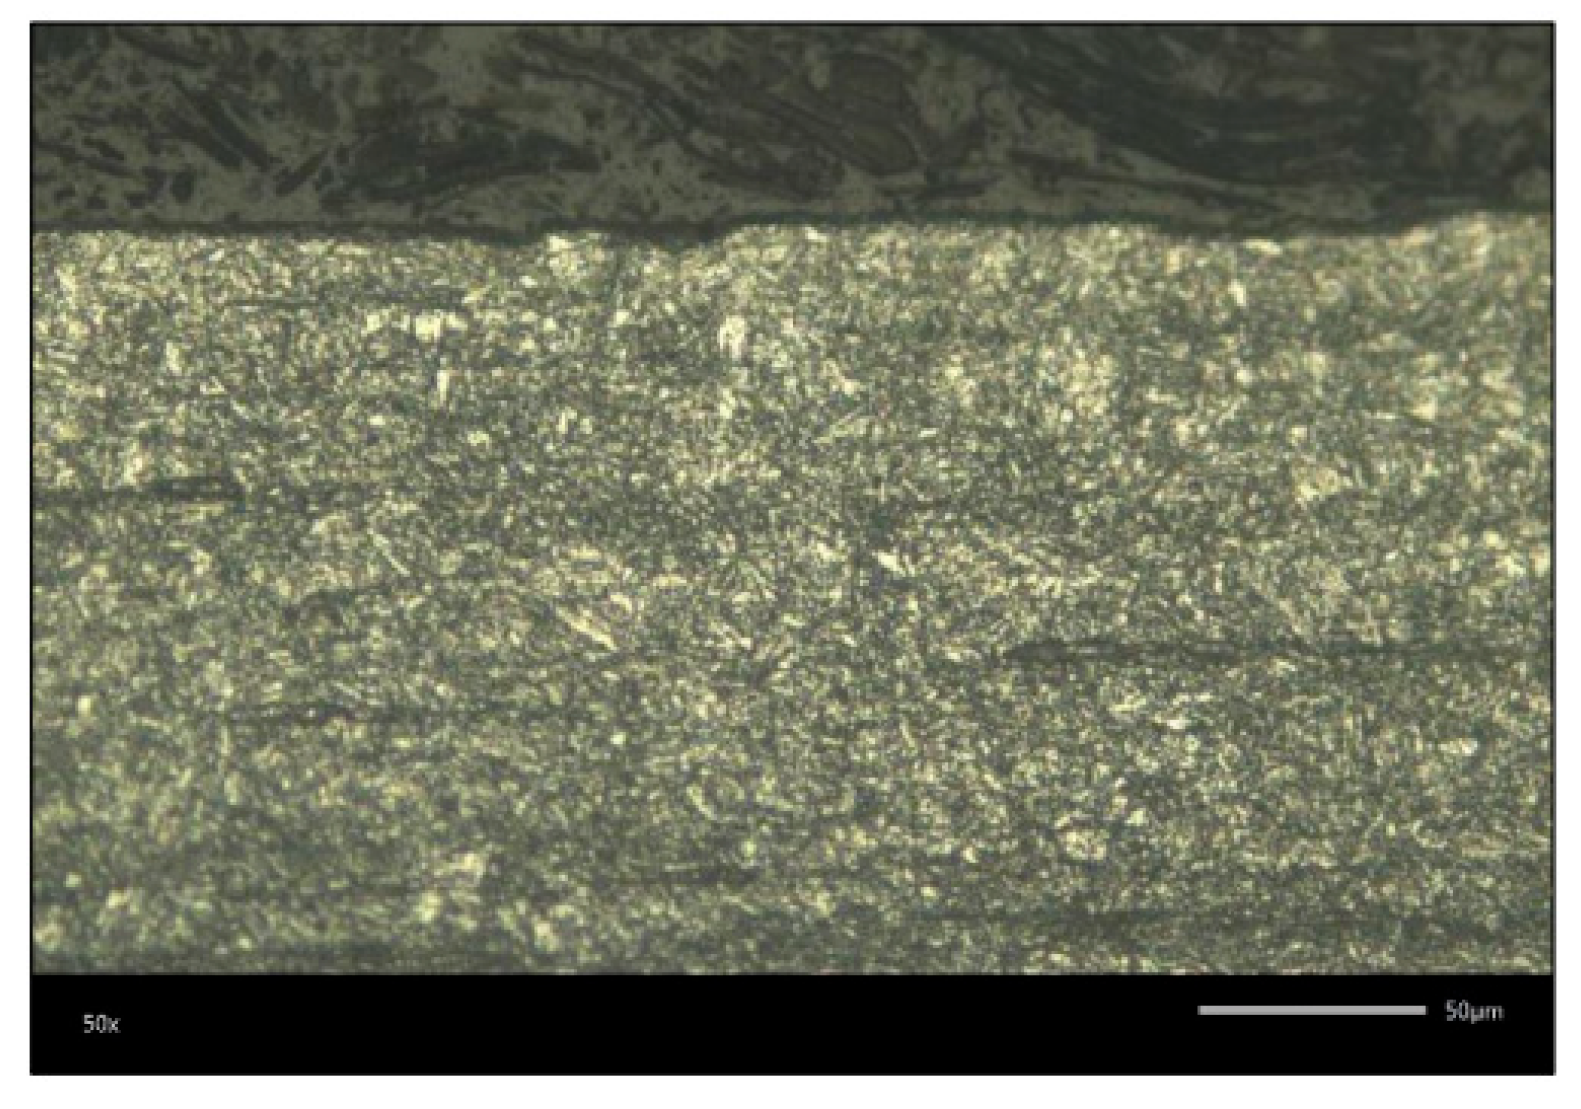
The analysis of the EN 1.4021 steel structures revealed the presence of a small amount of carbides, which is consistent with the low carbon content of this steel. In the original condition, the microstructure was made up of ferrite and carbides. Heating to 1040 °C led to almost complete dissolution of the carbides (
Figure 11,
Figure 12,
Figure 13,
Figure 14,
Figure 15,
Figure 16,
Figure 17 and
Figure 18). After tempering at 200 °C, the microstructure was similar to that after quenching but exhibited a tendency for the occurrence of fine precipitates arranged in rows. e, in all analysed zones, the microstructure was composed of tempered martensite, uniformly distributed fine globulised carbides, and some coarser carbides. Steels with 12%…13% Cr exhibit high resistance to tempering and do not soften at tempering temperatures of about 475 °C, at which temper brittleness occurs. For this reason, a tempering temperature of 200 °C was selected. The research continued with SEM analysis of the quenched and sterilised sample and the unquenched sample with rust spots in order to obtain information on the topography, morphology, and surface composition of the analysed samples.
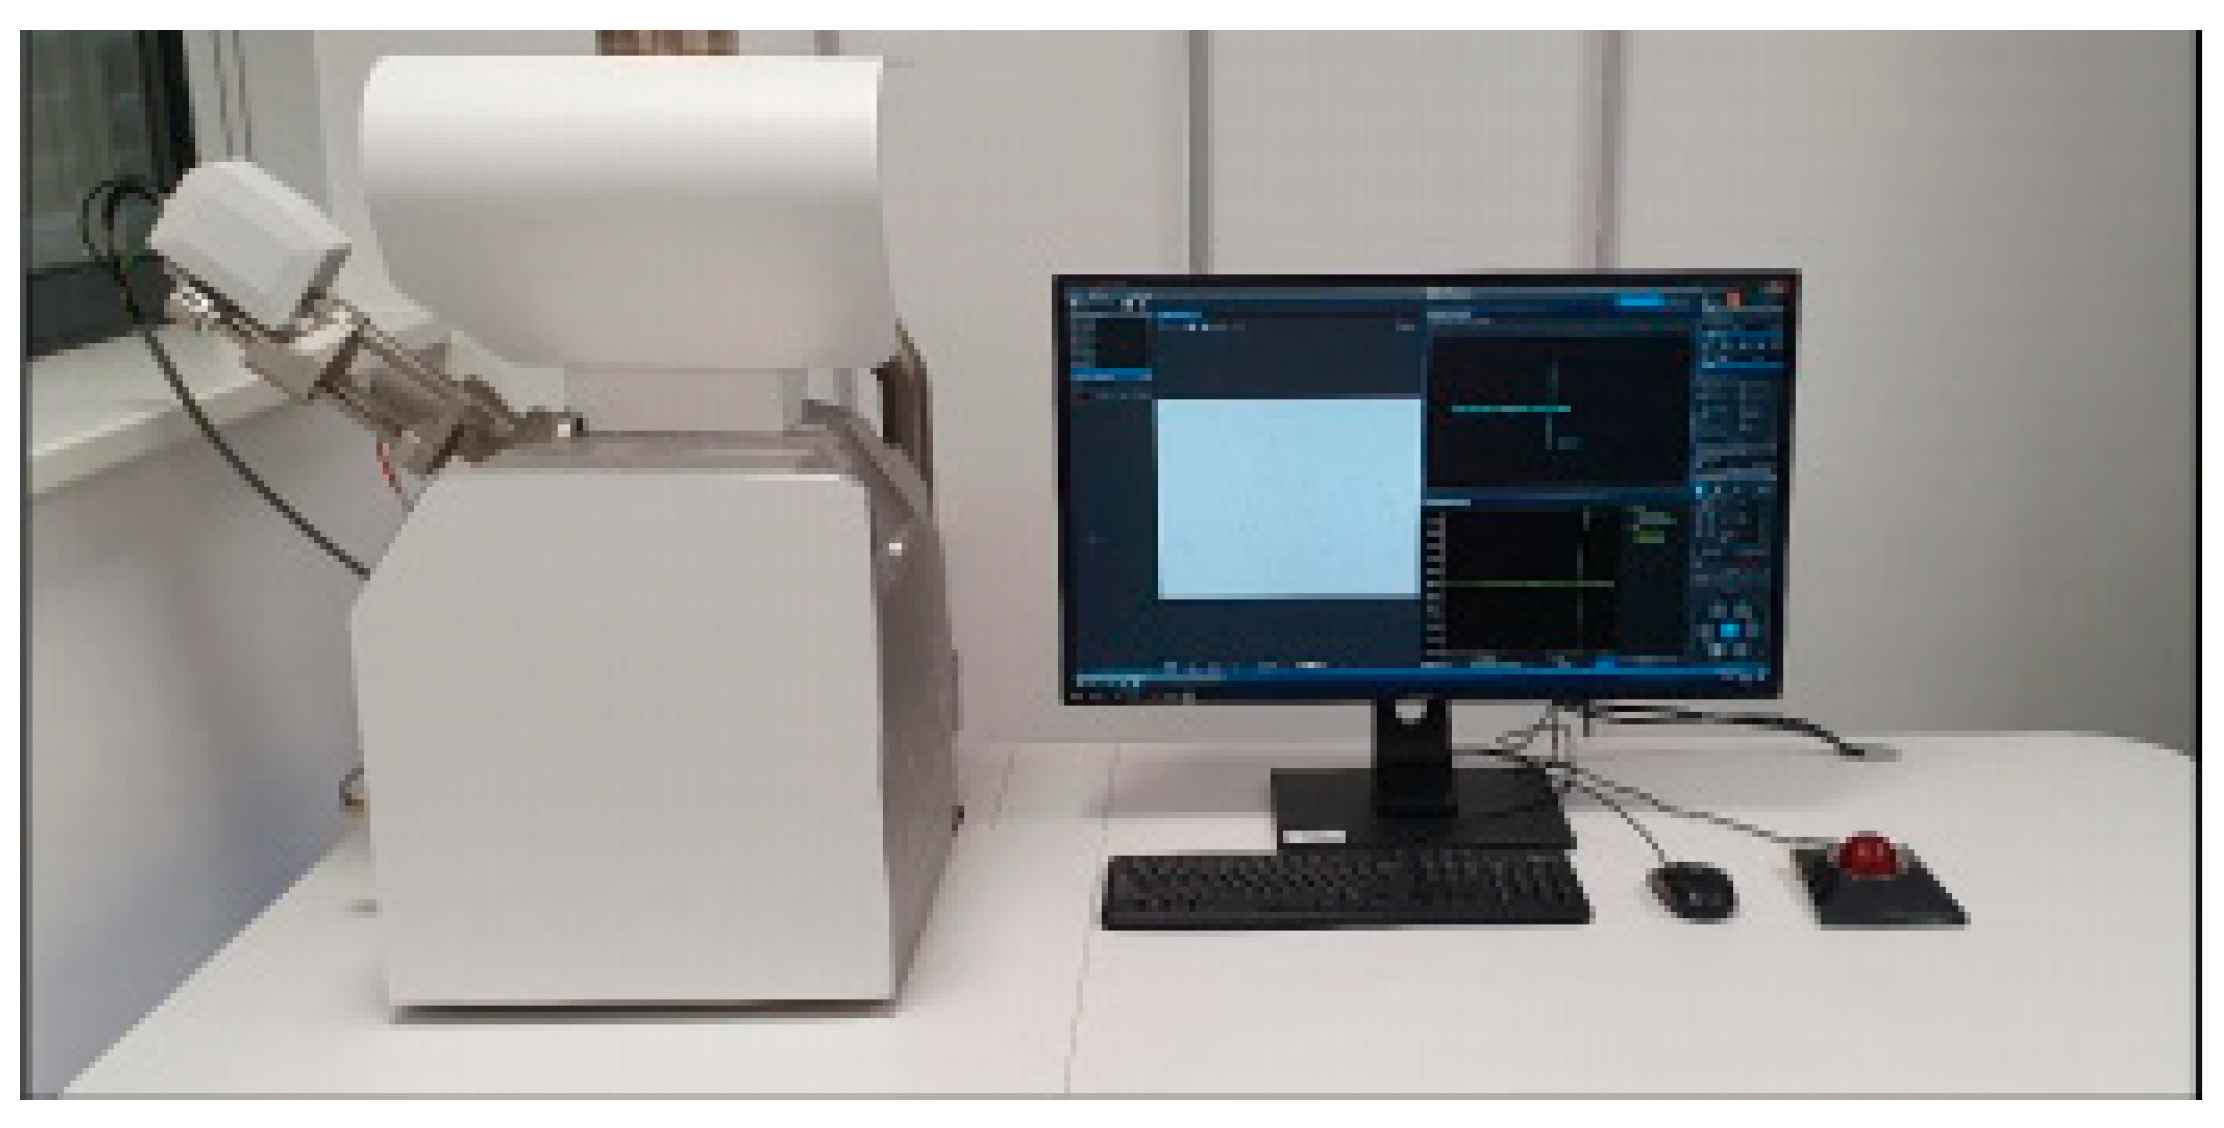
Scanning electron microscopy (SEM) (TESCAN VEGA scanning electron microscope (TESCAN Group, Brno, Czech Republic). was used to obtain information on the topography, morphology, and surface composition of the analysed samples.
Figure 24 shows the equipment used to carry out SEM analyses [
7].
Figure 25,
Figure 26,
Figure 27,
Figure 28,
Figure 29,
Figure 30,
Figure 31,
Figure 32,
Figure 33,
Figure 34,
Figure 35,
Figure 36 and
Figure 37 show the SEM-EDS analyses.
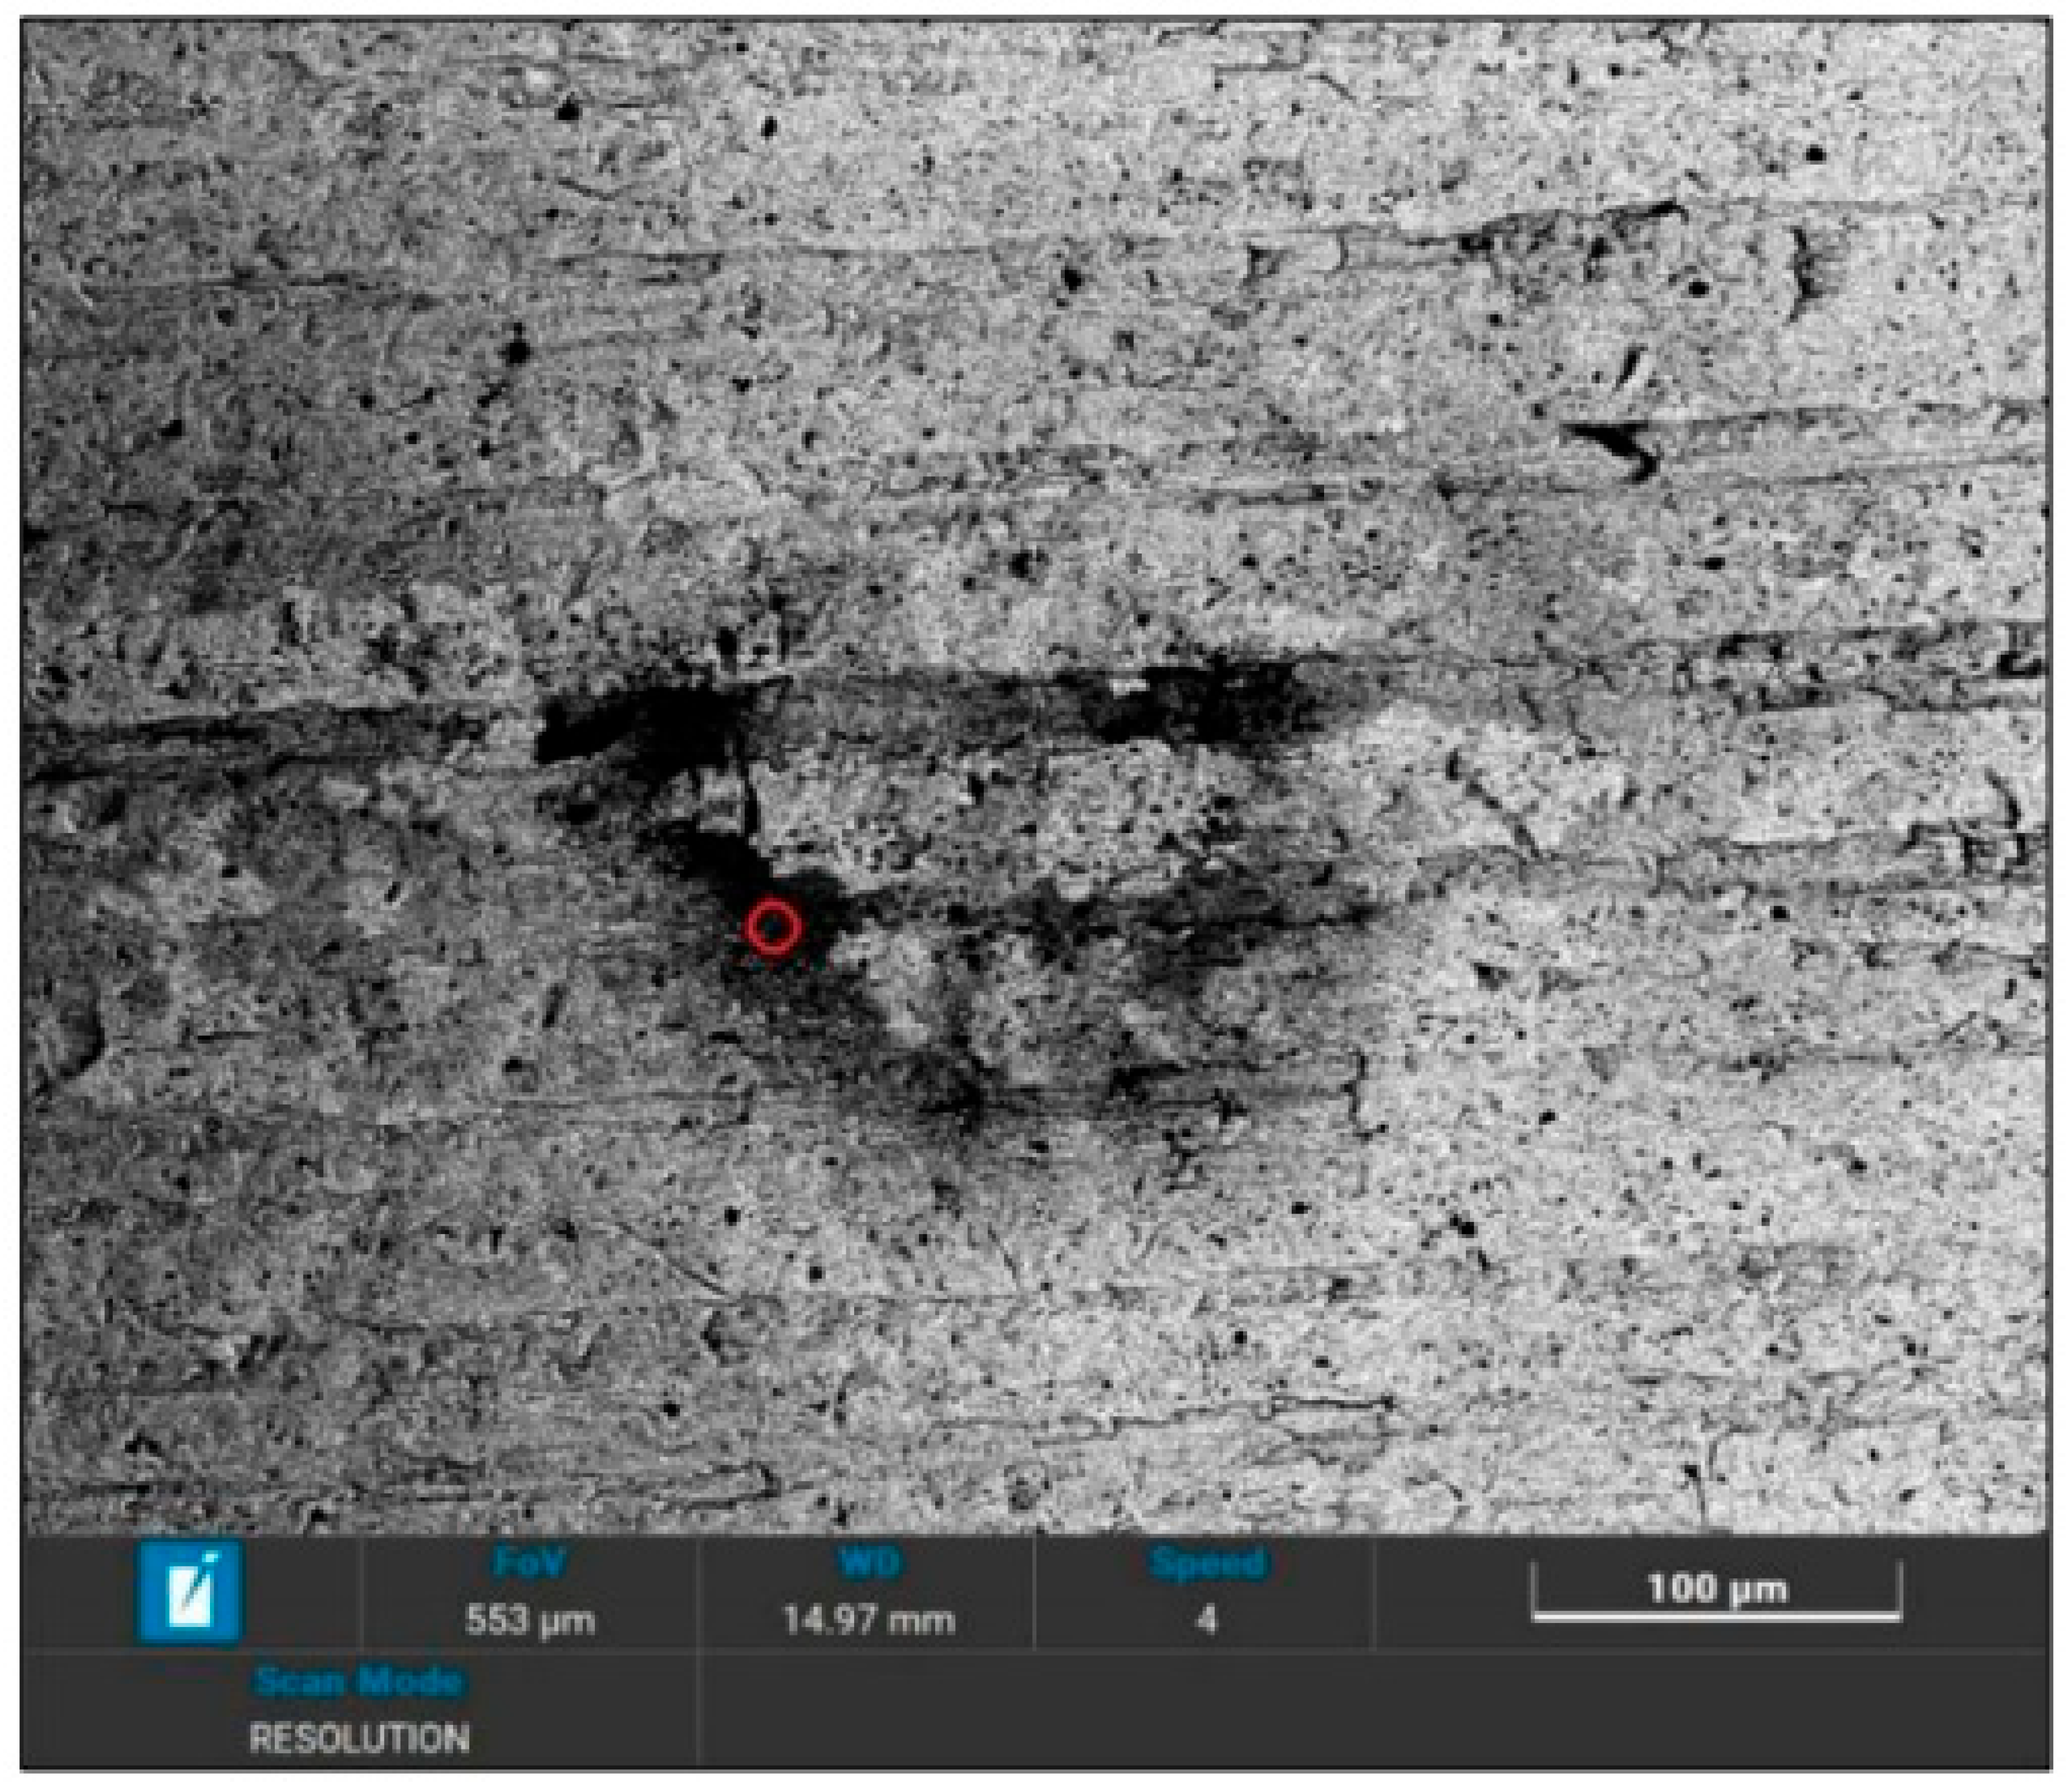
- 1.
Rod: unquenched sample with rust spots.
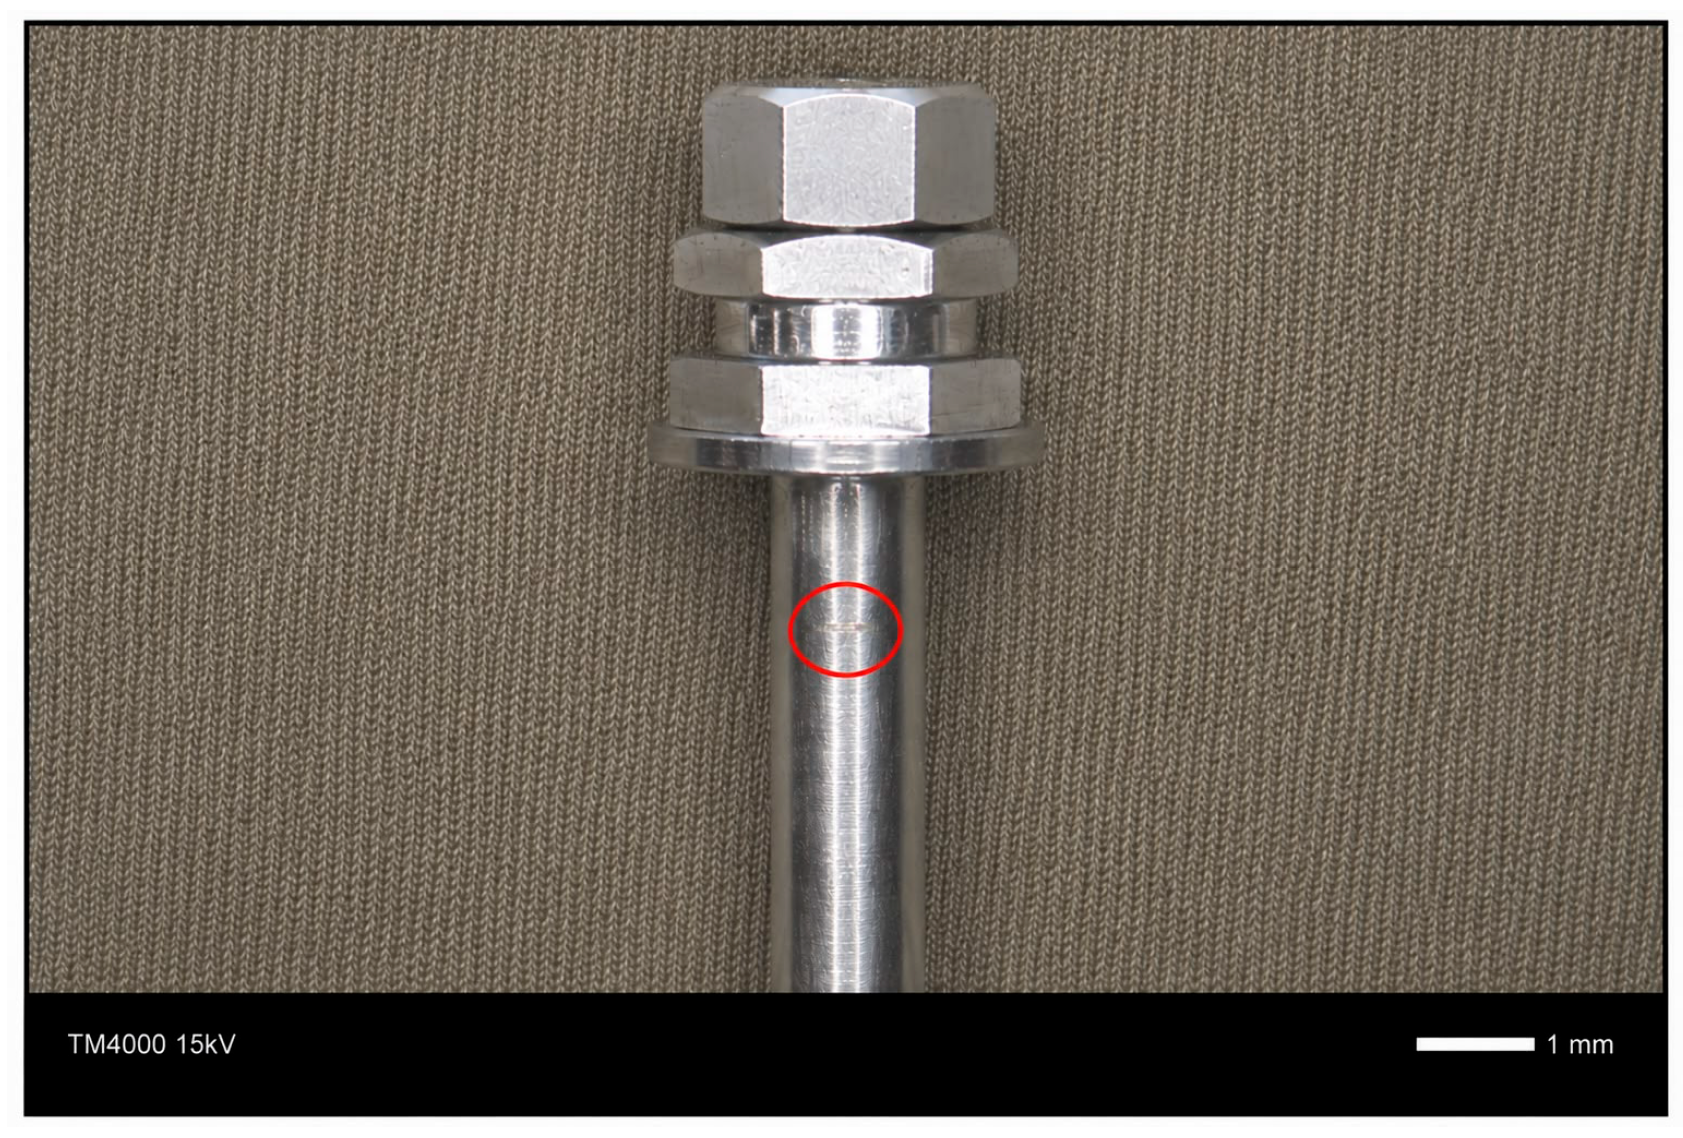
Figure 29.
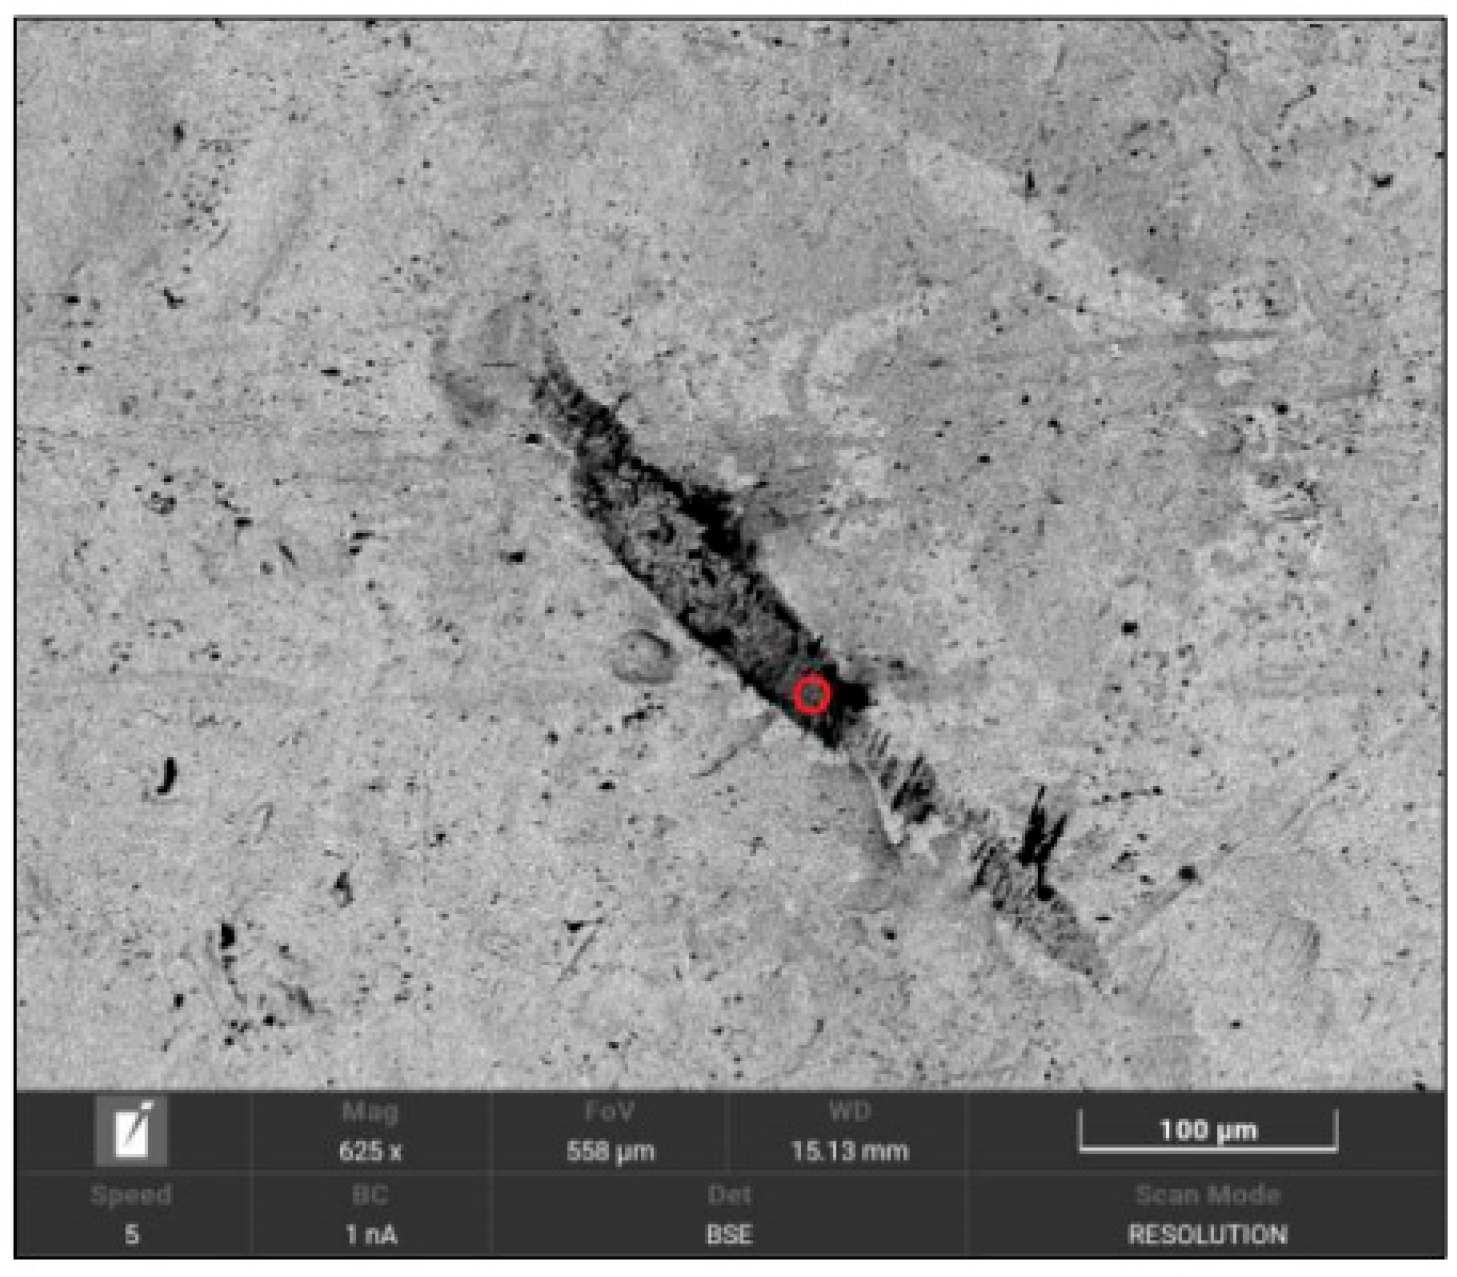
SEM image of the rod in the original condition, showing the area affected by rust.
Figure 29.
SEM image of the rod in the original condition, showing the area affected by rust.
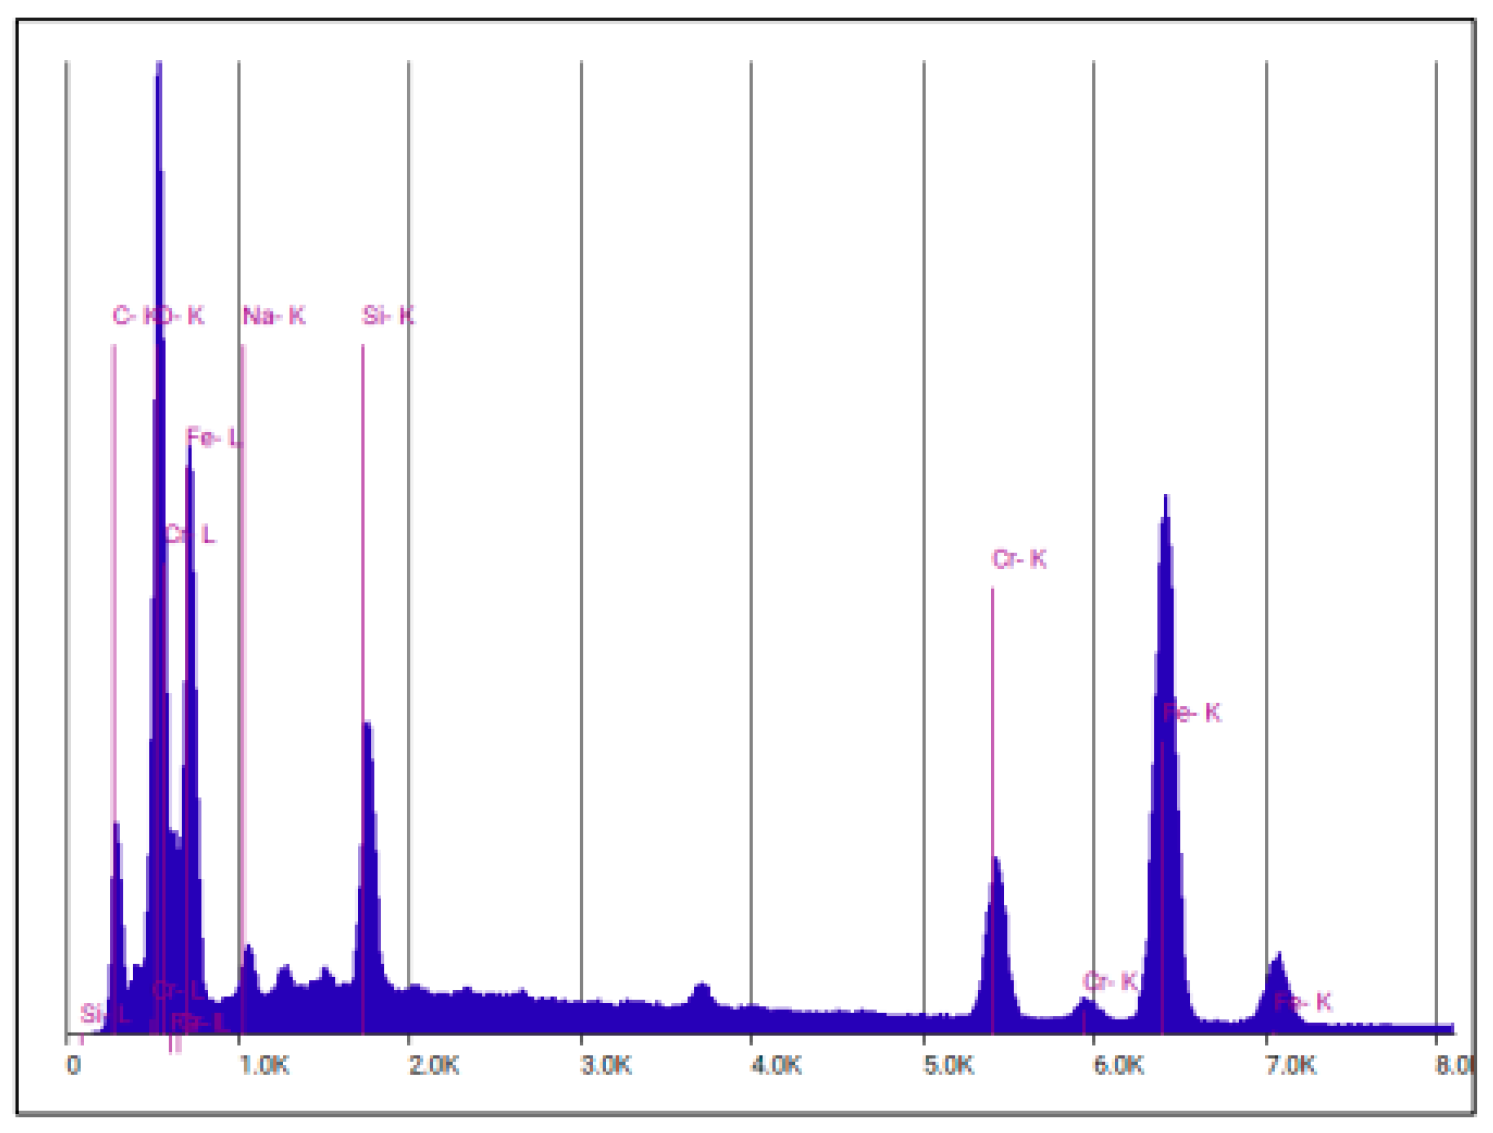
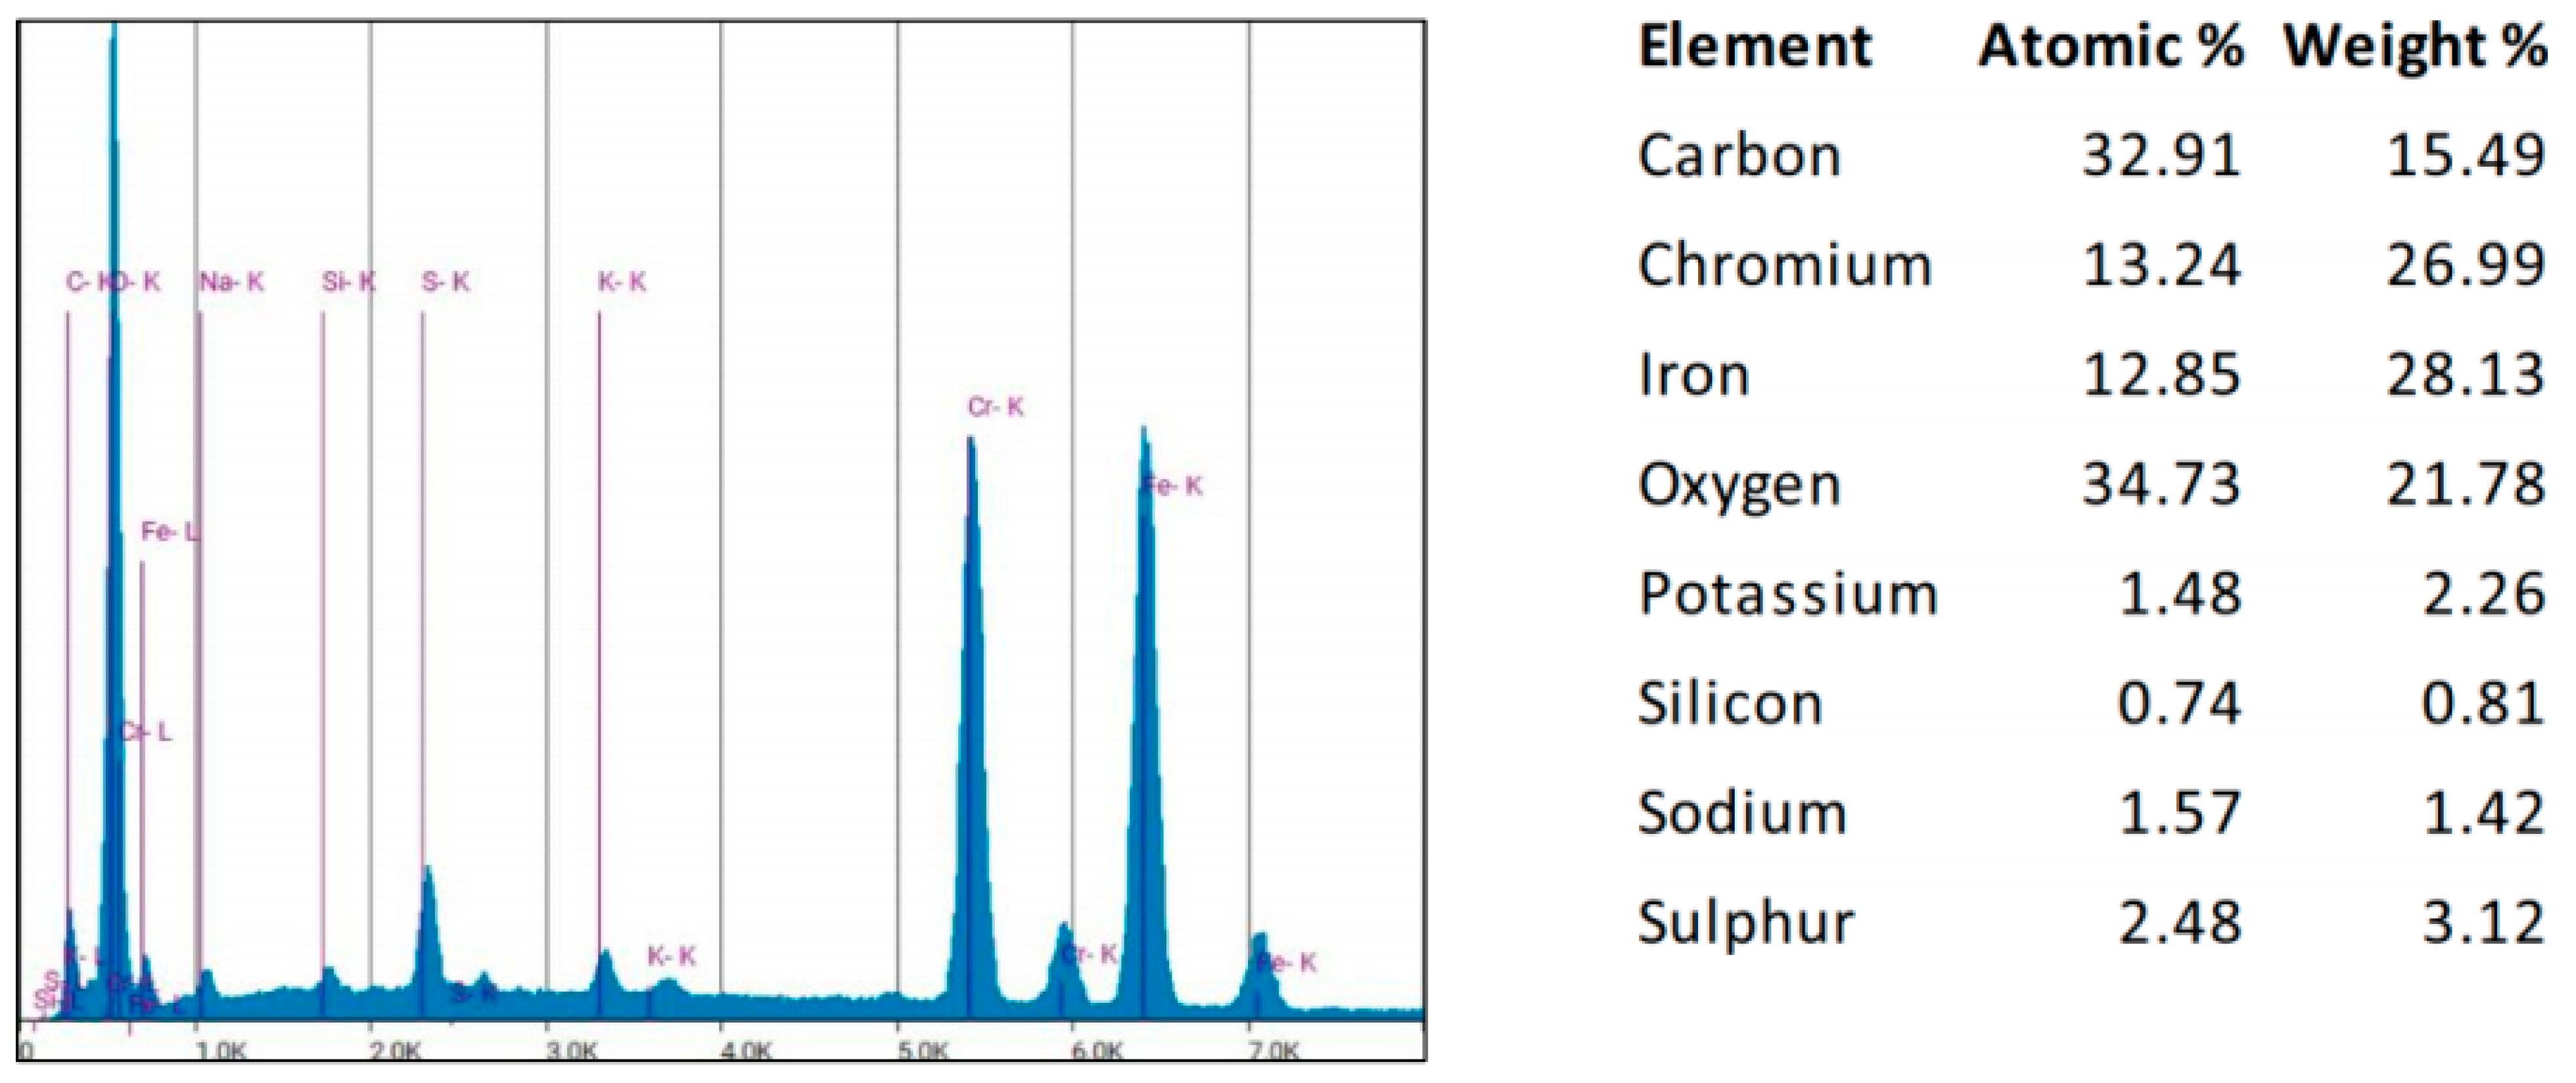
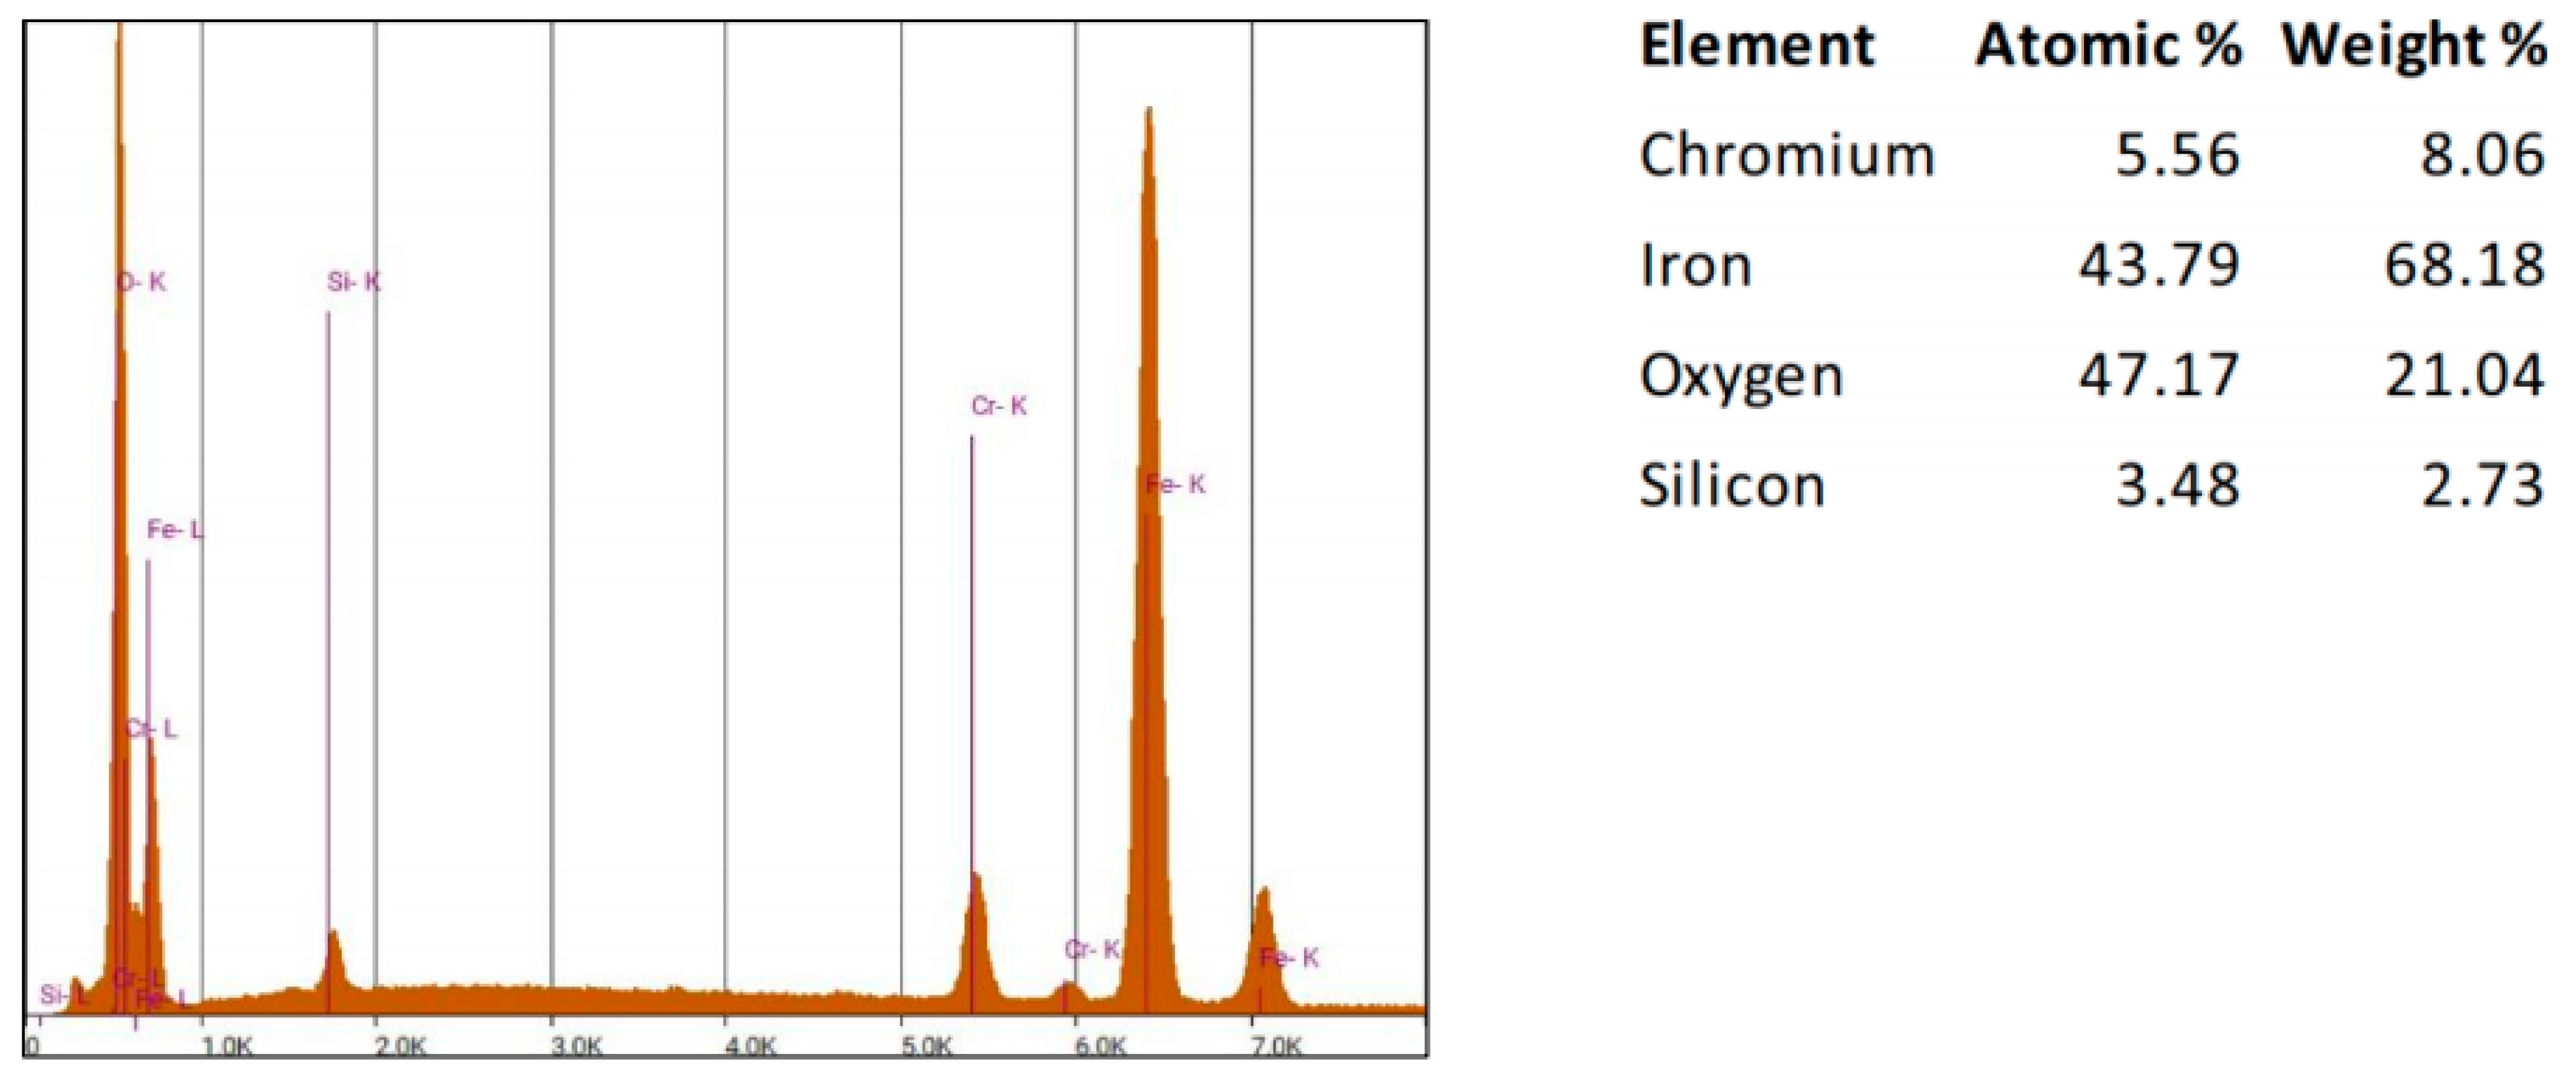
Figure 30.
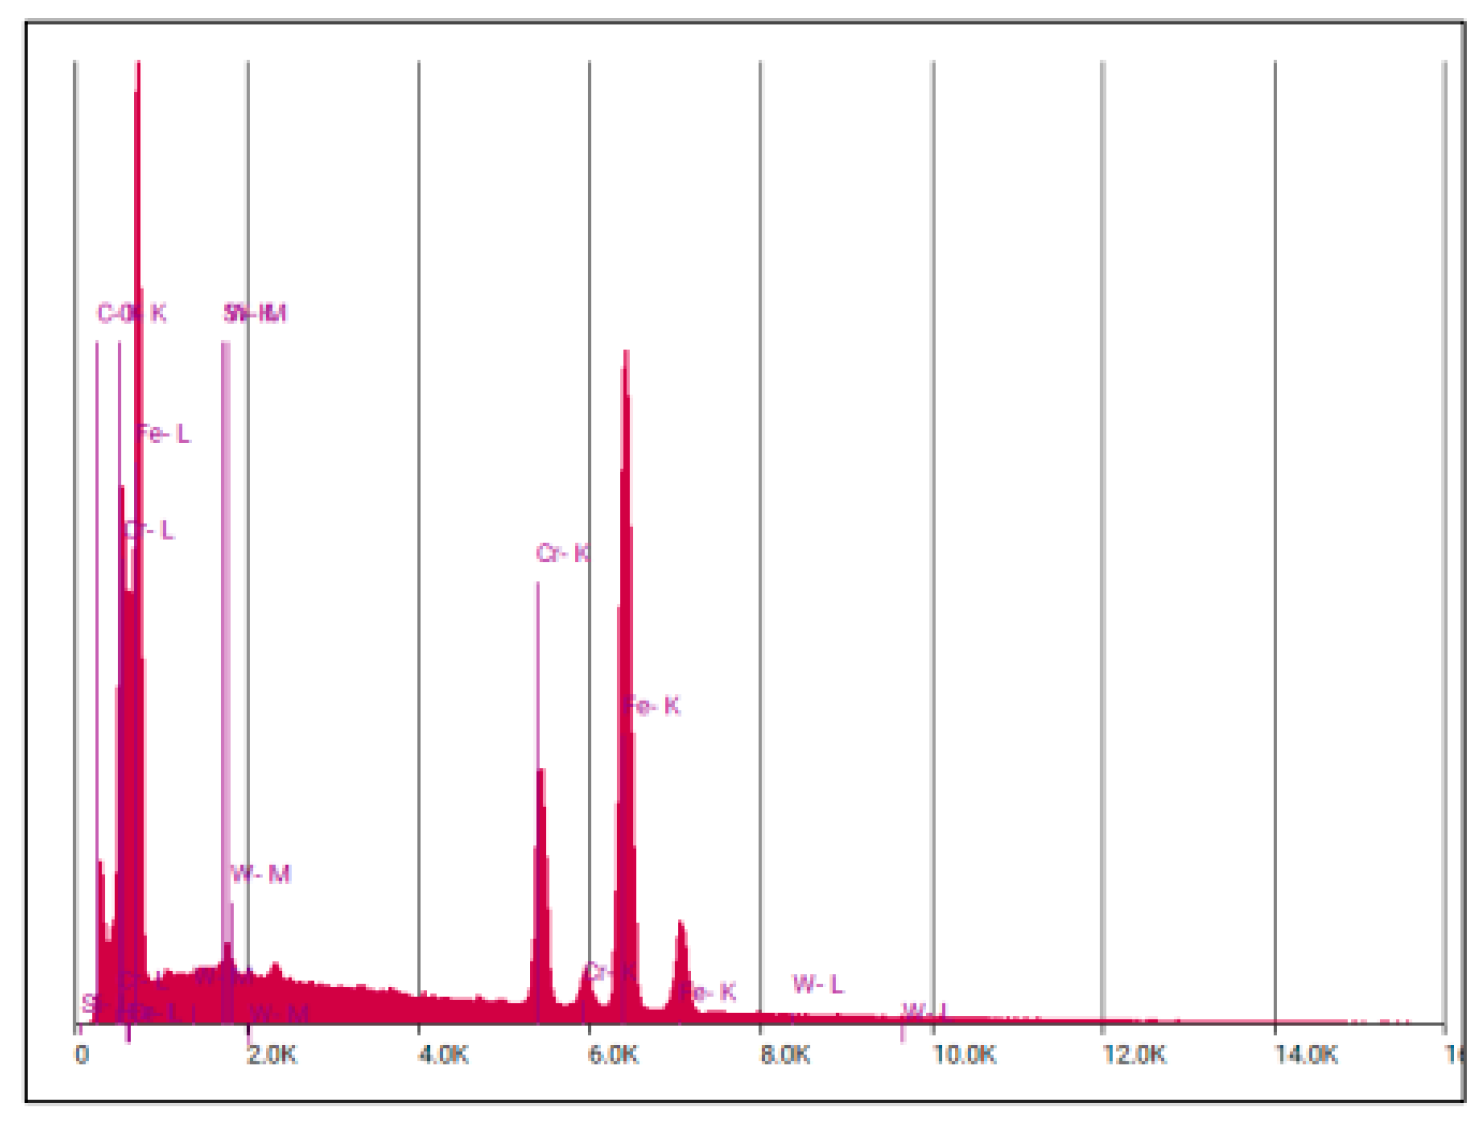
EDS spectrum of AISI 420 in the original condition, showing the area affected by rust (area circled in
Figure 29).
Figure 30.
EDS spectrum of AISI 420 in the original condition, showing the area affected by rust (area circled in
Figure 29).
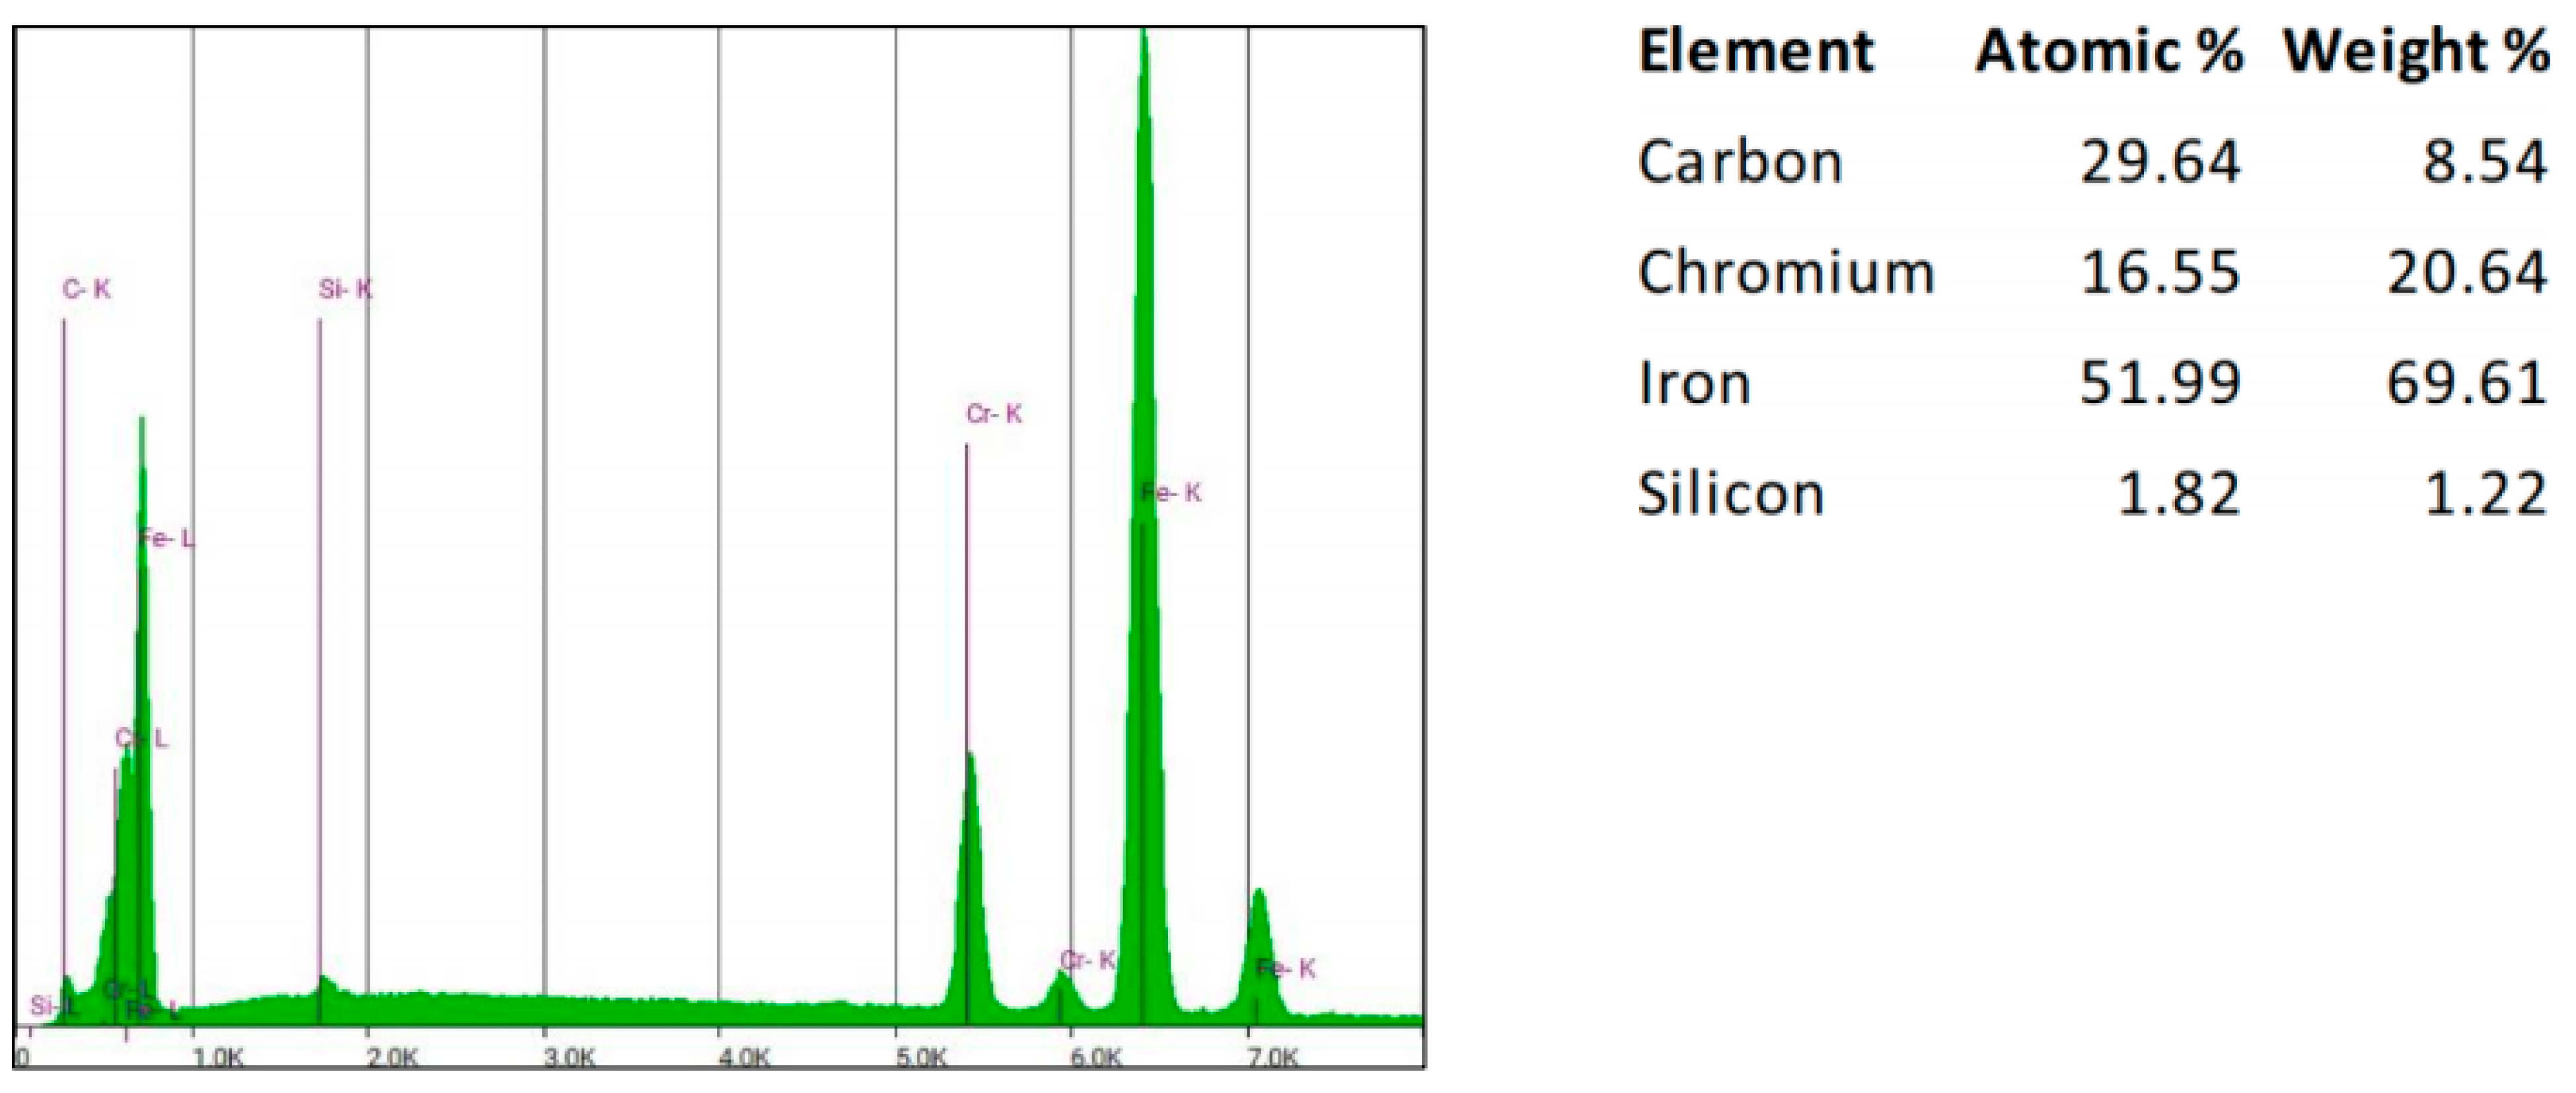
Figure 31.
EDS quantitative analysis of AISI 420 in the original condition, showing the area affected by rust (area circled in
Figure 29).
Figure 31.
EDS quantitative analysis of AISI 420 in the original condition, showing the area affected by rust (area circled in
Figure 29).
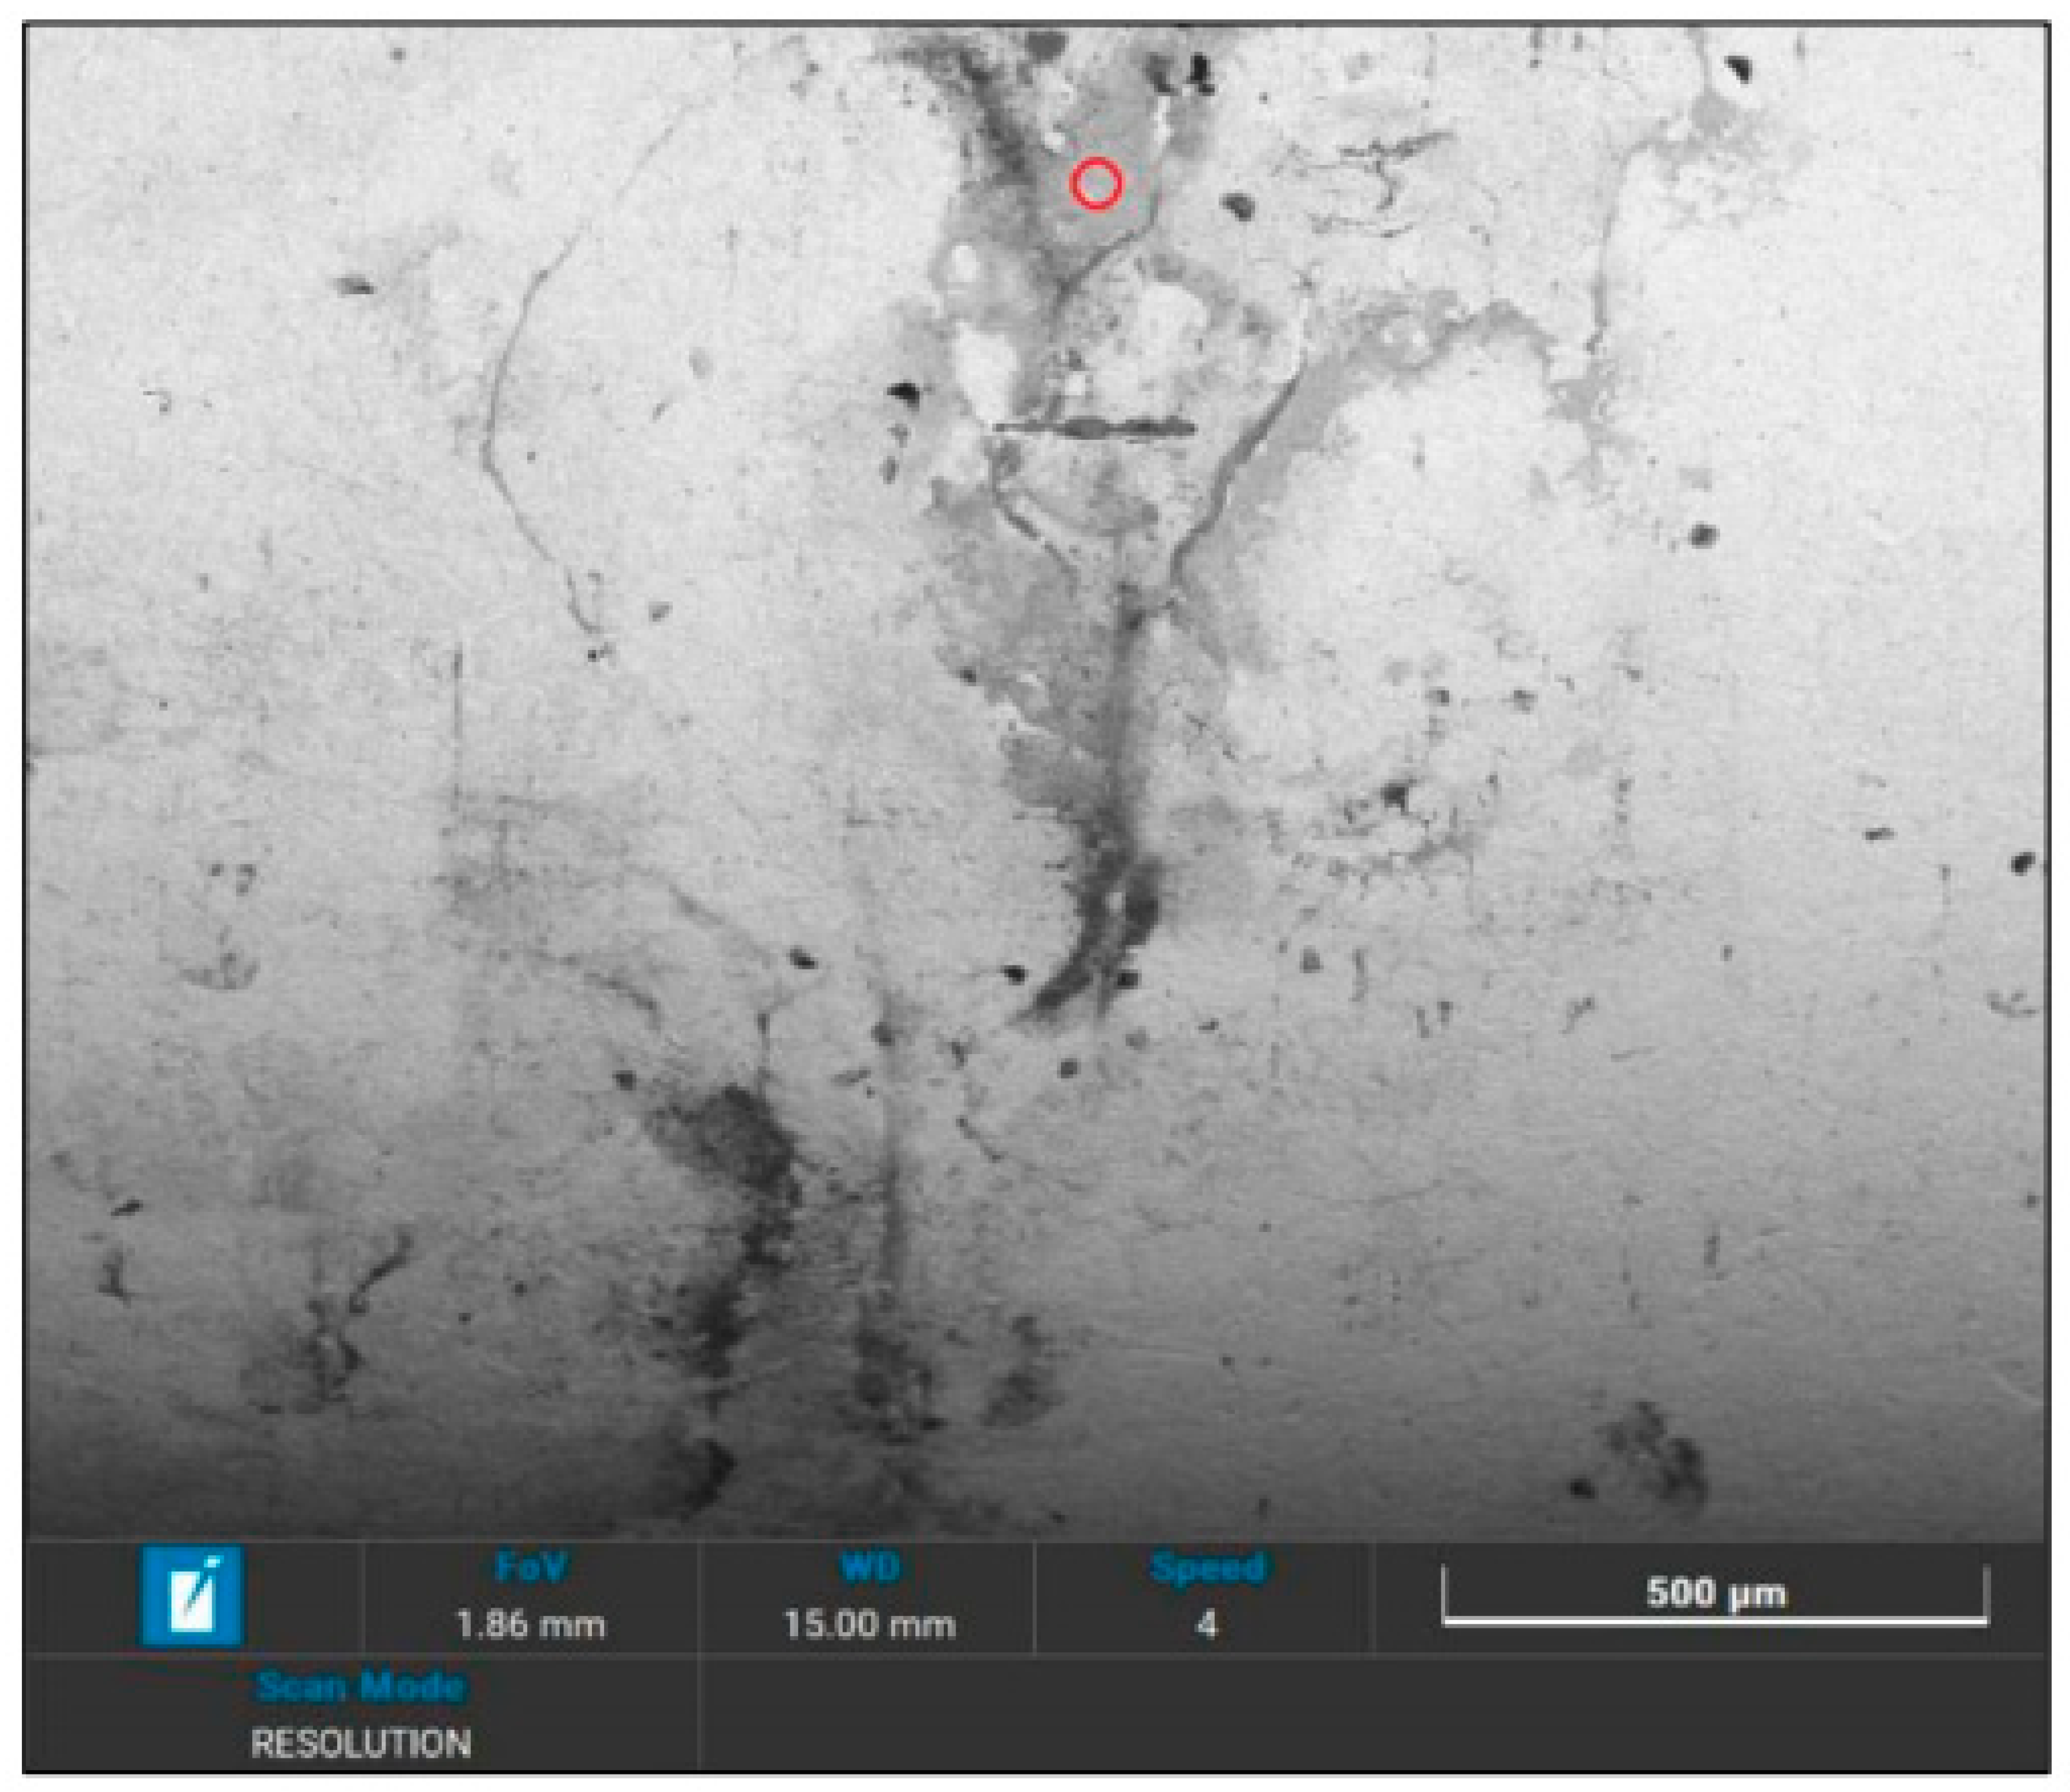
- 2.
Head: unquenched sample with rust spots.
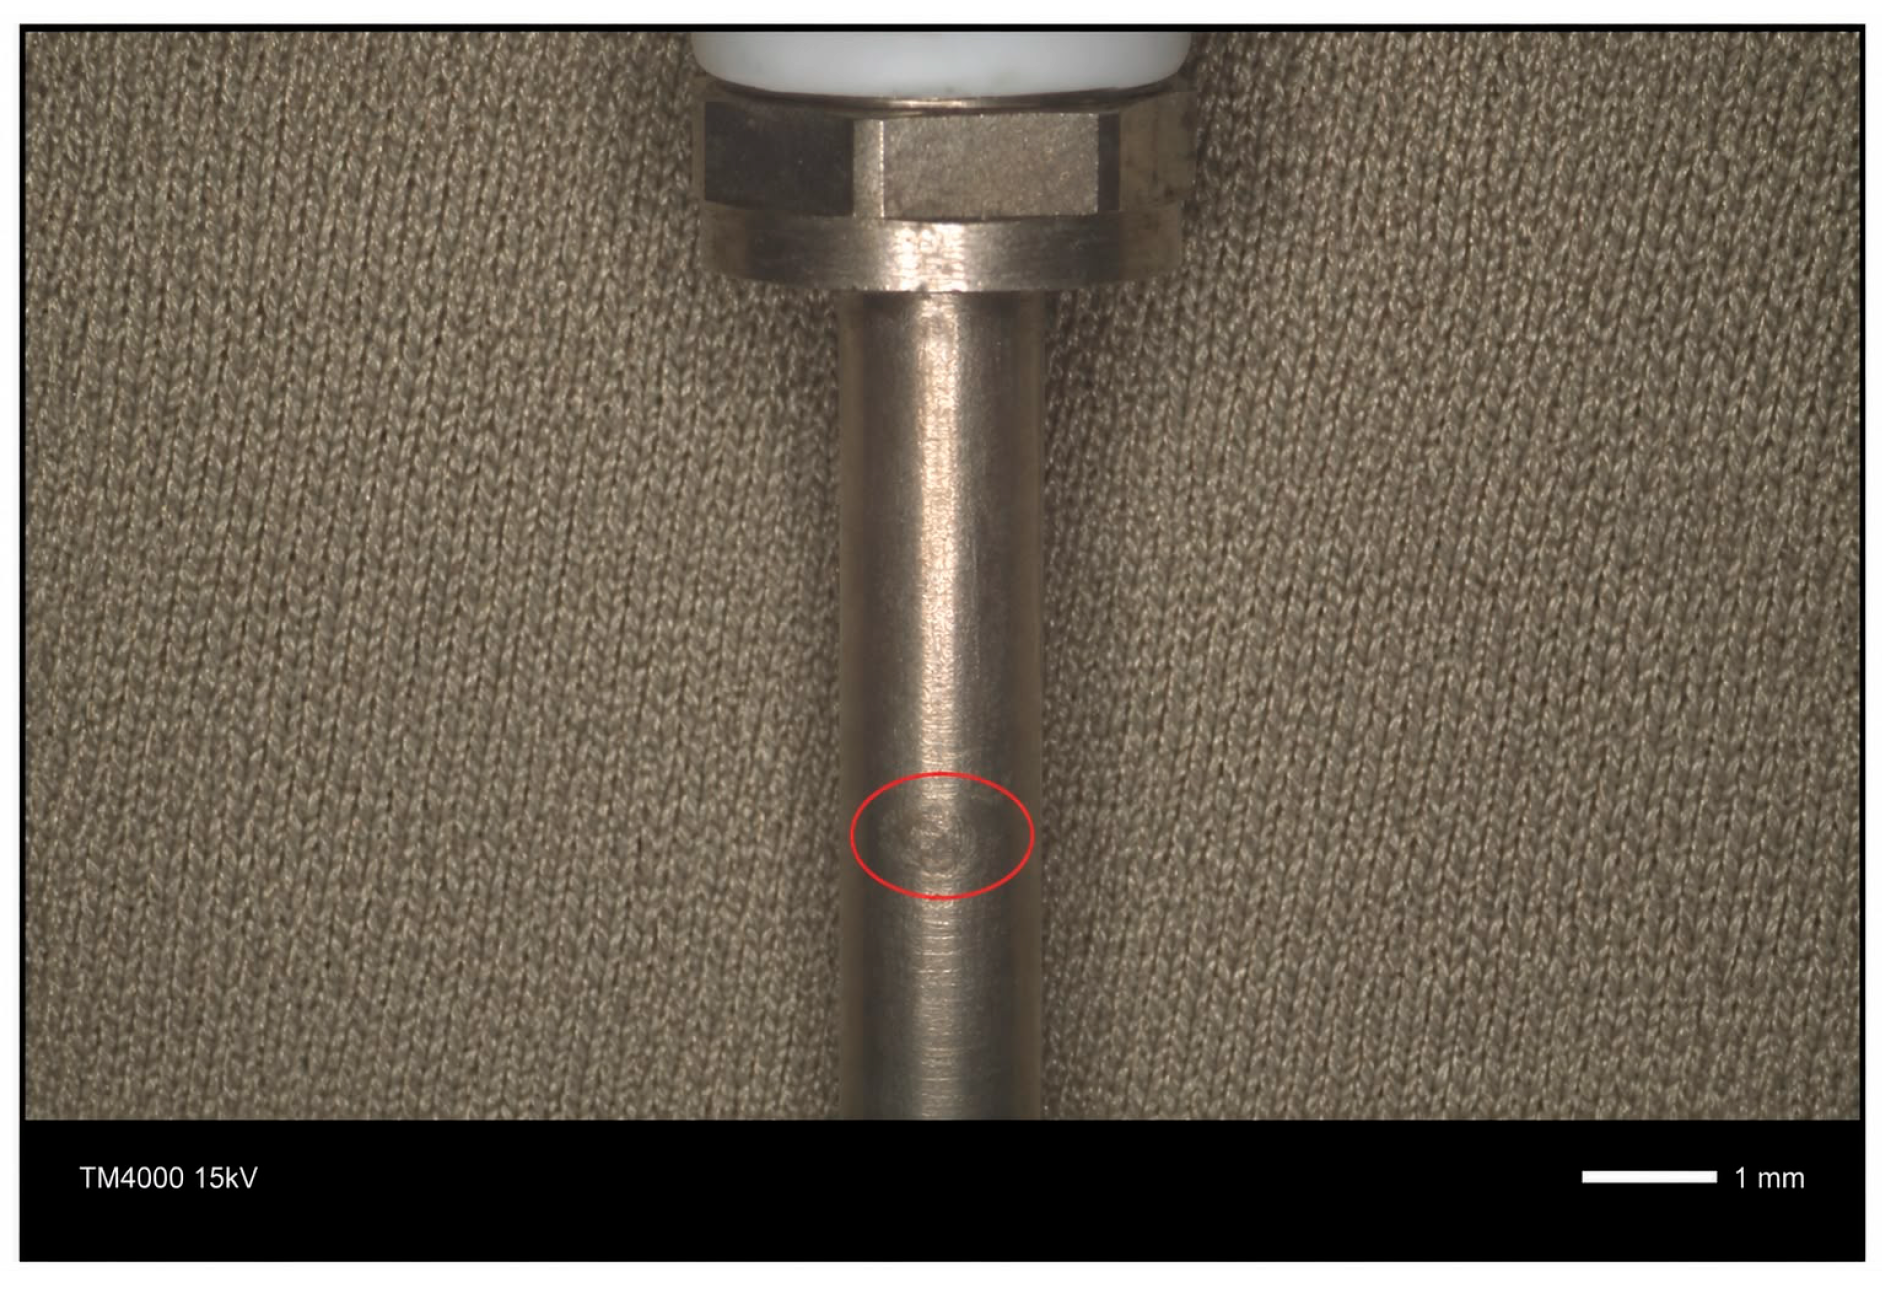
Figure 32.
SEM image of EN 1.4021 in the original condition, showing the area affected by rust.
Figure 32.
SEM image of EN 1.4021 in the original condition, showing the area affected by rust.
Figure 33.
EDS spectrum of AISI 420 in the original condition, showing the area affected by rust (area circled in
Figure 32).
Figure 33.
EDS spectrum of AISI 420 in the original condition, showing the area affected by rust (area circled in
Figure 32).
Figure 34.
EDS quantitative analysis of AISI 420in the original condition, showing the area affected by rust (area circled in
Figure 32).
Figure 34.
EDS quantitative analysis of AISI 420in the original condition, showing the area affected by rust (area circled in
Figure 32).
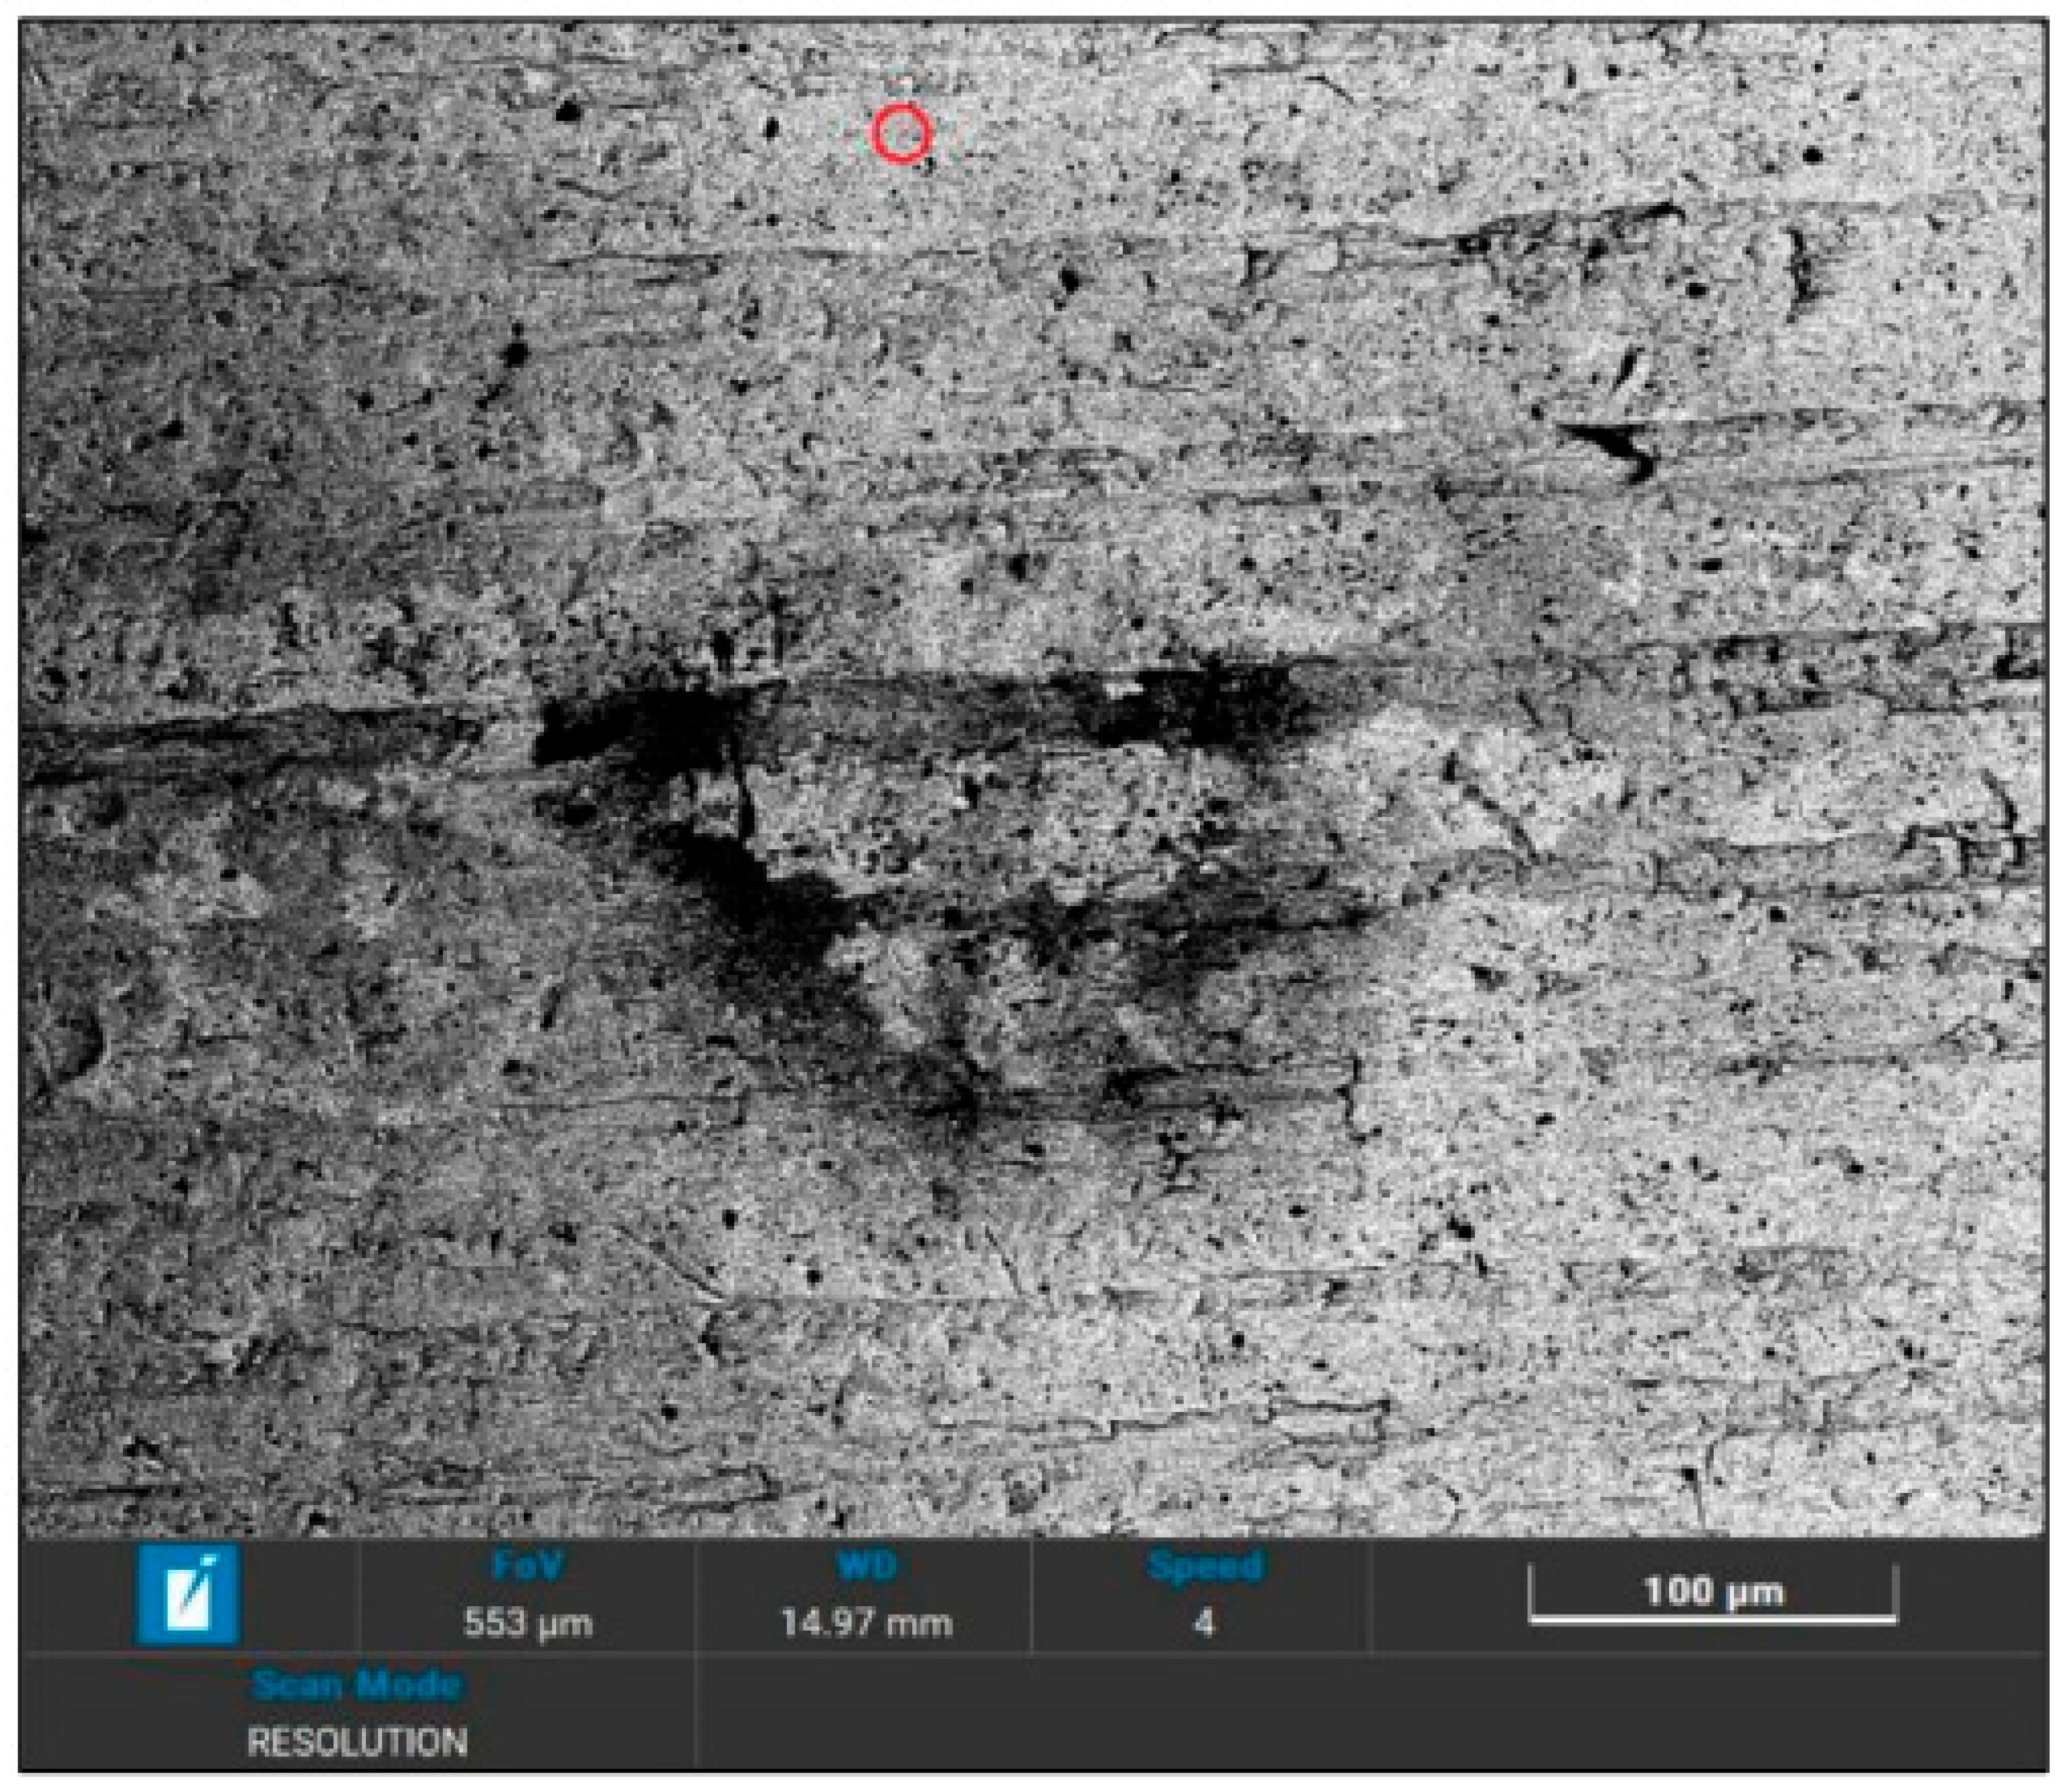
- 3.
Unquenched sample with rust spots: rust-free zone on the head surface.
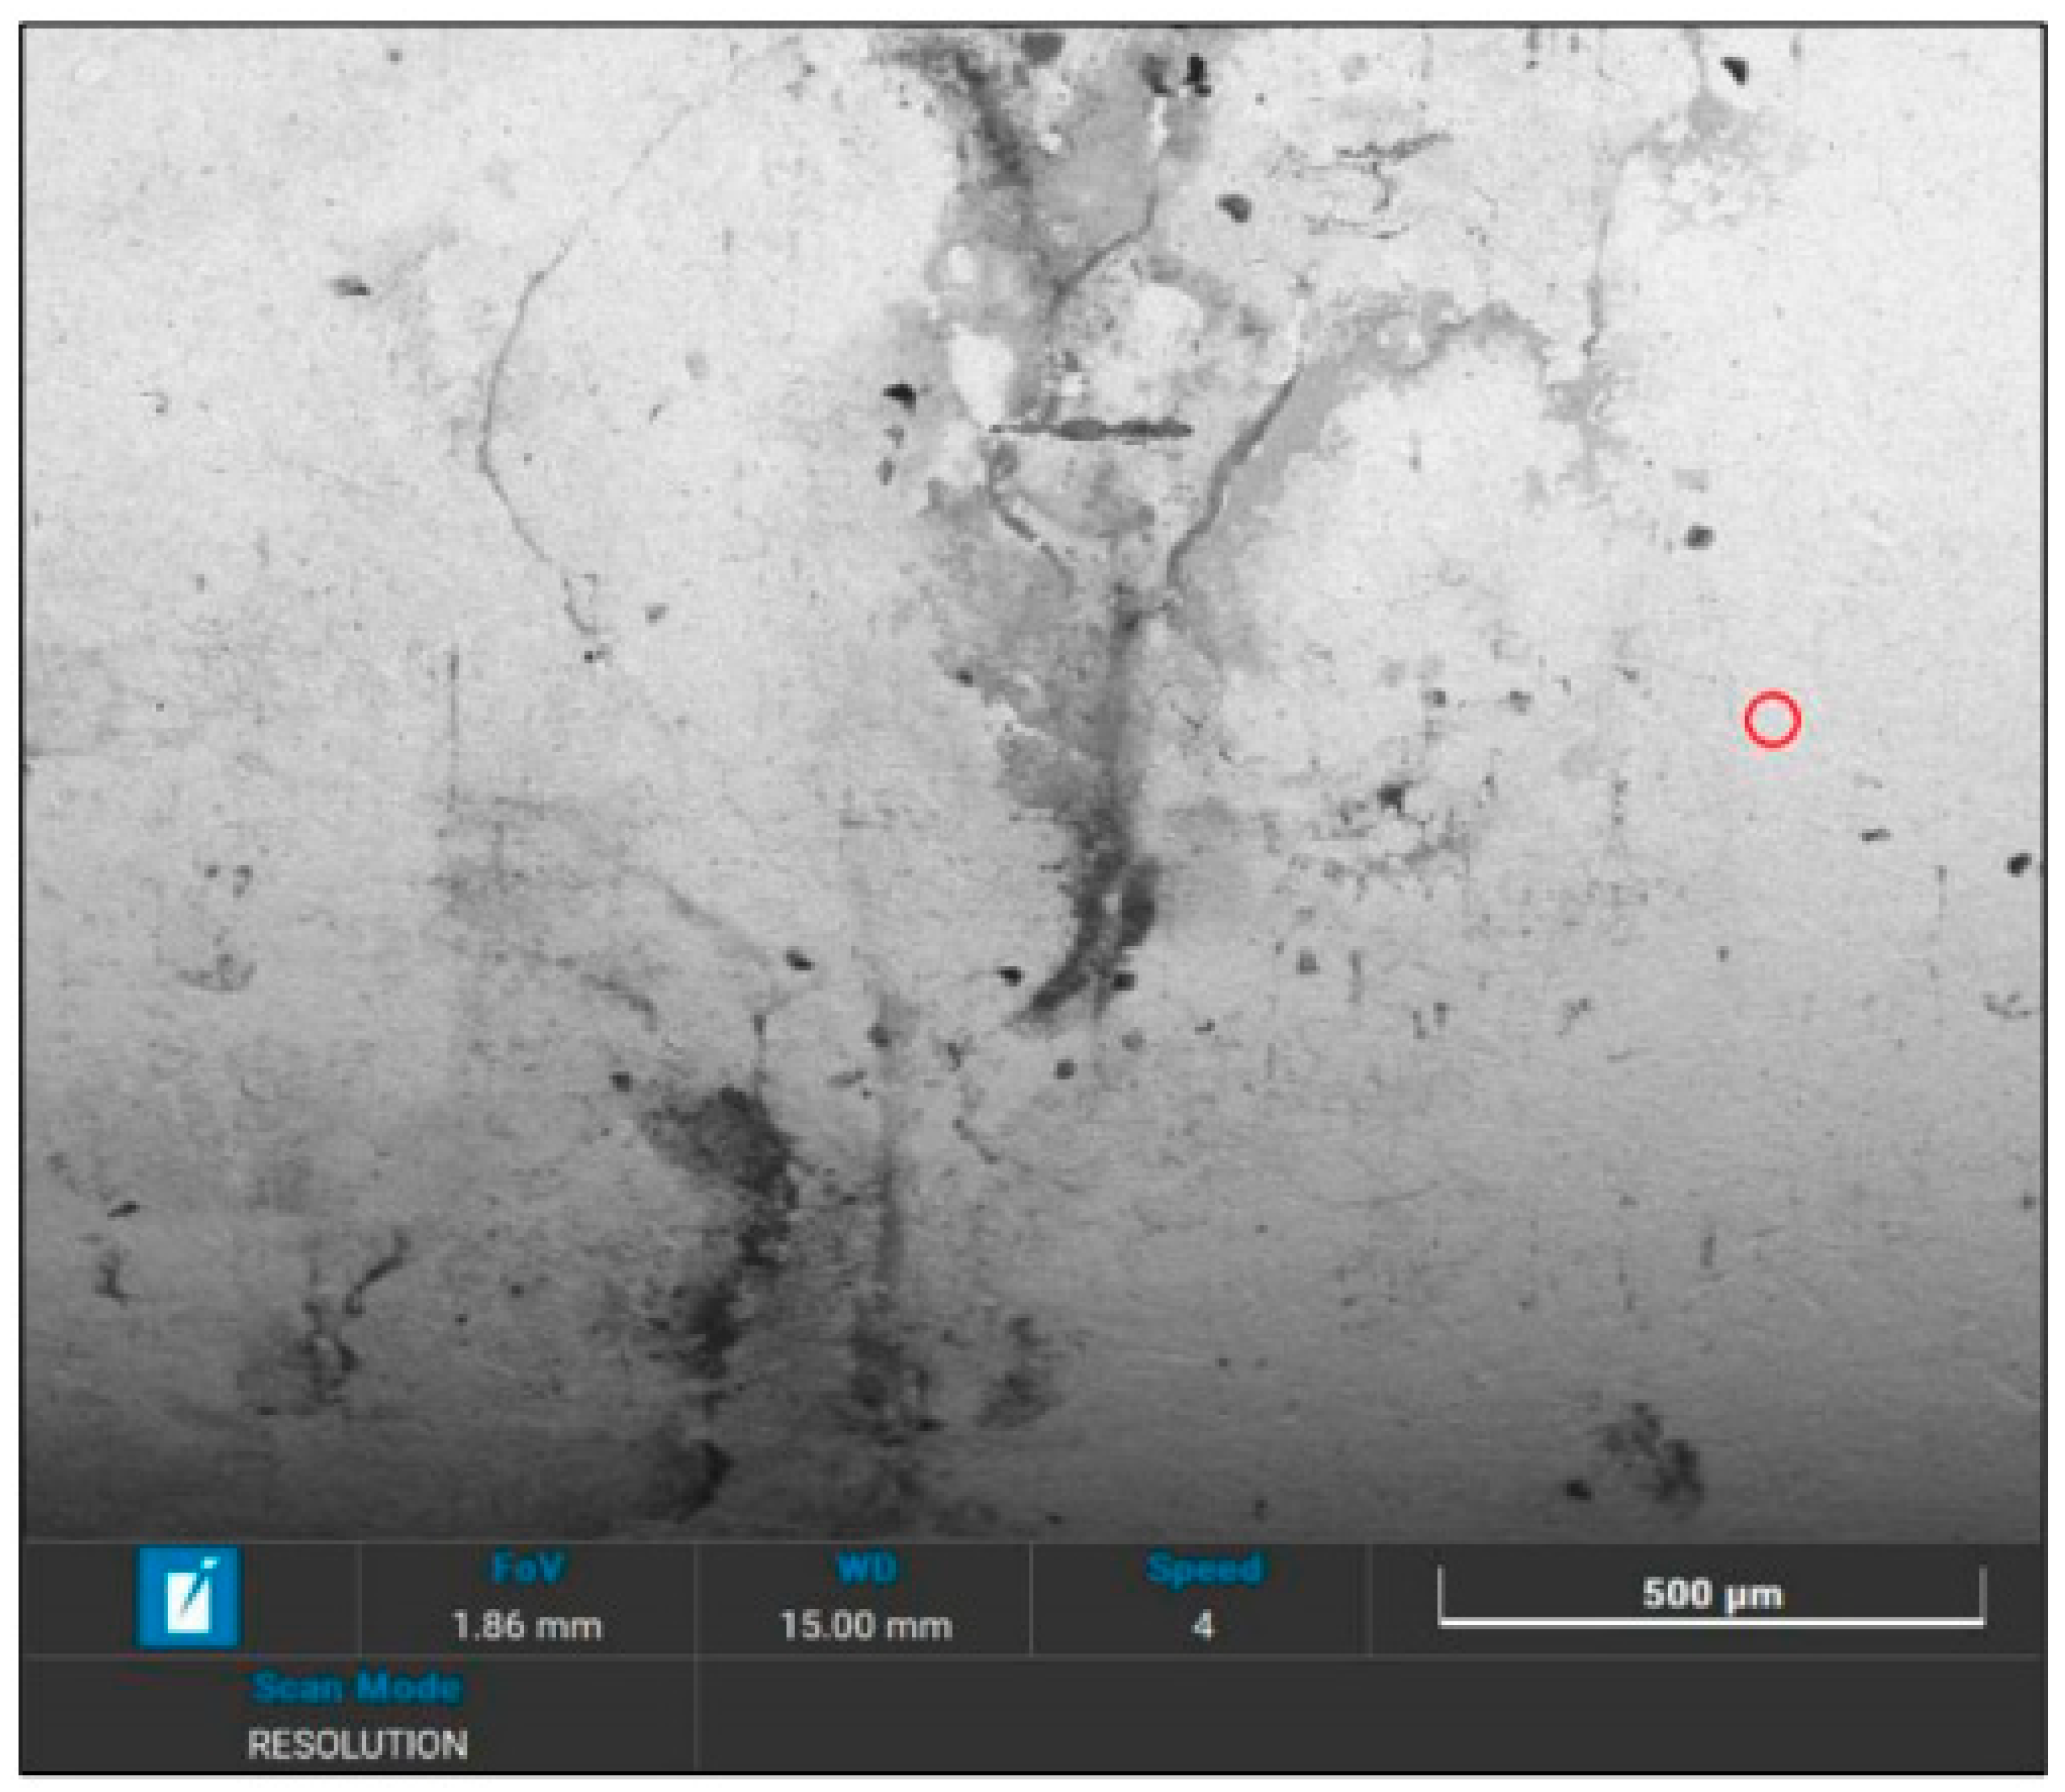
Figure 35.
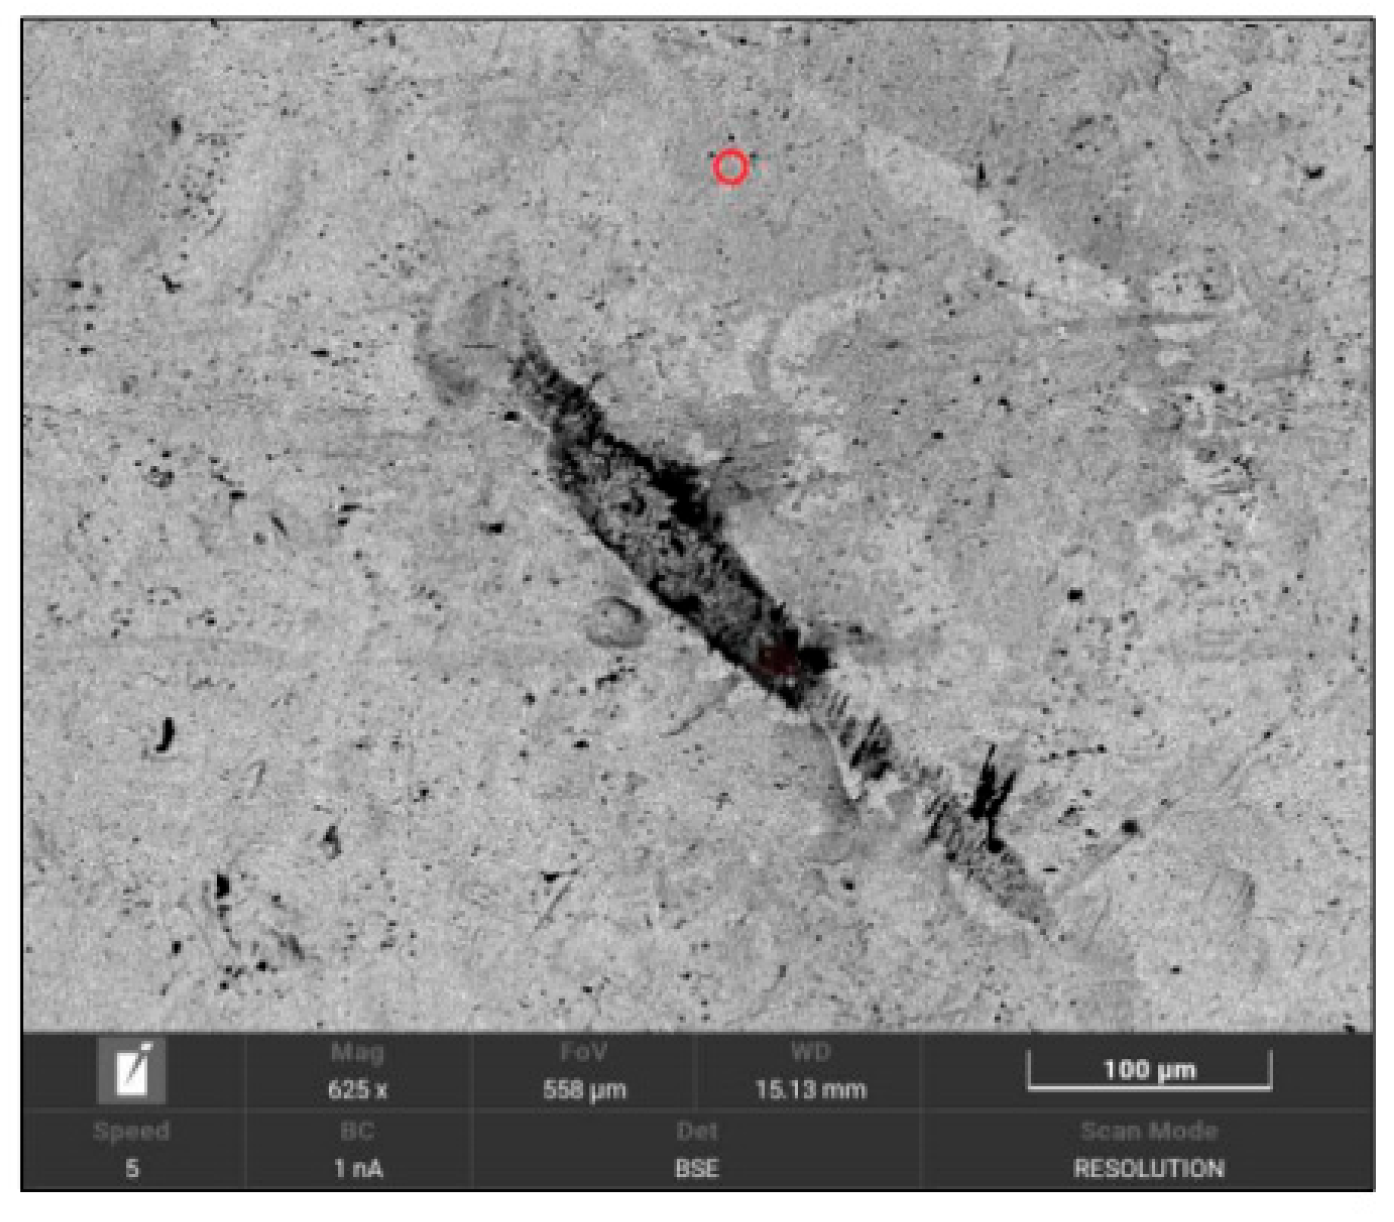
SEM image of EN 1.4021 in the original condition, showing the area not affected by rust.
Figure 35.
SEM image of EN 1.4021 in the original condition, showing the area not affected by rust.
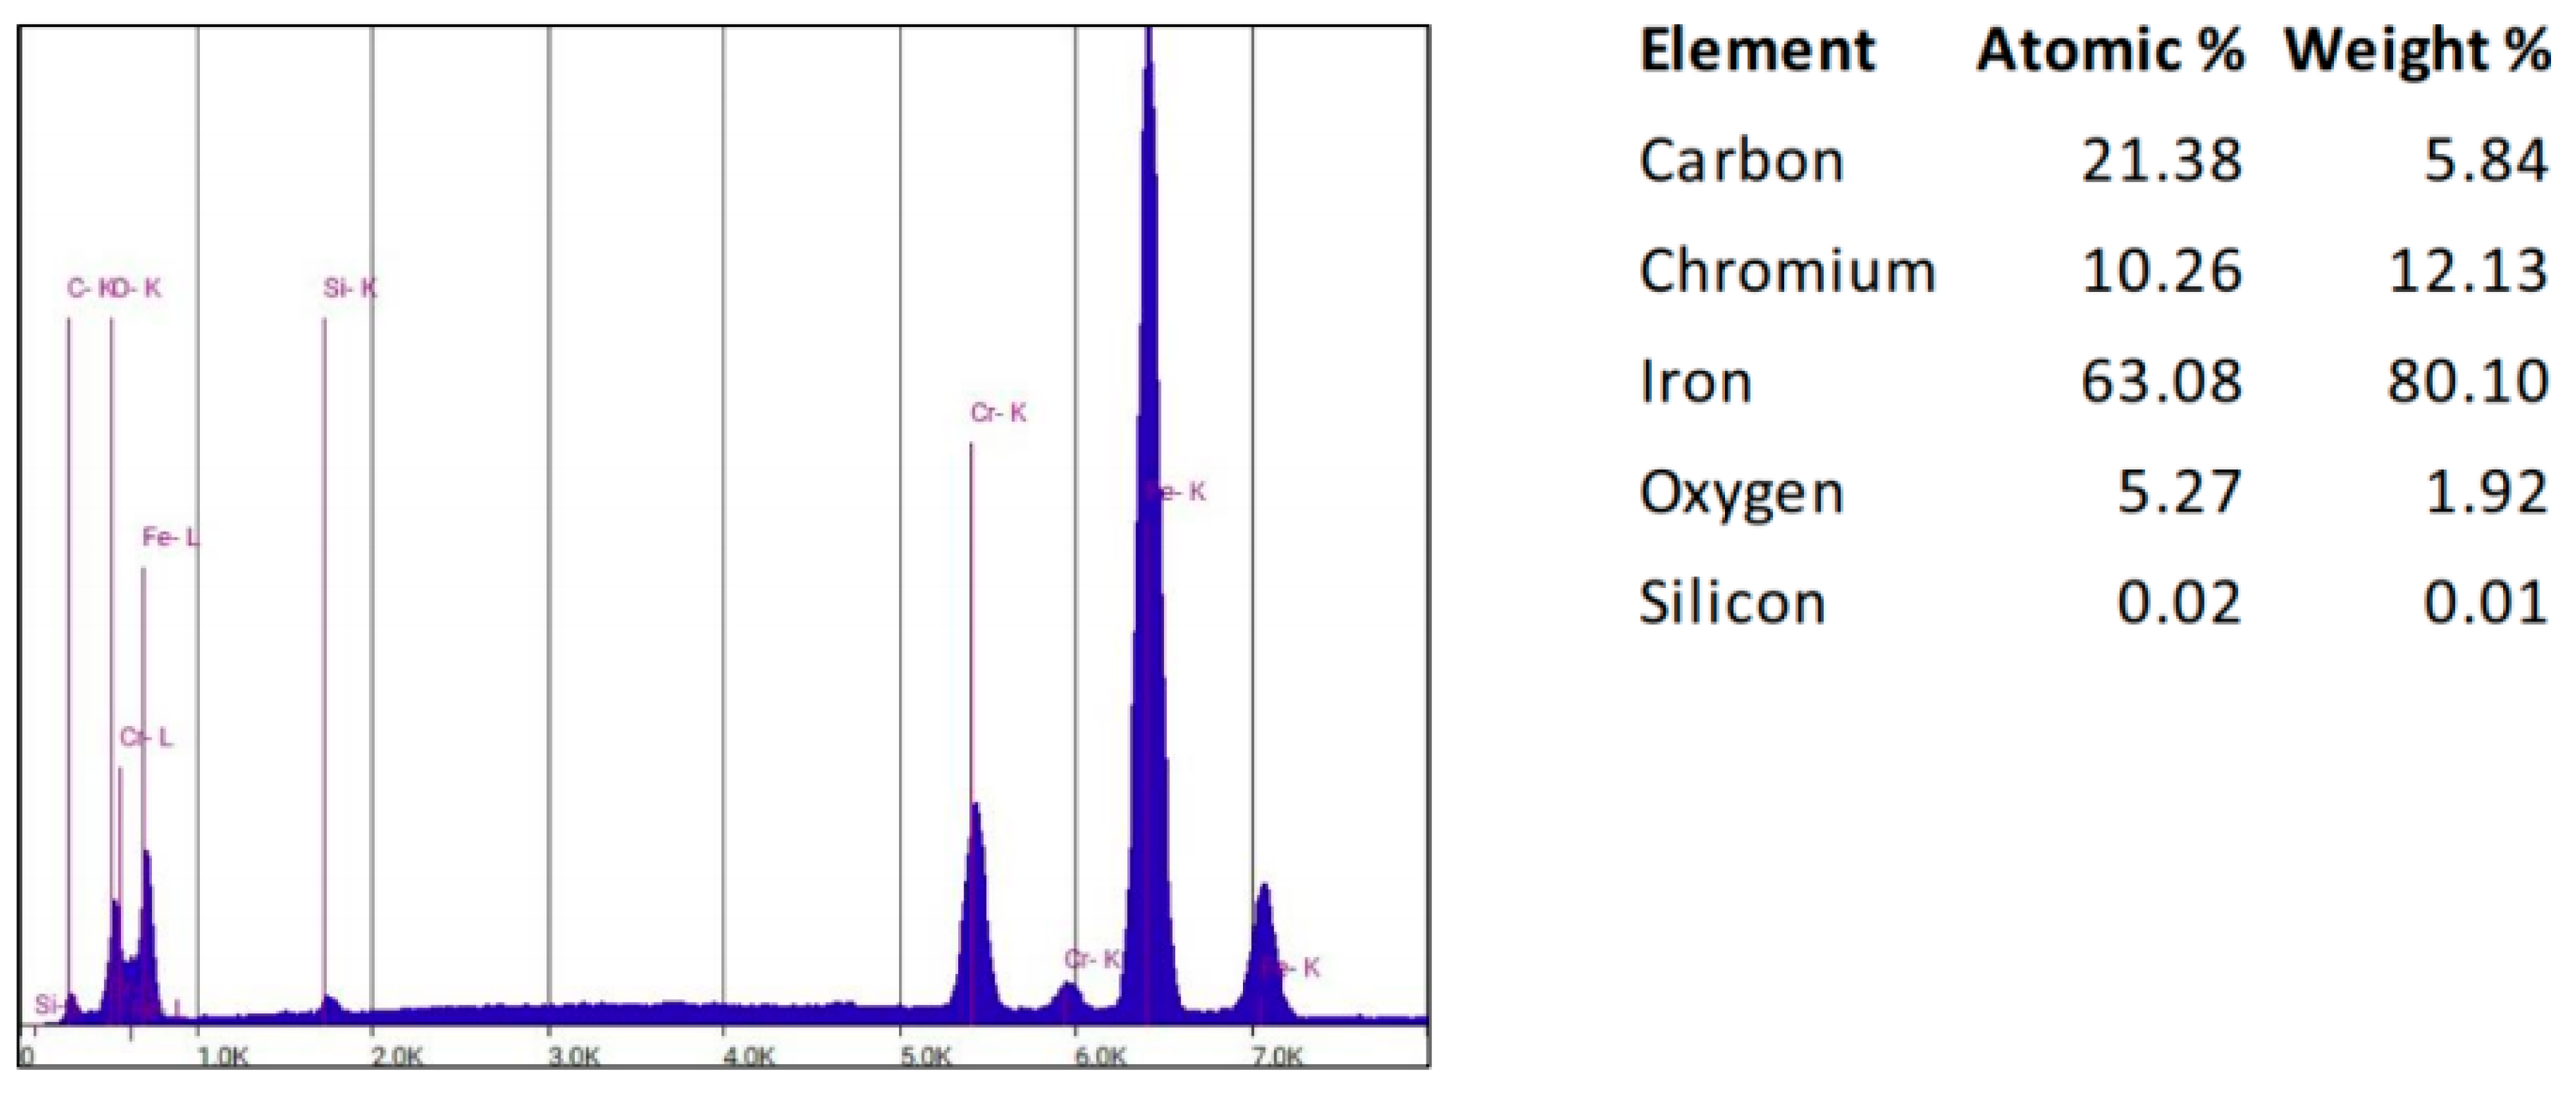
Figure 36.
EDS spectrum of AISI 420 in the original condition, showing the area not affected by rust (area circled in
Figure 35).
Figure 36.
EDS spectrum of AISI 420 in the original condition, showing the area not affected by rust (area circled in
Figure 35).
Figure 37.
EDS quantitative analysis of AISI 420 in the original condition, showing the area not affected by rust (area circled in
Figure 35).
Figure 37.
EDS quantitative analysis of AISI 420 in the original condition, showing the area not affected by rust (area circled in
Figure 35).
- 4.
Quenched and sterilised rod sample.
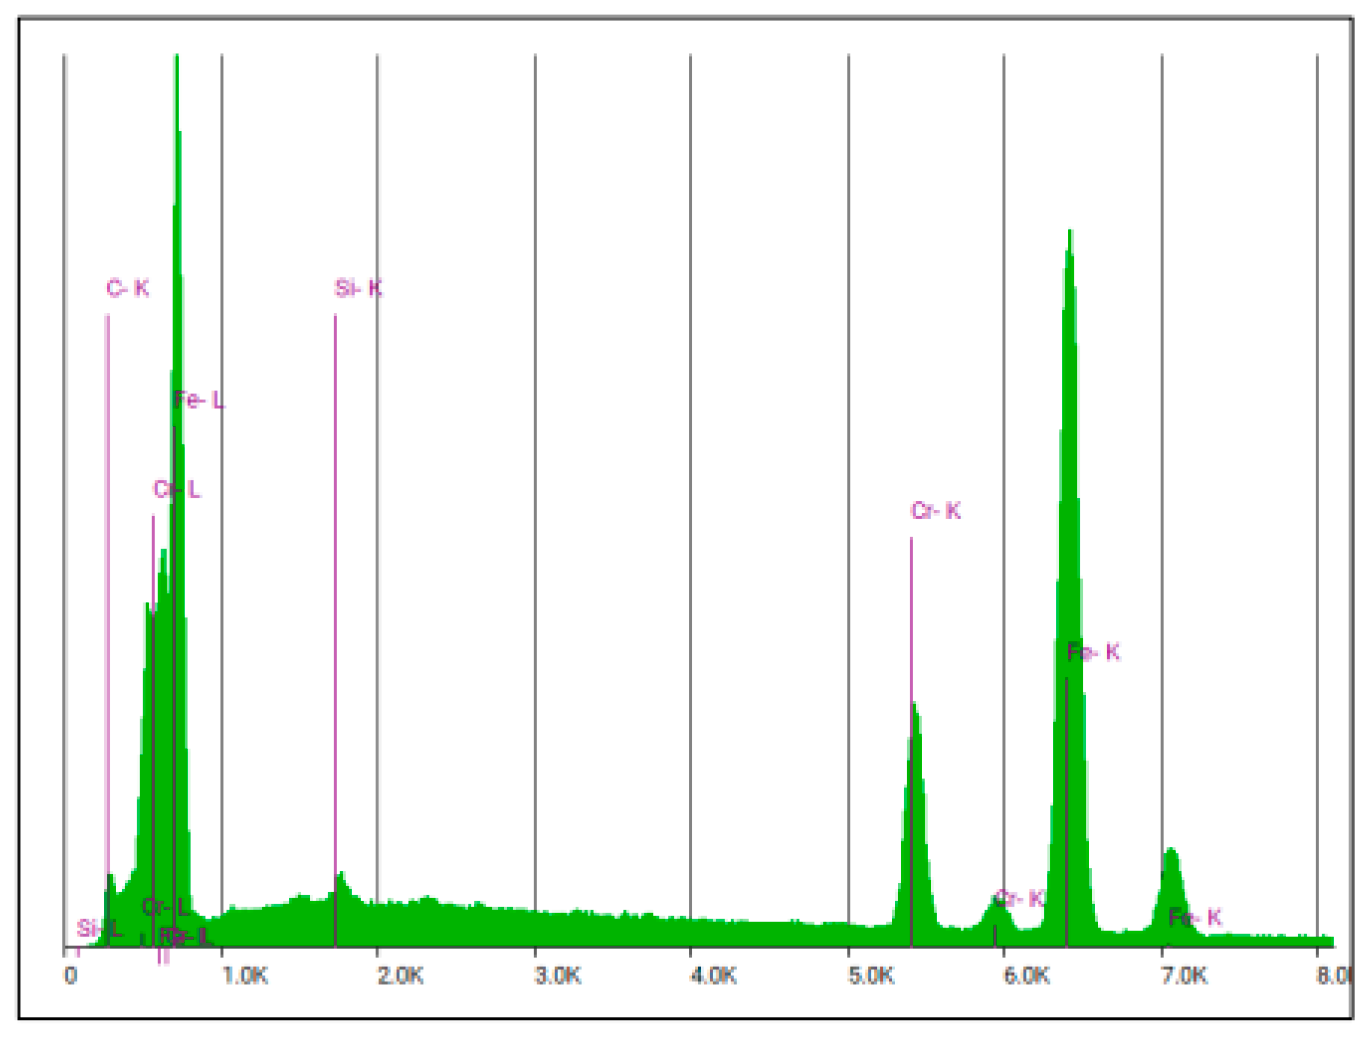
Figure 27 and
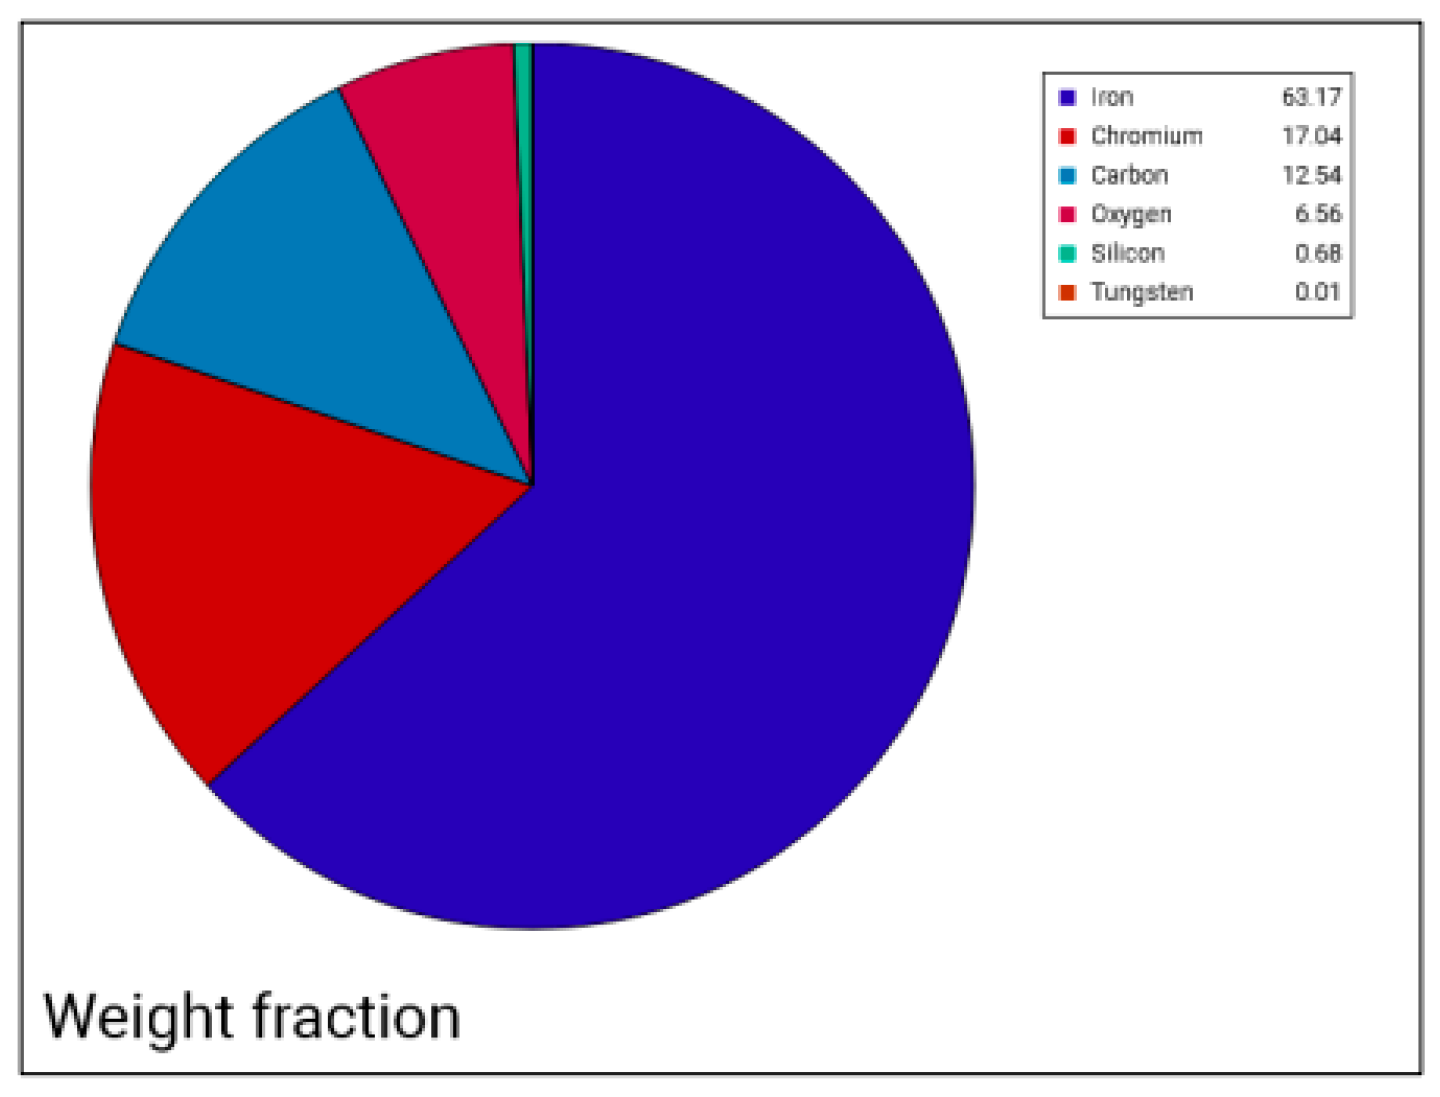
Figure 28 show the EDS spectrum and the corresponding quantitative analysis of the area circled in red.
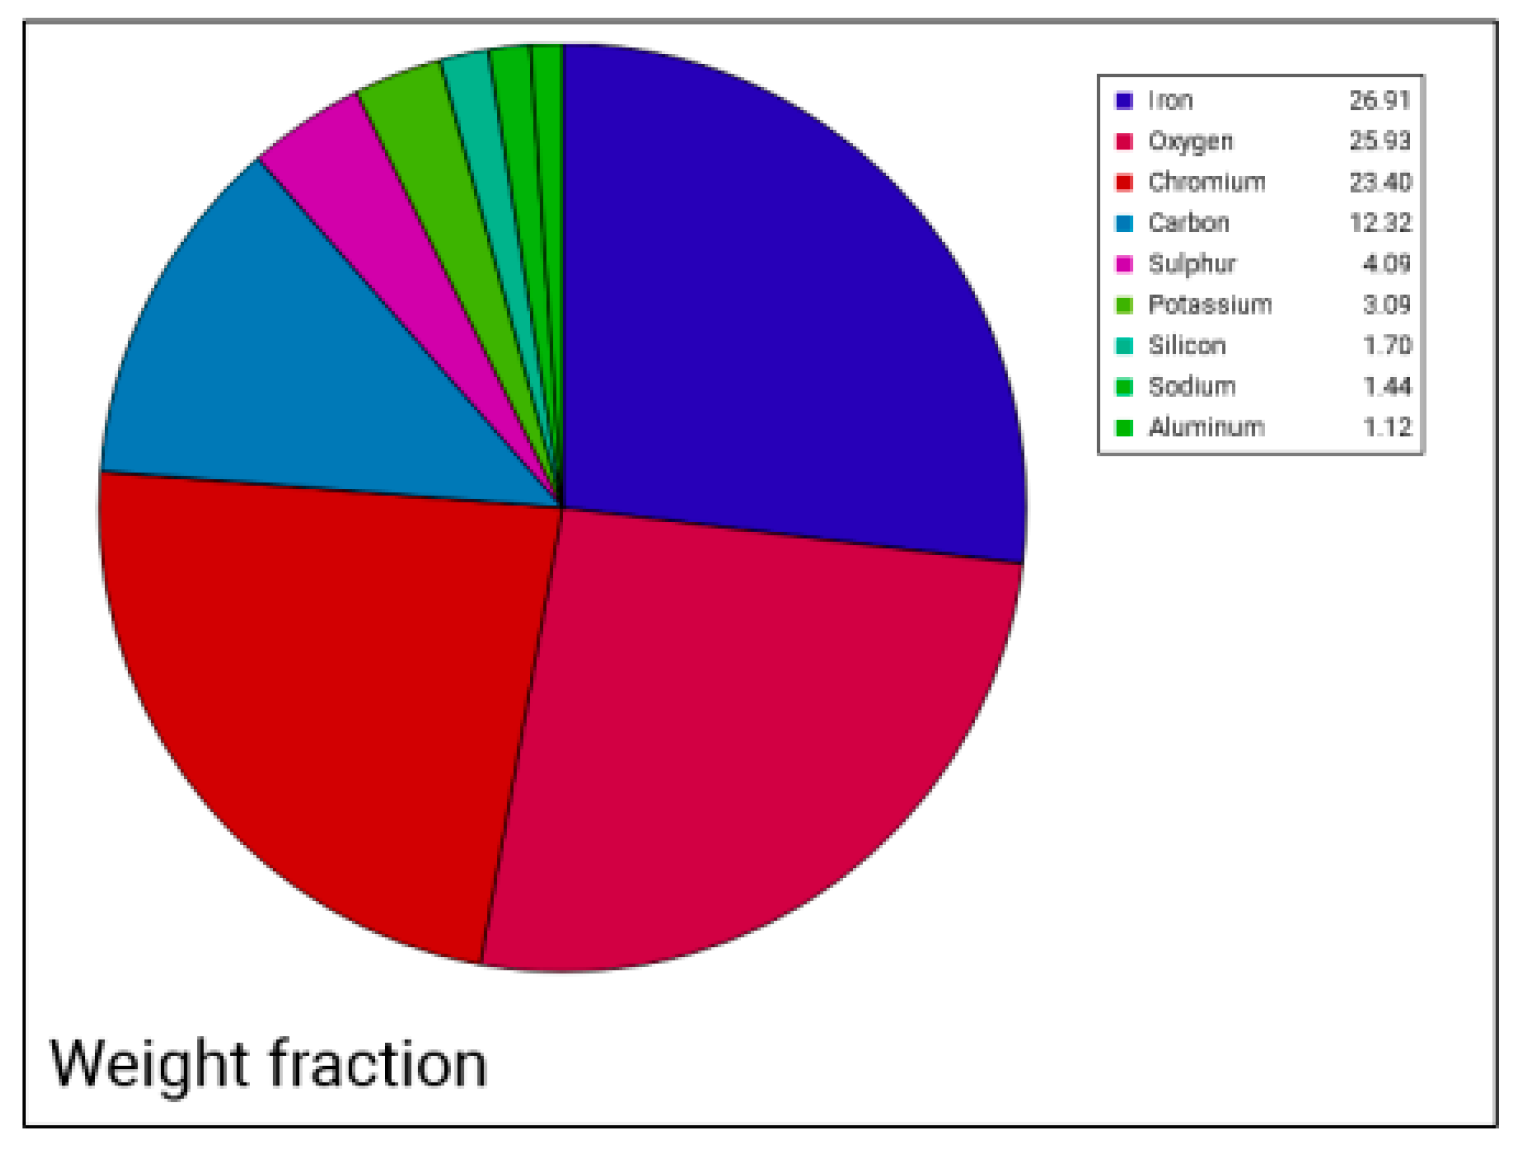
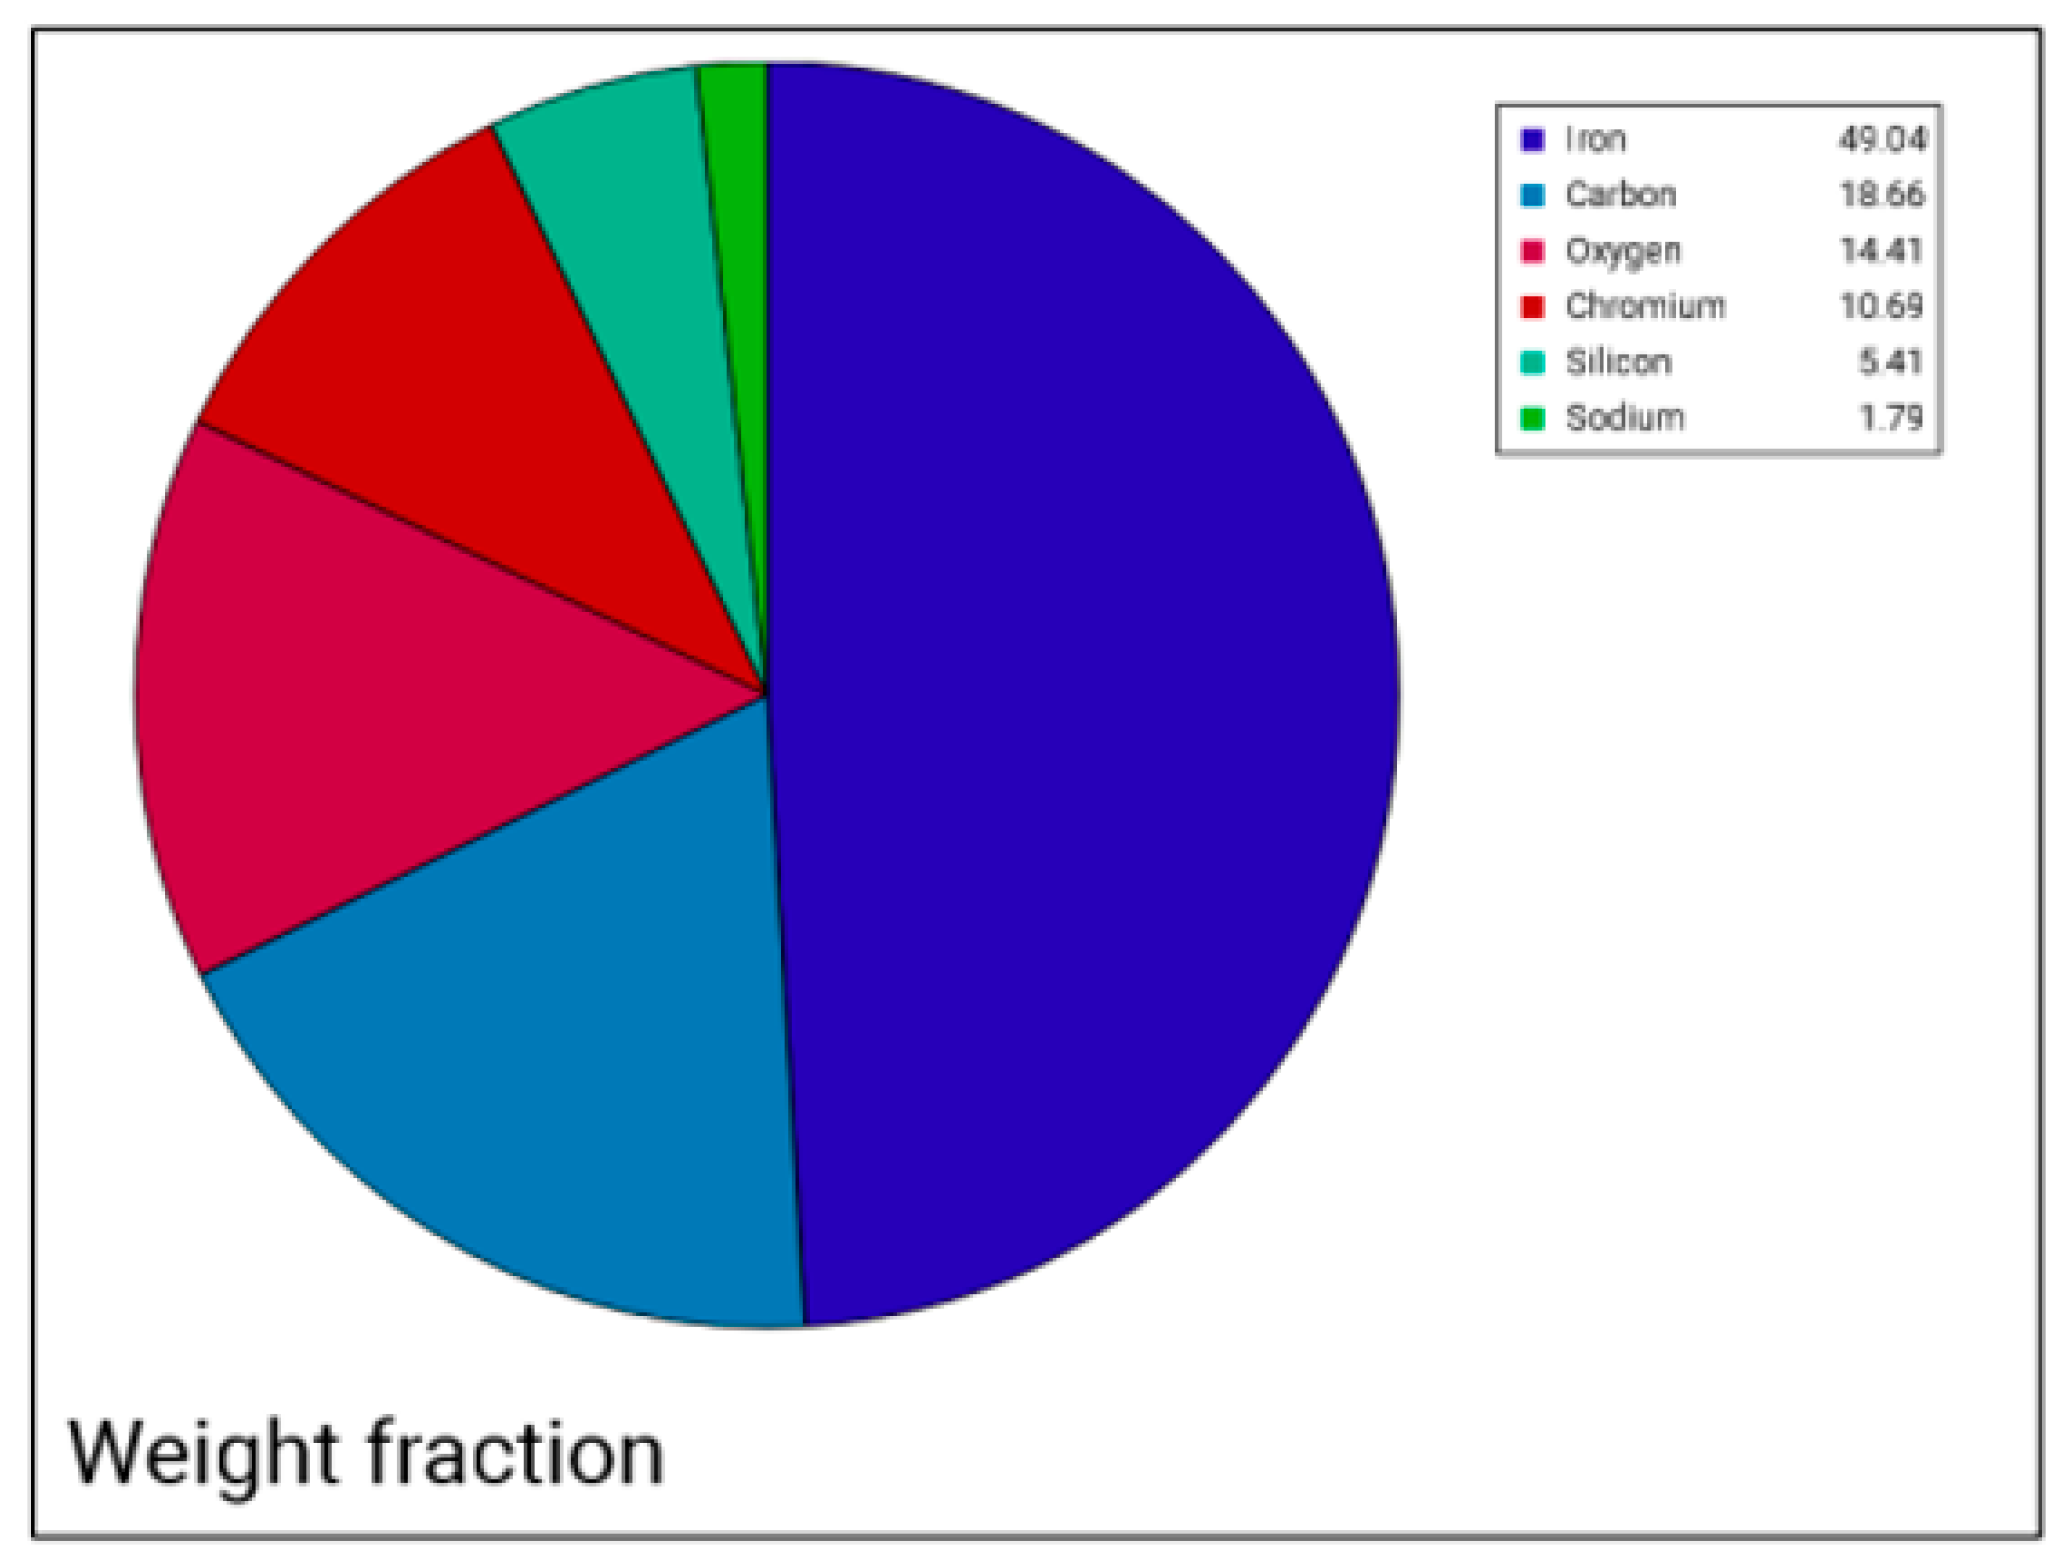
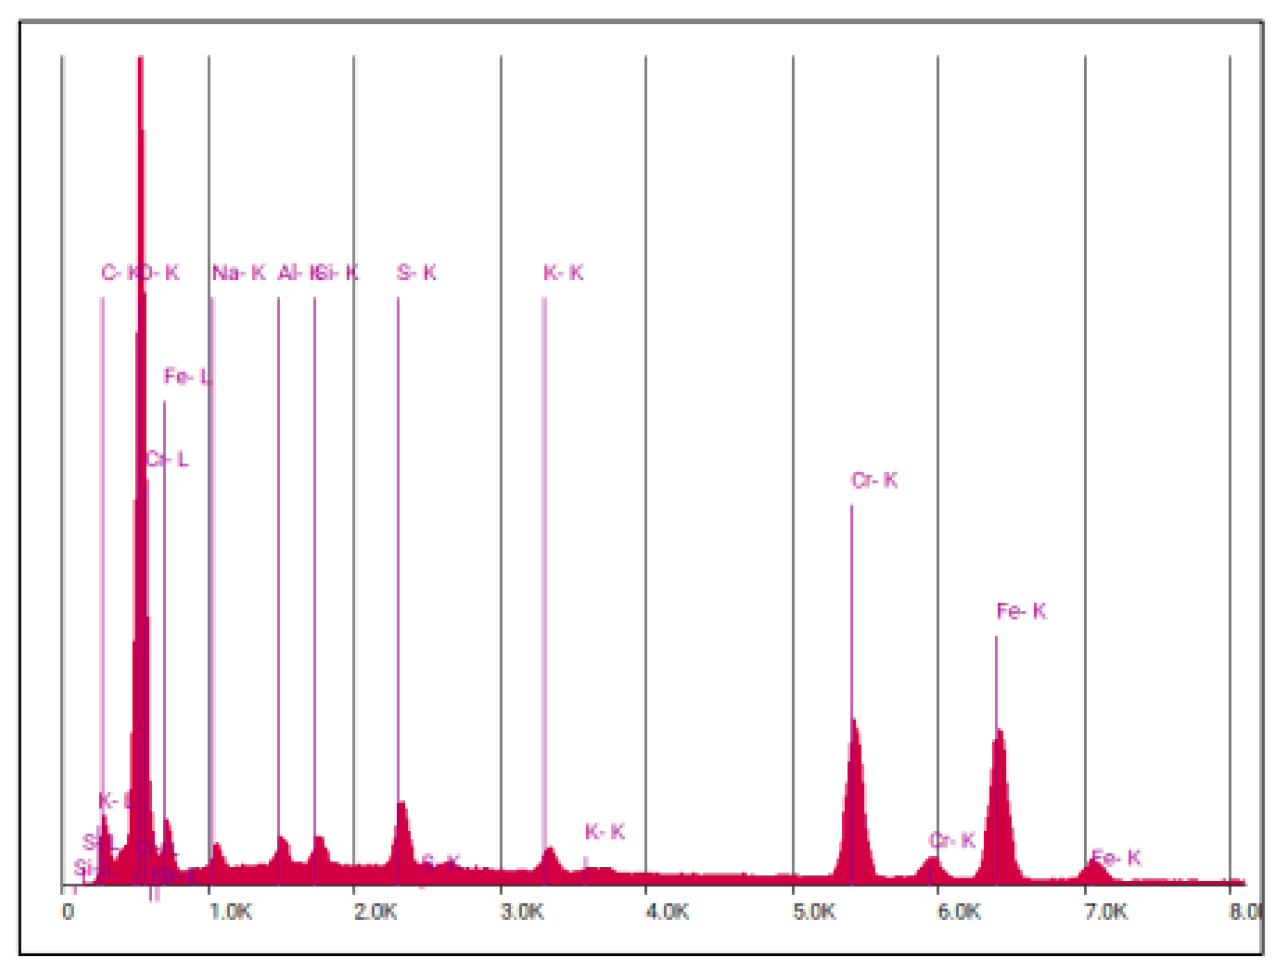
Electron microscopy confirmed the information obtained through optical metallography, namely the uniform distribution of carbides in the base mass with a crystalline appearance. The elemental composition consisted of Fe, C, Cr, and O in varying percentages. Their concentrations also varied depending on the treatment applied and on the presence of rust-affected areas. In the analysed samples, the presence of other elements in low concentrations was also observed. As shown by the point analysis, these elements occurred due to the presence of impurities on the surfaces of the samples. They may result from accidental contamination during sample handling or from the presence of small amounts of these elements in the solutions used to treat the samples.
Vickers hardness determination.
During the hardness analysis, a relatively large difference was observed between the unquenched and quenched samples, both at the surfaces and in the cores of the rods and heads, as shown in
Table 2.
The quenching heat treatment played an important role in increasing hardness, as it involves austenitising, followed by sufficiently fast cooling to allow transformation into martensite, a microstructure with high hardness and brittleness. The rust spots and the sterilisation process did not produce any noticeable changes in the hardness of the material.
Microscopic analyses were performed after washing the samples in solution A. Please note that the washing solution was not stirred and was maintained at ambient temperature.
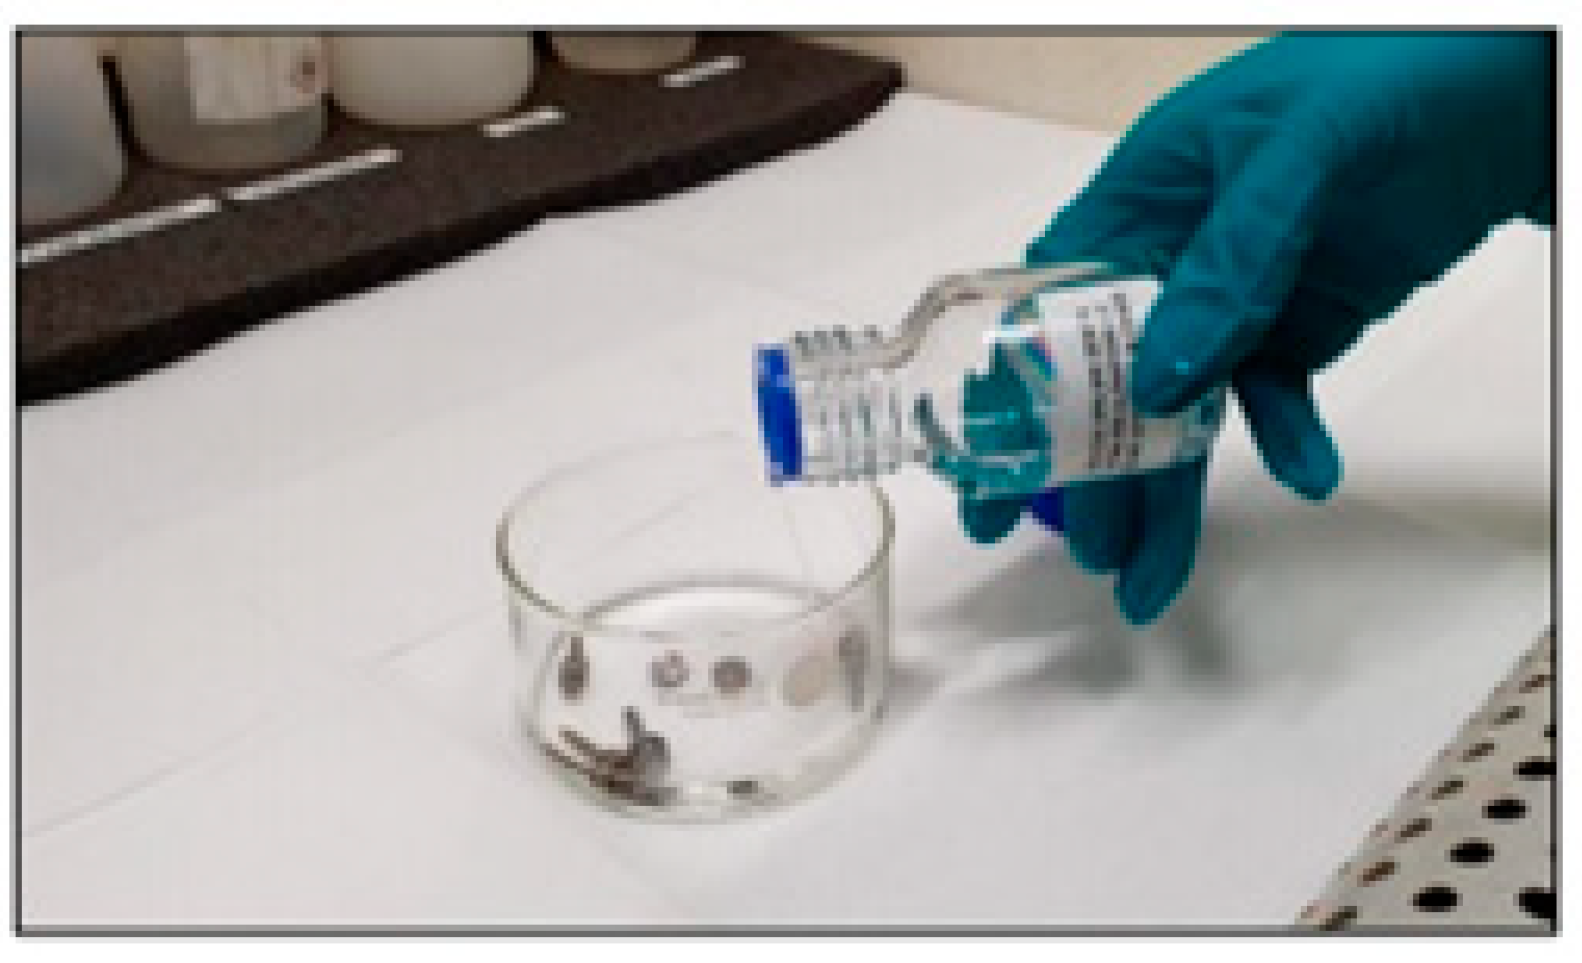
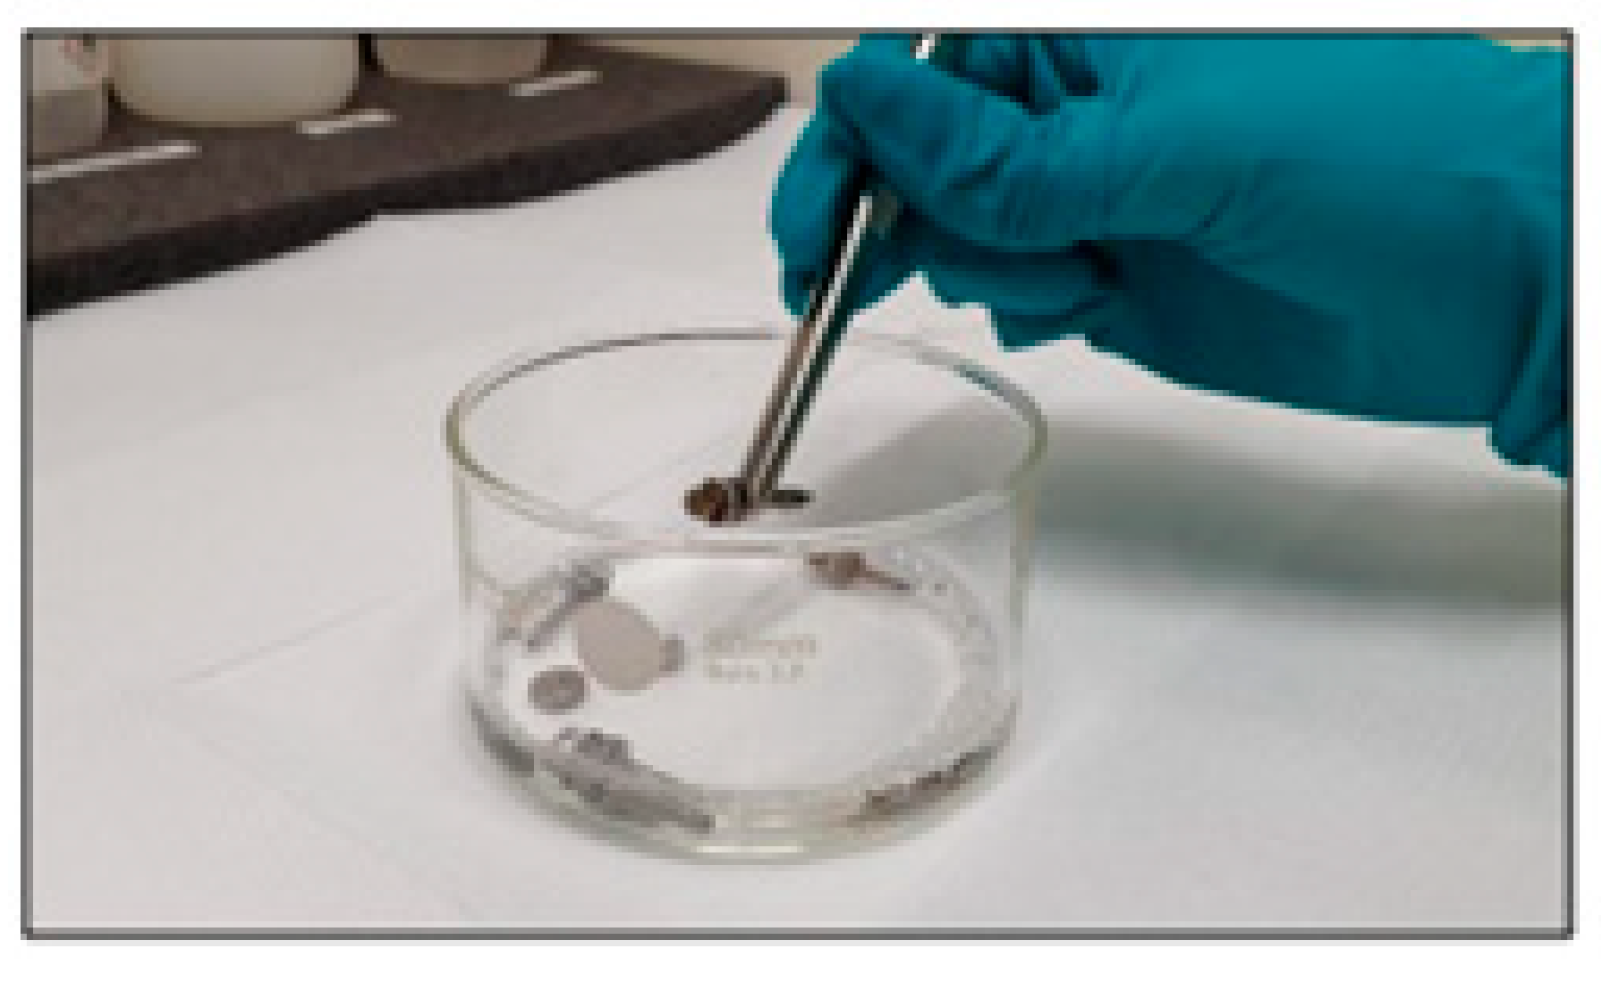
Previous SEM EDX analyses showed that the occurrence of this defect was not due to the material. Therefore, in order to identify the cause of the defect (the occurrence of rust spots on the material), the method used to wash and dry the parts was also analysed. Two samples of each part were selected for analysis. They were placed in a glass container (
Figure 38) containing solution A (
Figure 39), consisting of 40 mL of ultrapure water and 0.25 mL of Liquinox detergent (manufacturer: Alconox, New York, NY, USA; an anionic detergent).
The samples were left in the solution (without stirring it) for 90 s. One sample of each part was dried using a compressed air gun, and the others were left to dry on their own.
- 1.
Quenched and unsterilised samples.
Figure 42.
Sample dried over time.
Figure 42.
Sample dried over time.
Figure 43.
Sample dried using compressed air.
Figure 43.
Sample dried using compressed air.
- 2.
Quenched and sterilised samples.
Figure 44.
Sample dried over time.
Figure 44.
Sample dried over time.
Figure 45.
Sample dried using compressed air.
Figure 45.
Sample dried using compressed air.
- 3.
Unquenched samples.
Figure 46.
Sample dried over time.
Figure 46.
Sample dried over time.
Figure 47.
Sample dried using compressed air.
Figure 47.
Sample dried using compressed air.
- 4.
Unquenched samples cleaned in isopropyl alcohol.
Figure 48.
Sample dried over time.
Figure 48.
Sample dried over time.
Figure 49.
Sample dried using compressed air.
Figure 49.
Sample dried using compressed air.
“Stacked samples dried over time” method.
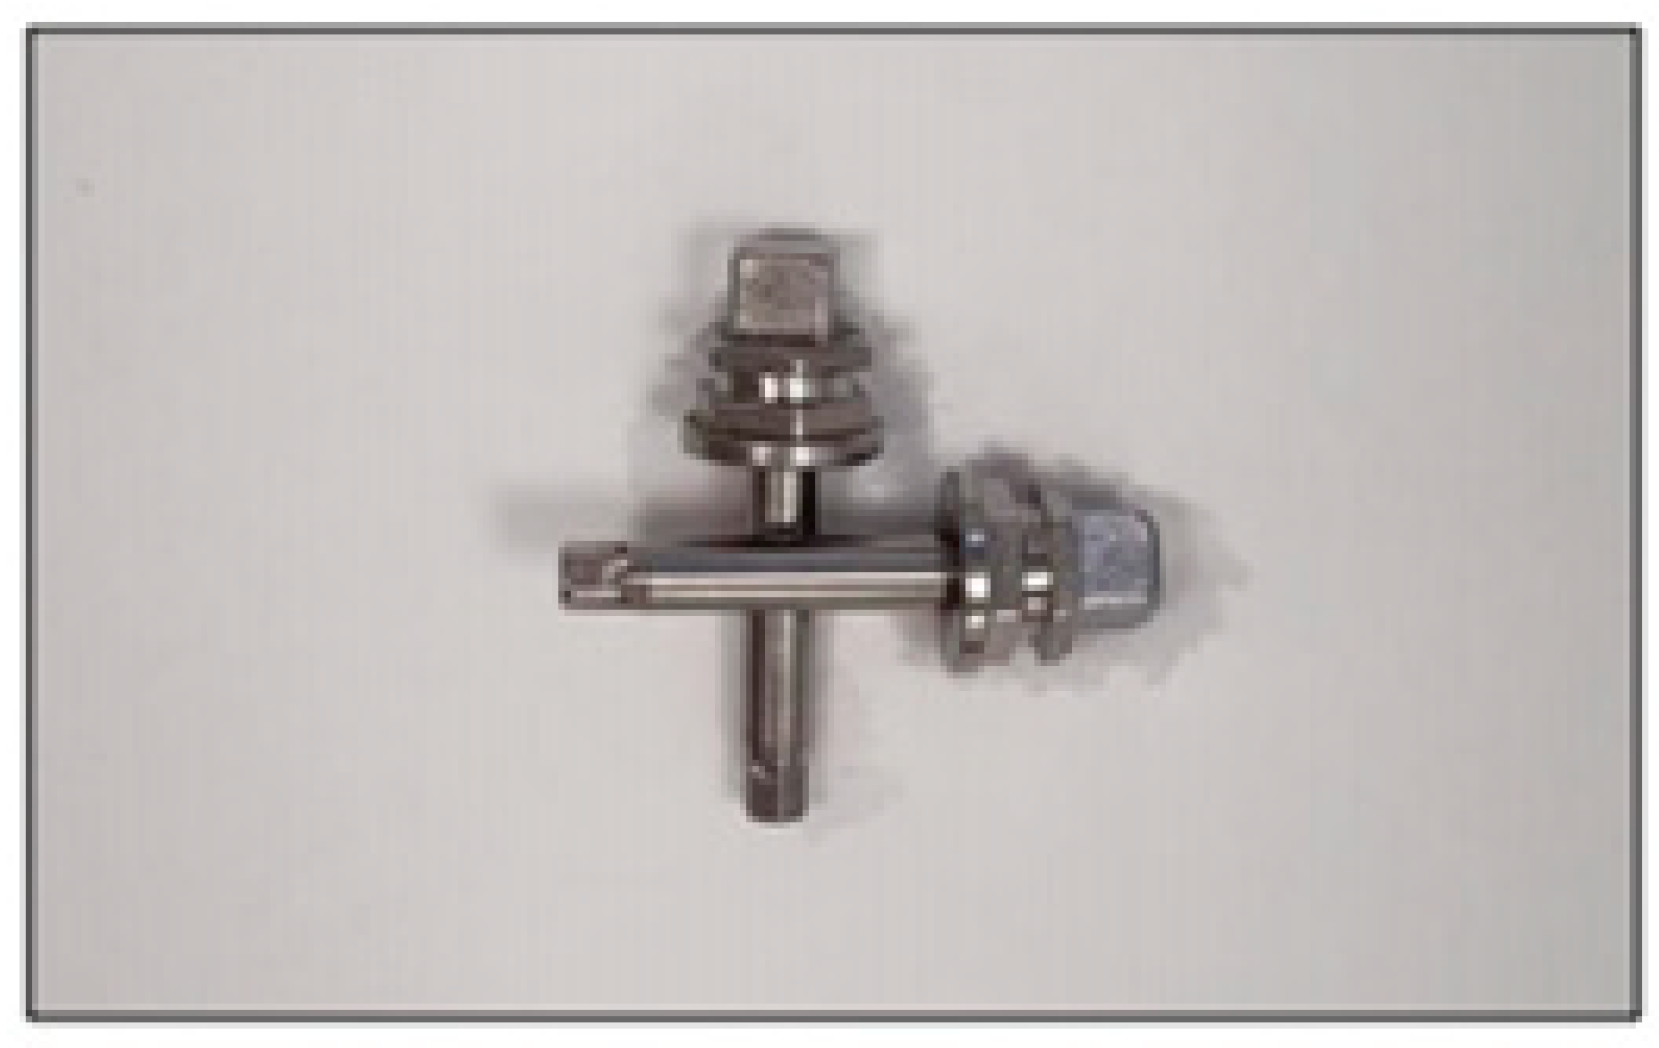
For this analysis, two samples from each of the two groups were chosen: unquenched samples and quenched and sterilised samples. They were placed in a glass container containing solution A for 90 s. After this time, the samples were removed from the glass container, placed one on top of the other, and left in this position for 24 h (
Figure 50 and
Figure 51).
After completing the steps described above, the samples were analysed under a microscope. During the analysis, traces of rust were observed on both the unquenched and the quenched and sterilised samples. The results obtained for the stacked samples dried over time are presented in
Figure 52,
Figure 53,
Figure 54,
Figure 55,
Figure 56,
Figure 57,
Figure 58,
Figure 59,
Figure 60,
Figure 61,
Figure 62 and
Figure 63.
- 1.
Unquenched samples.
Figure 52.
Sample 1, affected zone.
Figure 52.
Sample 1, affected zone.
Figure 53.
Sample 2, affected zone.
Figure 53.
Sample 2, affected zone.
- 2.
Quenched and sterilised samples.
Figure 54.
Sample 1, affected zone.
Figure 54.
Sample 1, affected zone.
Figure 55.
Sample 2, affected zone.
Figure 55.
Sample 2, affected zone.
- 3.
Unquenched sample (Point 1).
Figure 56.
SEM image of AISI 420 in the original condition, Point 1.
Figure 56.
SEM image of AISI 420 in the original condition, Point 1.
Figure 57.
EDS spectrum of AISI 420 in the original condition, Point 1 (area circled in
Figure 51).
Figure 57.
EDS spectrum of AISI 420 in the original condition, Point 1 (area circled in
Figure 51).
- 4.
Unquenched sample (Point 2).
Figure 58.
SEM image of AISI 420 in the original condition, Point 2.
Figure 58.
SEM image of AISI 420 in the original condition, Point 2.
Figure 59.
EDS spectrum of steel in the original condition, Point 2 (area circled in
Figure 53).
Figure 59.
EDS spectrum of steel in the original condition, Point 2 (area circled in
Figure 53).
- 5.
Quenched, tempered, and sterilised sample (Point 1).
Figure 60.
SEM image of quenched, tempered, and sterilised sample, Point 1.
Figure 60.
SEM image of quenched, tempered, and sterilised sample, Point 1.
Figure 61.
EDS spectrum of quenched, tempered, and sterilised sample, Point 1 (area circled in
Figure 55).
Figure 61.
EDS spectrum of quenched, tempered, and sterilised sample, Point 1 (area circled in
Figure 55).
- 6.
Quenched, tempered, and sterilised sample (Point 2).
Figure 62.
SEM image of quenched, tempered, and sterilised sample, Point 2.
Figure 62.
SEM image of quenched, tempered, and sterilised sample, Point 2.
Figure 63.
EDS spectrum of quenched, tempered, and sterilised sample, Point 2 (area circled in
Figure 57).
Figure 63.
EDS spectrum of quenched, tempered, and sterilised sample, Point 2 (area circled in
Figure 57).
Similar to the previous SEM + EDS analyses, in this case, the elemental composition consisted of Fe, C, Cr, and O in varying percentages, as well as other elements in low concentrations, which occurred due to the presence of impurities on the surfaces of the samples.
4. Discussion
In the original condition, the structure of the material was made up of ferrite and carbides. Heating to 1040 °C led to almost complete dissolution of carbides (
Figure 7,
Figure 8,
Figure 9,
Figure 10,
Figure 11,
Figure 12,
Figure 13,
Figure 14,
Figure 15,
Figure 16,
Figure 17,
Figure 18,
Figure 19,
Figure 20,
Figure 21,
Figure 22 and
Figure 23). After tempering at 200 °C, the microstructure was similar to that after quenching but exhibited a tendency for the occurrence of fine precipitates arranged in rows. The microstructure in all analysed zones was composed of tempered martensite, uniformly distributed fine globulised carbides, and some coarser carbides. Steels with 12%…13% Cr feature high resistance to tempering and do not soften at tempering temperatures of about 475 °C, at which temper brittleness occurs. This is the reason for choosing the 200 °C tempering temperature.
After rinsing the samples in solution A, one sample of each part was dried using a compressed air gun, and the remaining samples were left to dry over time, placed at a distance from each other, without any contact between them, and no changes occurred on their surfaces. Therefore, the second method (stacked samples dried over time) was used, following which changes were observed on the surfaces of the samples.
Rust spots may develop when two freshly washed, wet parts remain stacked, a phenomenon scientifically known as crevice corrosion. When parts are closely stacked, moisture becomes trapped in the contact zone and cannot easily evaporate. Over time, the oxygen within this confined space is consumed, which prevents the protective chromium oxide layer of the steel from regenerating. This leads to the formation of a highly acidic microclimate that promotes localised etching and subsequent rust formation. This corrosive process is further accelerated by several aggravating factors, including the use of chlorinated or salt water, elevated temperatures that speed up chemical reactions, and extended contact time between the parts. Additionally, any remaining residues from washing chemicals can trigger direct, localised chemical corrosion.
Inadequate rinsing after washing can leave behind traces of detergents or other chemicals, such as salts and weak acids, which locally etch the stainless steel surface and lead to rust spots. This chemical attack is significantly aggravated by the use of chlorine-based detergents and by slow drying conditions, which concentrate the corrosive residues. Additionally, contact corrosion can occur if the parts were previously machined with carbon steel tools or exposed to iron particles that remain on the surface. In the presence of moisture, these ferrous particles oxidise and generate reddish spots. This type of contamination is further worsened by grinding or cutting with improper tools, washing the parts in water contaminated with metal powders, or storing them near ferrous materials.
Based on the investigations carried out, several key measures are recommended to prevent the formation of corrosion on the studied parts. First, parts must be separated immediately after washing to eliminate water stagnation, followed by a quick drying process utilising compressed air or moderate heat. To eliminate any remaining chemical residues, components should be thoroughly rinsed with demineralised water, ensuring the rapid removal of moisture from all closed zones and confined spaces. Finally, periodic passivation using specialised solutions, such as a 10% nitric acid solution as chemical treatment, should be implemented to effectively restore the protective chromium oxide layer on the steel surface.
Although the isolated effect of steam autoclave sterilisation was not experimentally evaluated in this study, it is recognised that such clinical protocols would act as a significant accelerator for the propagation of pitting corrosion initiated by the manufacturing residues identified here. Future studies are warranted to quantify the cumulative effect of repeated autoclave cycles on these specific surface defects.