Article

Influence of Groove Structures on Flow Field and Bacterial Adhesion: A CFD-DEM Coupling Study

1
State Key Laboratory of Fluid Power and Mechatronic Systems, Zhejiang University, Hangzhou 310027, China
2
Engineering Research Center of DLIS, Ministry of Education, Hangzhou 310058, China
*
Author to whom correspondence should be addressed.
Coatings 2026, 16(3), 321; https://doi.org/10.3390/coatings16030321
Submission received: 23 January 2026 / Revised: 2 March 2026 / Accepted: 4 March 2026 / Published: 6 March 2026
(This article belongs to the Section Environmental Aspects in Colloid and Interface Science)

Highlights

What are the main findings?
  • A CFD-DEM coupling model integrated with XDLVO theory is established to simulate bacterial adhesion in grooved flow channels.
  • Triangular grooves exhibit superior flow stability and the lowest bacterial adhesion compared to quadrilateral and semicircular ones.
  • Bacterial retention decreases with increasing inlet velocity (1–3 m/s) due to enhanced hydrodynamic shear.
What are the implications of the main findings?
  • Offers a reliable numerical method for investigating the coupling mechanisms of surface topography, hydrodynamics, and bacterial adhesion.
  • Provides theoretical support for anti-contamination design of ultra-clean flow control components in IC manufacturing.
  • Guides the optimization of groove geometries to minimize bacterial colonization in fluid transport systems.

Abstract

Stringent cleanliness standards govern process fluid transport in integrated circuit (IC) manufacturing. Cavitation-induced surface defects on flow control components promote bacterial adhesion, thereby compromising wafer fabrication. To elucidate the coupling mechanisms among surface topography, hydrodynamics, and bacterial retention, this study utilizes a one-way coupled Computational Fluid Dynamics and Discrete Element Method (CFD-DEM) approach integrated with extended Derjaguin–Landau–Verwey–Overbeek (XDLVO) theory. We constructed a numerical model of rod-shaped Pseudomonas aeruginosa, integrated with a customized API-based coupling scheme to resolve temporal scale disparities, and systematically simulated flow evolution and adhesion behaviors across varying groove geometries (quadrilateral, triangular, and semicircular) and inlet velocities (1–3 m/s). The results indicate that groove-induced flow separation and recirculation vortices drive bacterial accumulation at the trailing edge. Triangular profiles exhibited superior flow stability, yielding significantly lower adhesion than quadrilateral and semicircular shapes. Bacterial retention scaled inversely with flow velocity due to enhanced hydrodynamic shear. These findings provide theoretical and engineering insights for the anti-contamination design of ultra-clean flow control components in IC manufacturing.

1. Introduction

In IC manufacturing, the cleanliness of process fluids is critical to production quality and yield. Excessive bacterial levels induce particulate contamination and total organic carbon (TOC) exceedance, leading to severe defects such as exposure errors and breakdown degradation [1]. Consequently, bacterial content in semiconductor wet processes must be strictly maintained at ≤1 CFU/L [2]. Although high-precision filtration and ultraviolet sterilization are widely employed, certain bacteria can still adapt to these extreme oligotrophic environments [3], proliferating within pipeline dead zones and on membrane surfaces [4]. Studies indicate that the initial reversible adhesion stage, marking the transition from single cells to microcolonies, presents a critical window for contamination control. Interventions such as flow field optimization or surface modification during this phase can significantly reduce subsequent contamination risks [5].
The influence of surface microstructure on bacterial adhesion is highly significant. In practice, the long-term operation of polytetrafluorethylene (PTFE) bellows pumps used for transferring ultrapure fluid media in semiconductor wet processes often induces cavitation-related surface defects on check valve cores. Su et al. [6] revealed that the cavitation-induced defects on the PTFE surface initially appear as microcracks; these cracks gradually propagate and deepen, eventually leading to material erosion and the formation of cavitation pits. These microstructures create localized regions characterized by low velocity and low shear stress. Such regions shield bacteria from hydrodynamic scouring, thereby creating favorable conditions for bacterial adhesion and colonization.
Zhang et al. [7] significantly reduced bacterial adhesion and effectively inhibited growth and proliferation by depositing a titanium dioxide-polytetrafluorethylene ( TiO 2 -PTFE) nanocomposite coating on a 316 L stainless steel substrate. Currently, ultrapure water systems mitigate contamination by optimizing pipeline flow channel designs to eliminate dead zones and increase local flow velocities, supplemented by regular flushing to inhibit bacterial proliferation. However, existing flow control component designs primarily prioritize material cleanliness and sealing integrity, often overlooking the systematic coupling between flow field characteristics and bacterial adhesion mechanisms. Hu et al. [8] utilized Multi-Particle Collision Dynamics (MPC) to simulate the motion of flagellated bacteria near a two-phase interface in microfluidic environments. Warning et al. [9] developed a model using the Particle Tracking Module of COMSOL Multiphysics R 5.0 (Burlington, MA, USA) to investigate the translation, rotation, and adhesion behaviors of bacteria in a slow laminar flow environment, clarifying the influence of diverse leaf surface structures on adhesion probability. Despite these advances, the impact of flow velocity and surface microstructures on bacterial trajectories and adhesion behavior under varying flow conditions remains underexplored.
In this study, a numerical simulation framework coupling computational fluid dynamics (CFD) with the discrete element method (DEM) was developed to simulate bacterial motion and adhesion of Pseudomonas aeruginosa, on PTFE surfaces under laminar flow conditions. The extended Derjaguin–Landau–Verwey–Overbeek (XDLVO) parameters adopted are specific to this bacteria-substrate system, and all relevant parameters must be re-calibrated when extending this model to other bacterial species or substrate materials. The effects of groove geometry and flow velocity on bacterial adhesion were systematically investigated, revealing the synergistic mechanisms between fluid dynamics and surface defects. These findings provide theoretical support for the anti-contamination design of ultra-clean flow control components.
In terms of geometric modeling, a channel height of 40 μ m and a groove depth of 10 μ m are prescribed. This specific 1:4 depth-to-height ratio is intended to trigger significant localized streamline curvature and flow separation, thereby facilitating a high-fidelity analysis of the influence of groove-induced flow separation and recirculation on bacterial migration and adhesion kinetics. The significance of this physical model is two-fold: on one hand, it facilitates the direct simulation of micro-cracks in pump and valve components arising from chronic mechanical vibration and alternating pressure loads. On the other hand, as bacterial colonization in macro-scale pipelines occurs predominantly within the viscous sublayer, which is characterized by a thickness of several tens of micrometers, the 40 μ m height provides a micro-scale representation of the near-wall hydrodynamic environment in industrial-scale transport systems.

2. Model Formulation

2.1. Continuum Phase

In this study, the channel dimensions ( 30 × 40 μ m cross-section) and inlet velocities (1–3 m/s) yield a Reynolds number ( R e ) for the water flow in the range of 38.5 to 115.4. The Reynolds number is calculated as R e = ρ v D h / μ , where D h is the hydraulic diameter, ρ is the fluid density, v is the inlet velocity, and μ is the dynamic viscosity. Since R e 2300 , the flow is strictly within the laminar regime. Therefore, the fluid phase is governed by the laminar continuity and Navier–Stokes equations:
· u f = 0
ρ f u f t + u f · u f = p + μ 2 u f + F p f
where u f is the fluid velocity, p is the pressure, ρ f is the fluid density, μ is the dynamic viscosity, and F p f is the momentum exchange term from the dispersed phase to the fluid phase.

2.2. Discrete Phase Model

2.2.1. Particle Control Equation

The DEM model applies Newton’s second law to describe particle motion [10]. Each particle is treated as a discrete unit, and its motion is described by translational and rotational equations. The translational equation for rod-shaped particles is similar to that for spherical particles:
m p d u p d t = F c + F g + F d r a g + F l i f t + F p g + F XDLVO + F Brownian + F propulsion
where m p is the mass of the particle (kg); u p is the velocity of the particle (m/s); F c is the contact force (N); F g is the gravitational force (N); F d r a g is the drag force (N); F l i f t is the lift force (N); F p g is the pressure gradient force (N); F XDLVO is the extended Derjaguin–Landau–Verwey–Overbeek (XDLVO) force (N); F Brownian is the Brownian force (N); and F propulsion is the flagellar propulsive force (N).
For the rotational motion of rod-shaped particles, the following equation is used to account for orientation-dependent characteristics:
I p , L d ω L d t + ω L × I p , L · ω L = T L
where g is the gravitational acceleration; I p , L is the moment of inertia of the particle in the local coordinate system ( kg · m 2 ); ω L is the angular velocity of the particle in the local coordinate system (rad/s); T L is the contact torque caused by the tangential contact force in the local coordinate system ( N · m ) [11].

2.2.2. Fluid Interaction Model

In two-phase liquid-solid systems, the forces between particles and the fluid include drag, lift, and pressure gradient forces [12]. The drag force on particles can be computed using the following equation:
F d r a g = 0.5 C D ρ f S e f f u f u p ( u f u p )
ψ = S i S p
For non-spherical particles, the drag coefficient is computed using the method of Ganser [13], which is determined by the sphericity of the particles ψ , where S i is the surface area of an equivalent sphere having the same volume as the particle and S p is the actual surface area of the particle.
The lift force experienced by particles is calculated using the Saffman lift force equation:
F l i f t = 1.615 ρ f μ f / ρ f ( 2 r e q ) 2 G 0.5 ( u f u p ) sign d u f d y
where r e q is the equivalent radius of the particle (m); G is the fluid shear rate ( s 1 ); and V p is the volume of the particle ( m 3 ) [14].
The pressure gradient force acting on the particle is defined as:
F p g = V p ρ f D u f D t = V p p

2.2.3. Particle–Particle/Wall Interaction Forces

In this study, the multi-sphere method is employed to construct the rod-shaped bacterial particle model. The contact force and torque acting on each individual particle are the sums of the forces and torques applied to the spherical elements constituting the rod-shaped particle [15]. Particle–particle collisions are modeled using the Hertz–Mindlin contact model, where normal forces follow Hertzian contact theory, and tangential forces are described by the Mindlin–Deresiewicz theory. For particle-wall interactions, XDLVO theory is introduced to describe the adhesion process between bacterial particles and the substrate surface [16]. The total interaction energy between bacteria (B) and the substrate surface (S) in the liquid phase (L) is the sum of Lifshitz-Van der Waals (LW), electrostatic double layer (EL), and acid-base (AB) interaction energies:
U BLS XDLVO = U BLS L W + U BLS E L + U BLS A B
U BLS L W = A R 6 d
U BLS E L = π ε R 2 ψ B ψ S ln 1 + e κ d 1 e κ d + ( ψ B 2 + ψ S 2 ) ln ( 1 e 2 κ d )
U BLS A B = 2 π R λ Δ G d 0 A B exp d 0 d λ 1
A = 12 π d 0 2 Δ G d 0 L W
where R is the radius of the bacteria; d is the distance between the bacterial surface and the substrate surface; A is the Hamaker constant, which is specific to the material interaction; Δ G d 0 L W and Δ G d 0 A B are the interaction energies when the two surfaces are in contact at the minimum equilibrium cut-off distance d 0 = 0.158 nm ; ε is the permittivity of water; ψ B and ψ S are the zeta potentials of the bacterial and substrate surfaces, set to −0.012 V and −0.053 V respectively, based on experimental data [17]; k is the reciprocal of the Debye length ( 1 / k = 1.1 nm ) [18]; and λ is the characteristic decay length of AB interactions in water [19].
Δ G d 0 L W and Δ G d 0 A B can be calculated from a series of surface energy formulas:
Δ G d 0 L W = 2 γ s L W γ w L W γ b L W γ w L W
Δ G d 0 A B = 2 [ γ i + γ b + γ s γ i + γ i γ b + + γ s + γ i + γ b + γ s γ b γ s + ]
γ ( 1 + cos θ ) = 2 γ s L W γ l L W + γ s + γ l + γ s γ l +
γ = γ L W + γ A B
γ A B = 2 γ + γ
where γ is the total surface energy of the material; γ L W is the Lifshitz-Van der Waals (dispersive) component; γ A B is the acid-base (polar) component; γ + is the electron-acceptor parameter, and γ is the electron-donor parameter. θ is the measured contact angle. The subscript s denotes the solid (PTFE material), b denotes the bacteria, and l denotes the liquid (water).
The detailed surface energy components are listed in Table 1.
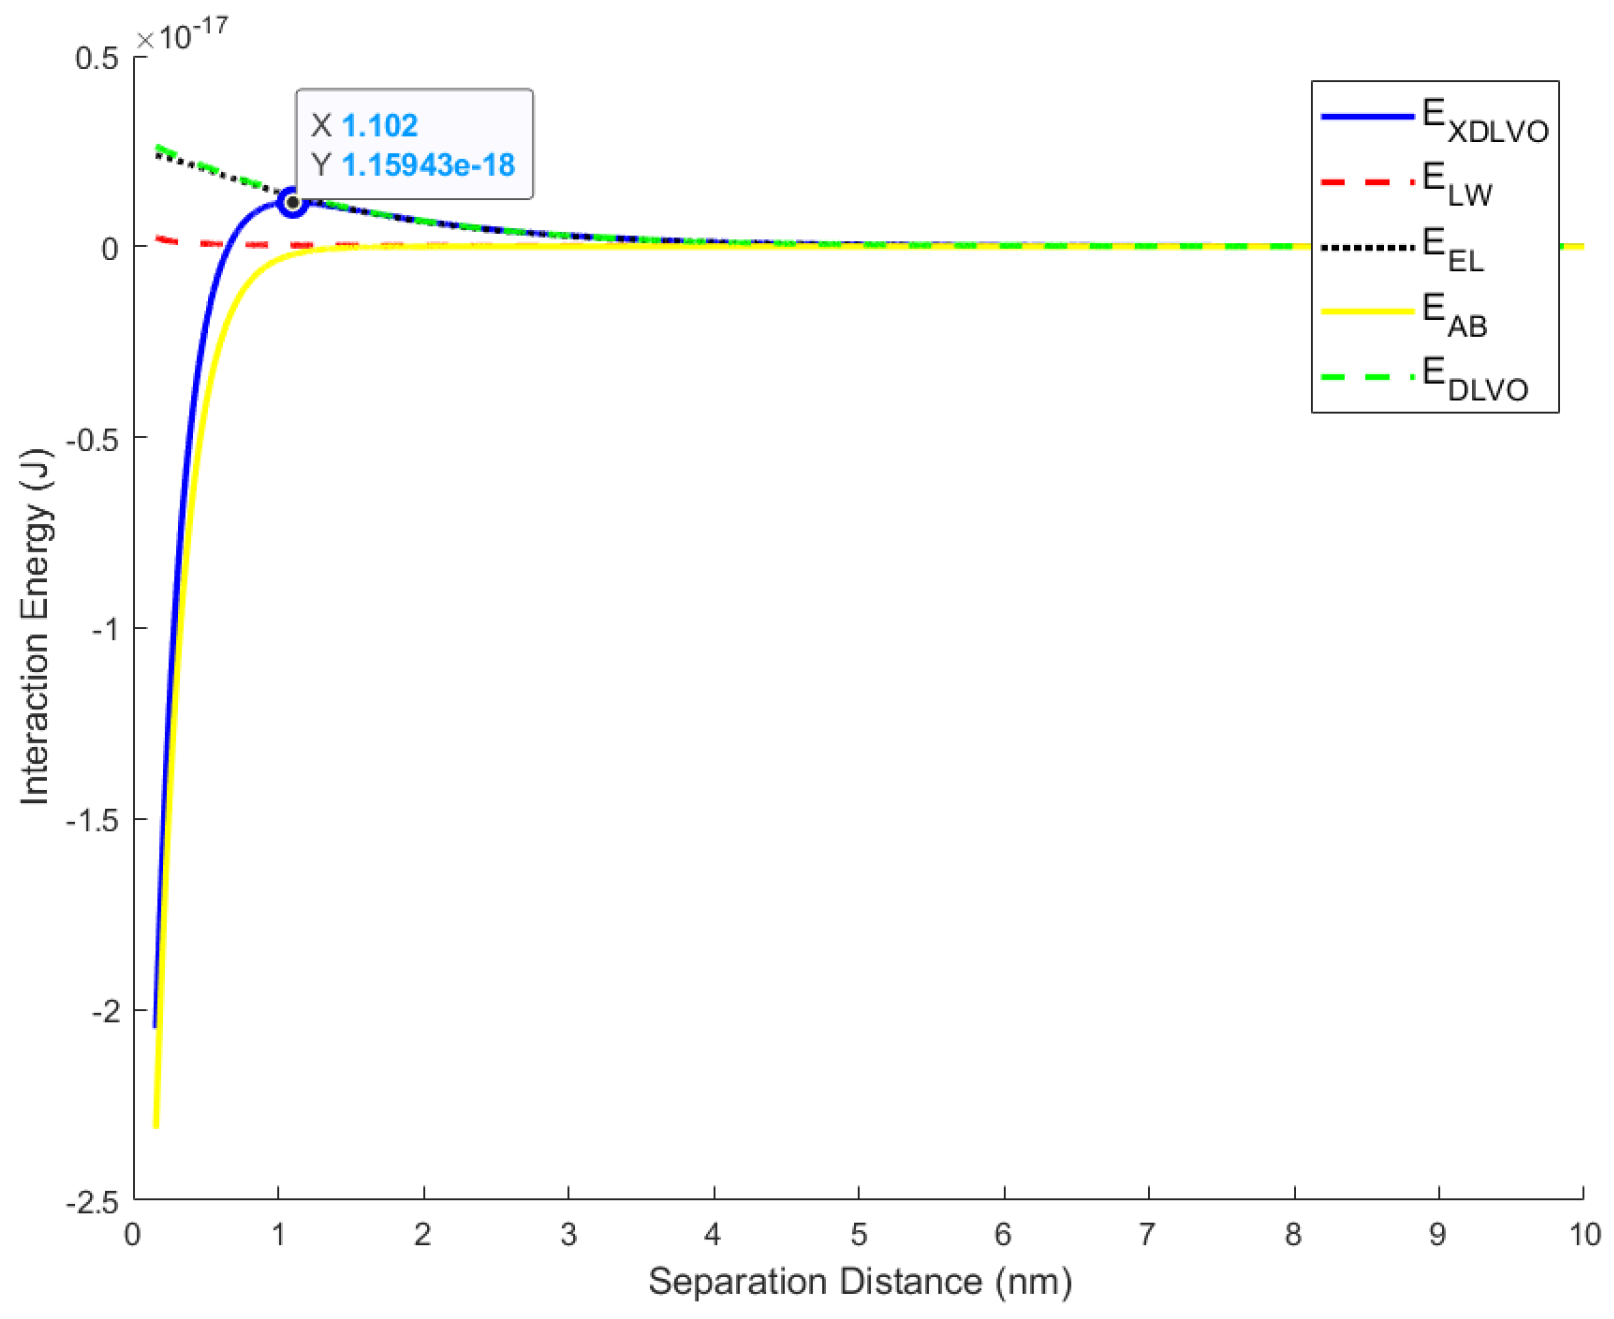
Based on the aforementioned XDLVO parameters, the total interaction potential energy ( V t o t a l ) between a P. aeruginosa cell and the PTFE surface is calculated. As shown in Figure 1, a distinct energy barrier exists at a separation distance of approximately 1.1 nm. This indicates that bacteria initially experience a repulsive force as they approach the PTFE surface before falling into the primary potential well for irreversible adhesion.
To account for potential uncertainties in physicochemical properties, a sensitivity analysis was performed by varying the Hamaker constant (A). Specifically, the potential energy curves were recalculated for 0.9 A , 1 A (baseline), and 1.1 A . The results show that for 0.9 A , the energy barrier is 1.15943 × 10 18 J with a primary minimum of 2.04969 × 10 17 J; for 1 A , the barrier is 1.16325 × 10 18 J and the minimum is 2.04702 × 10 17 J; and for 1.1 A , the barrier is 1.16708 × 10 18 J and the minimum is 2.04435 × 10 17 J. Although a 10% fluctuation in the Hamaker constant micro-adjusts the adhesion strength, the magnitude of the energy barrier remains stable without order-of-magnitude changes. This demonstrates that the spatial distribution trends of bacterial adhesion and the relative performance of different groove geometries are robust against parameter variations.
In this study, we adopt an idealized irreversible adhesion criterion: bacteria are deemed to have achieved irreversible adhesion once they cross the energy barrier and enter the primary potential well (the first deep energy minimum) of the XDLVO interaction. This criterion is a widely accepted simplification in numerical investigations of the initial bacterial adhesion stage. It should be clarified that this study focuses on the initial stage of bacterial adhesion, where XDLVO interaction forces and near-wall flow field characteristics are the dominant factors governing bacterial adhesion behavior; thus, the aforementioned simplification is physically justified. Nevertheless, this criterion remains an idealized assumption in real-world scenarios. For one thing, adherent bacteria may undergo detachment under extreme hydrodynamic shear. For another, bacteria can form stronger and more stable irreversible adhesion through pili/flagellar anchoring, as well as complex viscoelastic forces arising from the secretion and proliferation of extracellular polymeric substances (EPS). None of the above processes are included in the scope of this study.
The total interaction force is obtained by differentiating the interaction energy with respect to the separation distance:
F ( d ) = F ( d ) L W + F ( d ) E L + F ( d ) A B = 2 π d 0 2 Δ G d 0 L W R d 2 + π ε R κ 2 ψ B ψ S 2 e κ d e κ d + ( ψ B 2 + ψ S 2 ) 1 e κ d + e κ d e κ d e κ d 2 π R Δ G d 0 A B exp d 0 d λ 1

2.2.4. Brownian Force

Brownian force is a crucial component for submicron particles in turbulent fields. The Brownian force on particles is simulated using a Gaussian white noise model. The expression for the Brownian force is given by:
S n , i j = S 0 δ i j
S 0 = 216 ν k B T π 2 ρ f d p 3 S 2 C c
F Brownian = m p G r 1 π S 0 Δ t

2.2.5. Flagellar Propulsion Force

In this study, the flagellar propulsion force is simplified as a constant driving force aligned with the length axis of the bacterial particle. The force is modeled based on the experimental results of Chattopadhyay et al. [21]. The propulsive force of the flagella is set to F propulsion = 0.6 pN , with its direction consistent with the major axis vector of the particle. Although the propulsion force value ( 0.6 pN ) is originally derived from E. coli, applying it to P. aeruginosa in our model is physically reasonable. Both are Gram-negative, rod-shaped bacteria with similar geometric aspect ratios. Furthermore, their typical swimming speeds in water are on the same order of magnitude (20–30 μ m / s for E. coli and 25–50 μ m / s for P. aeruginosa). According to Stokes’ drag law, the thrust required to maintain this swimming speed for a micron-sized body is on the order of 0.1–1.0 pN. Thus, the adopted value of 0.6 pN provides a kinematically consistent representation of the active motility of P. aeruginosa without distorting the overall force balance.

2.3. Force Scale Analysis

To justify the physical assumptions of the CFD-DEM model, a quantitative force scale analysis was conducted based on the simulated hydrodynamic conditions (Table 2). In the near-wall region, the XDLVO attractive force (∼ 10 9 N) is the absolute dominant factor, being 1–2 orders of magnitude larger than the fluid drag force (∼ 10 11 10 10 N). This disparity ensures that once a bacterium enters the primary potential well, the hydrodynamic shear is insufficient to dislodge it, leading to irreversible adhesion.
While the propulsion force ( 6 × 10 13 N) and Saffman lift force (∼ 4.5 × 10 13 N) are relatively weak compared to the drag force in the mainstream flow, their influence becomes significant in the low-velocity stagnation zones and the center of recirculation vortices within the grooves. In these regions, the local fluid velocity approaches zero, allowing the active motility of the bacteria to dictate the collision probability with the surface. Conversely, the Brownian force is estimated to be less than 10 14 N. Given that the Péclet number ( P e ) in this system is on the order of 10 5 10 6 , stochastic thermal motion is effectively masked by convective transport and active swimming, justifying its exclusion from the governing equations.
Table 2 summarizes the typical magnitudes of the involved forces. In this system, the XDLVO attractive force (∼ 10 9 N) is the dominant factor at close range, providing the primary mechanism for irreversible adhesion. The fluid drag force ( 10 11 10 10 N) drives macroscopic bacterial transport. Although the bacterial propulsion force ( 6 × 10 13 N) and Saffman lift force (∼ 4.5 ×   10 13 N) are smaller than the drag force in the mainstream, they are critical in the low-velocity stagnation zones and near-wall regions, directly influencing local collision and contact probabilities. Conversely, the Brownian force is at least two orders of magnitude smaller than the propulsion force, confirming that thermal diffusion is negligible in this high-Péclet-number flow.

3. Simulation Modeling and Simulation Conditions

3.1. Simulation Modeling

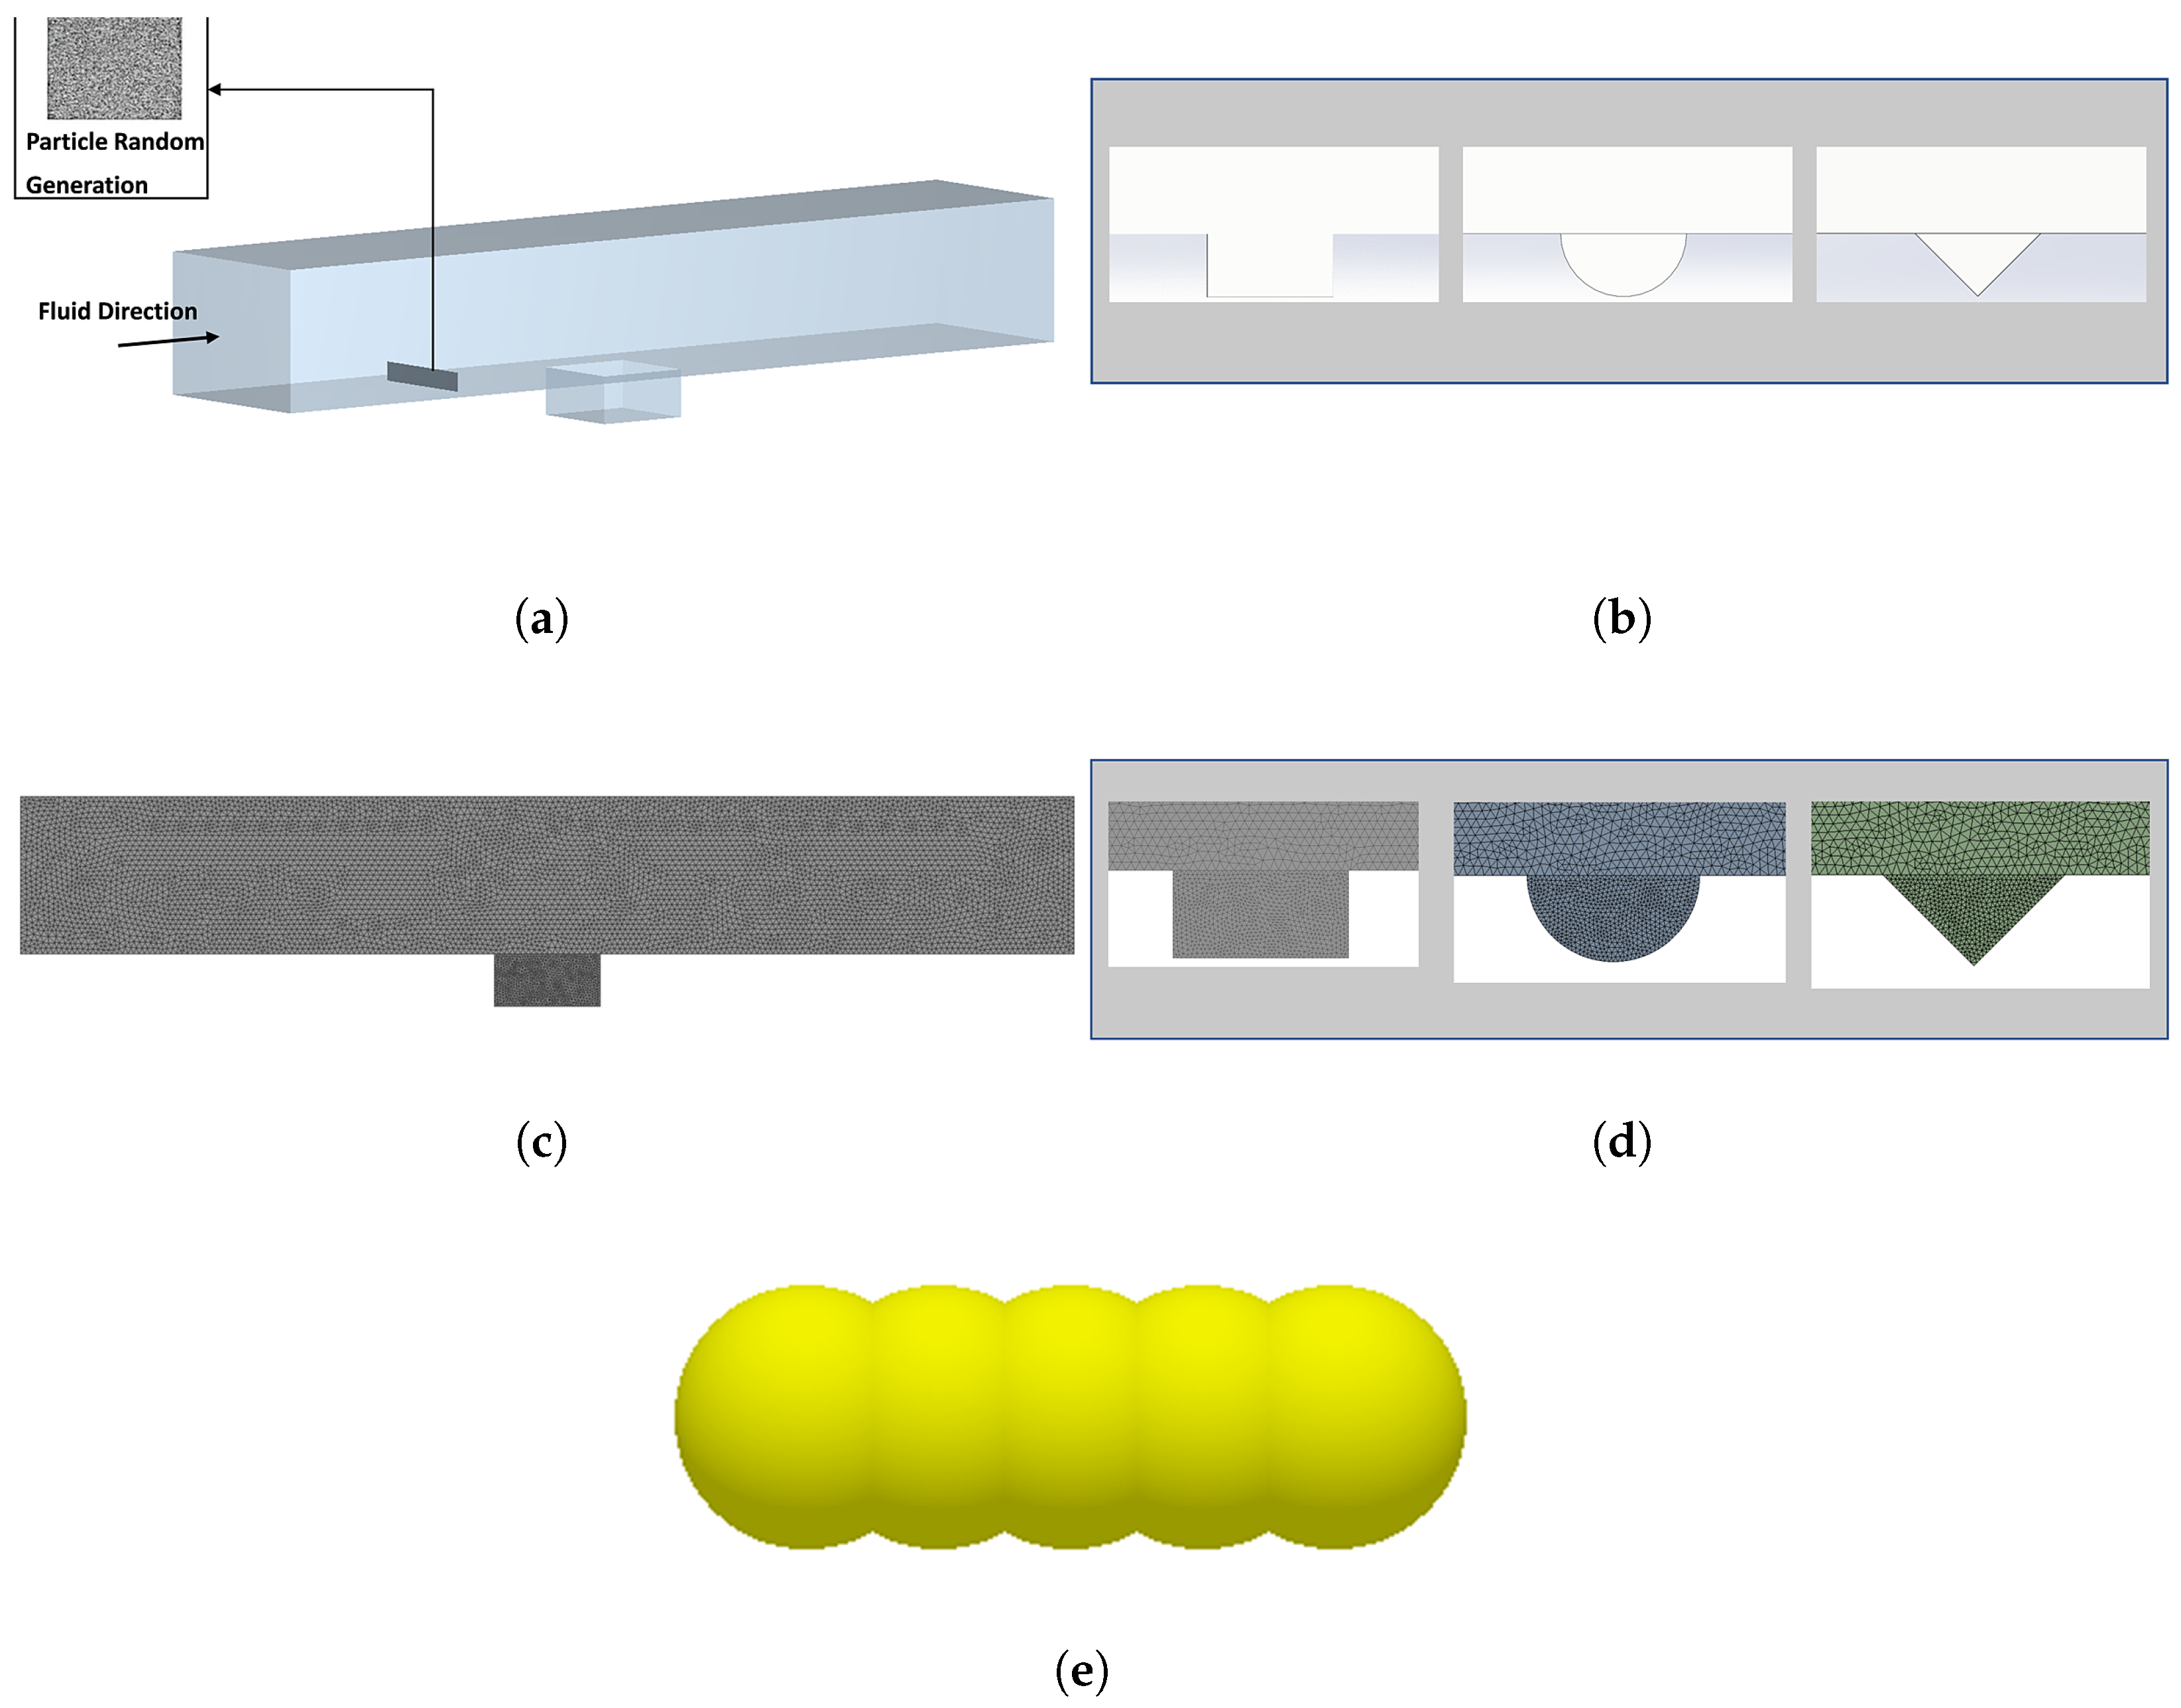
The initial manifestation of cavitation-induced surface damage on PTFE consists of progressively expanding cracks. Based on this, a flow channel featuring a microstructural surface was established. The primary flow channel utilizes a rectangular cross-section ( 30 × 40 μ m ) containing a concave groove (Figure 2a), with inlet and outlet sections of sufficient length to prevent outlet backflow. Additionally, multiple flow channel configurations were designed, each featuring a single central concave groove with idealized regular cross-sectional geometries (quadrilateral, triangular, and semicircular), as shown in Figure 2b. This idealized model is a simplified representation of irregular cracks and pits caused by real cavitation damage on PTFE surfaces; regular geometry is adopted to control single variables and reveal the fundamental mechanism of groove morphology on flow field and bacterial adhesion.
To ensure numerical accuracy and resolve the high-velocity gradients near the wall, a high-quality hexahedral mesh was generated for the computational domain (Figure 2c). Following grid independence verification, a global element size of 0.001 mm was adopted. Specifically, the mesh in the vicinity of the groove region was locally refined to 0.0005 mm with a growth rate of 1.2 (Figure 2d), ensuring that the complex flow separation and recirculation structures within the grooves were accurately captured.
The dispersed phase model focuses on Pseudomonas aeruginosa, a prevalent bacterium in ultrapure water systems. Bacteria are simplified as rod-shaped entities composed of a rigid assembly of spherical particles [22] (Figure 2e). The geometric parameters were set to 1.5 μm in length and 0.5 μm in width to match the actual dimensions of P. aeruginosa. While the mathematical framework exhibits general applicability, the selected parameters in this study are specifically tailored to model the adhesion behavior of P. aeruginosa on PTFE surfaces within ultrapure water systems.

3.2. Simulation Conditions

This study constructs a mathematical model under the Euler–Lagrange framework, coupling computational fluid dynamics (CFD) and the discrete element method (DEM) to simulate the transport and adhesion of bacterial particles. Fluid flow simulations were conducted using ANSYS Fluent 2021R2. Velocity inlet and pressure outlet boundary conditions were applied, with no-slip conditions enforced on all solid walls. A mesh independence study comparing three grid resolutions (143,494, 236,920, and 738,600 elements) revealed negligible differences in the outlet velocity (Table 3). To balance computational efficiency and accuracy, the 236,920-element model was selected for subsequent analyses.
Given that bacterial adhesion is highly sensitive to shear stress, a rigorous verification of the wall shear stress (WSS) was conducted. The WSS was computed using the direct velocity gradient method, which is physically justified under laminar flow conditions. Grid convergence verification was explicitly performed for both the peak and average WSS values, as summarized in Table 4.
The relative deviation between the medium and fine grids was merely 0.28 Consistent with the velocity validation, the medium grid was selected. Furthermore, within the fully developed smooth channel section, the simulated average WSS (≈211.7 Pa) shows excellent agreement with the analytical solution for laminar rectangular duct flow (≈211.1 Pa, see Appendix A). Localized peak WSS values exceeding 600 Pa are physically realistic, resulting from the intense velocity gradients induced by flow acceleration at the trailing edges of the grooves.

3.3. DEM Simulation Conditions

EDEM 2023 software was utilized to compute particle forces and motion. To ensure coupling accuracy, the EDEM geometric model was built upon the Fluent meshing file to maintain strict grid consistency. The simulated prototype is rod-shaped P. aeruginosa, with an injection velocity matching the fluid inlet flow. Given that both P. aeruginosa and Escherichia coli are Gram-negative bacteria exhibiting comparable mechanical properties, the mechanical parameters utilized in this study were approximated using established data for E. coli [23], as detailed in Table 5 and Table 6.
The Ganser drag force model, suitable for non-spherical particles, was selected. The standard Hertz–Mindlin (no-slip) model in EDEM was modified via an Application Programming Interface (API) to incorporate the XDLVO forces acting on the particles.

3.4. One-Way Coupling Setup

In this study, the simulated particles represent a typical low-concentration bacterial suspension. Bacteria were injected at a constant rate of 3000 particles per second. Based on the channel volume and average fluid velocity, the simulated particle volume fraction ( α p ) is approximately 7.36 × 10 5 , strictly within the dilute limit (< 10 4 ). Furthermore, because the density of P. aeruginosa ( ρ p 1080 kg · m 3 ) is comparable to that of the fluid, the momentum coupling ratio ( Φ = α p ρ p α f ρ f ) is also on the order of 10 5 . This quantitative assessment demonstrates that momentum feedback from the dispersed bacterial phase to the fluid phase is negligible. Consequently, the one-way coupling assumption is strongly supported, aligning with the findings of Jaiswal et al. [24] for low-concentration systems.
The native coupling interface provided by Fluent and EDEM is typically limited to scenarios where the time step ratio between the two solvers remains within 100. Because this study focuses on micrometer-scale bacterial particles, the DEM time step (≈ 10 9 s) is significantly smaller than the CFD time step (≈ 10 6 s). Under this native framework, newly generated particles in EDEM experience significant force transfer delays before Fluent initiates the subsequent time step, resulting in trajectory deviations. To resolve this, a customized one-way coupling scheme was developed. Fluid kinematic data from Fluent is exported into EDEM through an open API, allowing continuous calculation of particle volumetric forces (e.g., drag and lift) directly within the EDEM solver via customized code.

4. Results

4.1. Flow Field Analysis

4.1.1. Influence of Groove Structures

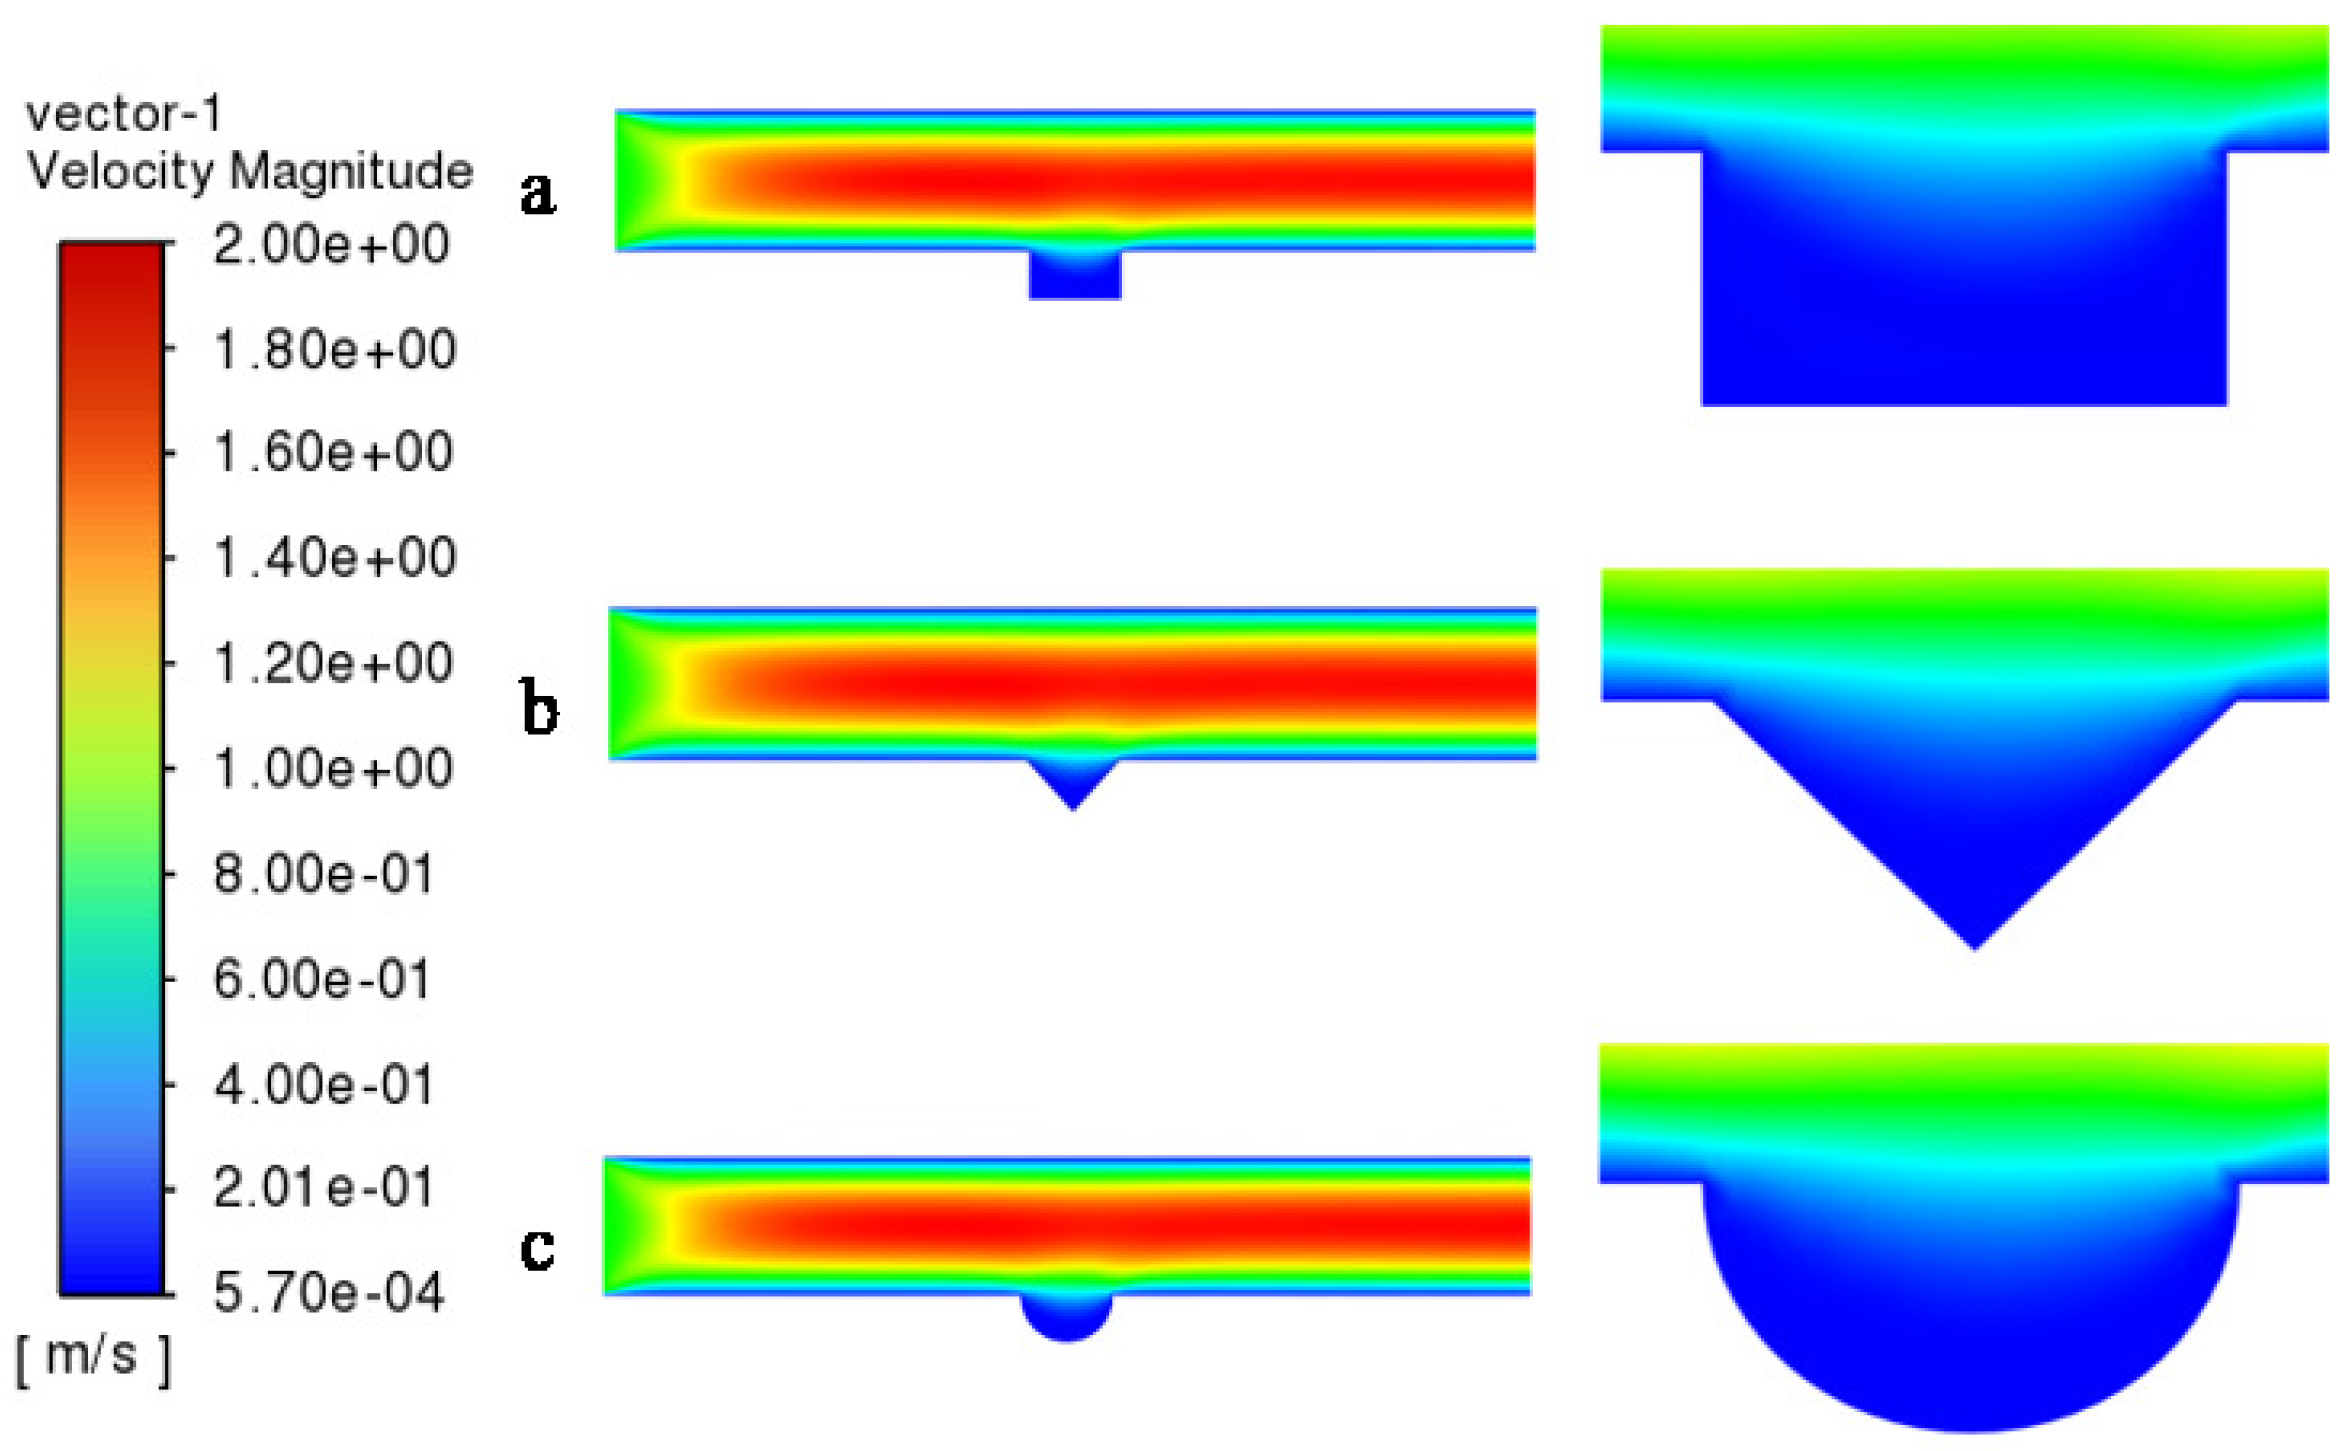
Figure 3 depicts the velocity contour distributions for grooves with distinct cross-sectional geometries on the XY plane (Z = 0) at an inlet velocity of 1 m/s. The three groove configurations exhibit analogous velocity distribution characteristics: flow velocity decays monotonically from the main channel center toward the wall. The initially flat velocity profile undergoes significant curvature within the groove region, generating a well-defined low-velocity recirculation zone.
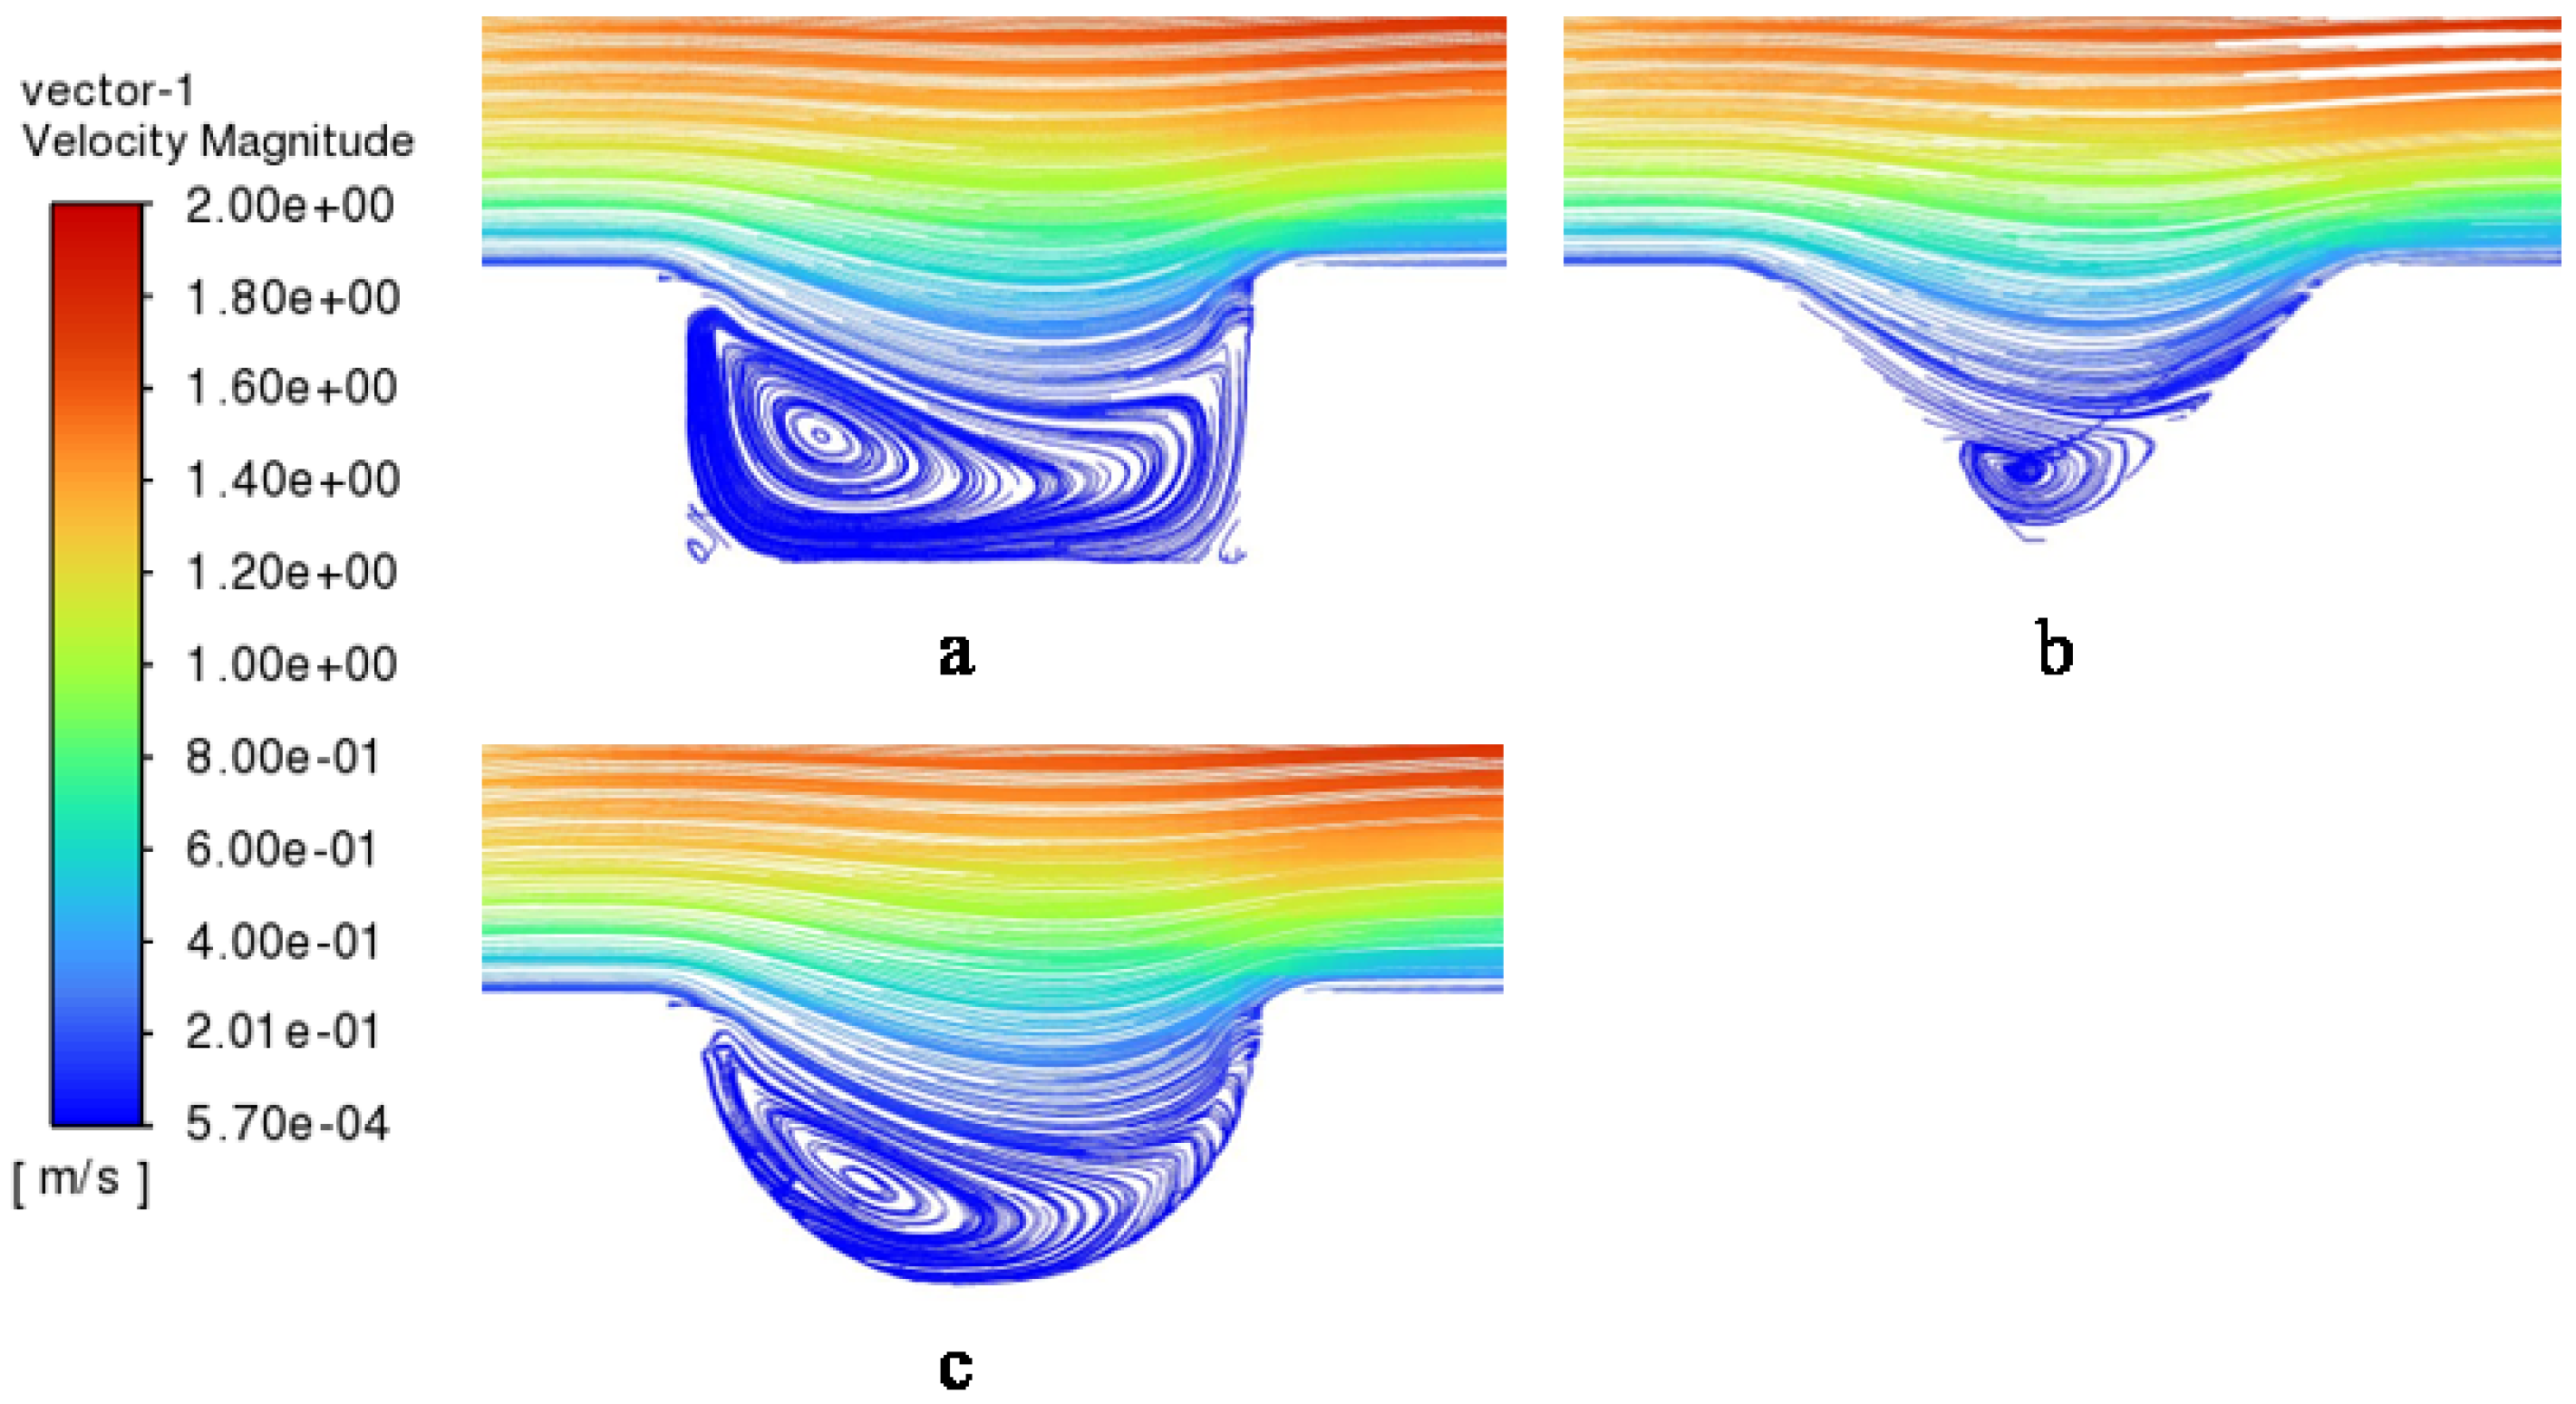
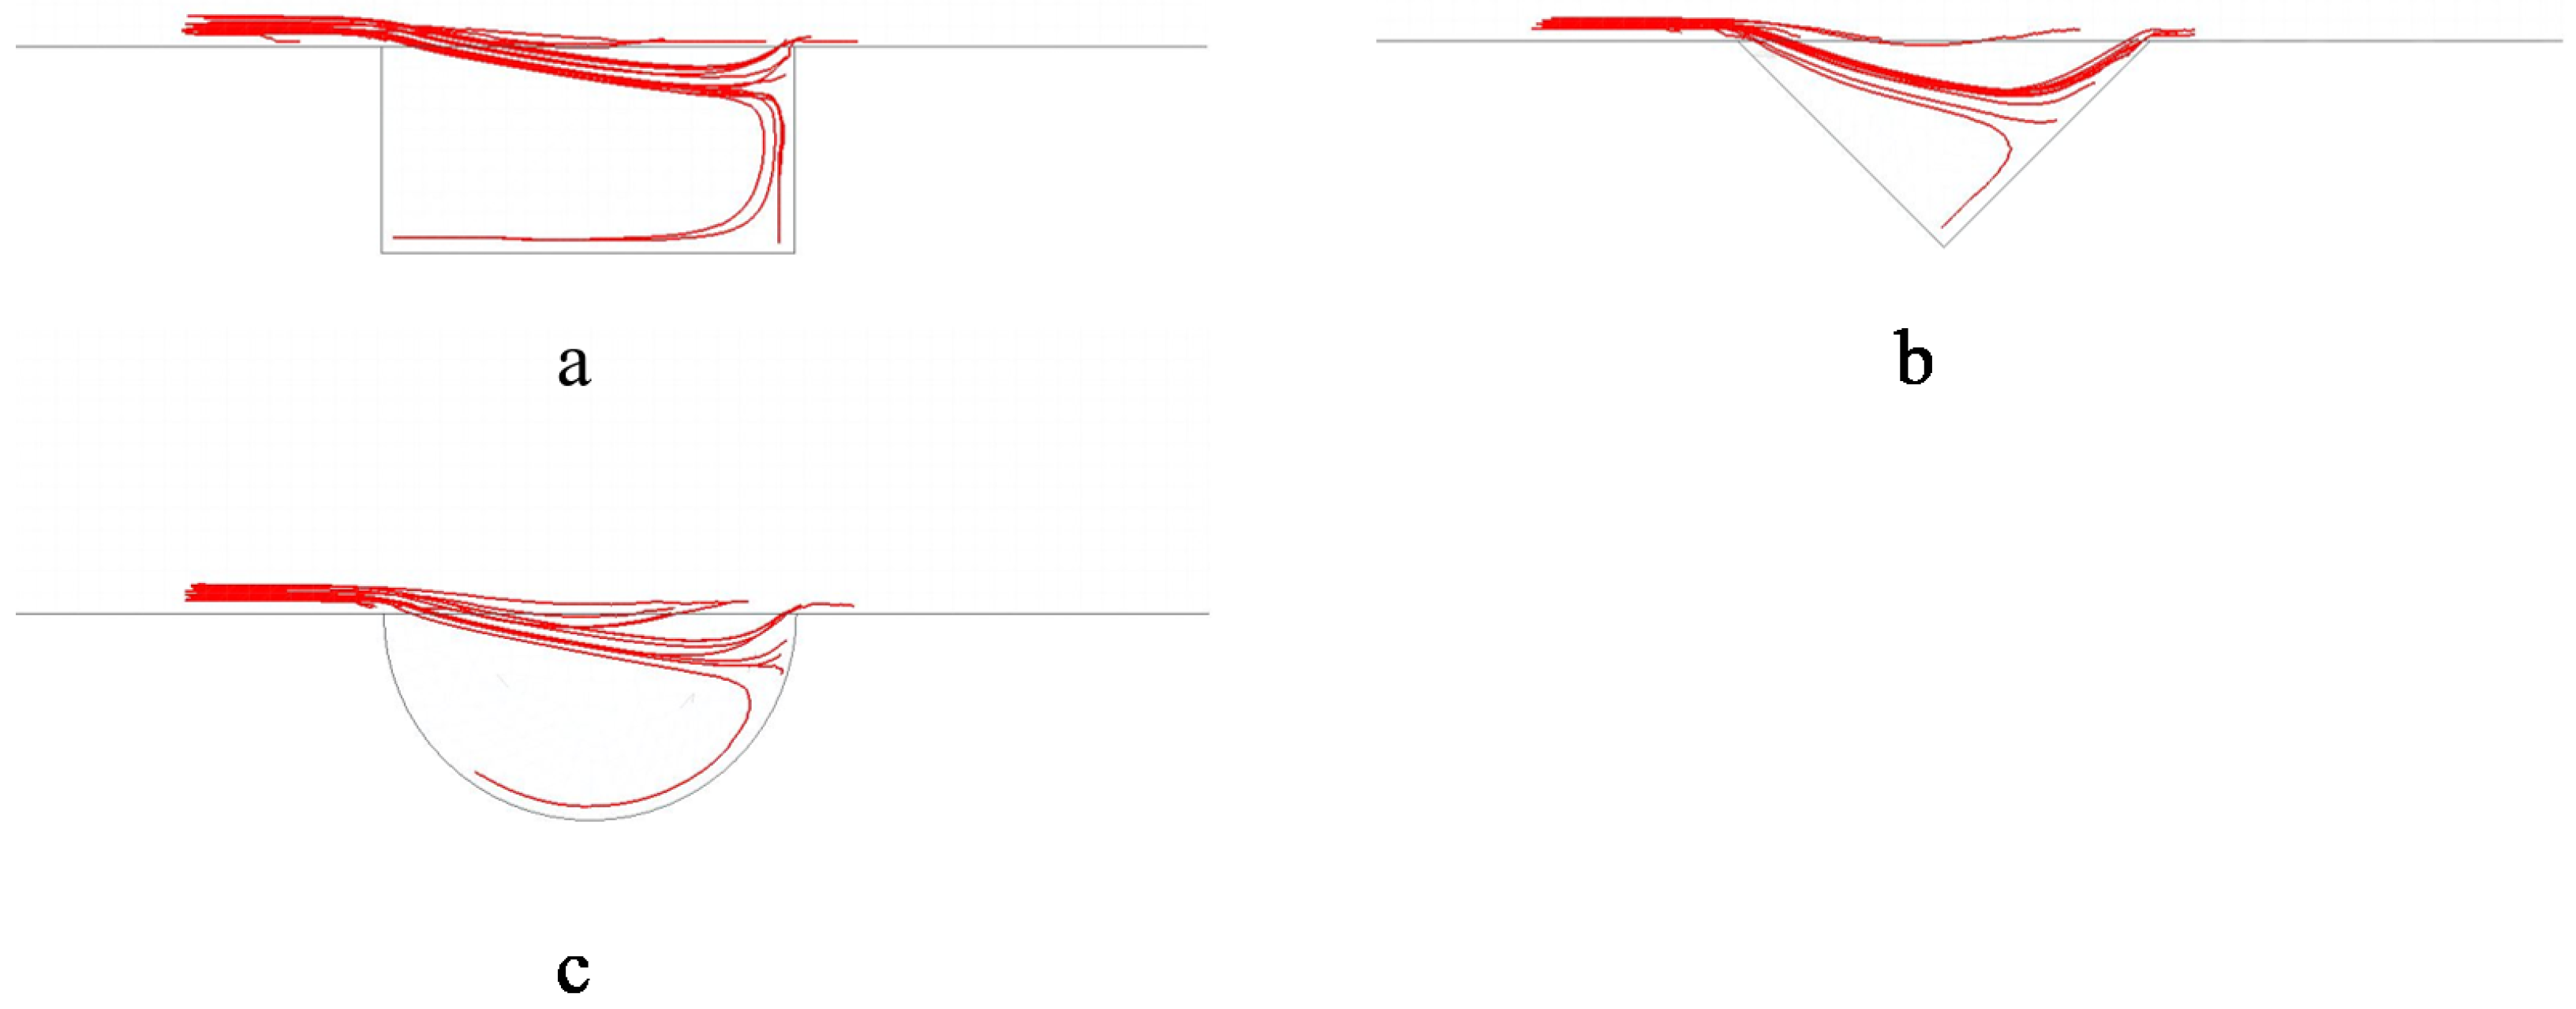
Figure 4 illustrates the corresponding local streamline patterns. As fluid traverses the grooves, the combined effects of geometric confinement and adverse pressure gradients trigger boundary layer separation, fostering the development of stable, closed recirculation vortices within the cavities. These vortices facilitate continuous momentum and mass exchange with the mainstream flow across the shear layer. At the leading edge of the groove, boundary layer separation occurs; the separated fluid bifurcates into one stream entrained into the cavity to establish recirculation, and another propagating downstream over the groove. At the trailing edge, the mainstream flow reattaches, completing the separation-reattachment cycle. In these separation-reattachment regions, the flow field experiences substantial deflection, altering the trajectory of suspended bacterial particles. Consequently, advected bacterial particles exhibit a higher likelihood of traversing the boundary layer and adhering to the wall. This effect is most pronounced at the trailing edge, where flow separation triggered by the geometric discontinuity causes large-scale flow deflection, forming a dominant particle adhesion zone.
Groove geometry directly modulates the size and shape of the separation zone. The topological flow structures above the recirculation vortices in the quadrilateral (Figure 4a) and semicircular (Figure 4c) grooves are similar; however, the lower cavity of the quadrilateral groove possesses a larger volume, resulting in a more fully developed recirculation vortex. Additionally, the separation zone above the semicircular groove (Figure 4c) is more expansive, and the streamlines at the trailing edge are highly concentrated. Conversely, the triangular groove (Figure 4b) features an underdeveloped recirculation vortex with a minimal separation zone, and the magnitude of flow field deflection is substantially reduced.
Because the triangular groove sustains a more stable flow field with minimal deflection, streamlines adjacent to the trailing edge wall remain nearly parallel to the surface. This flow configuration yields a higher peak wall shear stress of 608.62 Pa at the trailing edge—significantly exceeding those of the quadrilateral (443.91 Pa) and semicircular (461.93 Pa) grooves. This elevated shear stress exerts a potent scouring effect, promoting the detachment of adherent bacterial particles.
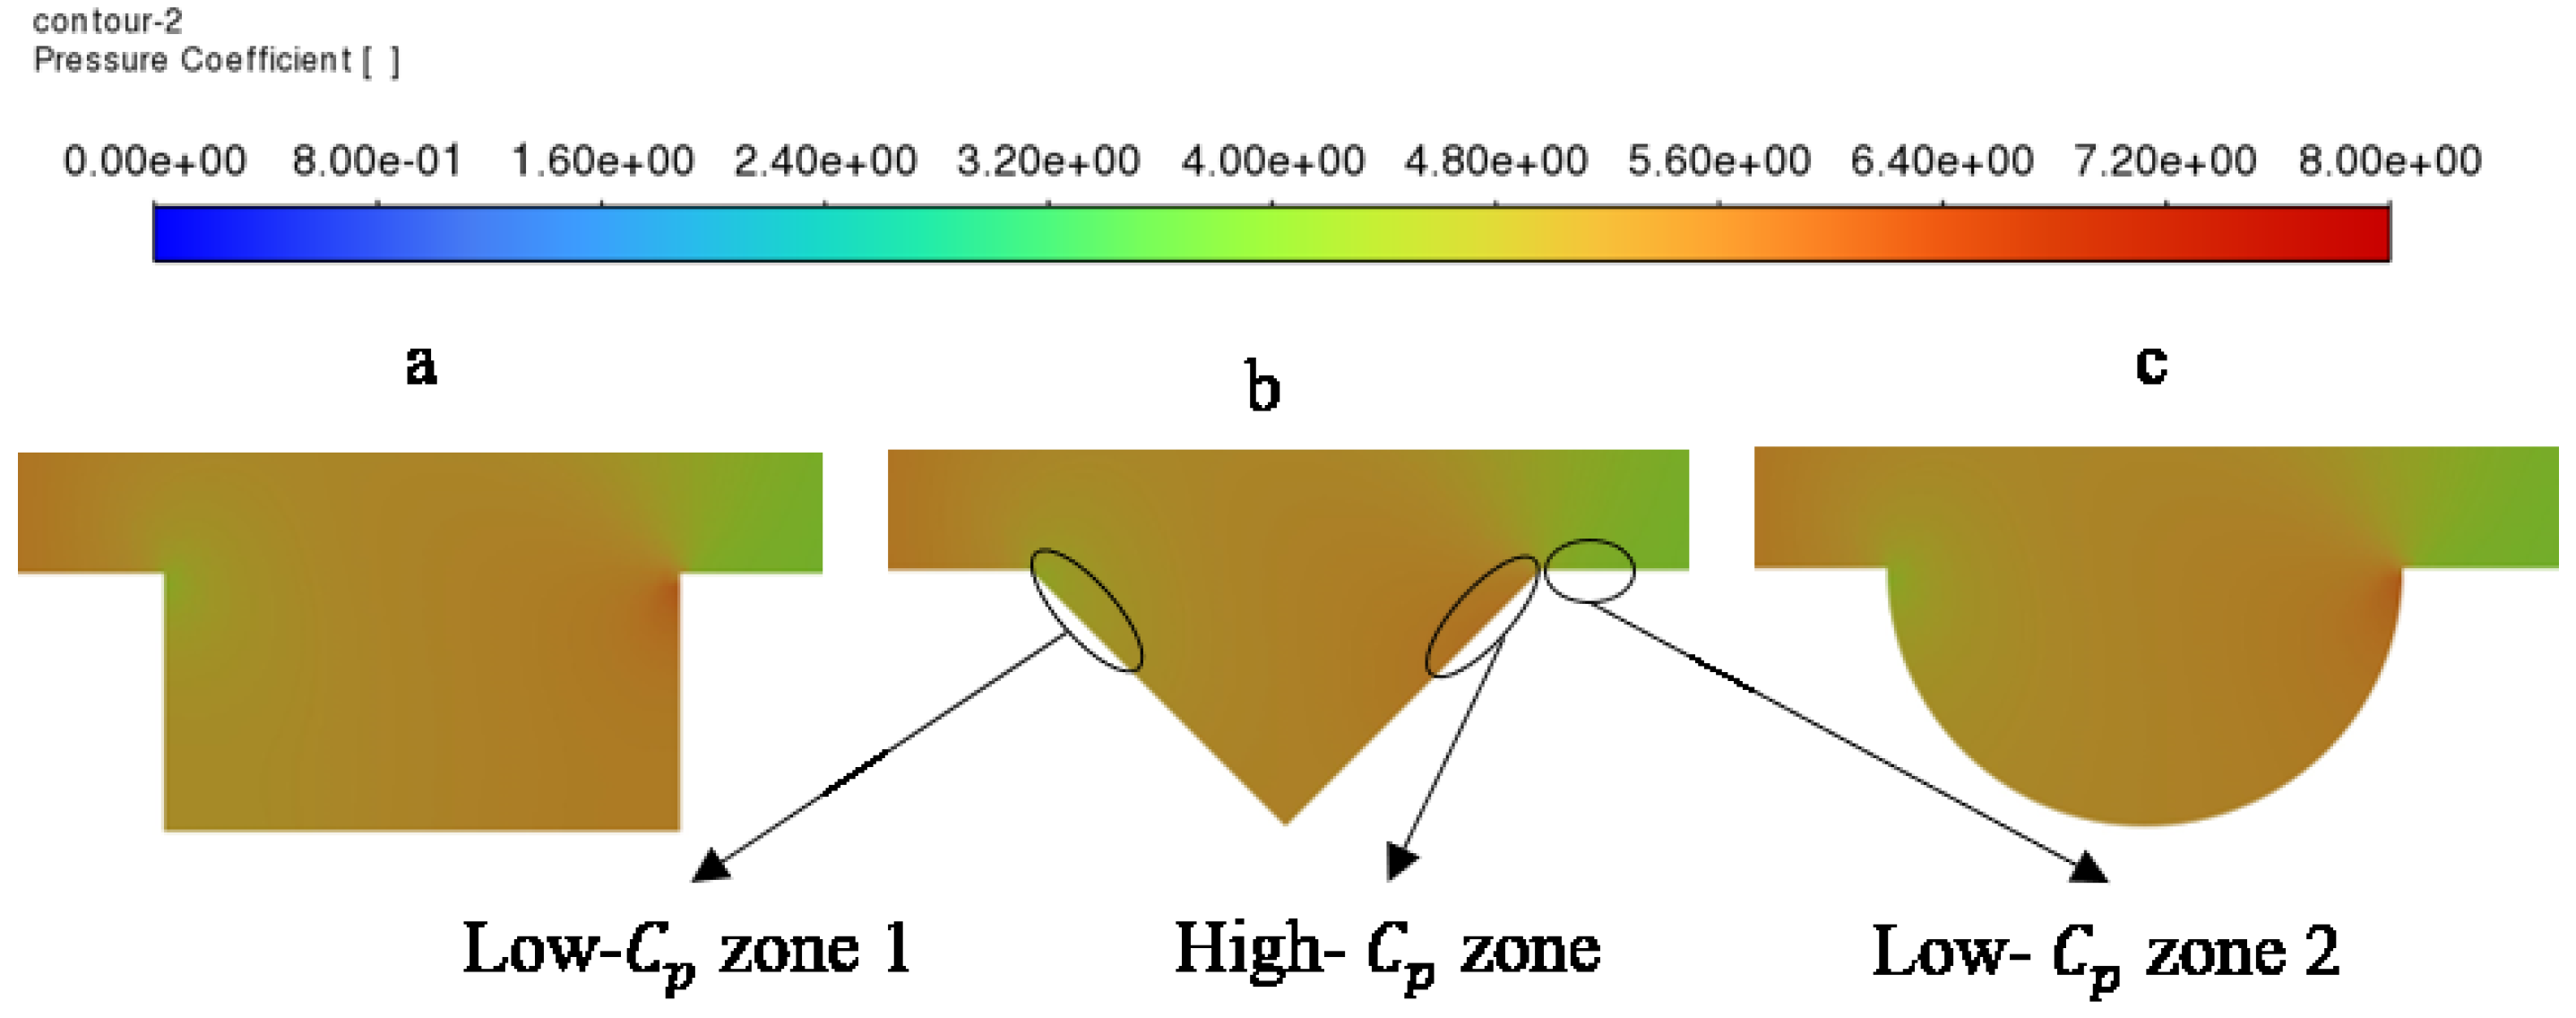
Figure 5 illustrates the nondimensionalized pressure coefficient ( C p ) distributions on the XY plane ( Z = 0 ) at 1 m/s. The introduction of grooves induces a low- C p region near the leading edge and along the trailing edge of the channel wall, accompanied by a high- C p stagnation region directly on the trailing edge wall. The quadrilateral (Figure 5a) and semicircular (Figure 5c) grooves exhibit comparable pressure coefficient profiles, whereas both differ markedly from the triangular groove (Figure 5b). The extreme values of these localized pressure coefficient regions are summarized in Table 7. The resulting pressure gradients drive particle migration from the high-pressure regions toward the low-pressure wall regions, thereby enhancing particle-wall contact efficiency.

4.1.2. Influence of Inlet Flow Velocity

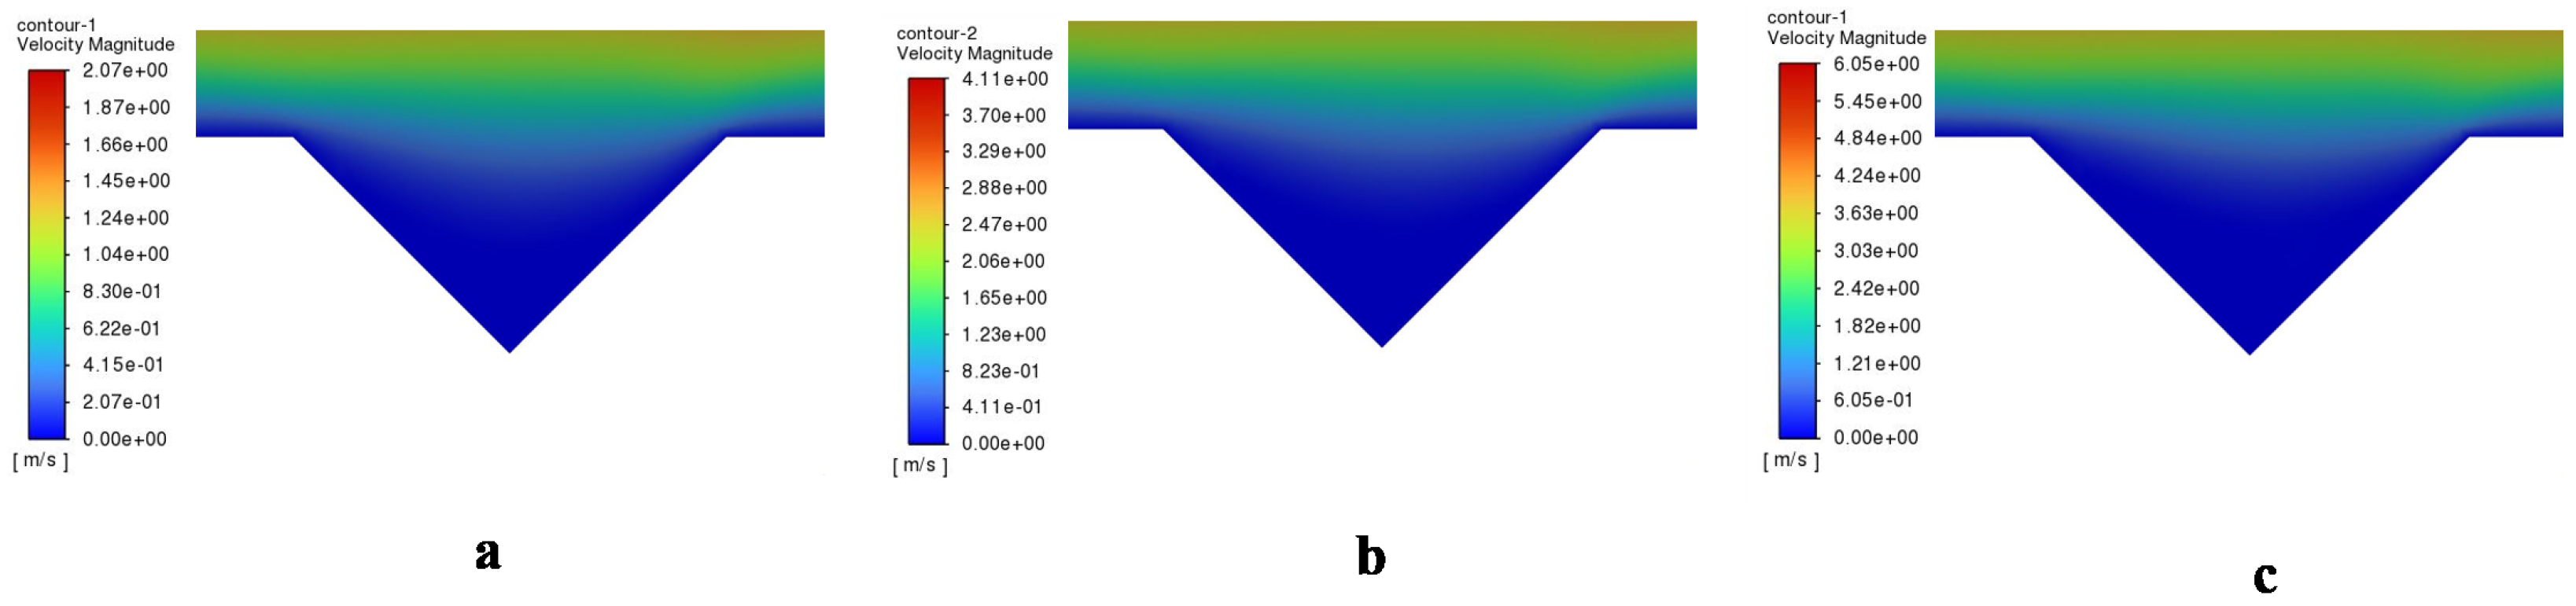
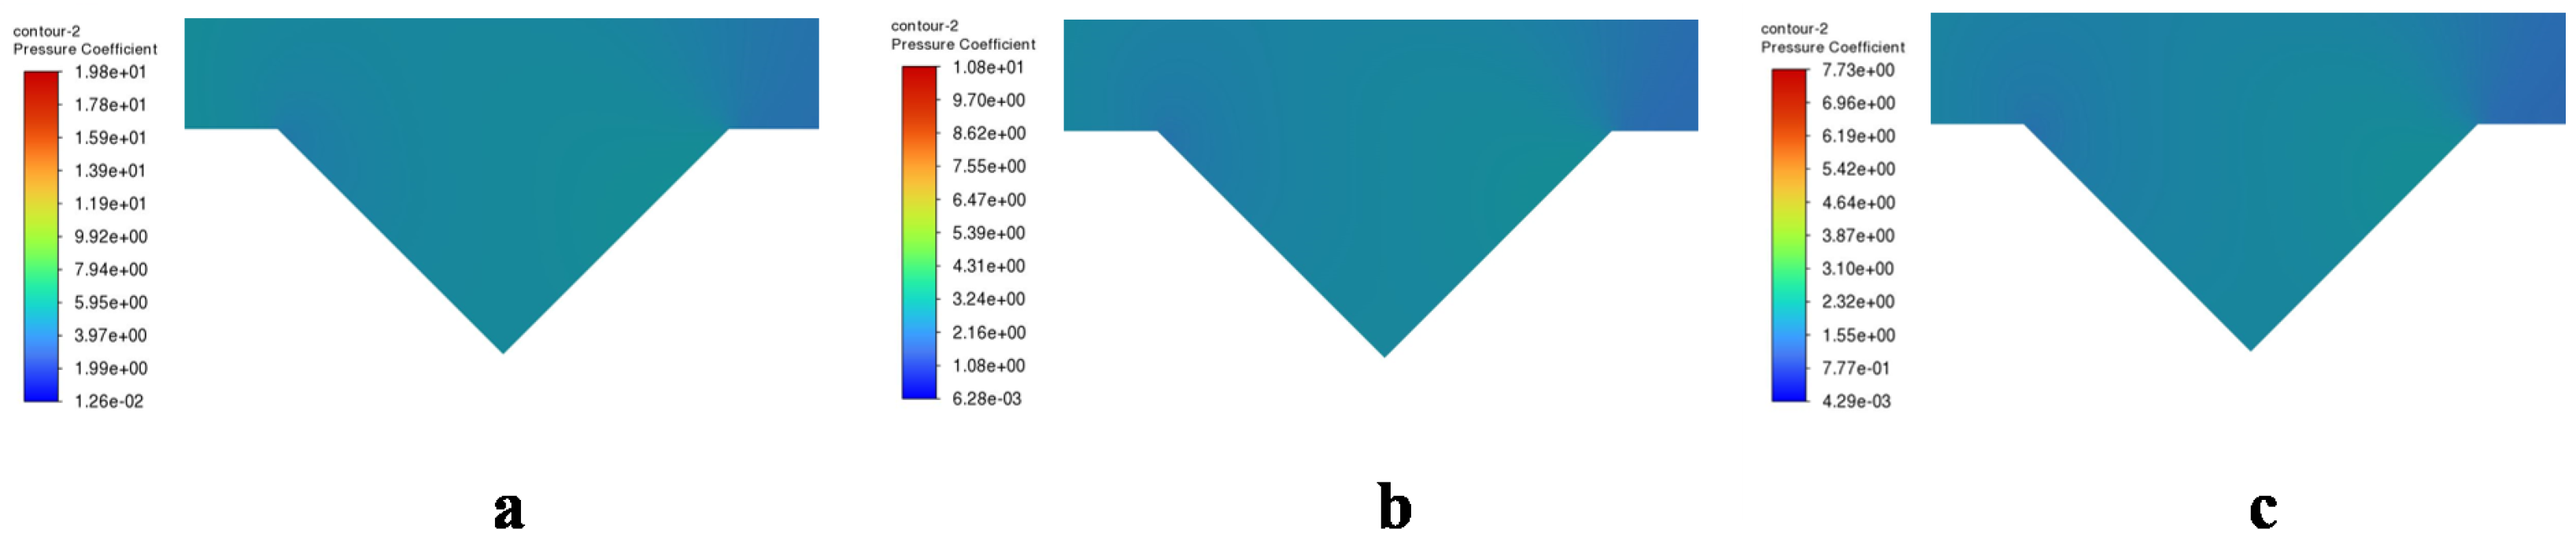
Figure 6 and Figure 7 present the local velocity and nondimensionalized pressure coefficient contour plots for the triangular groove under inlet velocities of 1 m/s, 2 m/s, and 3 m/s.
As the inlet velocity increases, the relative hydrodynamic characteristics—including the spatial distribution of velocity gradients and the shape of the separation zones—do not undergo fundamental topological changes. As illustrated in Figure 7, the maximum pressure coefficient ( C p ) exhibits a significant decrease from 29.8 to 11.3 as the inlet velocity increases from 1 m/s to 3 m/s. This inverse relationship ( C p 1 / U ) indicates that the flow within the micro-grooves is predominantly governed by viscous forces in this low-Reynolds-number regime, where the local pressure drop scales linearly with velocity rather than its square. Furthermore, the C p distributions across different velocities show high topological similarity, which further confirms that the flow characteristics—such as the specific locations of flow separation and recirculation—are intrinsically determined by the groove geometry rather than the flow magnitude.
Instead, the magnitude of the velocity gradient increases approximately linearly with the inlet velocity. Wall shear stress is dominated by fluid viscous forces, it directly depends on the near-wall velocity gradient. Consequently, higher inlet velocities synchronously amplify the near-wall velocity gradient, leading to a proportionally linear increase in the wall shear stress.

4.2. Bacterial Particle Adhesion Analysis

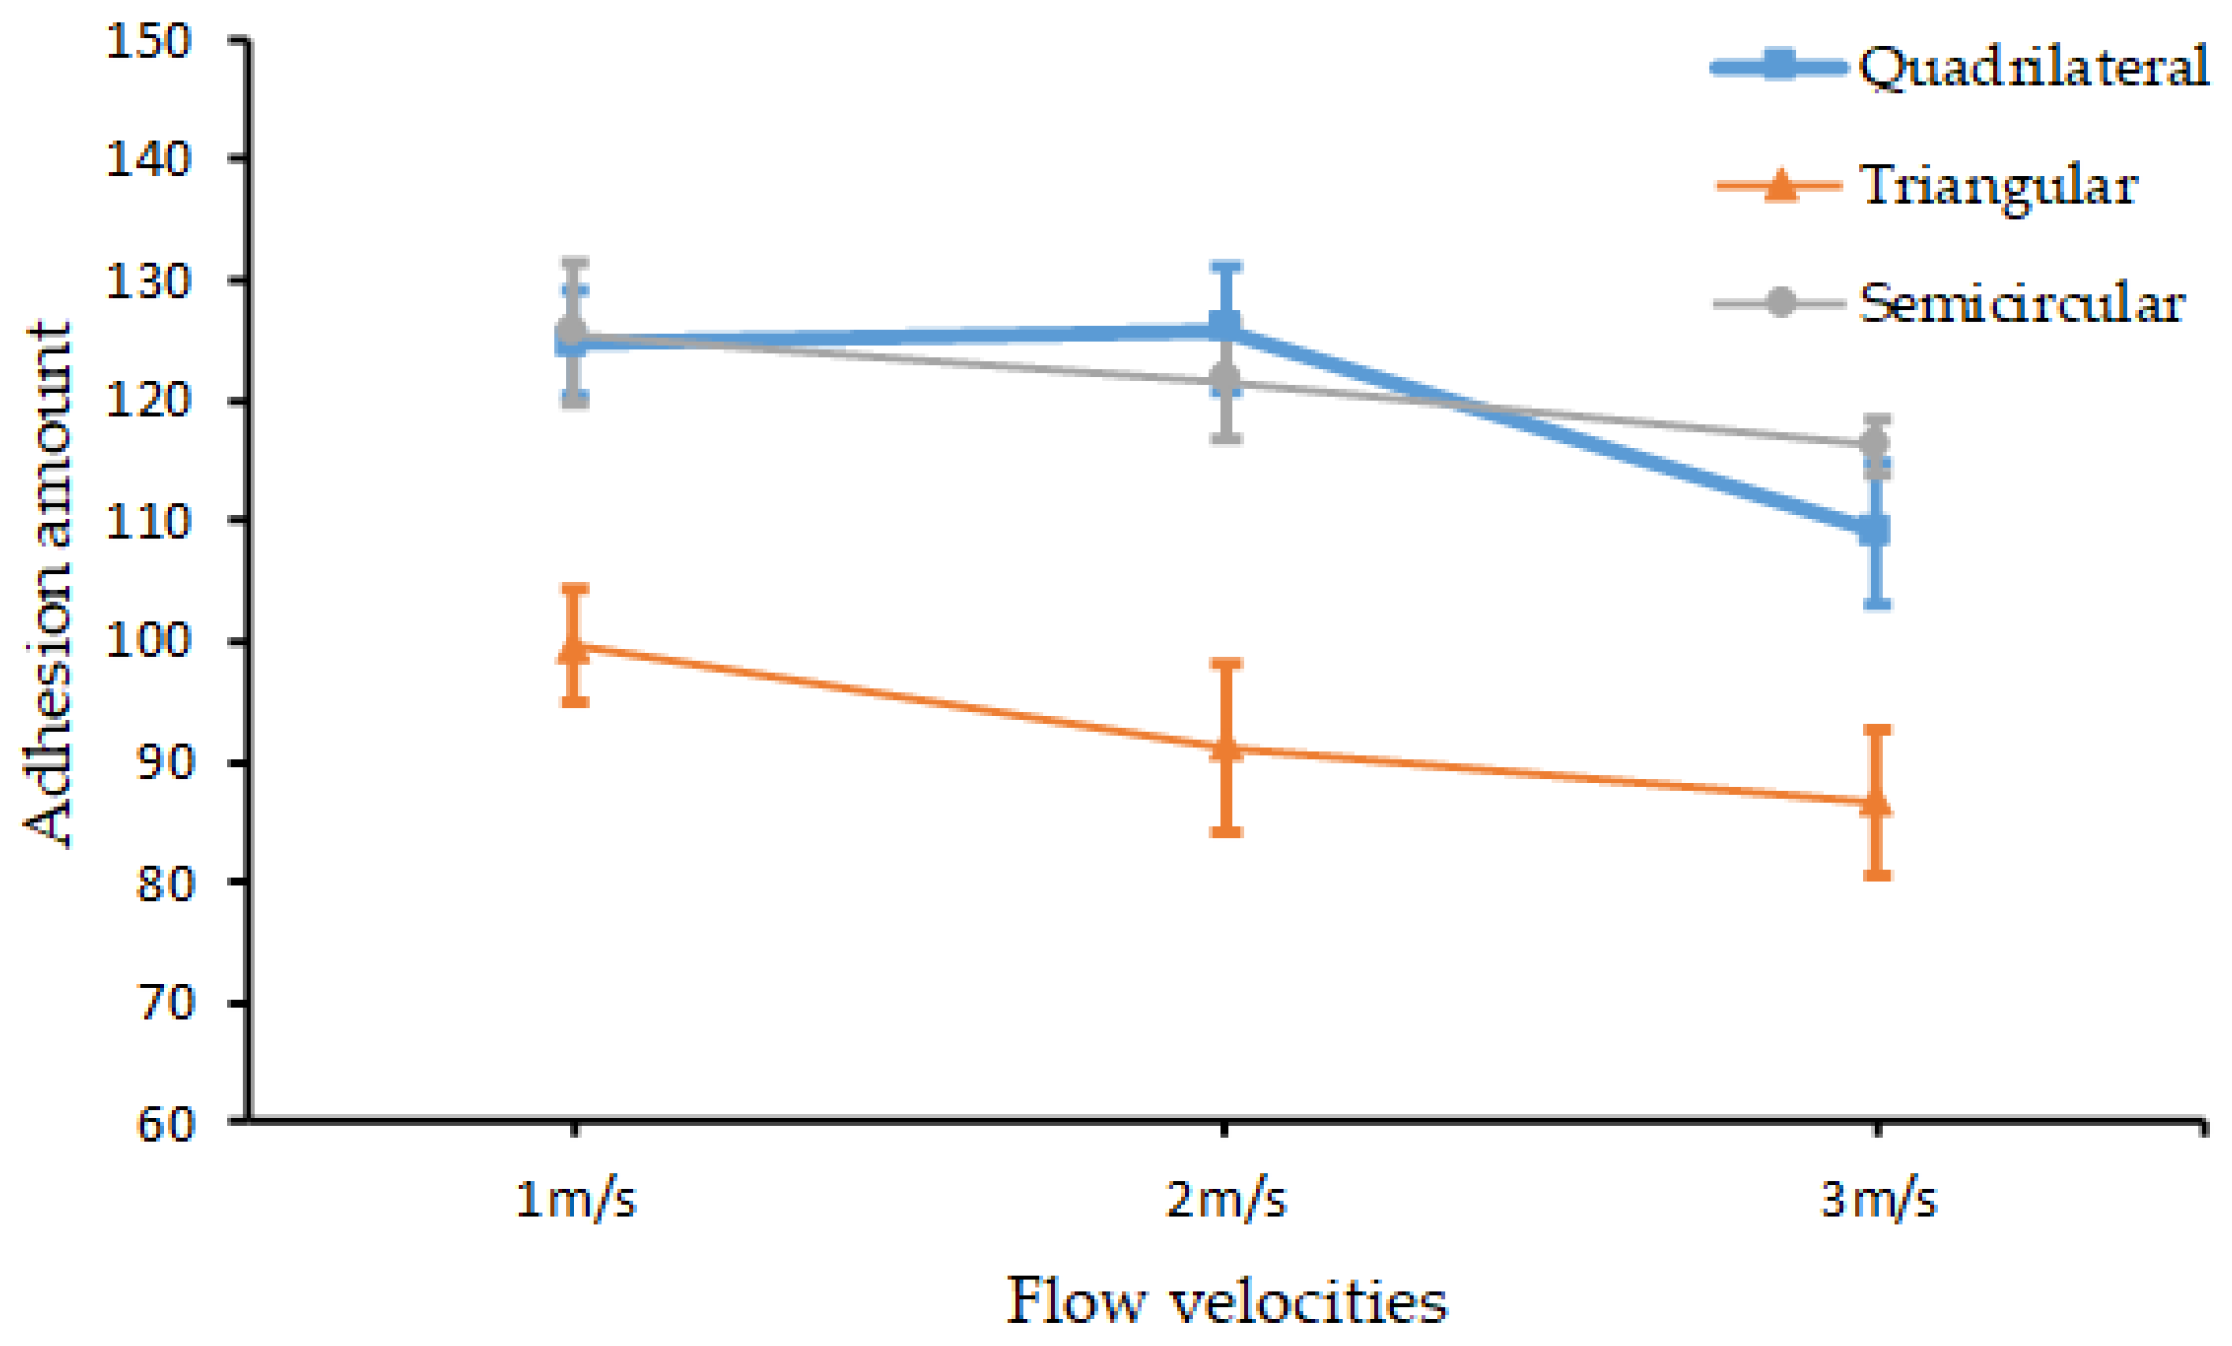
To ensure statistical rigor given the stochastic nature of particle generation, the adhesion count for each configuration is reported as the average of five independent simulation runs, with error bars in the figures representing the standard deviation of the 5 repeated tests. The overall results are summarized in Figure 8.
It is important to note that the quantitative adhesion patterns observed here are governed by the specific energy landscape of the P. aeruginosa–PTFE pair. For instance, a more hydrophilic bacterium or a substrate with different surface energy components might exhibit a different primary minimum depth, potentially shifting the balance between hydrodynamic drag and adhesive forces.

4.2.1. Influence of Flow Velocity on Adhesion

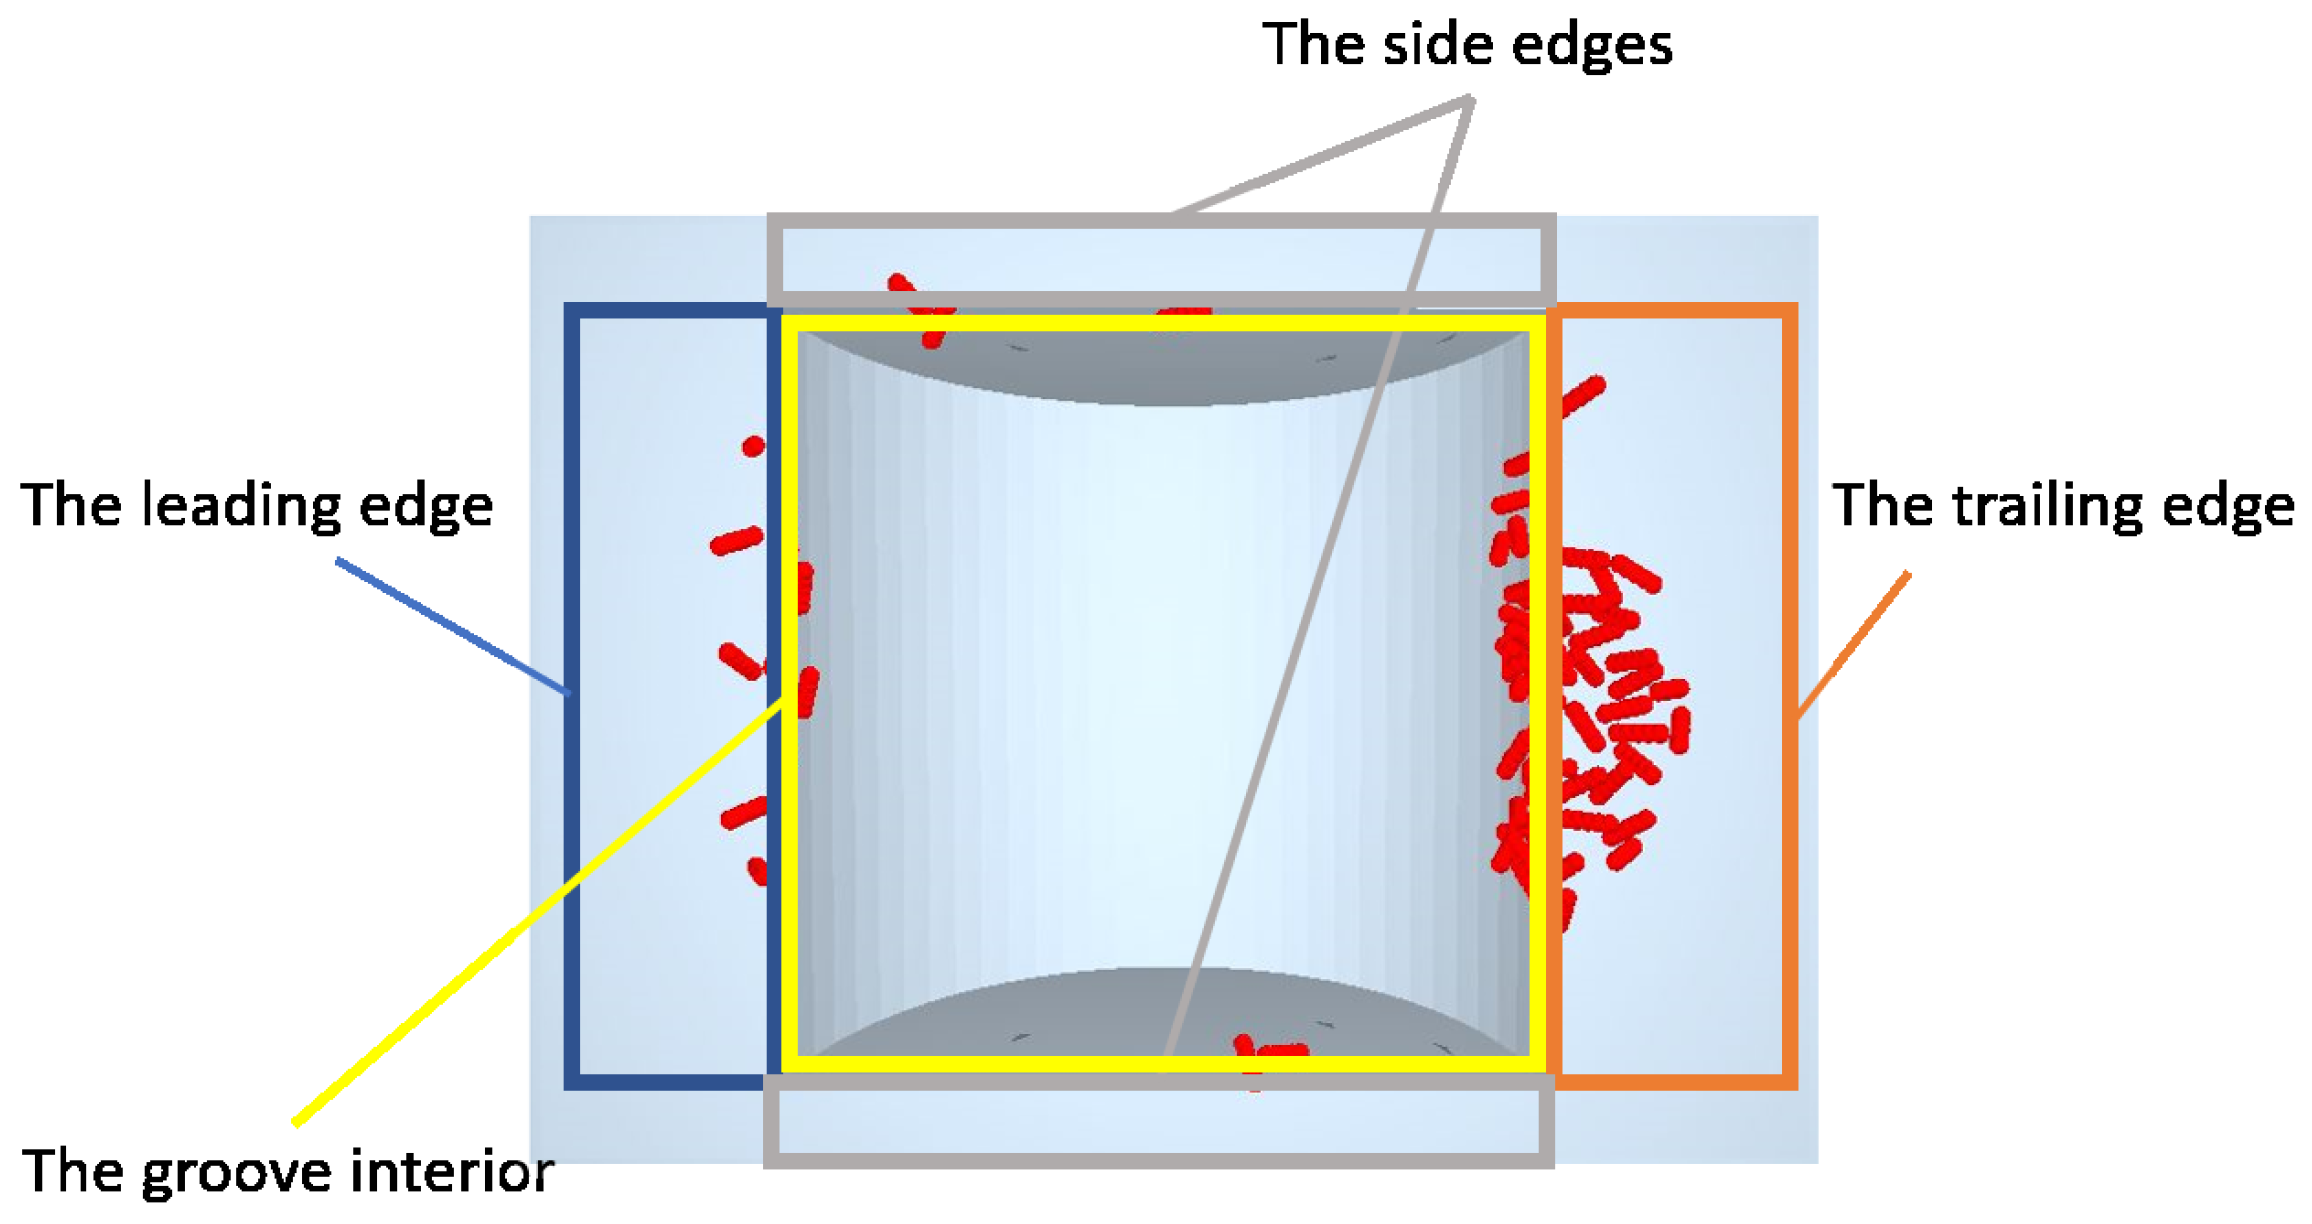
The spatial distribution of adhered bacteria was quantified by dividing the surface into four zones: the leading edge, the trailing edge, the side edges, and the groove interior. A schematic of these discrete adhesion regions is presented in Figure 9.
As demonstrated in Figure 8, the inlet velocity exerts a substantial inhibitory effect on bacterial adhesion. For any given geometric configuration, the total number of adhered bacteria drops markedly as the flow velocity increases. Dynamically, the increased velocity intensifies near-wall velocity and pressure gradients, amplifying the fluid drag and pressure gradient forces acting on the bacterial particles.
Although increased flow velocity theoretically raises the particle Stokes number ( S t )—potentially causing slight centrifugal deviations during streamline deflection that could force particles closer to the wall—this inertial effect is insufficient to overcome the hydrodynamic flushing of the high-speed fluid ( S t 1 ). The extracted Lagrangian motion trajectories of typical adhered particles (Figure 10) reveal a high degree of fidelity between particle paths and fluid streamlines. The calculated Stokes number for this system is approximately 0.006, physically confirming excellent flow-following capability; their motion is governed entirely by macroscopic fluid transport rather than inertia. Consequently, high hydrodynamic forces dominate the detachment process, sweeping bacteria away before stable, irreversible adhesion can occur.
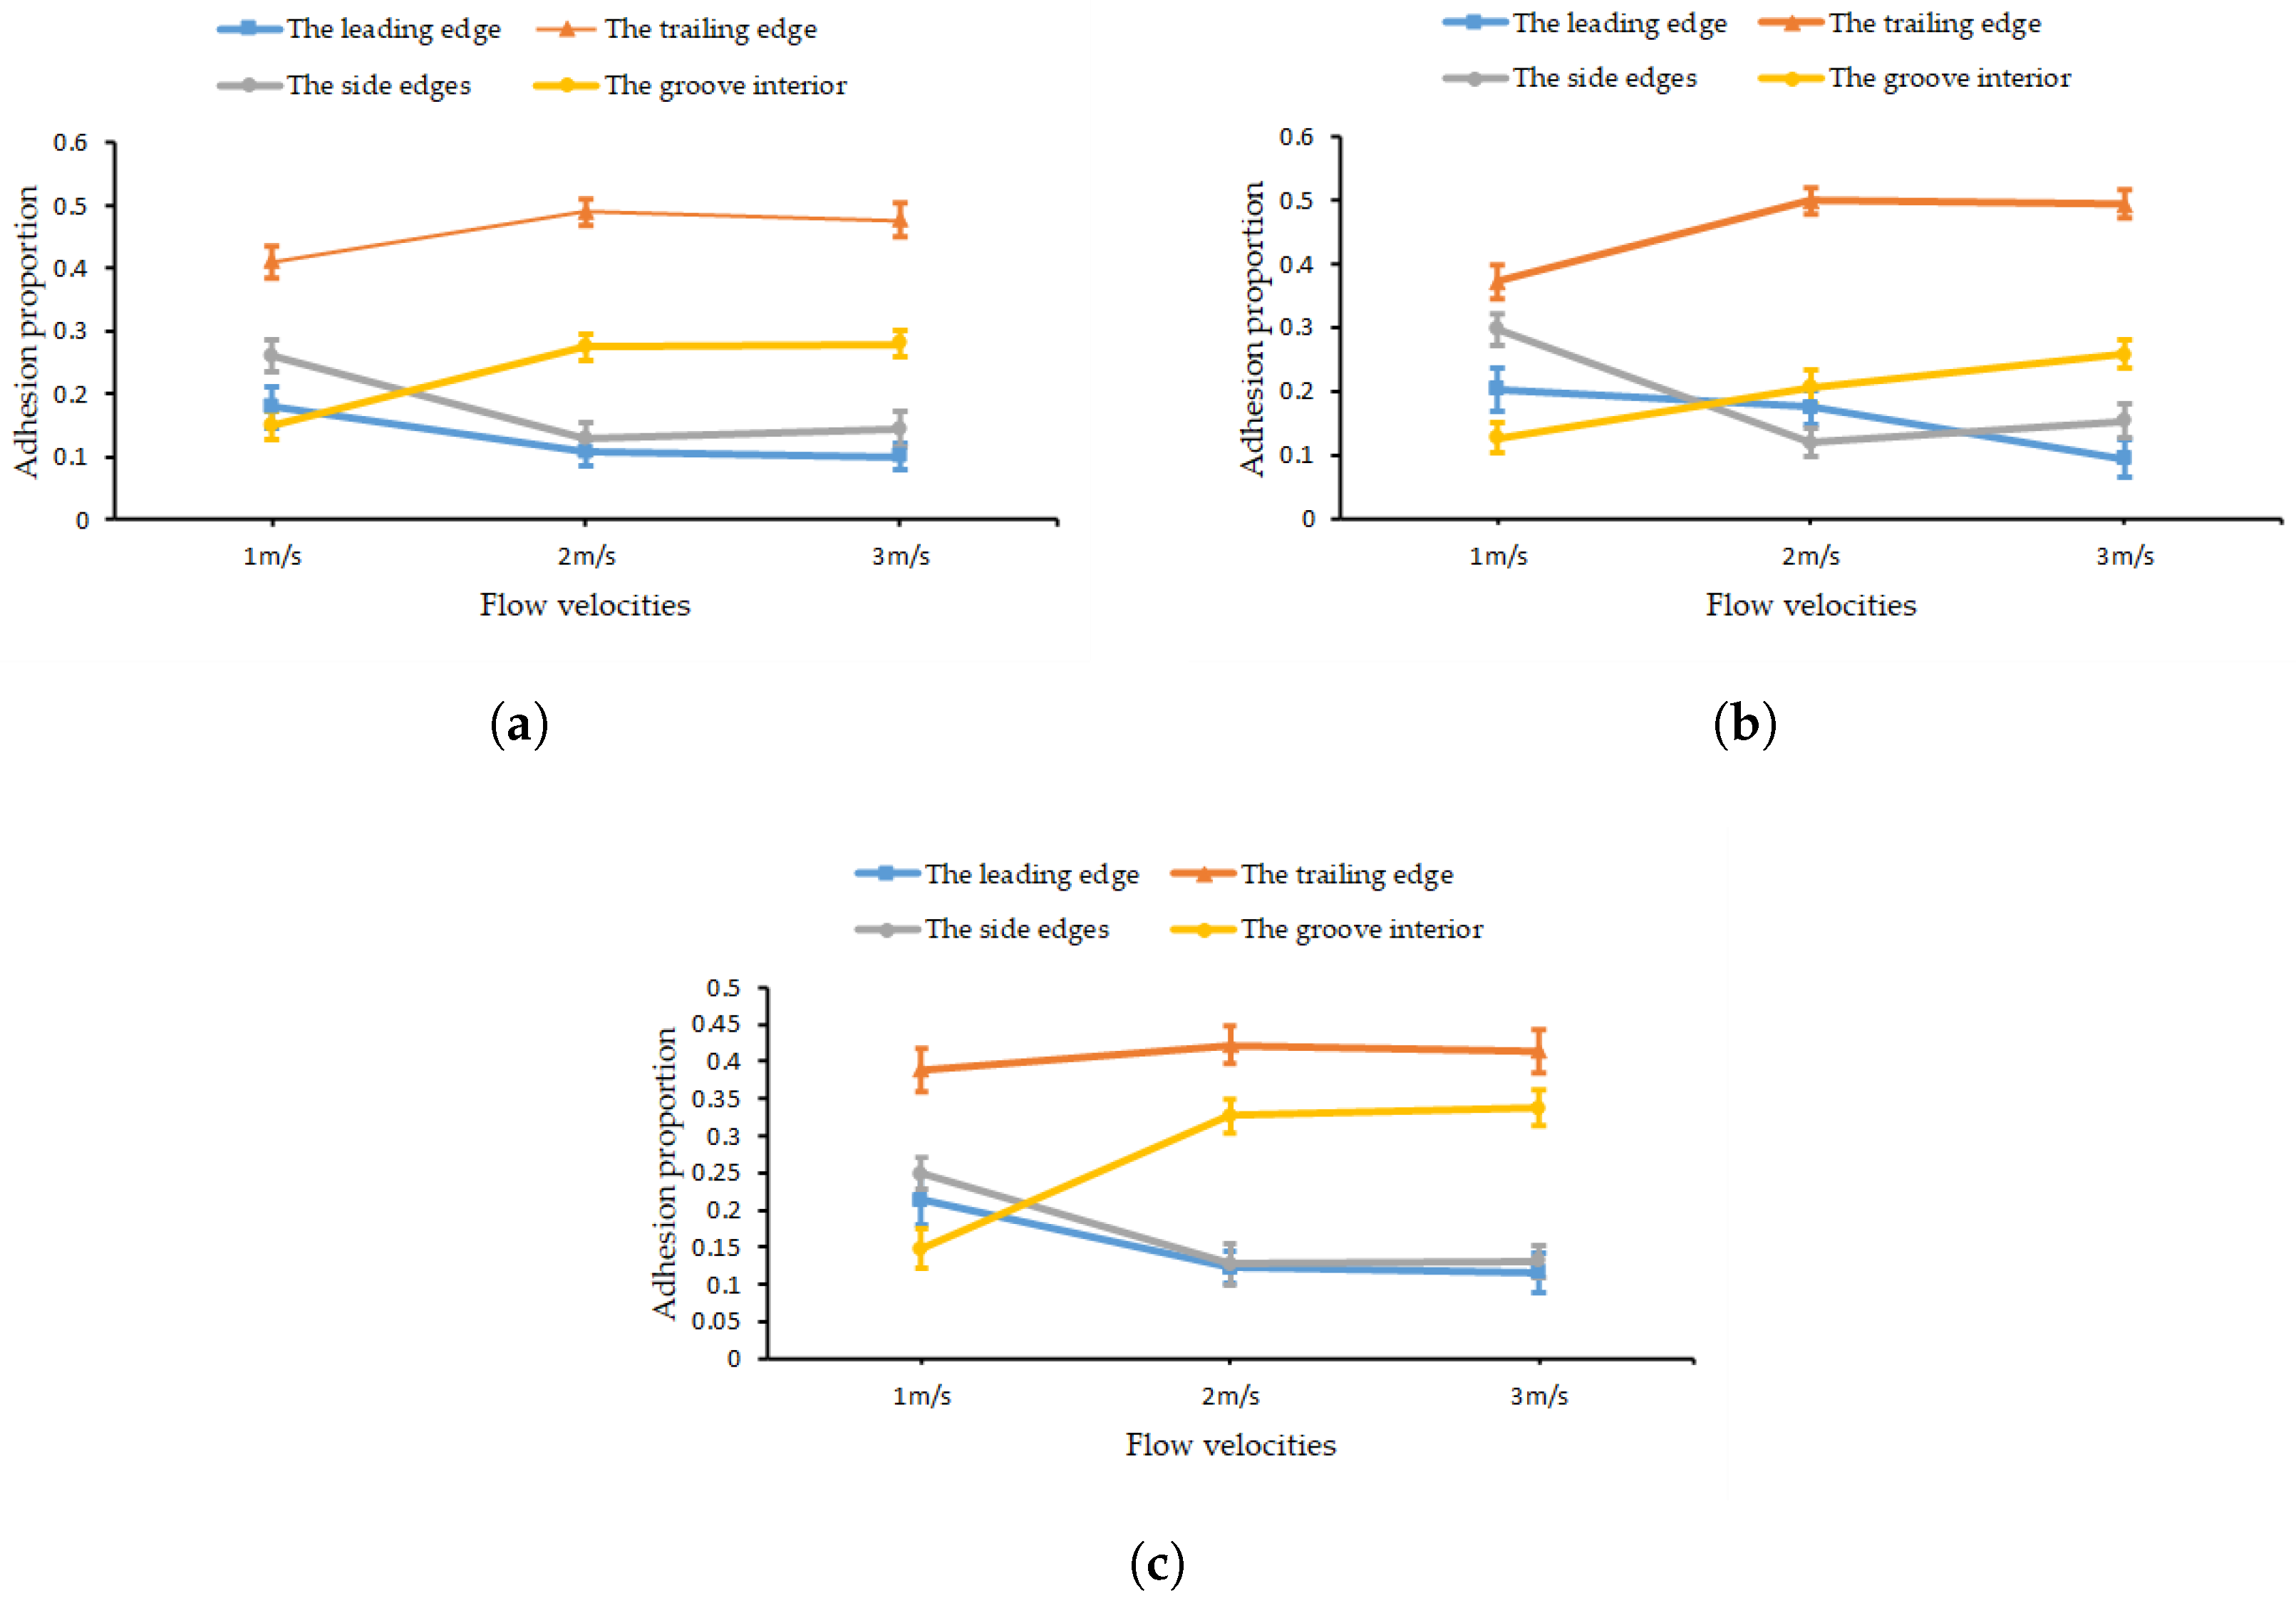
Furthermore, flow velocity modulates the spatial distribution of bacterial adhesion. Figure 11 details the percentage of bacteria in each zone for the quadrilateral, triangular, and semicircular grooves. Quantitative analysis indicates that as velocity increases, adhesion at the leading edge and side edges decreases, while proportionally concentrating at the trailing edge and within the groove cavity. These trailing and interior regions function as quasi-static zones, exhibiting lower sensitivity to velocity fluctuations and affording hydrodynamic shielding.

4.2.2. Influence of Flow Deflection on Adhesion

Under identical inlet velocities and groove depths, the bacterial adhesion quantity is highly dependent on groove geometry (Figure 8). Adhesion metrics for quadrilateral and semicircular grooves are comparable, yet both are significantly higher than those for triangular grooves. This disparity is governed by flow field topology: quadrilateral and semicircular structures provide expansive bottom cavities that support fully developed recirculation vortices and enlarged separation zones. Near the trailing edge, streamlines undergo abrupt deflections and converge toward the wall, creating a pronounced wall-approaching flow field.
Due to the exceptionally low Stokes number, physical collision probabilities can be accurately predicted directly from streamline distributions. When a particle’s trajectory follows a converging streamline such that the wall-to-center distance drops to approximately the bacterial radius, XDLVO attractive forces are triggered, initiating capture. The sharp streamline deflections inherent to quadrilateral and semicircular grooves drastically increase this contact probability. Conversely, the smoother geometric transition of the triangular groove yields high flow field stability and minimal deflection; streamlines remain nearly parallel to the wall, significantly mitigating physical wall approaches.
As evidenced by Figure 11, while groove geometry dictates the absolute magnitude of adhesion, it exerts only a minor influence on the relative spatial distribution ratios. This suggests that in micro-scale features, spatial selectivity is broadly governed by general topological features (e.g., separation and stagnation points), whereas the specific geometry modulates the intensity and ultimate adhesion scale.

5. Conclusions

This study systematically evaluated the influence of idealized micro-scale regular groove geometries on the hydrodynamic environment and the initial adhesion behavior of Pseudomonas aeruginosa on PTFE surfaces under strictly laminar flow conditions, utilizing an integrated CFD-DEM coupling framework with XDLVO theory. All findings and conclusions presented below are specifically restricted to this bacteria–material system and the specified near-wall flow regimes. The primary findings are summarized as follows:
  • Geometric Regulation and Finite-Size Effects: Groove morphology strictly regulates bacterial capture. Quadrilateral and semicircular grooves possess expansive bottom spaces that induce severe streamline deflections and large separation zones. This converging flow forces particle trajectories toward the wall; once within the critical capture radius, XDLVO mechanisms ensure irreversible adhesion. Conversely, triangular grooves maintain highly stable, parallel streamlines, preventing particles from crossing the critical capture distance.
  • Inhibitory Effect of Flow Velocity: The total adhesion of Pseudomonas aeruginosa decreases significantly as the inlet velocity increases. Although higher velocities theoretically raise inertial centrifugal forces, the extremely low Stokes number ( S t 0.006 ) ensures excellent flow-following capability. Consequently, intense fluid drag and stripping forces dominate the near-wall dynamics at high speeds, markedly reducing overall adhesion efficiency.
  • Spatial Distribution Mechanics: Elevated flow velocities shift the proportional distribution of Pseudomonas aeruginosa adhered within the grooves on the PTFE surface. Adhesion becomes heavily concentrated at trailing edges and within the internal cavities. These regions serve as “quasi-static zones” shielded by recirculation vortices, maintaining localized low-shear environments even amidst high-speed mainstream flows.
  • Validation and Reliability: The proposed model exhibits robust agreement with established experimental data. The simulated velocity distributions and the structural evolution of the recirculation zones are in excellent agreement with the experimental visualizations and numerical results for grooved channels reported by Greiner et al. [25]. Specifically, the captured transition from stable vortex formation to flow separation at the leading and trailing edges aligns with the flow destabilization mechanisms observed in their classic study on triangular-patterned surfaces. Furthermore, the localized accumulation of bacteria at the leading and trailing edges corroborates the Lagrangian particle tracking studies of Warning and Datta [9], confirming our mechanistic explanation for geometry-induced bio-contamination.

Author Contributions

Conceptualization, X.R.; methodology, L.C.; software, L.C.; validation, L.C.; formal analysis, L.C., H.Y. and X.R.; investigation, L.C.; resources, X.R.; data curation, L.C.; writing—original draft preparation, L.C.; writing—review and editing, H.Y. and X.R.; visualization, L.C.; supervision, X.R.; project administration, X.R.; funding acquisition, X.R. All authors have read and agreed to the published version of the manuscript.

Funding

This research was funded by the Zhejiang Provincial Natural Science Foundation of China under Grant No. LD24E050008.

Institutional Review Board Statement

Not applicable.

Informed Consent Statement

Not applicable.

Data Availability Statement

Data are contained within the article.

Conflicts of Interest

The authors declare no conflict of interest.

Appendix A. Analytical Calculation of Wall Shear Stress

For a steady, fully developed laminar flow in a rectangular duct with dimensions a = 30 μ m and b = 40 μ m , the average wall shear stress τ w can be calculated analytically. First, the hydraulic diameter D h is:
D h = 4 A P = 4 ( a · b ) 2 ( a + b ) = 2 · 30 · 40 30 + 40 34.29 μ m
The Reynolds number R e for an inlet velocity u = 1 m / s is:
R e = ρ u D h μ = 1000 · 1 · 34.29 × 10 6 1 × 10 3 34.29
For a rectangular duct with an aspect ratio α = b / a = 4 / 3 1.33 , the product of the Darcy friction factor f and R e is approximately:
f · R e 57.91
The Darcy friction factor is then:
f = 57.91 R e = 57.91 34.29 1.689
Finally, the average wall shear stress τ w is given by:
τ w = 1 8 f ρ u 2 = 1 8 · 1.689 · 1000 · 1 2 211.1 Pa
This analytical value validates the numerical accuracy of the laminar fluid phase model.

References

  1. Yang, J.-y.; Yang, J.; Bai, X.-r.; Ren, Z.-g.; Liu, C.-w.; Gong, X.; Hu, L.; Ruan, X.-d. Review of Ultra-clean Flow Control Technology in Wet Process of Semiconductor. Chin. Hydraul. Pneum. 2022, 46, 1–17. [Google Scholar] [CrossRef]
  2. Chen, C.; Zhou, R.; Sun, W. Design and internal cavitation characteristics of straight-through electric fully enclosed ultra-clean globe valve. J. Mech. Sci. Technol. 2023, 37, 3543–3554. [Google Scholar] [CrossRef] [Scilit]
  3. Mittelman, M.W.; Jones, A.D.G. A Pure Life: The Microbial Ecology of High Purity Industrial Waters. Microb. Ecol. 2018, 76, 9–18. [Google Scholar] [CrossRef] [Scilit]
  4. Kulakov, L.A.; McAlister, M.B.; Ogden, K.L.; Larkin, M.J.; O’Hanlon, J.F. Analysis of Bacteria Contaminating Ultrapure Water in Industrial Systems. Appl. Environ. Microbiol. 2002, 68, 1548–1555. [Google Scholar] [CrossRef] [Scilit]
  5. Lebeaux, D.; Ghigo, J.; Beloin, C. Biofilm-related infections: Bridging the gap between clinical management and fundamental aspects of recalcitrance toward antibiotics. Microbiol. Mol. Biol. Rev. 2014, 78, 510–543. [Google Scholar] [CrossRef] [Scilit]
  6. Su, R.; Liu, Y.; Hu, L.; Shen, Y.; Wang, J.; Ruan, X.; Fu, X. Experimental investigation of cavitation erosion-induced surface damage and particle shedding from PTFE. Mater. Des. 2025, 253, 113886. [Google Scholar] [CrossRef] [Scilit]
  7. Zhang, S.; Liang, X.; Gadd, G.M.; Zhao, Q. Advanced Titanium Dioxide-Polytetrafluorethylene (TiO2-PTFE) Nanocomposite Coatings on Stainless Steel Surfaces with Antibacterial and Anti-Corrosion Properties. Appl. Surf. Sci. 2019, 490, 231–241. [Google Scholar] [CrossRef] [Scilit]
  8. Hu, J.; Wysocki, A.; Winkler, R.G.; Gompper, G. Physical Sensing of Surface Properties by Microswimmers—Directing Bacterial Motion via Wall Slip. Sci. Rep. 2015, 5, 9586. [Google Scholar] [CrossRef] [Scilit]
  9. Warning, A.D.; Datta, A.K. Mechanistic understanding of non-spherical bacterial attachment and deposition on plant surface structures. Chem. Eng. Sci. 2017, 160, 396–418. [Google Scholar] [CrossRef] [Scilit]
  10. Tsuji, Y.; Kawaguchi, T.; Tanaka, T. Discrete particle simulation of two-dimensional fluidized bed. Powder Technol. 1993, 77, 79–87. [Google Scholar] [CrossRef] [Scilit]
  11. You, Y.; Liu, M.; Ma, H.; Xu, L.; Liu, B.; Shao, Y.; Tang, Y.; Zhao, Y. Investigation of the vibration sorting of non-spherical particles based on DEM simulation. Powder Technol. 2018, 325, 316–332. [Google Scholar] [CrossRef] [Scilit]
  12. Zhou, Z.Y.; Kuang, S.B.; Chu, K.W.; Yu, A.B. Discrete particle simulation of particle–fluid flow: Model formulations and their applicability. J. Fluid Mech. 2010, 661, 482–510. [Google Scholar] [CrossRef] [Scilit]
  13. Ganser, G.H. A rational approach to drag prediction of spherical and nonspherical particles. Powder Technol. 1993, 77, 143–152. [Google Scholar] [CrossRef] [Scilit]
  14. Ai, W.; Fletcher, T.H. Computational analysis of conjugate heat transfer and particulate deposition on a high pressure turbine vane. J. Turbomach. 2011, 134, 041020. [Google Scholar] [CrossRef] [Scilit]
  15. Favier, J.F.; Abbaspour Fard, M.H.; Kremmer, M.; Raji, A.O. Shape representation of axi-symmetrical, non-spherical particles in discrete element simulation using multi-element model particles. Eng. Comput. 1999, 16, 467–480. [Google Scholar] [CrossRef] [Scilit]
  16. Van Oss, C.J. Long-range and short-range mechanisms of hydrophobic attraction and hydrophilic repulsion in specific and aspecific interactions. J. Mol. Recognit. 2003, 16, 177–190. [Google Scholar] [CrossRef] [Scilit]
  17. Harimawan, A.; Rajasekar, A.; Ting, Y. Bacteria attachment to surfaces—AFM force spectroscopy and physicochemical analyses. J. Colloid Interface Sci. 2011, 364, 213–218. [Google Scholar] [CrossRef] [Scilit]
  18. Shao, W.; Zhao, Q. Effect of corrosion rate and surface energy of silver coatings on bacterial adhesion. Colloids Surfaces B Biointerfaces 2010, 76, 98–103. [Google Scholar] [CrossRef] [Scilit]
  19. Mindlin, R.D.; Deresiewicz, H. Elastic spheres in contact under varying oblique forces. J. Appl. Mech. 1953, 20, 327–344. [Google Scholar] [CrossRef] [Scilit]
  20. Hoek, E.M.V.; Agarwal, G.K. Extended DLVO Interactions between Spherical Particles and Rough Surfaces. J. Colloid Interface Sci. 2006, 298, 50–58. [Google Scholar] [CrossRef] [Scilit] [PubMed]
  21. Chattopadhyay, S.; Moldovan, R.; Yeung, C.; Wu, X.L. Swimming efficiency of bacterium Escherichia coli. Proc. Natl. Acad. Sci. USA 2006, 103, 13712–13717. [Google Scholar] [CrossRef] [Scilit]
  22. Xia, Y.; Jayathilake, P.G.; Li, B.; Zuliani, P.; Deehan, D.; Longyear, J.; Stoodley, P.; Chen, J. Coupled CFD-DEM Modeling to Predict How EPS Affects Bacterial Biofilm Deformation, Recovery and Detachment under Flow Conditions. Biotechnol. Bioeng. 2022, 119, 2551–2563. [Google Scholar] [CrossRef] [Scilit] [PubMed]
  23. Vadillo-Rodriguez, V.; Dutcher, J.R. Dynamic viscoelastic behavior of individual Gram-negative bacterial cells. Soft Matter 2009, 5, 5012–5019. [Google Scholar] [CrossRef] [Scilit]
  24. Jaiswal, A.; Bui, M.D.; Rutschmann, P. Evaluation of RANS-DEM and LES-DEM Methods in OpenFOAM for Simulation of Particle-Laden Turbulent Flows. Fluids 2022, 7, 337. [Google Scholar] [CrossRef] [Scilit]
  25. Greiner, M.; Chen, R.-F.; Wirtz, R.A. Heat Transfer Augmentation Through Wall-Shape-Induced Flow Destabilization. J. Heat Transf. 1990, 112, 336–341. [Google Scholar] [CrossRef] [Scilit]
Figure 1. Schematic of the bacteria–wall XDLVO potential energy curve.
Coatings 16 00321 g001
Figure 2. (a) General view of the flow channel. (b) Grooves with different cross-sectional shapes. (c) General view of the mesh model. (d) Magnified view of the mesh at the groove. (e) Schematic of rod-shaped bacteria modeled using the multi-sphere method.
Coatings 16 00321 g002
Figure 3. Velocity contour plots for grooves with quadrilateral (a), triangular (b), and semicircular (c) cross-sections at an inlet flow velocity of 1 m/s.
Coatings 16 00321 g003
Figure 4. Local streamline plots for grooves with quadrilateral (a), triangular (b), and semicircular (c) cross-sections at an inlet flow velocity of 1 m/s.
Coatings 16 00321 g004
Figure 5. Local pressure coefficient contour diagrams of quadrilateral (a), triangular (b), and semicircular (c) grooves at a flow velocity of 1 m/s.
Coatings 16 00321 g005
Figure 6. Local velocity contour plots for the triangular groove at flow velocities of 1 m/s (a), 2 m/s (b), and 3 m/s (c).
Coatings 16 00321 g006
Figure 7. Local pressure coefficient contour plots for the triangular groove at flow velocities of 1 m/s (a), 2 m/s (b), and 3 m/s (c).
Coatings 16 00321 g007
Figure 8. Relationship between bacterial adhesion quantity and groove shape under different flow velocities.
Coatings 16 00321 g008
Figure 9. A schematic diagram mapping the four distinct adhesion zones of the groove.
Coatings 16 00321 g009
Figure 10. Lagrangian trajectories of typical bacterial particles in quadrilateral (a), triangular (b), and semicircular (c) grooves at a flow velocity of 1 m/s.
Coatings 16 00321 g010
Figure 11. Adhesion proportion at four discrete positions of different groove types (quadrilateral (a), triangular (b), semicircular (c)) across varying flow velocities.
Coatings 16 00321 g011
Table 1. Surface energy data of Pseudomonas aeruginosa, water, and PTFE [17,20].
Material γ LW γ + γ
Pseudomonas aeruginosa29.841.1623.8
Water21.825.525.5
PTFE18.060.290.38
Table 2. Orders of magnitude and primary functions of the forces acting on P. aeruginosa.
Force TypeMagnitude (N)Primary Physical Role
XDLVO Attraction 10 9 Irreversible capture and adhesion
Fluid Drag Force 10 11 10 10 Macroscopic transport and trajectory
XDLVO Repulsion 10 11 10 10 Hindrance to surface contact
Pressure Gradient Force 10 12 Minor contribution
Propulsion Force 10 13 Active motility in low-velocity zones
Saffman Lift Force 10 13 Near-wall collision modification
Brownian Force< 10 14 Negligible
Table 3. Mesh Independence Verification.
Number of GridsOutlet Velocity (m/s)Velocity Difference
143,4941.9690.63%
236,9201.9760.34%
738,6001.9820.30%
Table 4. Mesh Independence Verification with Shear Stress Analysis.
Number of GridsPeak WSS (Pa)Peak Diff. (%)Avg. WSS (Pa)Avg. Diff. (%)
143,494582.4211.57186.5712.17
236,920652.110.99211.770.31
738,600658.630.00212.420.00
Table 5. Material Parameters.
MaterialPoisson’s RatioShear Modulus (MPa)Density ( kg · m 3 )
Bacteria0.51.331000
Wall0.4 1.9 × 10 11 2.10 × 10 3
Table 6. Contact Parameters.
Contact TypeRestitution CoefficientStatic Friction CoefficientRolling Friction Coefficient
Bacteria-Bacteria0.40.20.01
Bacteria-Wall0.30.050.01
Table 7. Pressure coefficient extremes.
ShapeLow- C p Zone 1Low- C p Zone 2High- C p Zone
Quadrilateral4.324.076.00
Triangular4.484.165.44
Semicircular4.324.075.92
Disclaimer/Publisher’s Note: The statements, opinions and data contained in all publications are solely those of the individual author(s) and contributor(s) and not of MDPI and/or the editor(s). MDPI and/or the editor(s) disclaim responsibility for any injury to people or property resulting from any ideas, methods, instructions or products referred to in the content.