Article

Electron Beam Remelting for Enhancing Thermally Sprayed Coatings: A Case Study on Self-Fluxing NiCrBSi Powders with Tungsten Carbide

by
Piotr Śliwiński
1,2,*,
Mateusz Kopyściański
3,
Andrzej N. Wieczorek
2,*,
Paweł Pogorzelski
1,
Wojciech Szymański
4 and
Krzysztof Szymański
5
1
Welding Centre, Łukasiewicz Research Network—Upper Silesian Institute of Technology, 16-18 Błogosławionego Czesława Street, 44-100 Gliwice, Poland
2
Faculty of Mining, Safety Engineering and Industrial Automation, Silesian University of Technology, 2 Akademicka Street, 44-100 Gliwice, Poland
3
Faculty of Metal Engineering and Industrial Computer Science, AGH University of Science and Technology, 66 Czarnowiejska Street, 30-059 Kraków, Poland
4
Centrum Mechaniki i Inżynierii Powierzchni Ltd. (Translation: Center for Mechanics and Surface Engineering Ltd.), 24 Biskupa Stanisława Adamskiego Street, 41-407 Imielin, Poland
5
Faculty of Materials Engineering, Silesian University of Technology, 8 Krasińskiego Street, 40-019 Katowice, Poland
*
Authors to whom correspondence should be addressed.
Coatings 2026, 16(2), 175; https://doi.org/10.3390/coatings16020175
Submission received: 29 December 2025 / Revised: 23 January 2026 / Accepted: 27 January 2026 / Published: 30 January 2026
(This article belongs to the Special Issue Advanced Coatings for Alloy Protection and Performance Enhancement)

Abstract

Thermally sprayed, self-fluxing NiCrBSi-based coatings, subsequently flame-remelted, exhibit notable abrasion and corrosion resistance. While flame remelting facilitates the formation of a homogeneous, pore-free microstructure and promotes adhesion to the substrate, it suffers from low processing efficiency and introduces considerable thermal loads into the material. In contrast, electron beam remelting (EBR) offers enhanced efficiency, reduced heat input, and the potential to achieve metallurgical bonding with the substrate. This study investigates the influence of EBR parameters on the microstructure, hardness, and elemental distribution of NiCrBSi-based coatings. Four powder compositions—with and without tungsten or tungsten carbide (WC) additives—were deposited via thermal spraying and subjected to EBR. The resulting coatings were analyzed using light and scanning electron microscopy (SEM), energy-dispersive X-ray spectroscopy (EDS), and Vickers microhardness testing. The optimized EBR process yielded dense, crack- and pore-free coatings with uniform elemental distribution and effective metallurgical bonding. Maximum matrix hardness values up to 881 HV0.1 were achieved, confirming the efficacy of EBR in enhancing the structural and mechanical integrity of thermally sprayed NiCrBSi coatings. It was also found that the addition of different reinforcement phases to the NiCrBSi matrix can significantly affect the overall microstructure and properties of the matrix itself.

1. Introduction

Self-fluxing coatings based on Ni-Cr-B-Si matrix with tungsten carbide additives produced by thermal spraying and flame remelting have been used in industry for many years. These coatings are characterized by good abrasion resistance and corrosion resistance. The incorporation of boron and silicon into self-fluxing alloys effectively reduces their melting temperature, thereby enhancing their suitability for remelting applications. The most widely recognized post-treatment techniques include flame, furnace, laser, and induction remelting. Flame remelting provides a homogeneous and pore-free structure and ensures an adhesive bond with the substrate. However, this method has low efficiency and results in the introduction of a relatively large amount of heat into the material, creating an HAZ. Additionally, furnace or flame remelting has limited process control, poor repeatability, and the potential for exposure to an uncontrolled atmosphere, which can render them unsuitable for specific applications. Remelting of thermally sprayed coatings using laser or electron beams can further improve the coating properties, which is reflected in the literature [1].
Szymanski K. et al. [2] investigated NiCrSiB powder coatings applied via flame and detonation spraying, followed by remelting using a flame torch or a CO2 laser. Coating properties, including microstructure, hardness, and porosity, were analyzed. The flame-sprayed coating exhibited the highest thickness and porosity (>4%), while both flame and laser remelting significantly reduced porosity to ~0.5%. The laser remelted coating’s hardness was higher by 11.8% compared to flame remelting. Another Polish team of E. Szajna et al. [3] also investigated LBR of NiCrBSi thermally sprayed coatings, also with tungsten carbide addition. The influence of thermal diffusivity on the dilution effect, HAZ size, and hardness evolution during laser remelting was analyzed. Although the coating materials exhibit similar thermal diffusivity values, significant differences in HAZ size and dilution were observed. This indicates that thermal diffusivity, particularly when considered alongside specific heat variations due to differing tungsten carbide fractions, plays a crucial role in microstructural evolution during the laser remelting of flame-sprayed NiCrBSi coatings.
Serres et al. [4,5,6,7] integrated atmospheric plasma spraying (APS) with in situ diode laser remelting to improve NiCrBSi and NiCrBSi–WC coatings. Laser remelting enhanced dendritic growth, minimized porosity without inducing solidification cracks, and improved mechanical performance. The WC particle content significantly affected hardness, elastic modulus, shear strength, and wear rate. Similarly, Chen et al. [8] developed a parameter-controlled remelting process for plasma-sprayed NiCrBSi coatings, achieving enhanced metallurgical bonding at the coating–substrate interface. The optimized process reduced porosity, eliminated lamellar defects, and increased hardness and bonding strength by 22% (803 HV0.5) and 516% (165 MPa), respectively, while markedly improving wear resistance—demonstrating industrial applicability. Also, Gonzalez et al. [9,10] examined the influence of processing parameters on NiCrBSi coatings fabricated by flame spraying combined with laser remelting and laser surfacing. Laser-remelted coatings exhibited nearly pore-free microstructures with strong substrate adhesion, whereas flame remelting sometimes caused incomplete fusion due to limited control. Both methods yielded coatings of similar hardness, slightly lower than as-sprayed layers. Comparative wear tests under varying loads (30–100 N) and speeds (0.65–2.62 m/s) revealed comparable tribological fatigue resistance and wear rates. SEM analysis, however, indicated distinct differences in morphology, particle size distribution, and phase proportions despite similar constituent phases.
Recent studies have extended remelting research beyond iron-based alloys to include diverse coating materials and hybrid processes. Yan et al. [11] enhanced the corrosion and wear resistance of NiCrBSi coatings using Plasma Transferred Arc Welding (PTAW) followed by microplasma remelting, achieving improved surface integrity and abrasion resistance. Other works similarly demonstrated the effectiveness of a hybrid spraying–remelting process [12,13].
Electron beam remelting (EBR) has been widely investigated for thermally sprayed layers, but only a few of the publications concern the remelting of thermally sprayed NiCrBSi layers with carbides, which proves the innovative nature of this article. Hamatani and Miyazaki [14] applied EBR to HVOF-sprayed Stellite 6, Ni, and WC–Co coatings, achieving substantial porosity reduction and bond strength improvement (from 270 MPa up to ~350 MPa). Utu et al. [15] reported similar microstructural refinement and corrosion enhancement in EBR-treated Co–Ni–Cr–Al–Y coatings. Gavendová et al. [16] and Pogrebnjak et al. [17] confirmed that EBR homogenizes microstructures, lowers porosity, and enhances hardness and adhesion across various CoNiCrAlY and PGAN-33 coatings.
Further research by Marginean and Utu et al. [18,19,20] demonstrated that EBR of HVOF-sprayed MCrAlY and WC–Co–Cr coatings on Inconel alloys produced dense, oxide-free layers with refined γ–Ni/γ′–AlNi3 microstructures and improved oxidation and corrosion resistance (hardness up to 1100 HV0.3). Cizek et al. [21] and Krajňáková et al. [22] achieved similar results for CoNiCrAlY coatings, with optimized parameters yielding uniform, high-strength interfaces. Petrov [23] extended EBR applications to Fe–Cr–Ni–modified Al–Si alloys, reporting enhanced hardness and formation of stable intergranular phases.
Recent studies by Zhao et al. [24] and Li et al. [25] examined the influence of electron beam remelting (EBR) on Ni-based coatings containing boron and tungsten carbides. Zhao et al. [24] reported that EBR induced WC decomposition into W2C, Cr23C6, and M3B phases. With increasing beam current, the WC content decreased, and the grain size grew. The EBR resulted in enhanced corrosion and wear resistance—most notably at 16 mA, which achieved the highest hardness (1081 HV) and greatest wear reduction (81%). Li et al. [25] found that EBR eliminated surface defects, strengthened metallurgical bonding, and promoted carbide formation that improved interfacial adhesion. Increased beam current led to grain coarsening and dense dislocation structures, while microhardness reached 1060 HV at 16 mA with a transition from abrasive to mixed abrasive–adhesive wear behavior.
Different research conducted in Łukasiewicz (the Upper Silesian Institute of Technology in Gliwice, Poland [26]) studied the impact of the electron beam remelting procedure on the microstructure of a coating sprayed using atmospheric plasma spraying (APS). The 316Ti stainless steel material was coated with the Ni20%Cr + 30%Re coating under research, and the steel was subsequently remelted. The microstructure was examined using energy-dispersive spectroscopy (EDS), scanning electron microscopy (SEM), and light microscopy. In addition to a reduction in porosity and homogenization of the chemical composition, the results demonstrated an increase in the density of the remelted coatings.
A review of the literature shows that both laser and electron beam remelting processes make it possible to reduce the number of material discontinuities in the thermally sprayed layers, such as pores or cracks, and it makes it possible to homogenize the microstructure. The remelting process can improve not only homogeneity but also other physicochemical properties, e.g., increase hardness, adhesion to the substrate, wear resistance, or even corrosion resistance. Research shows that, depending on the chemical composition of the coating, it is possible to obtain phases that differ from those obtained with conventional flame remelting and thus completely differ in the functional properties of the coatings.
This paper presents an innovative approach to the production of NiCrBSi coatings by replacing flame remelting with electron beam remelting. Electron remelting, thanks to the ability to dynamically deflect the beam and the high power of the beam, makes it possible to remelt a much larger area in a single pass while maintaining uniform fusion and metallurgical bonding of the coating to the substrate. Due to the small number of studies on the remelting of Ni-based coatings, especially those with the addition of hard reinforcing phases, the presented results constitute a significant contribution to the current level of knowledge in this field. This paper thoroughly examines the influence of electron beam remelting parameters on the microstructure, chemical composition, and hardness of the coatings produced, shedding new light on this branch of wear-resistant coatings.

2. Materials and Methods

Our research program included the following experiments:
Flame spraying of the selected powders;
Electron beam remelting tests;
Light microscopy and scanning electron microscopy (SEM) microstructure analysis with energy-dispersive X-ray spectroscopy (EDS) analysis;
Hardness testing.

2.1. Material Type

Four different powders were used for the study. Samples sprayed with P1 powder are the reference material for all other samples. Powders P1 and P2 are commercial Oerlikon Metco Inc. (Westbury, NY, USA) powders, while powders P3 and P4 are powders made at the Center for Mechanics and Surface Engineering Ltd., based on powder P1. In powder P3, there is an addition of Fused Tungsten Carbide (FTC) containing WC/W2C phases. In powder P4, pure tungsten was added.
Table 1 shows the chemical compositions of all the powders used in the tests.

2.2. Sample Preparations

All powders tested were deposited using thermal flame spraying. The substrate material was S235 grade steel. The sheets were subjected to abrasive blasting and degreasing before the spraying process. The gas pressure for oxygen was 1.2 bar, and for acetylene, it was 1.0 bar. The gas flow was 70 and 73 L/min for oxygen and acetylene, respectively.

2.3. Experimental Setup

The specimens were remelted at the Lukasiewicz Research Network—Upper Silesian Institute of Technology—using an electron beam welding machine from Cambridge Vacuum Engineering (Cambridge, UK), model XW150:30, having a directly heated tungsten cathode filament, with a maximum accelerating voltage of 150 kV, a maximum current of 200 mA, and a working chamber measuring 1500 × 1500 × 2000 mm.
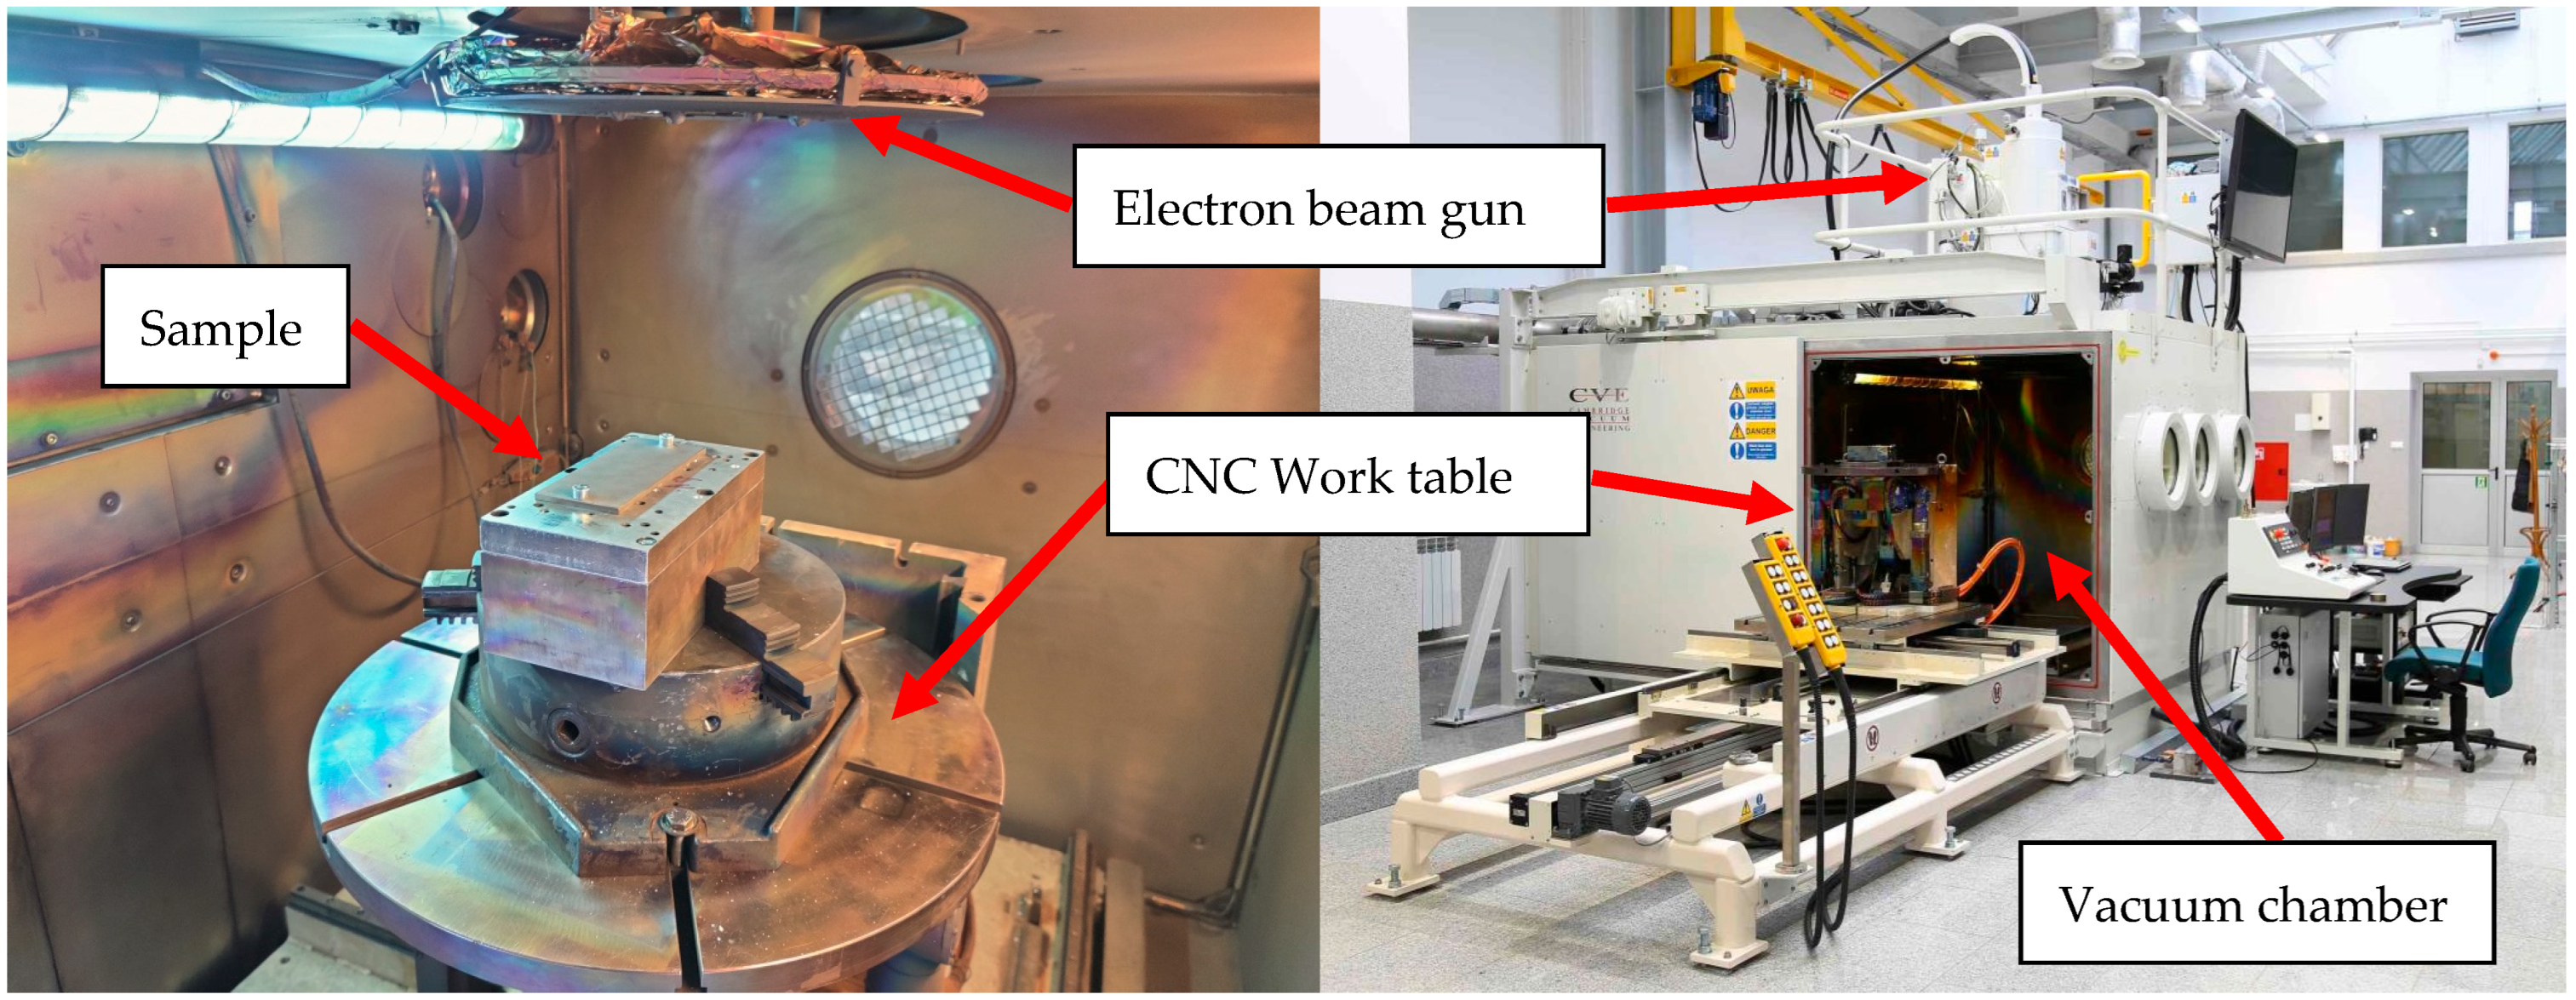
Sprayed samples with dimensions of 60 × 120 × 6 mm were mounted on the work table of an electron beam welding machine (Figure 1) and subjected to preliminary remelting tests to narrow down the optimal parameter range.
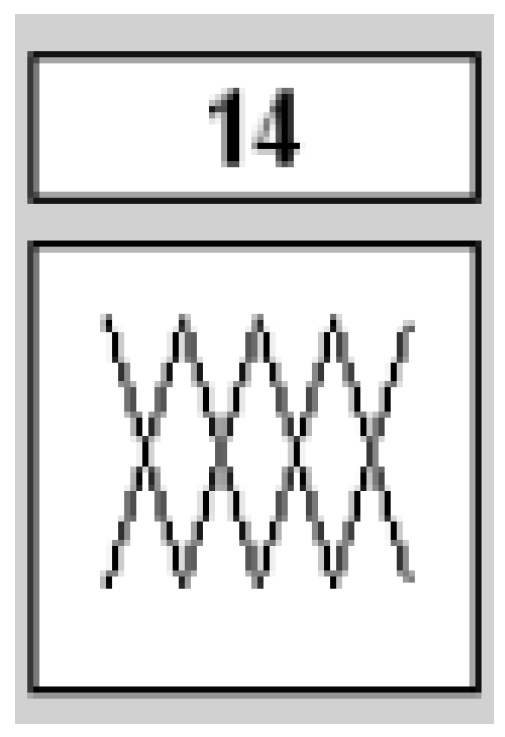
The samples were remelted using an oscillating electron beam. The initial remelting was carried out using the double broken curve pattern shown in Figure 2 deflected at a frequency of 200 Hz. The deflection amplitude was 2 mm in the direction parallel to the direction of motion and 8 mm in the direction perpendicular to the direction of motion. Melting was performed at an accelerating voltage of 60 kV, with a focus current of 470 mA (focus position on the surface of the melted material) at a working distance of 400 mm. The cathode heating current (directly heated cathode) was 22 A. The parameters that were changed were the speed of movement of the sample in the range from 75 to 2000 mm/min, the beam current, and thus the resulting beam power.
Visual observations of the remelted surfaces showed that an increase in remelting speed increases the number of material discontinuities in the form of voids and porosity. Samples remelted at speeds higher than 150 mm/min were characterized by a very irregular surface and numerous voids and the presence of porosity.
Flame-sprayed coatings are characterized by high porosity of up to 20%. Too high remelting speeds prevent effective degassing of the resulting coating, resulting in the occurrence of many inconsistencies. Remelting speeds of 75 mm/min and 150 mm/min were selected for further studies.
In the next stage of the work, remelting of the target batch to be tested (all three types of powders) was carried out using the set of parameters given in Table 2. The deflection patterns used were no. 1 (simple line), with a deflection amplitude of 8 mm in the direction perpendicular to the direction of motion, and no. 14 (Figure 2), where the deflection amplitude was 2 mm in the direction parallel to the direction of motion and 8 mm in the direction perpendicular to the direction of motion. In both cases, the deflection frequency was 200 Hz. Melting was performed at an accelerating voltage of 60 kV, with a focus current of 470 mA (focus position on the surface of the melted material) at a working distance of 400 mm. The cathode heating current (directly heated cathode) was 22 A. The parameters that were changed were the speed of movement of the sample (in the table, remelting speed) and the beam current, and thus the resulting beam power, as well as the deflection pattern.
All the samples obtained were cut, ground, and etched to obtain an image of the macroscopic cross-sectional structure of each remelted bead. The samples were then cold-mounted, ground, polished, and etched in a solution of iron (III) chloride in chloric acid and ethanol. Microscopic inspection on a scanning electron microscope, as well as EDS analysis of the examined areas, was performed on the samples thus prepared.

3. Results

3.1. Effect of Process Parameters on the Geometry of Remelted Area

The samples sprayed with P1 and P3 powder were subjected to macroscopic metallography tests for geometric evaluation. P1 powder remelted beads were subjected to measurements of the penetration depth (calculated from the surface of the substrate) and the contribution of the substrate (measurement of the area of the entire bead and the part below the level of the surface of the substrate) in order to characterize the influence of the parameters on the cross-sectional geometry of the beads and the morphology of the structure.
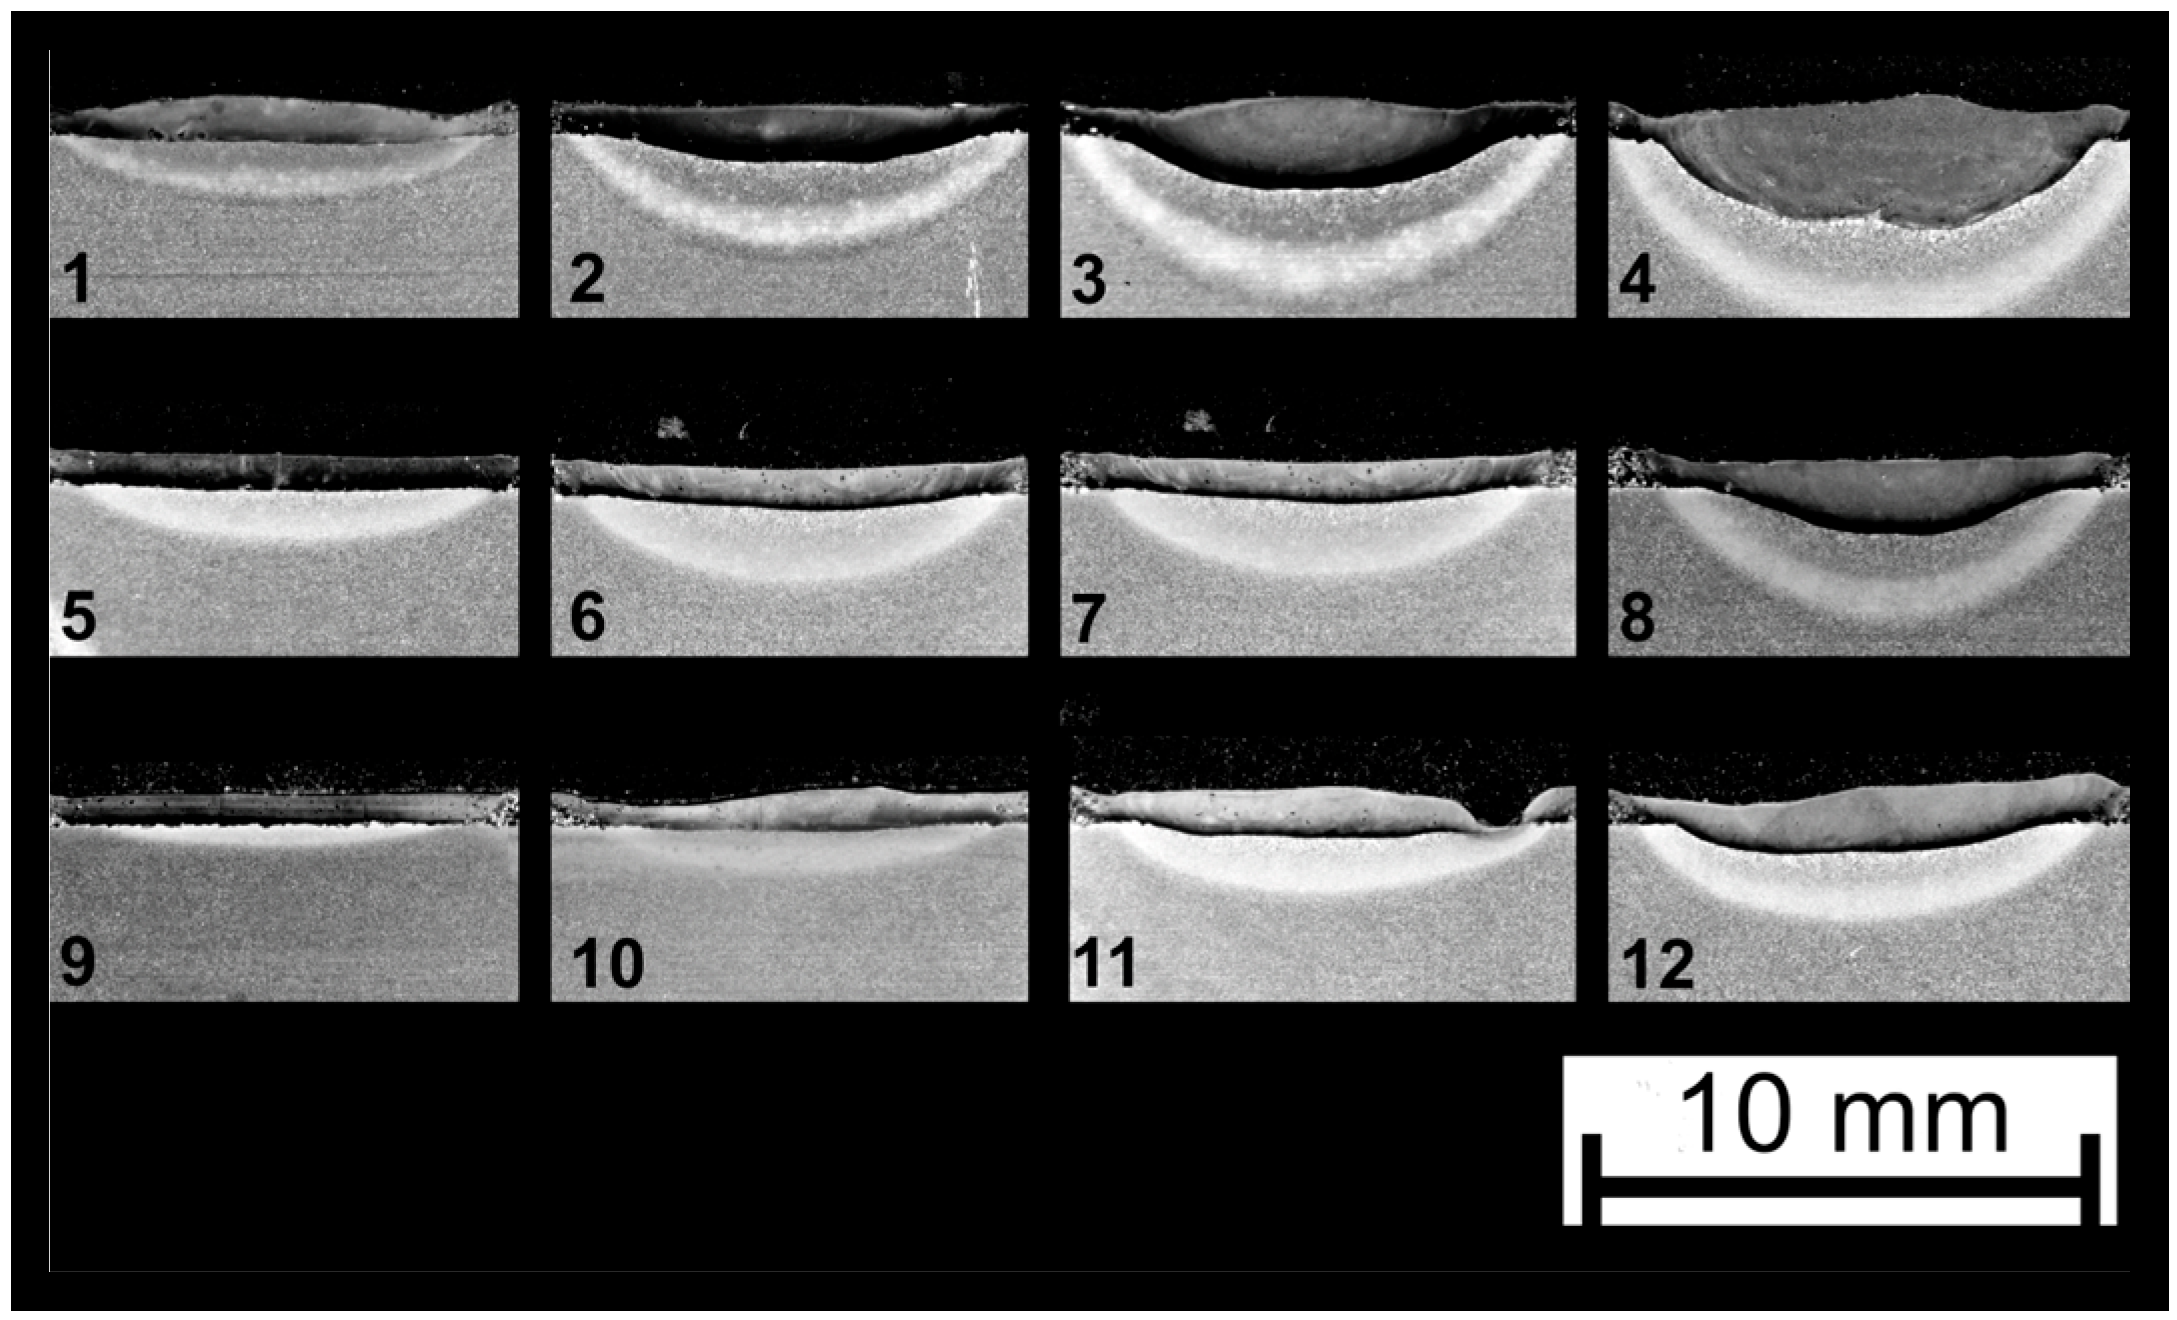
Figure 3 shows macroscopic cross-sections of all remelted beads on the example of powder P3.
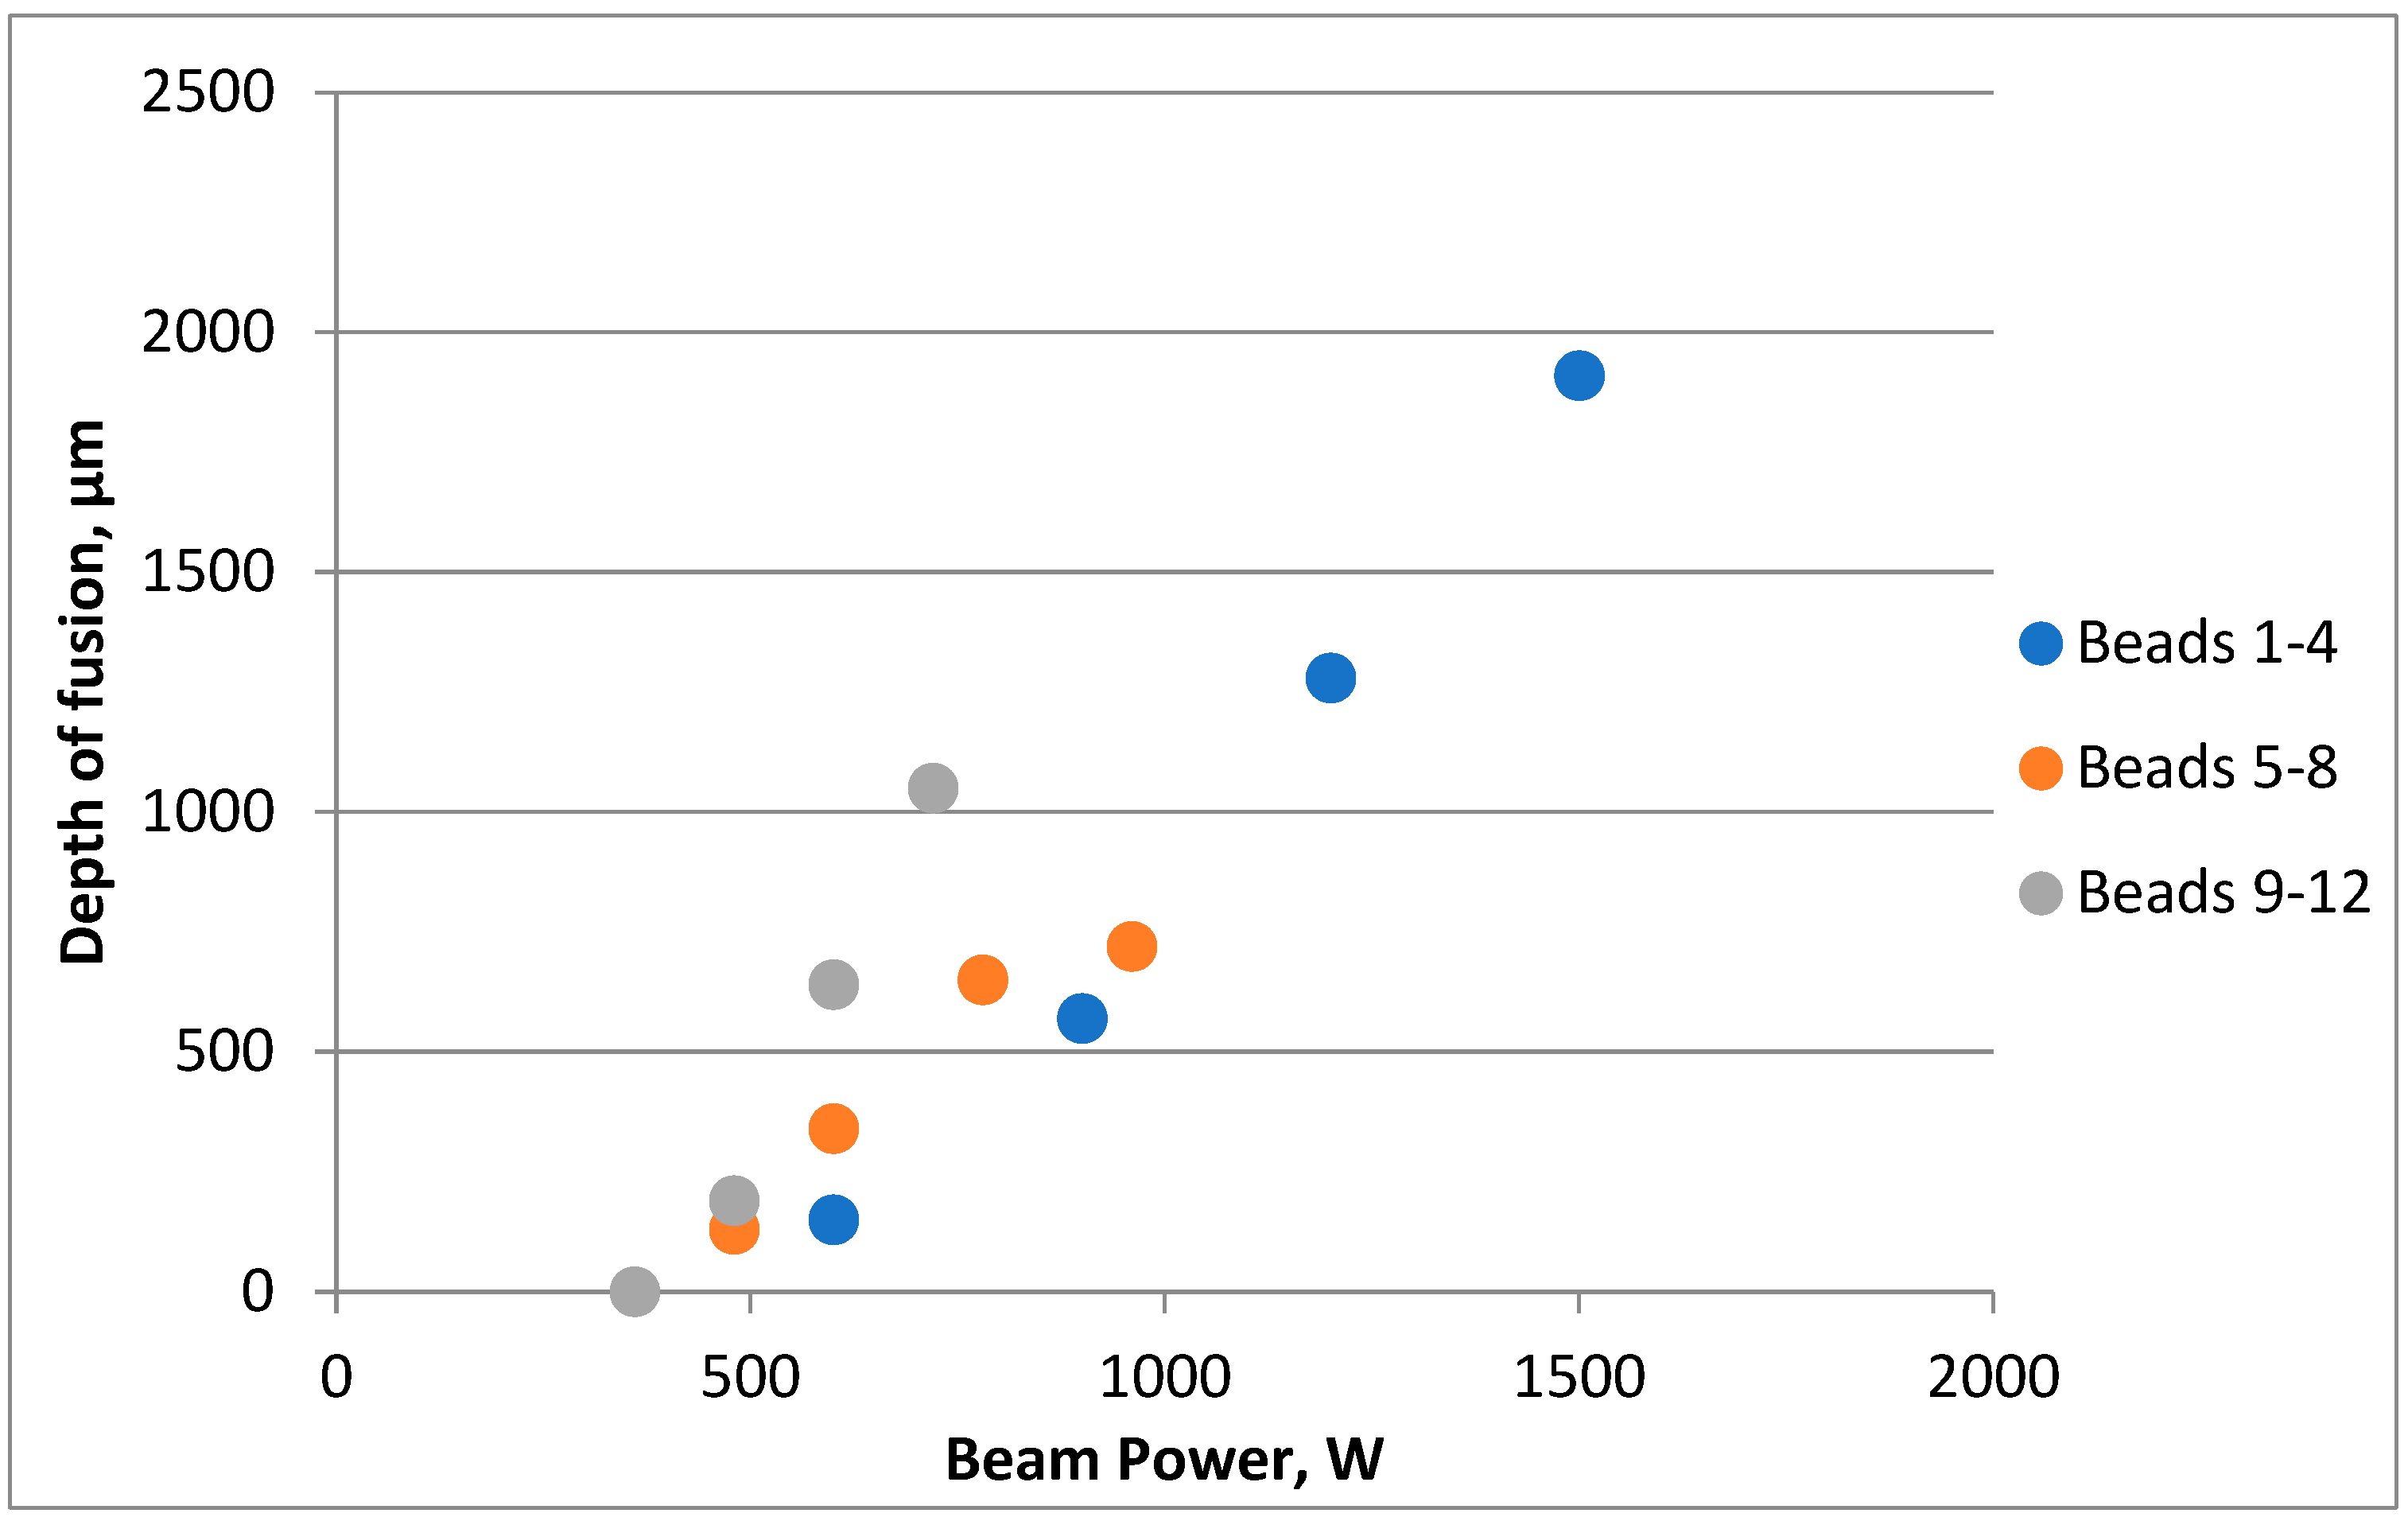
Table 3 shows the results of measuring the depth of fusion (calculated from the level of the substrate surface) and the proportion of substrate in the remelted bead (calculated as the ratio of the cross-sectional area of the area below the level of the substrate surface to the cross-sectional area of the entire remelted bead). Figure 4 shows a graph of the dependence of fusion depth on beam power for each of the three test runs.
The graph shown in Figure 4 clearly shows a linear relationship between beam power and fusion depth.

3.2. Microstructural Analysis of the Remelted Powders

Microscopic examination was carried out on a Nikon Eclipse MA200 (Nikon Europe B.V., VX Amstelveen, The Netherlands) light microscope with a Nikon DS-Fi2 digital imaging camera. The samples were etched using a solution of FeCl3 in a mixture of hydrochloric acid and ethanol.
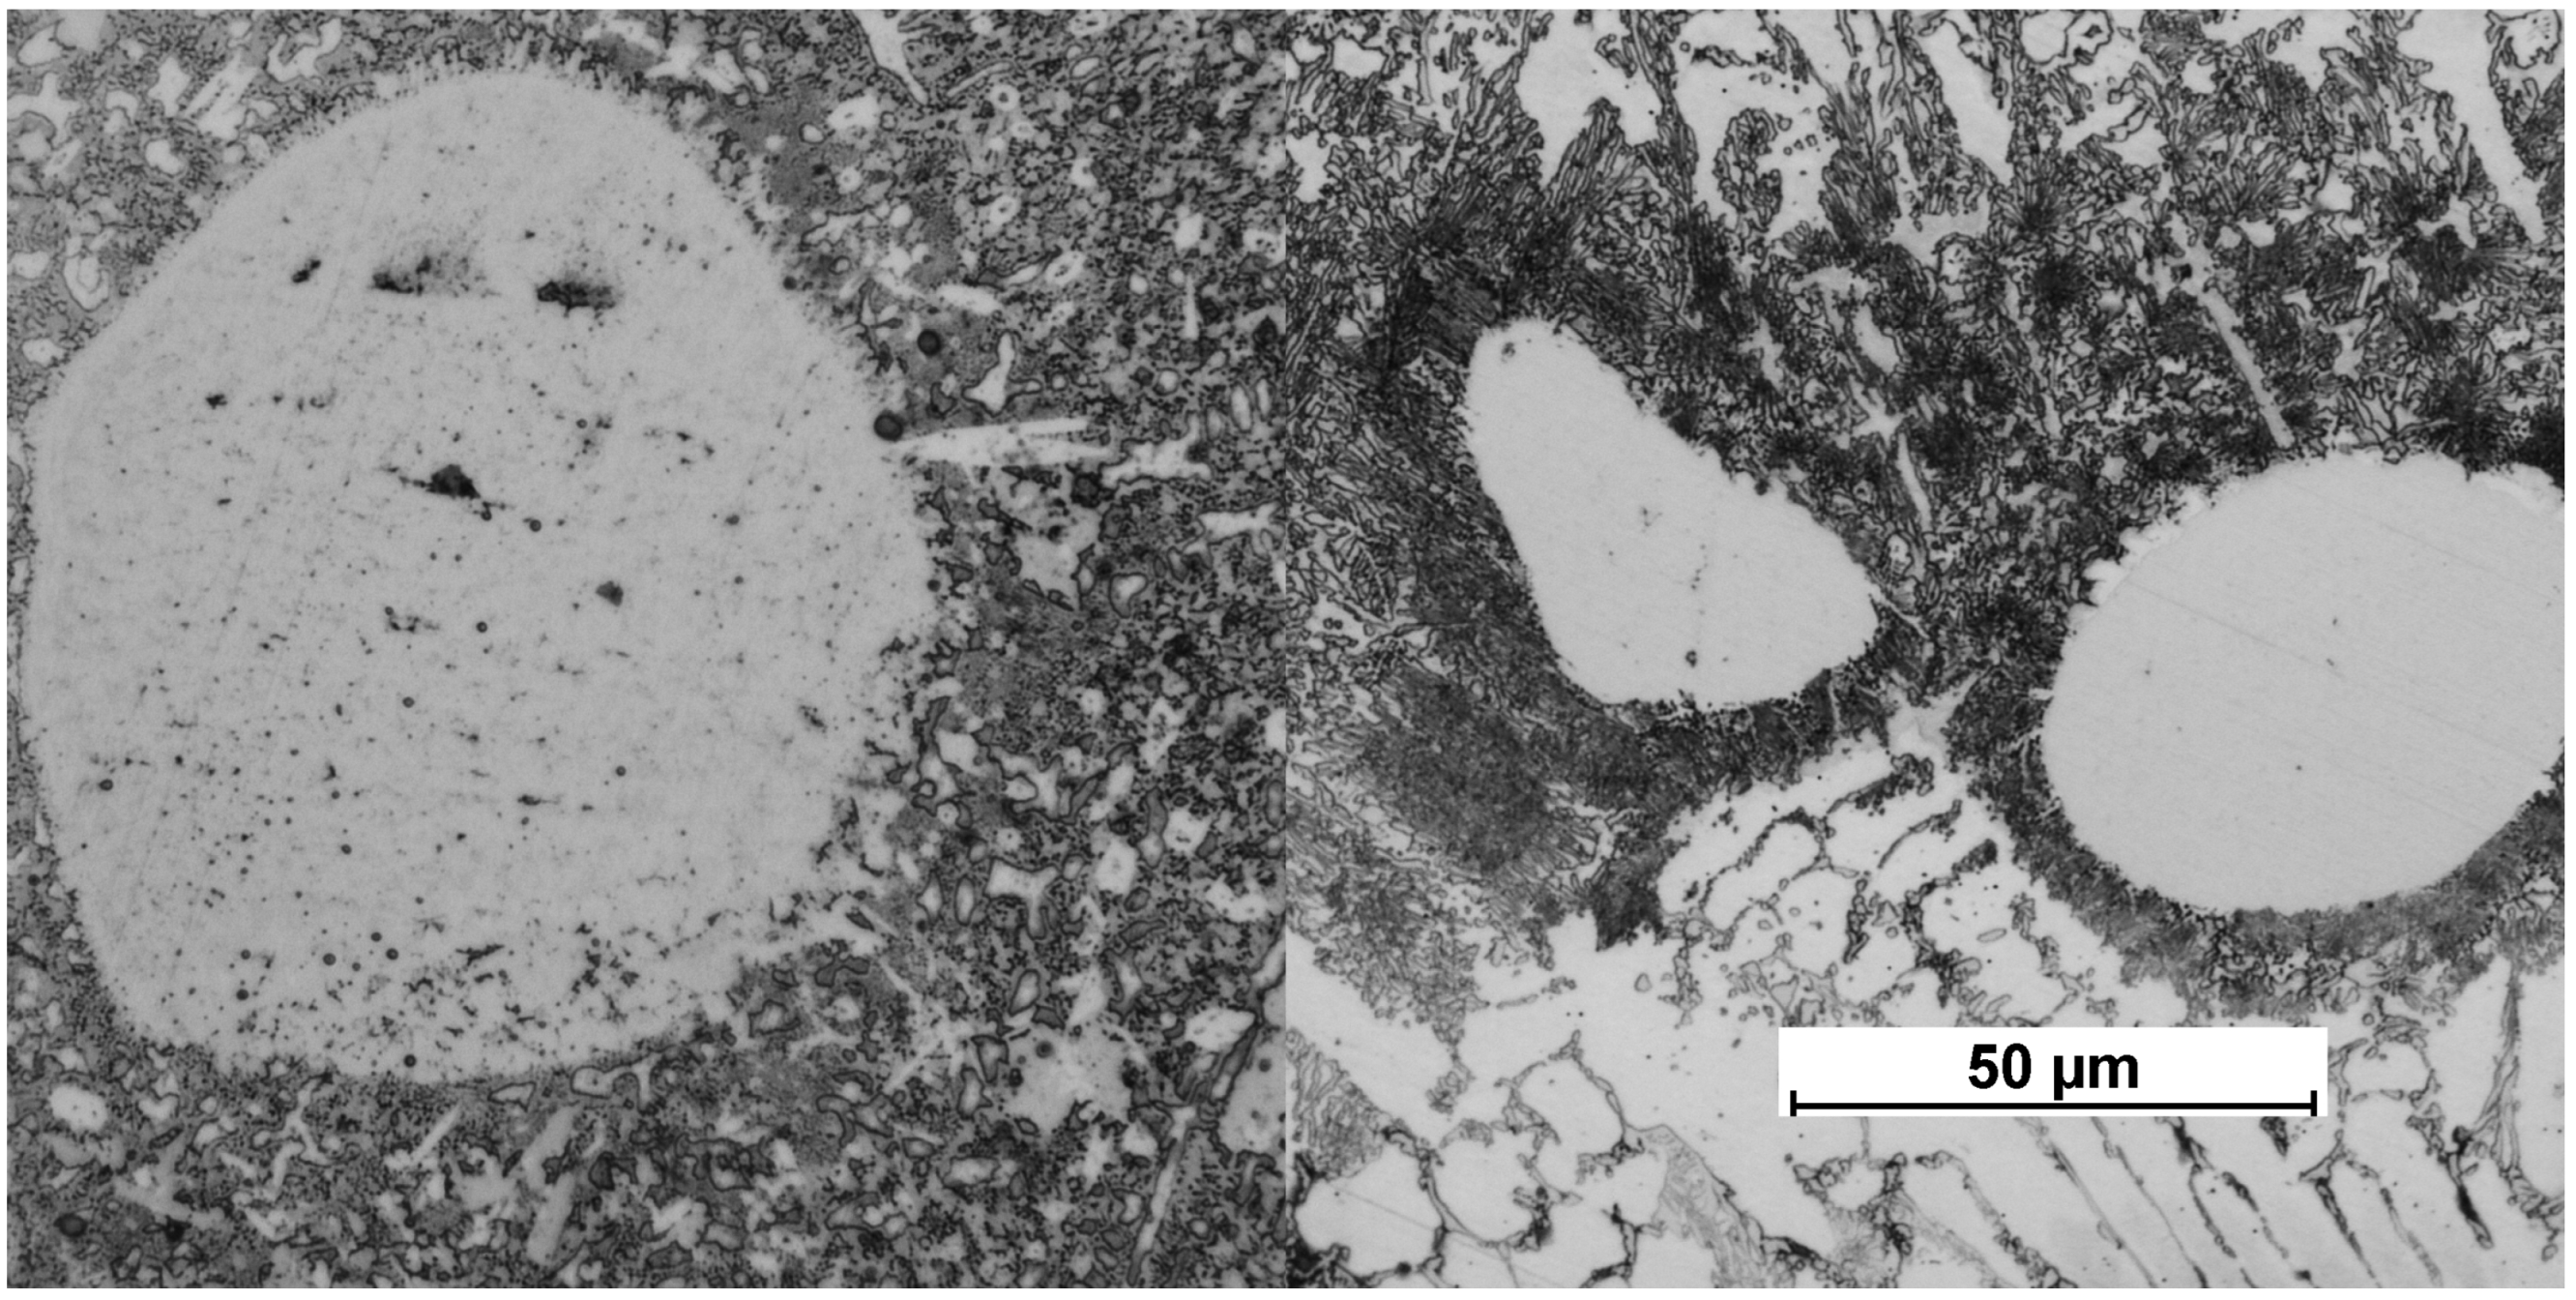
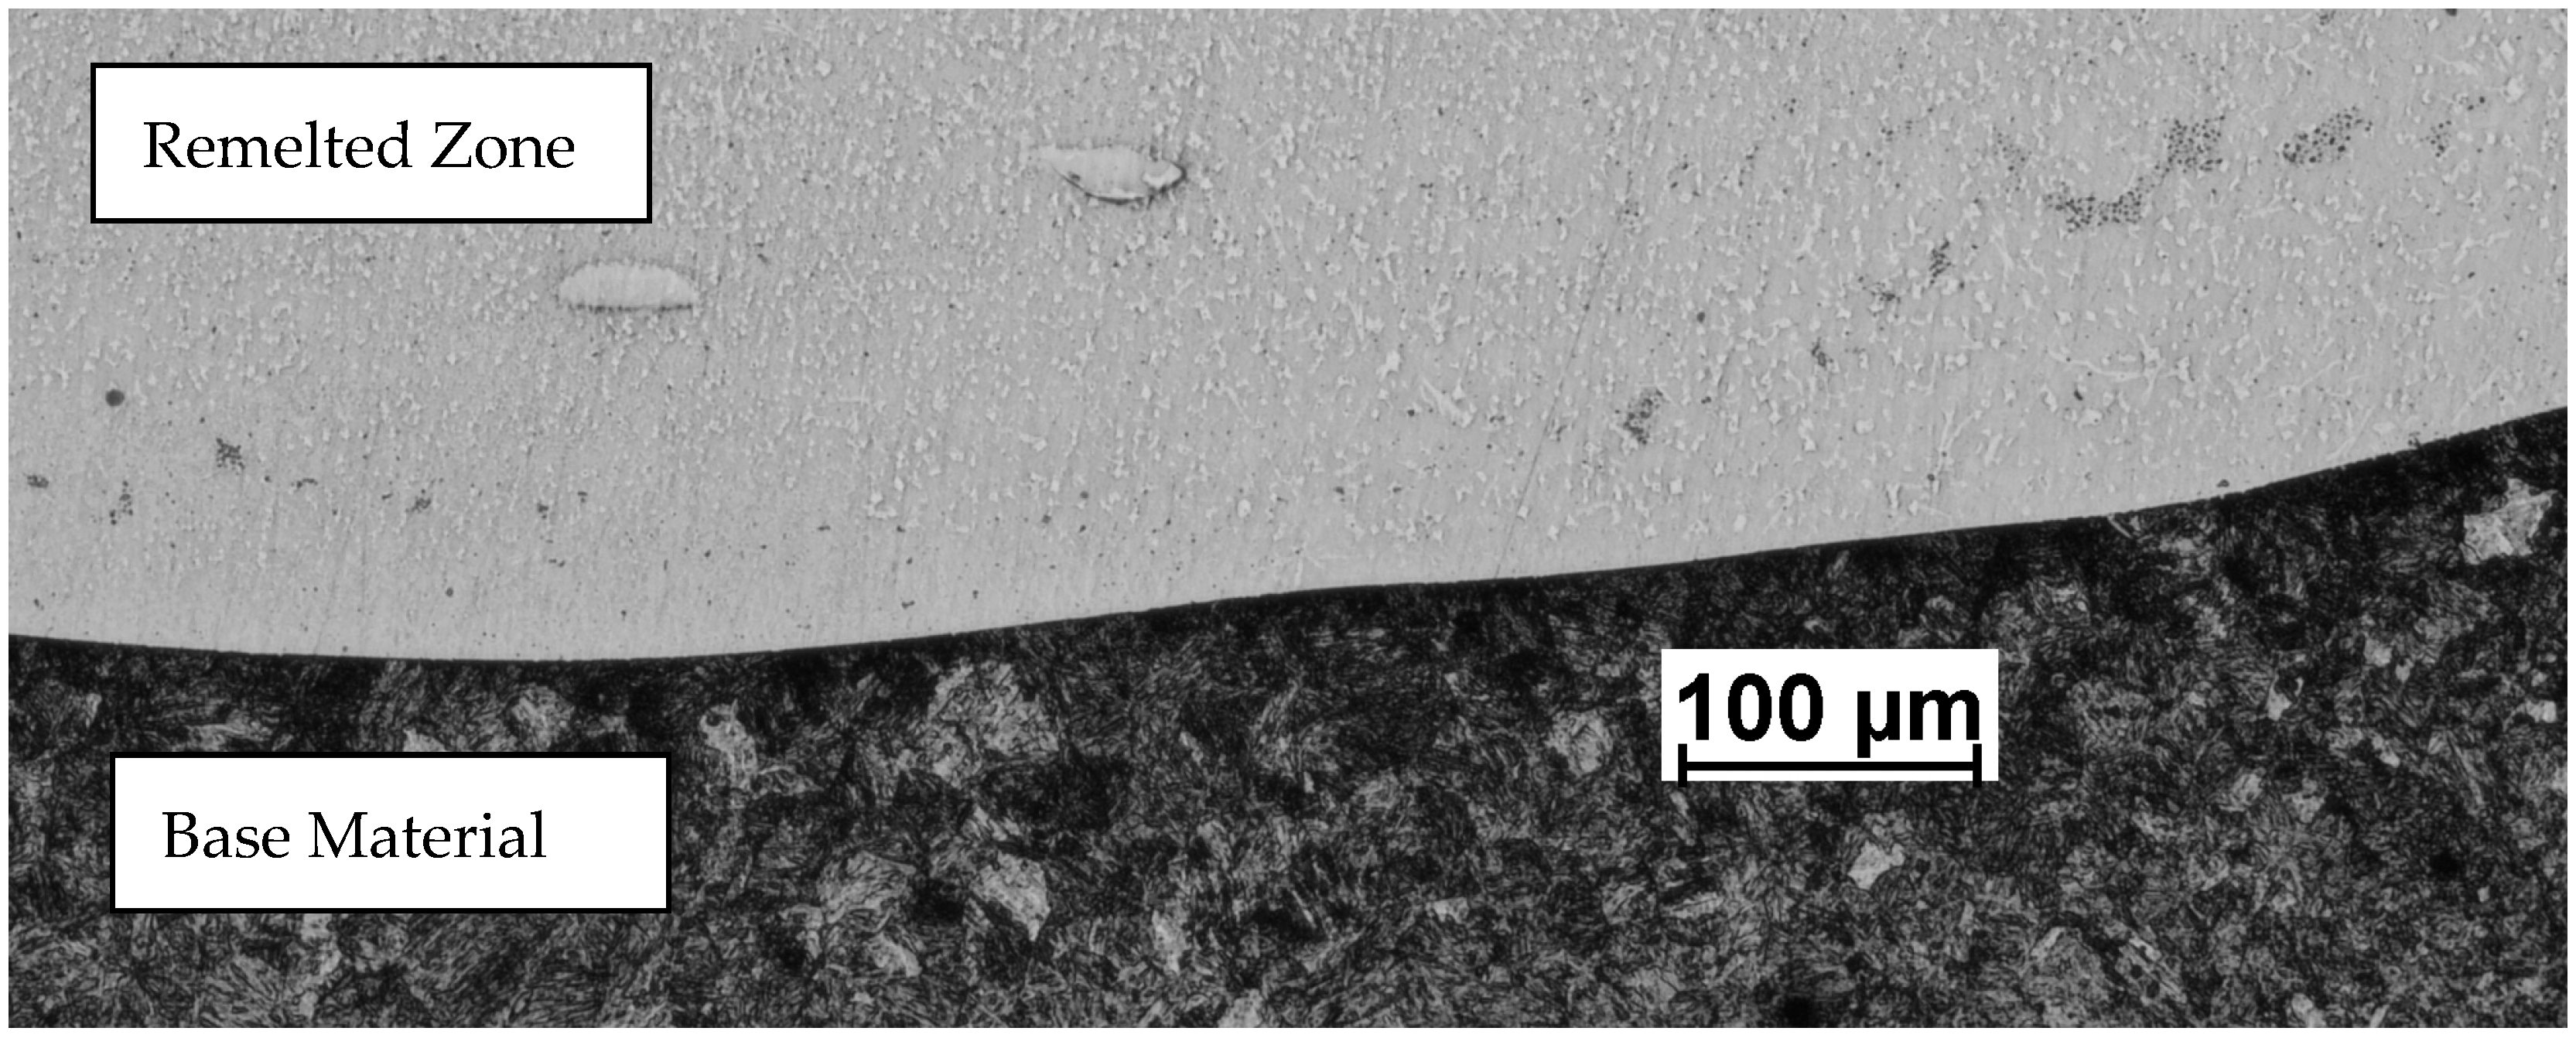
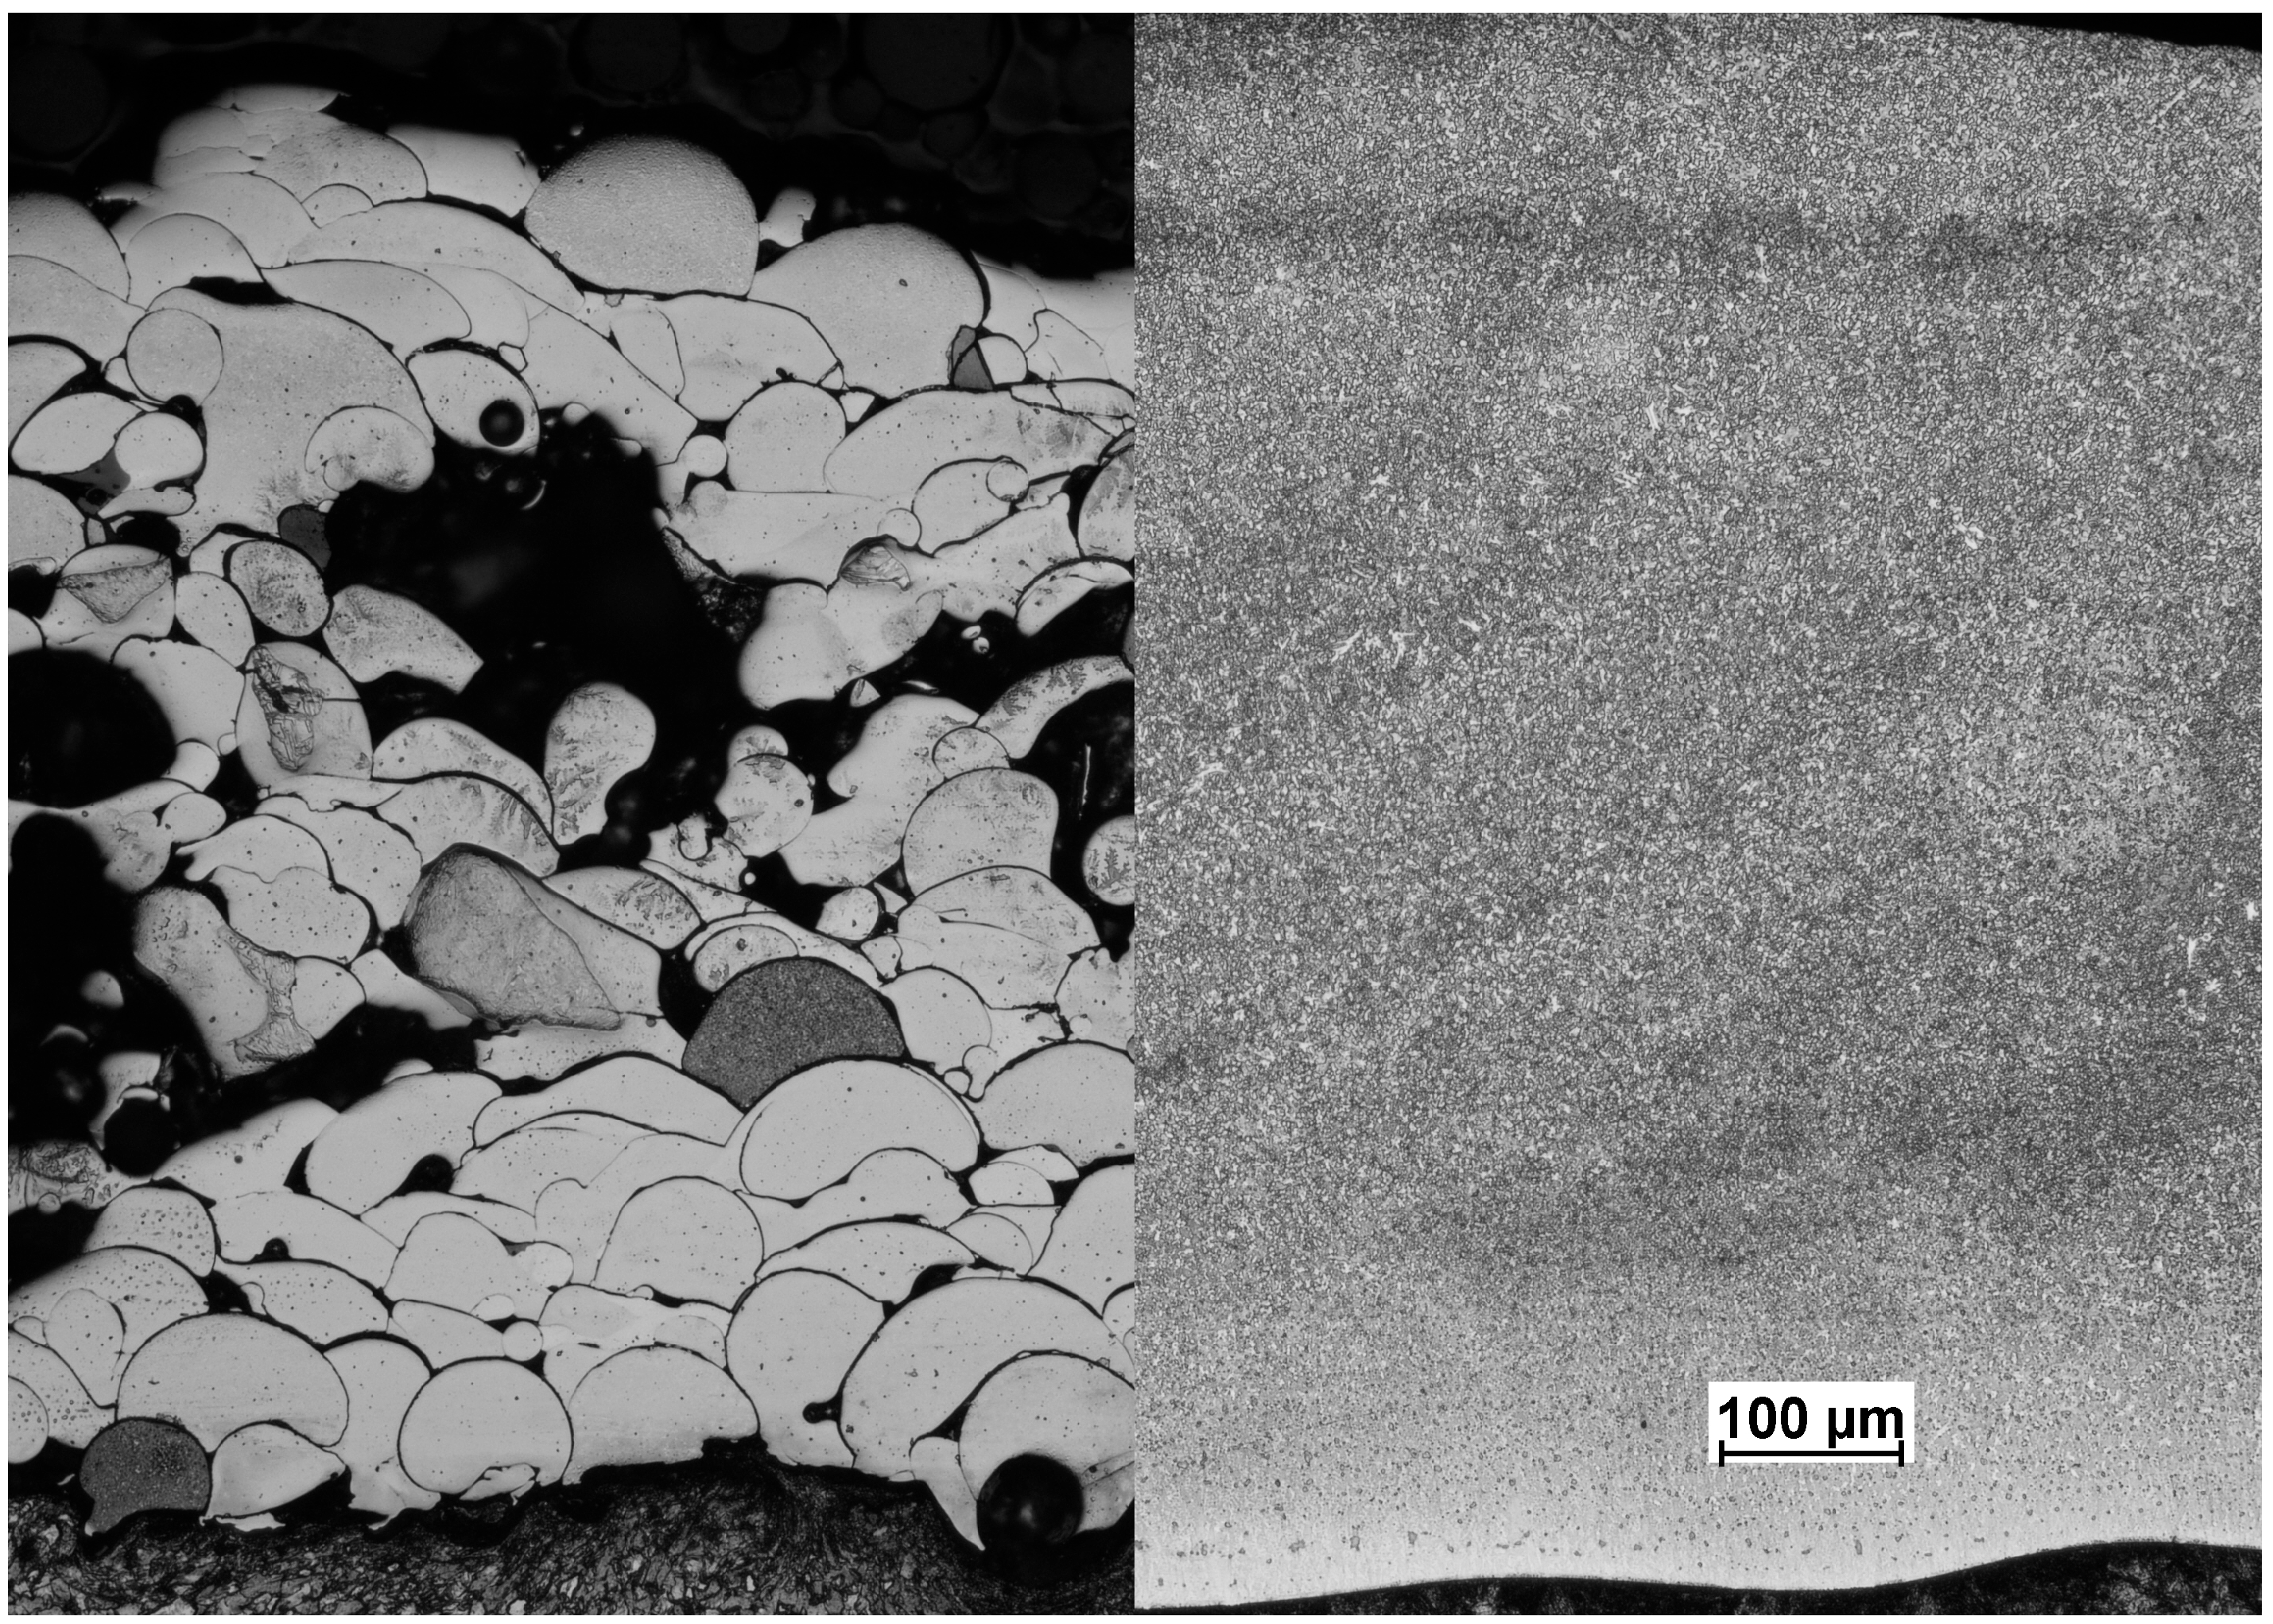
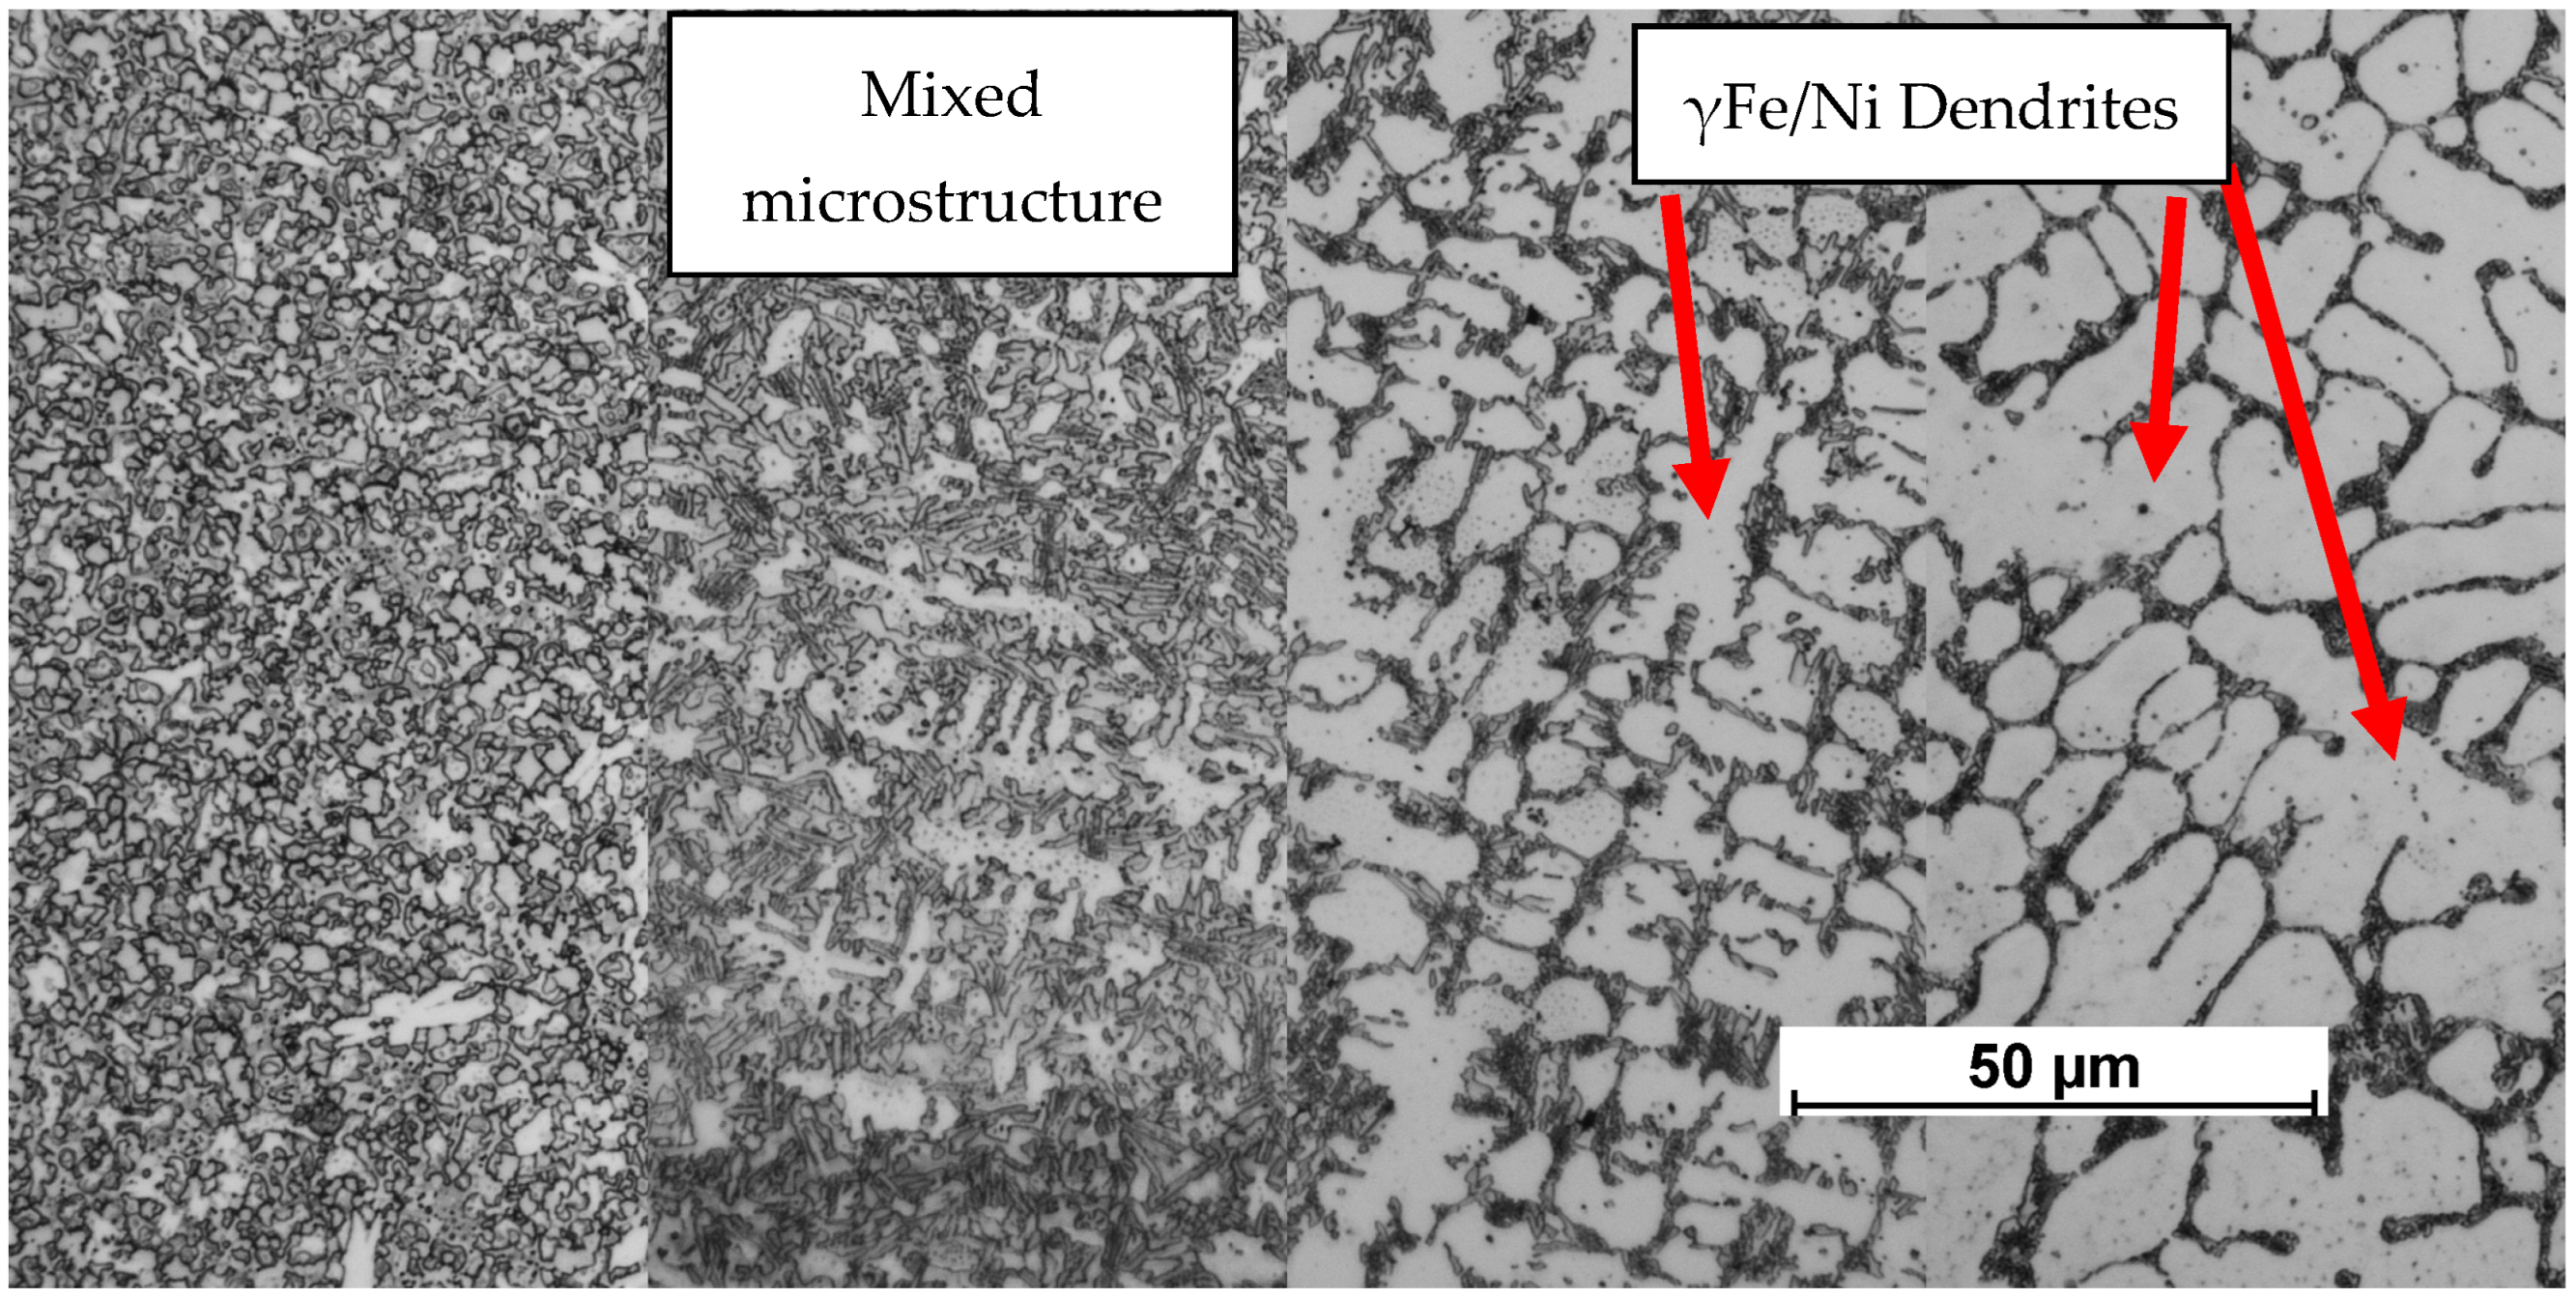
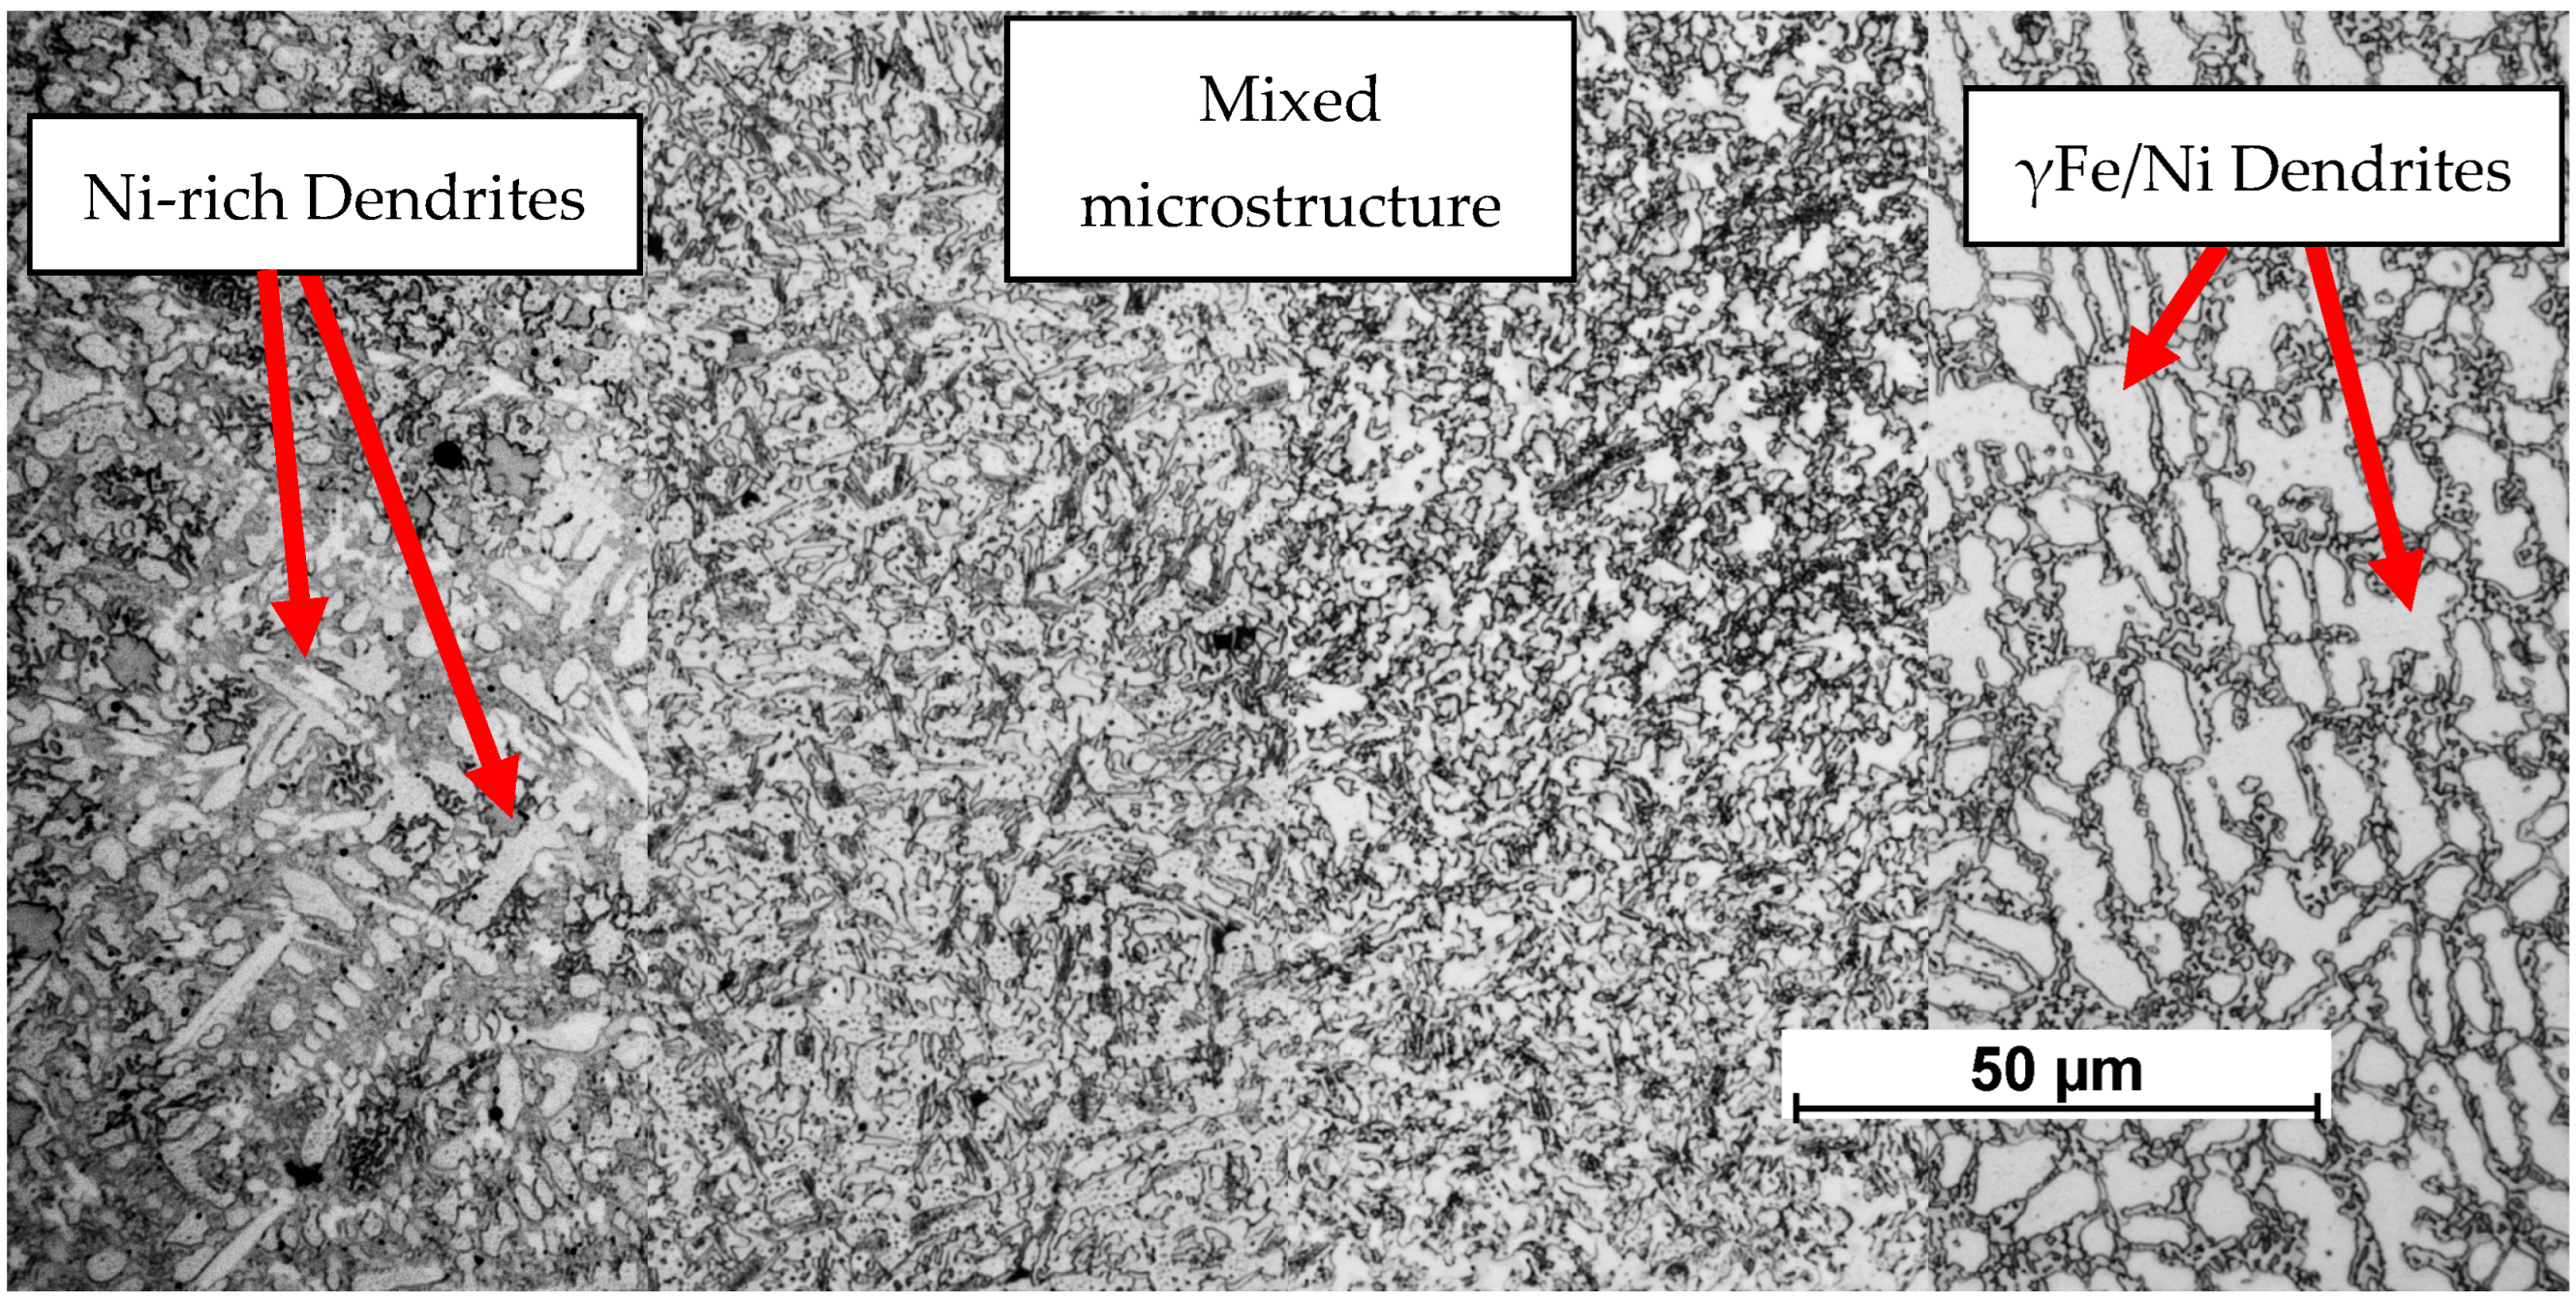
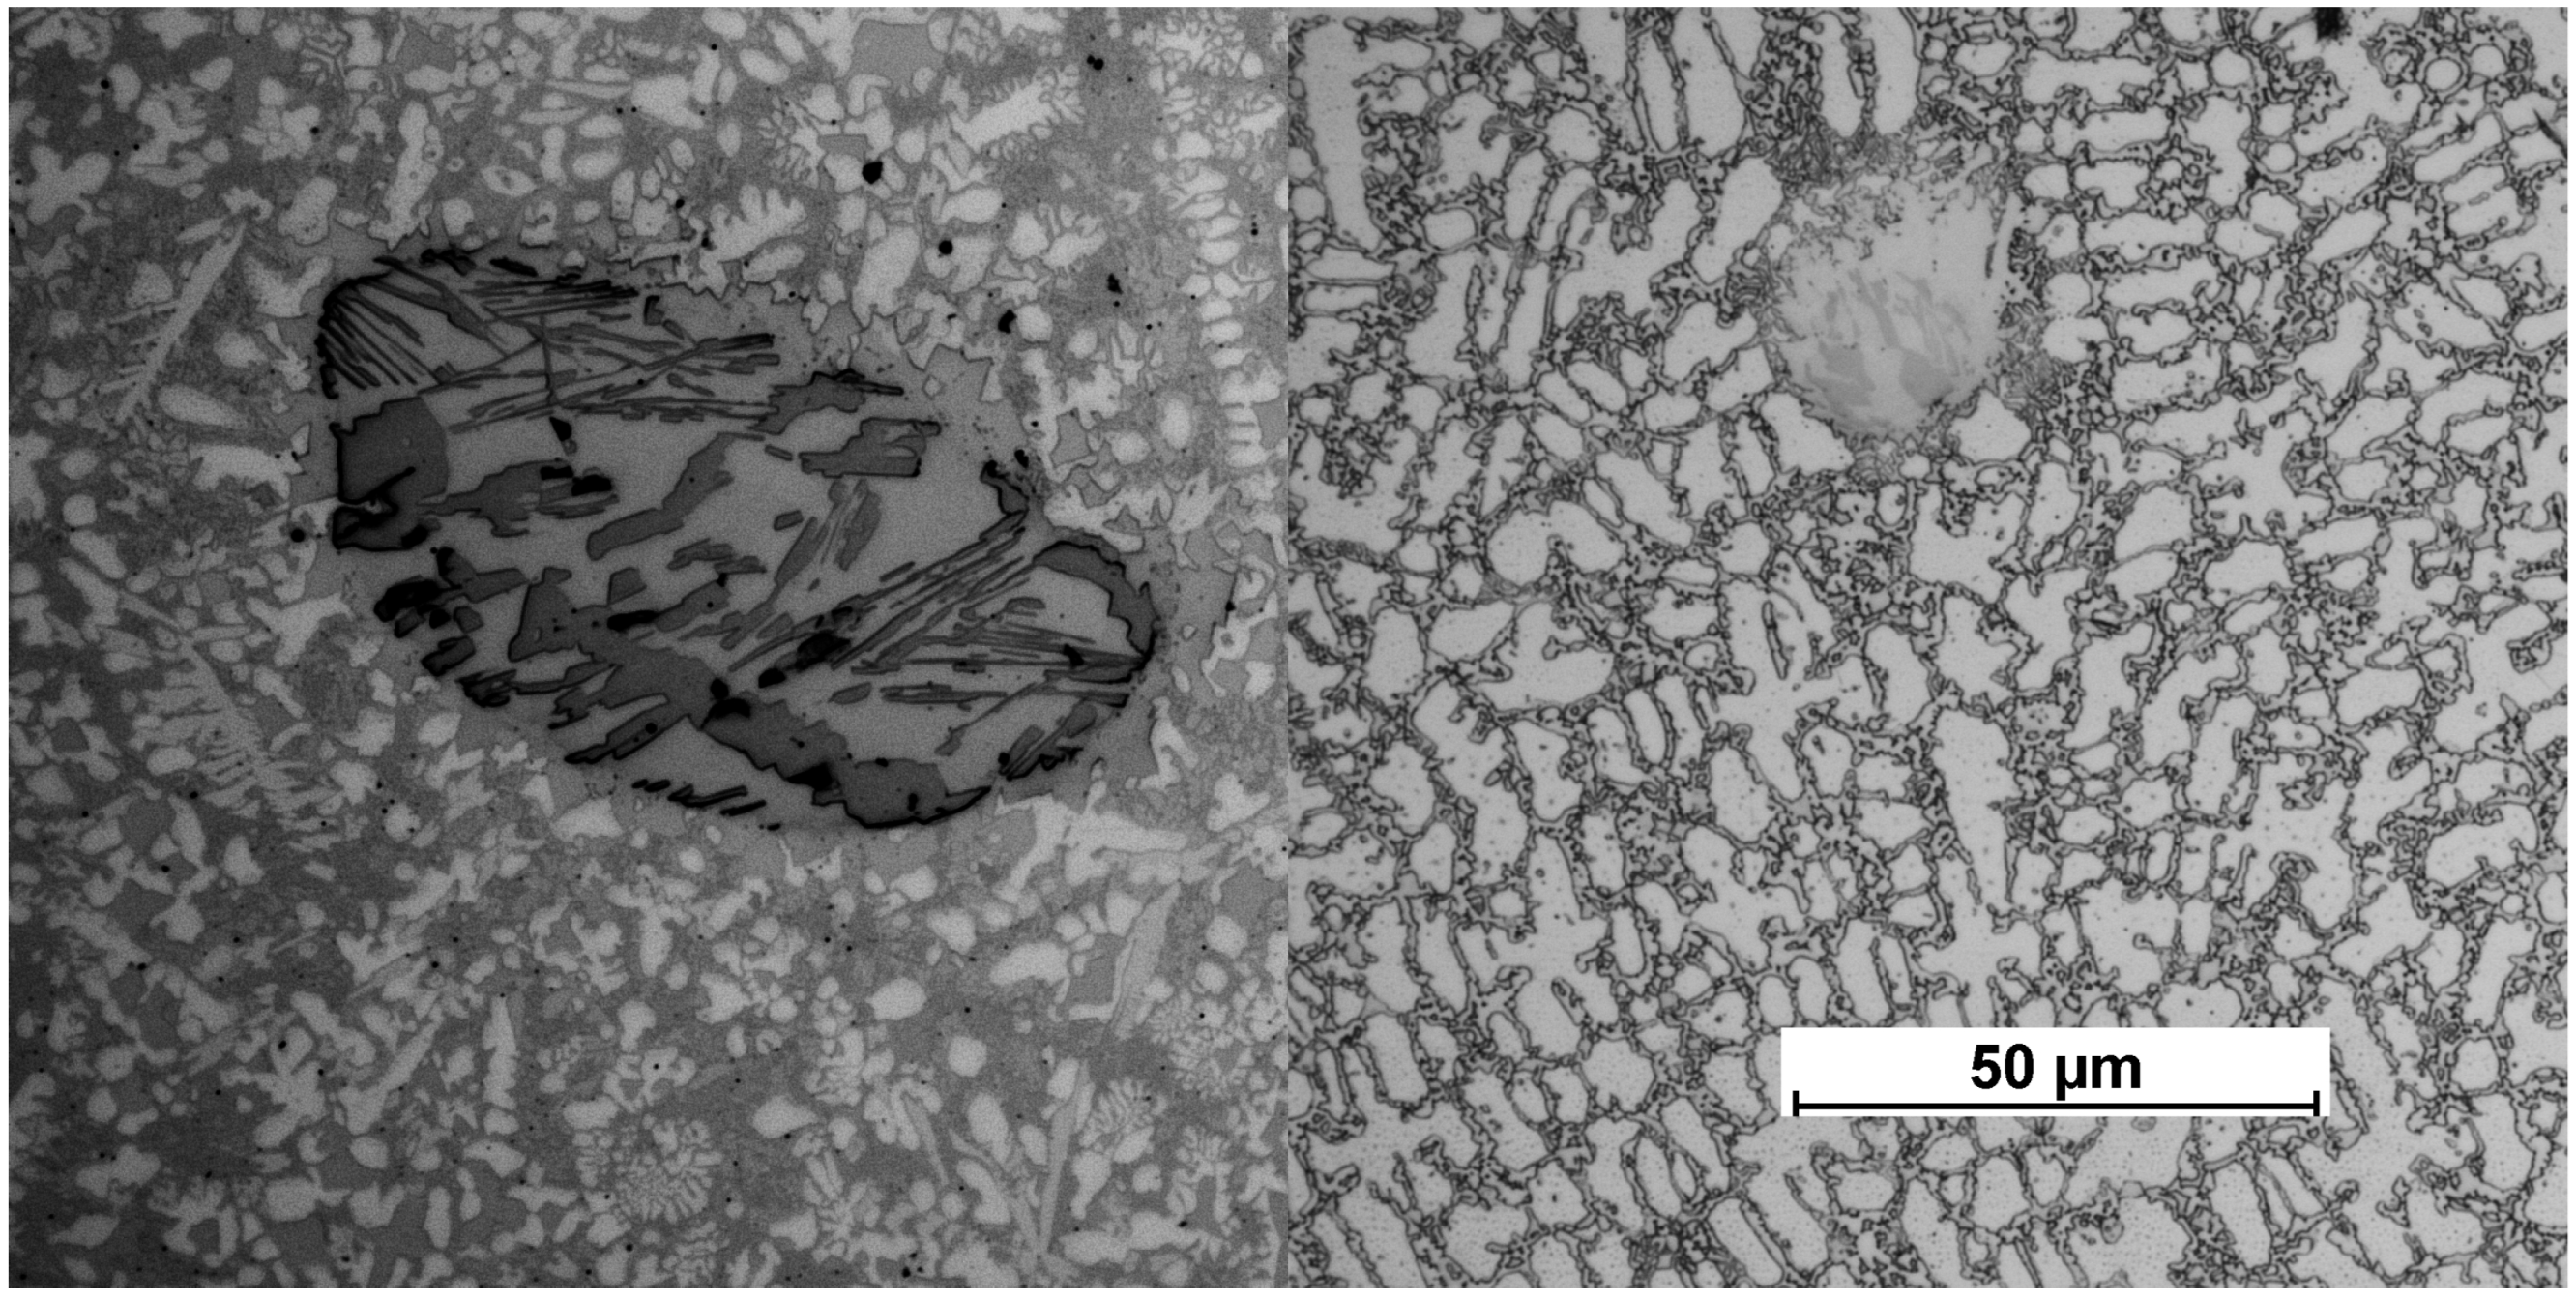
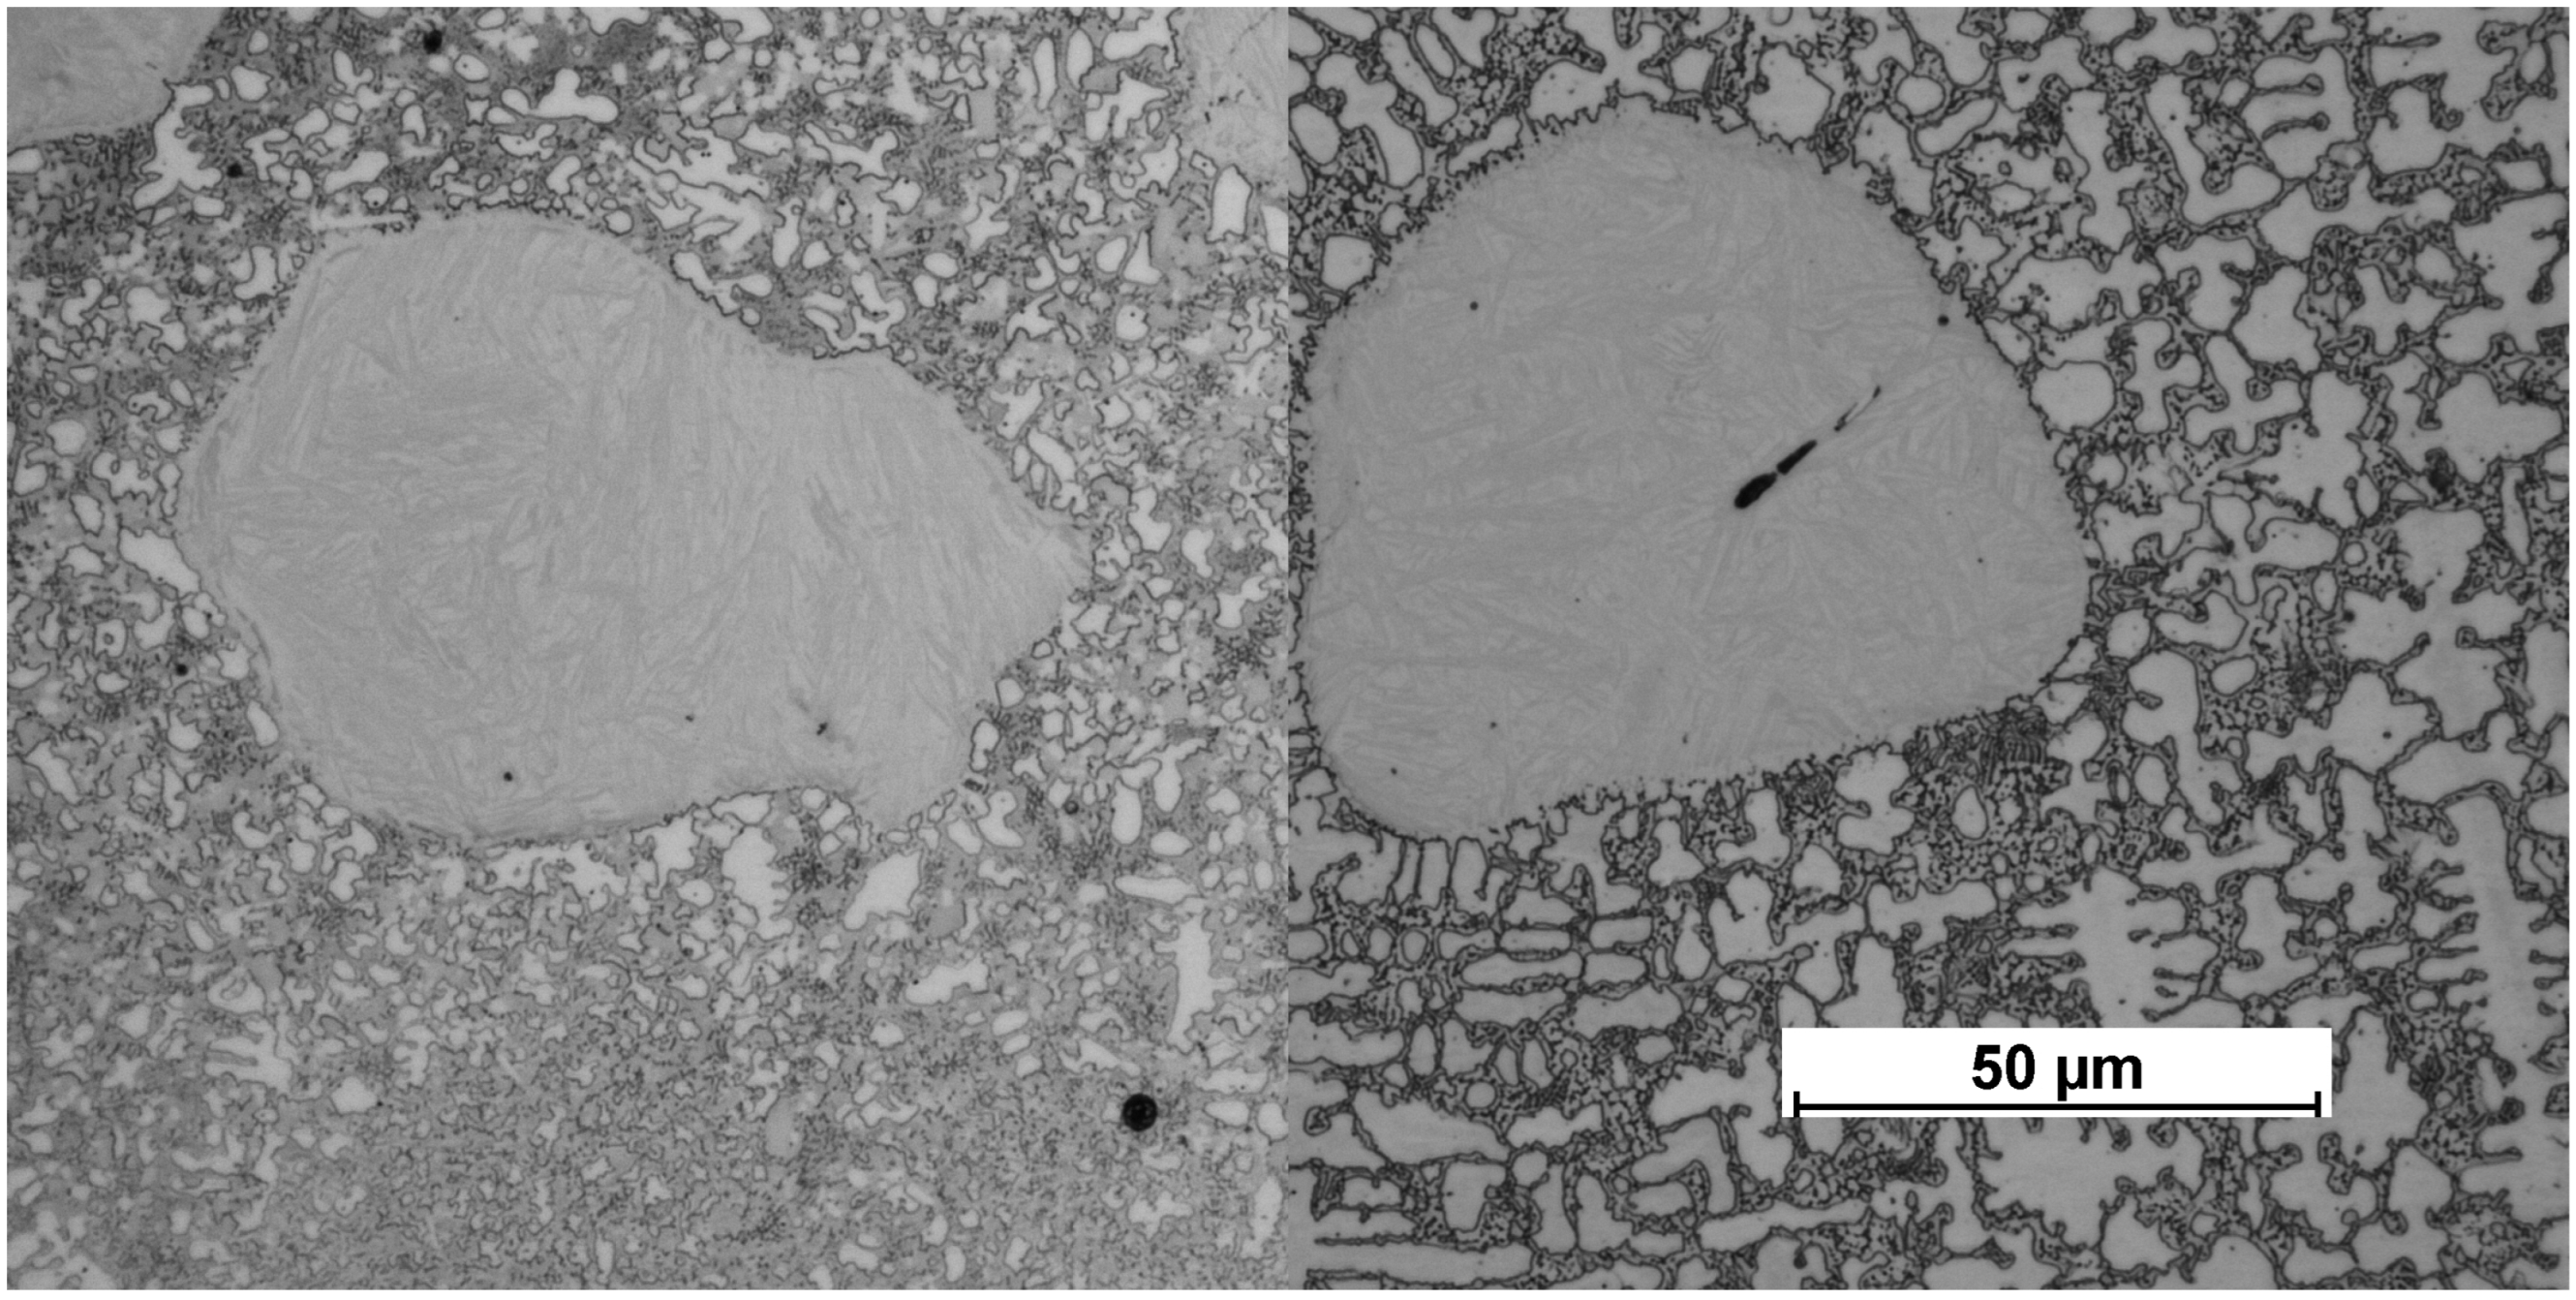
Figure 5 shows the microstructure of the fusion line in bead no. 5 of powder P2. Figure 6 shows a comparison between the microstructures of the powder P1 before and after electron beam remelting. Figure 7, Figure 8 and Figure 9 show a comparison of the microstructures of all the remelted beads of powder P1. Figure 10, Figure 11 and Figure 12 show a comparison of the microstructures in powders P2, P3, and P4, respectively, on the examples of beads no. 5 and 8.

3.3. SEM and EDS Analysis—Microstructure and Chemical Distribution After EBR

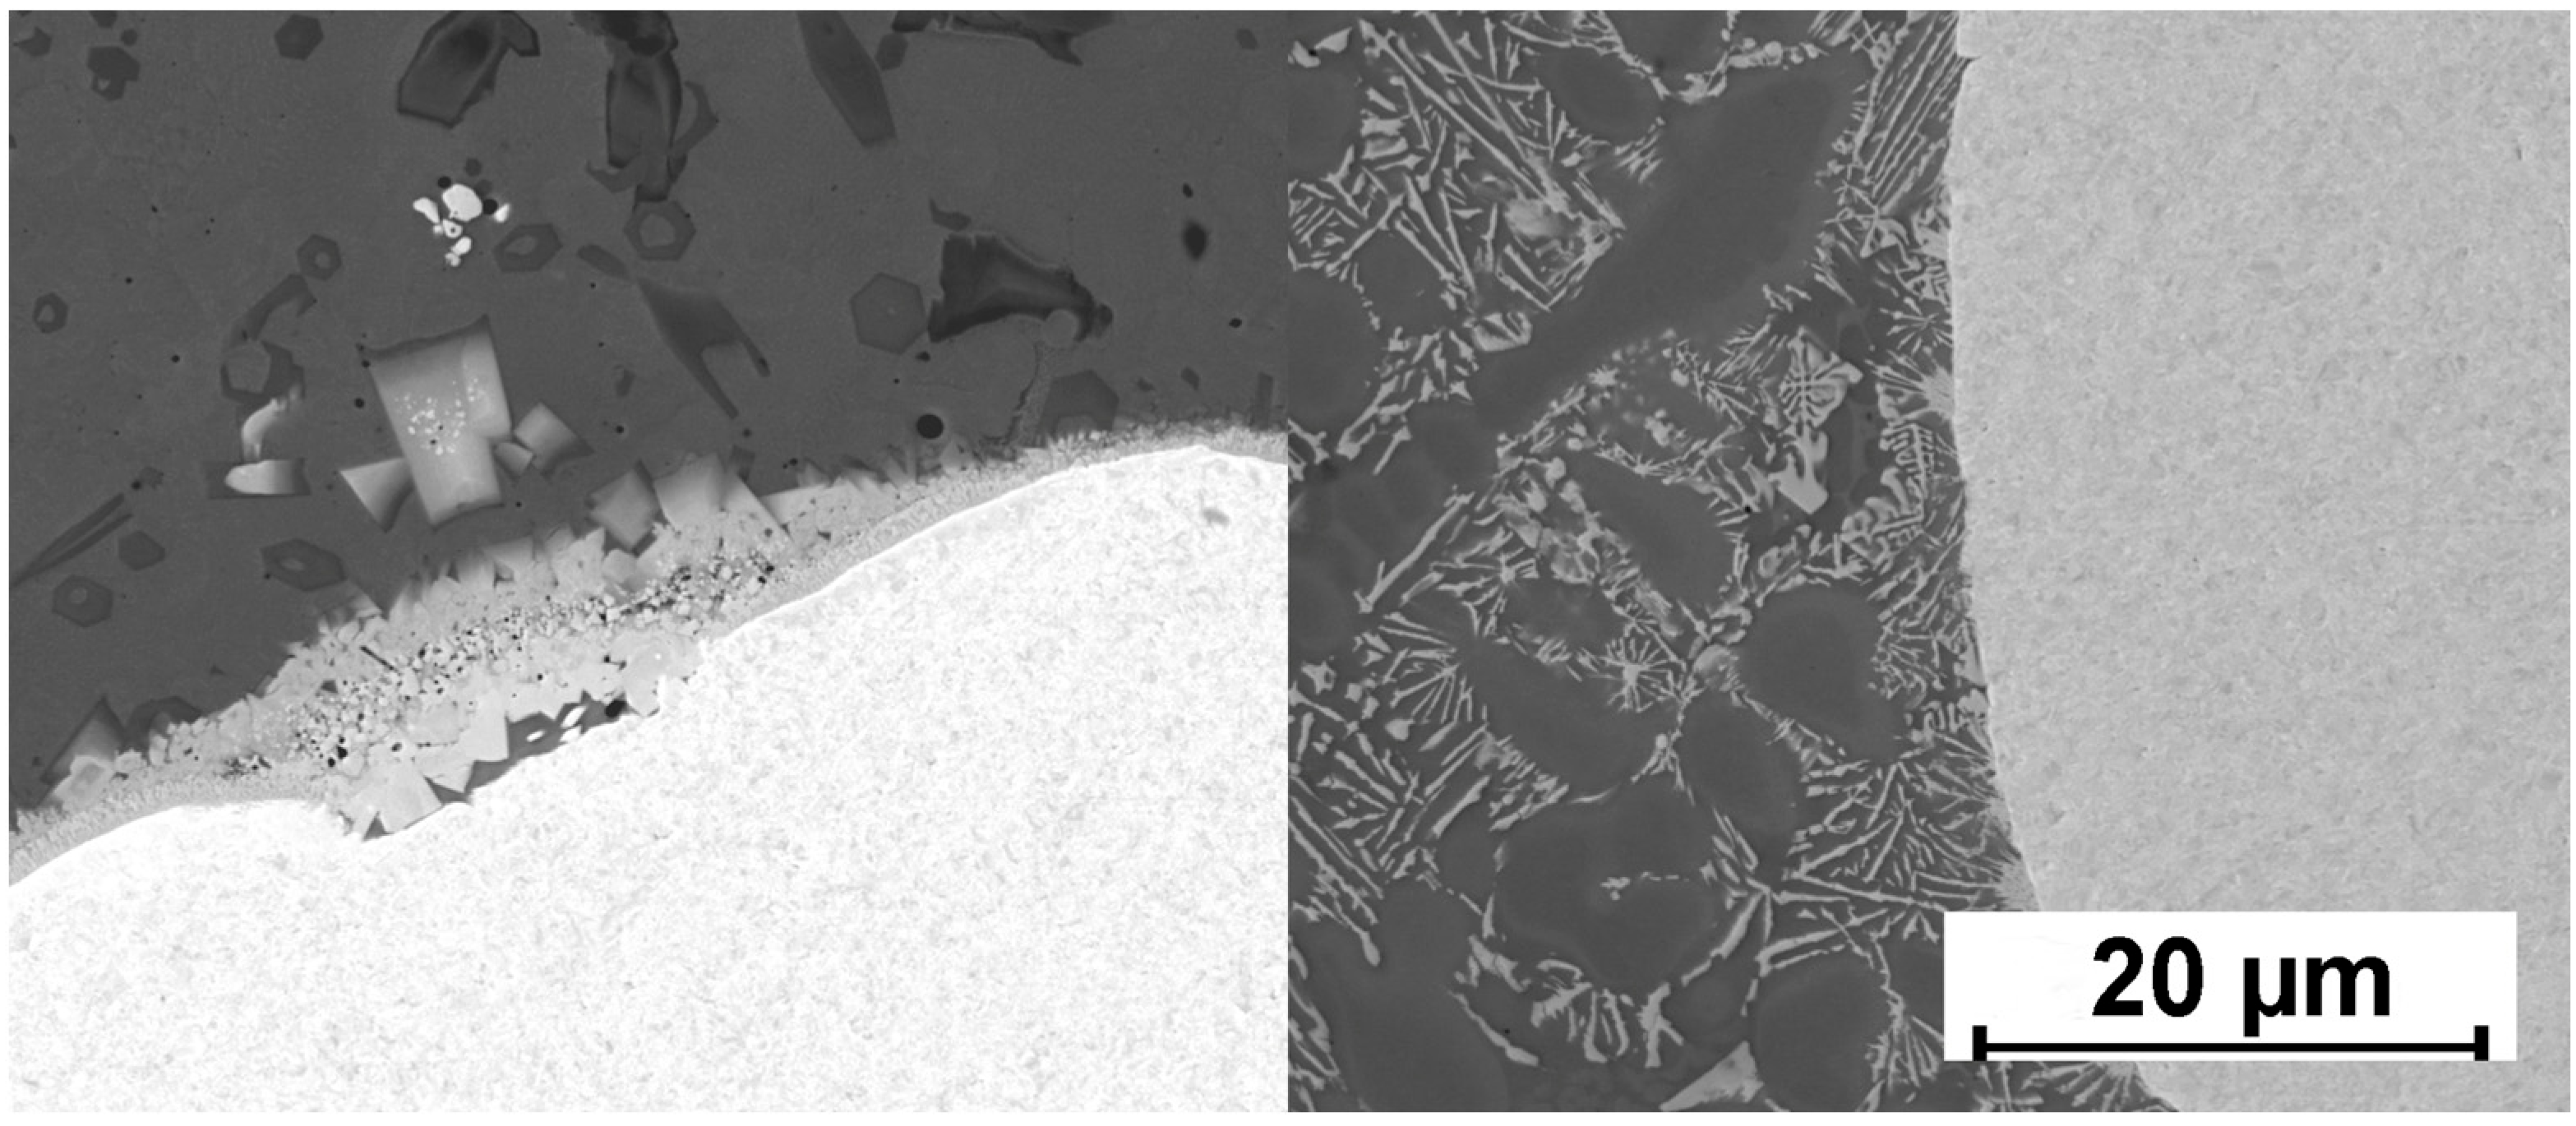
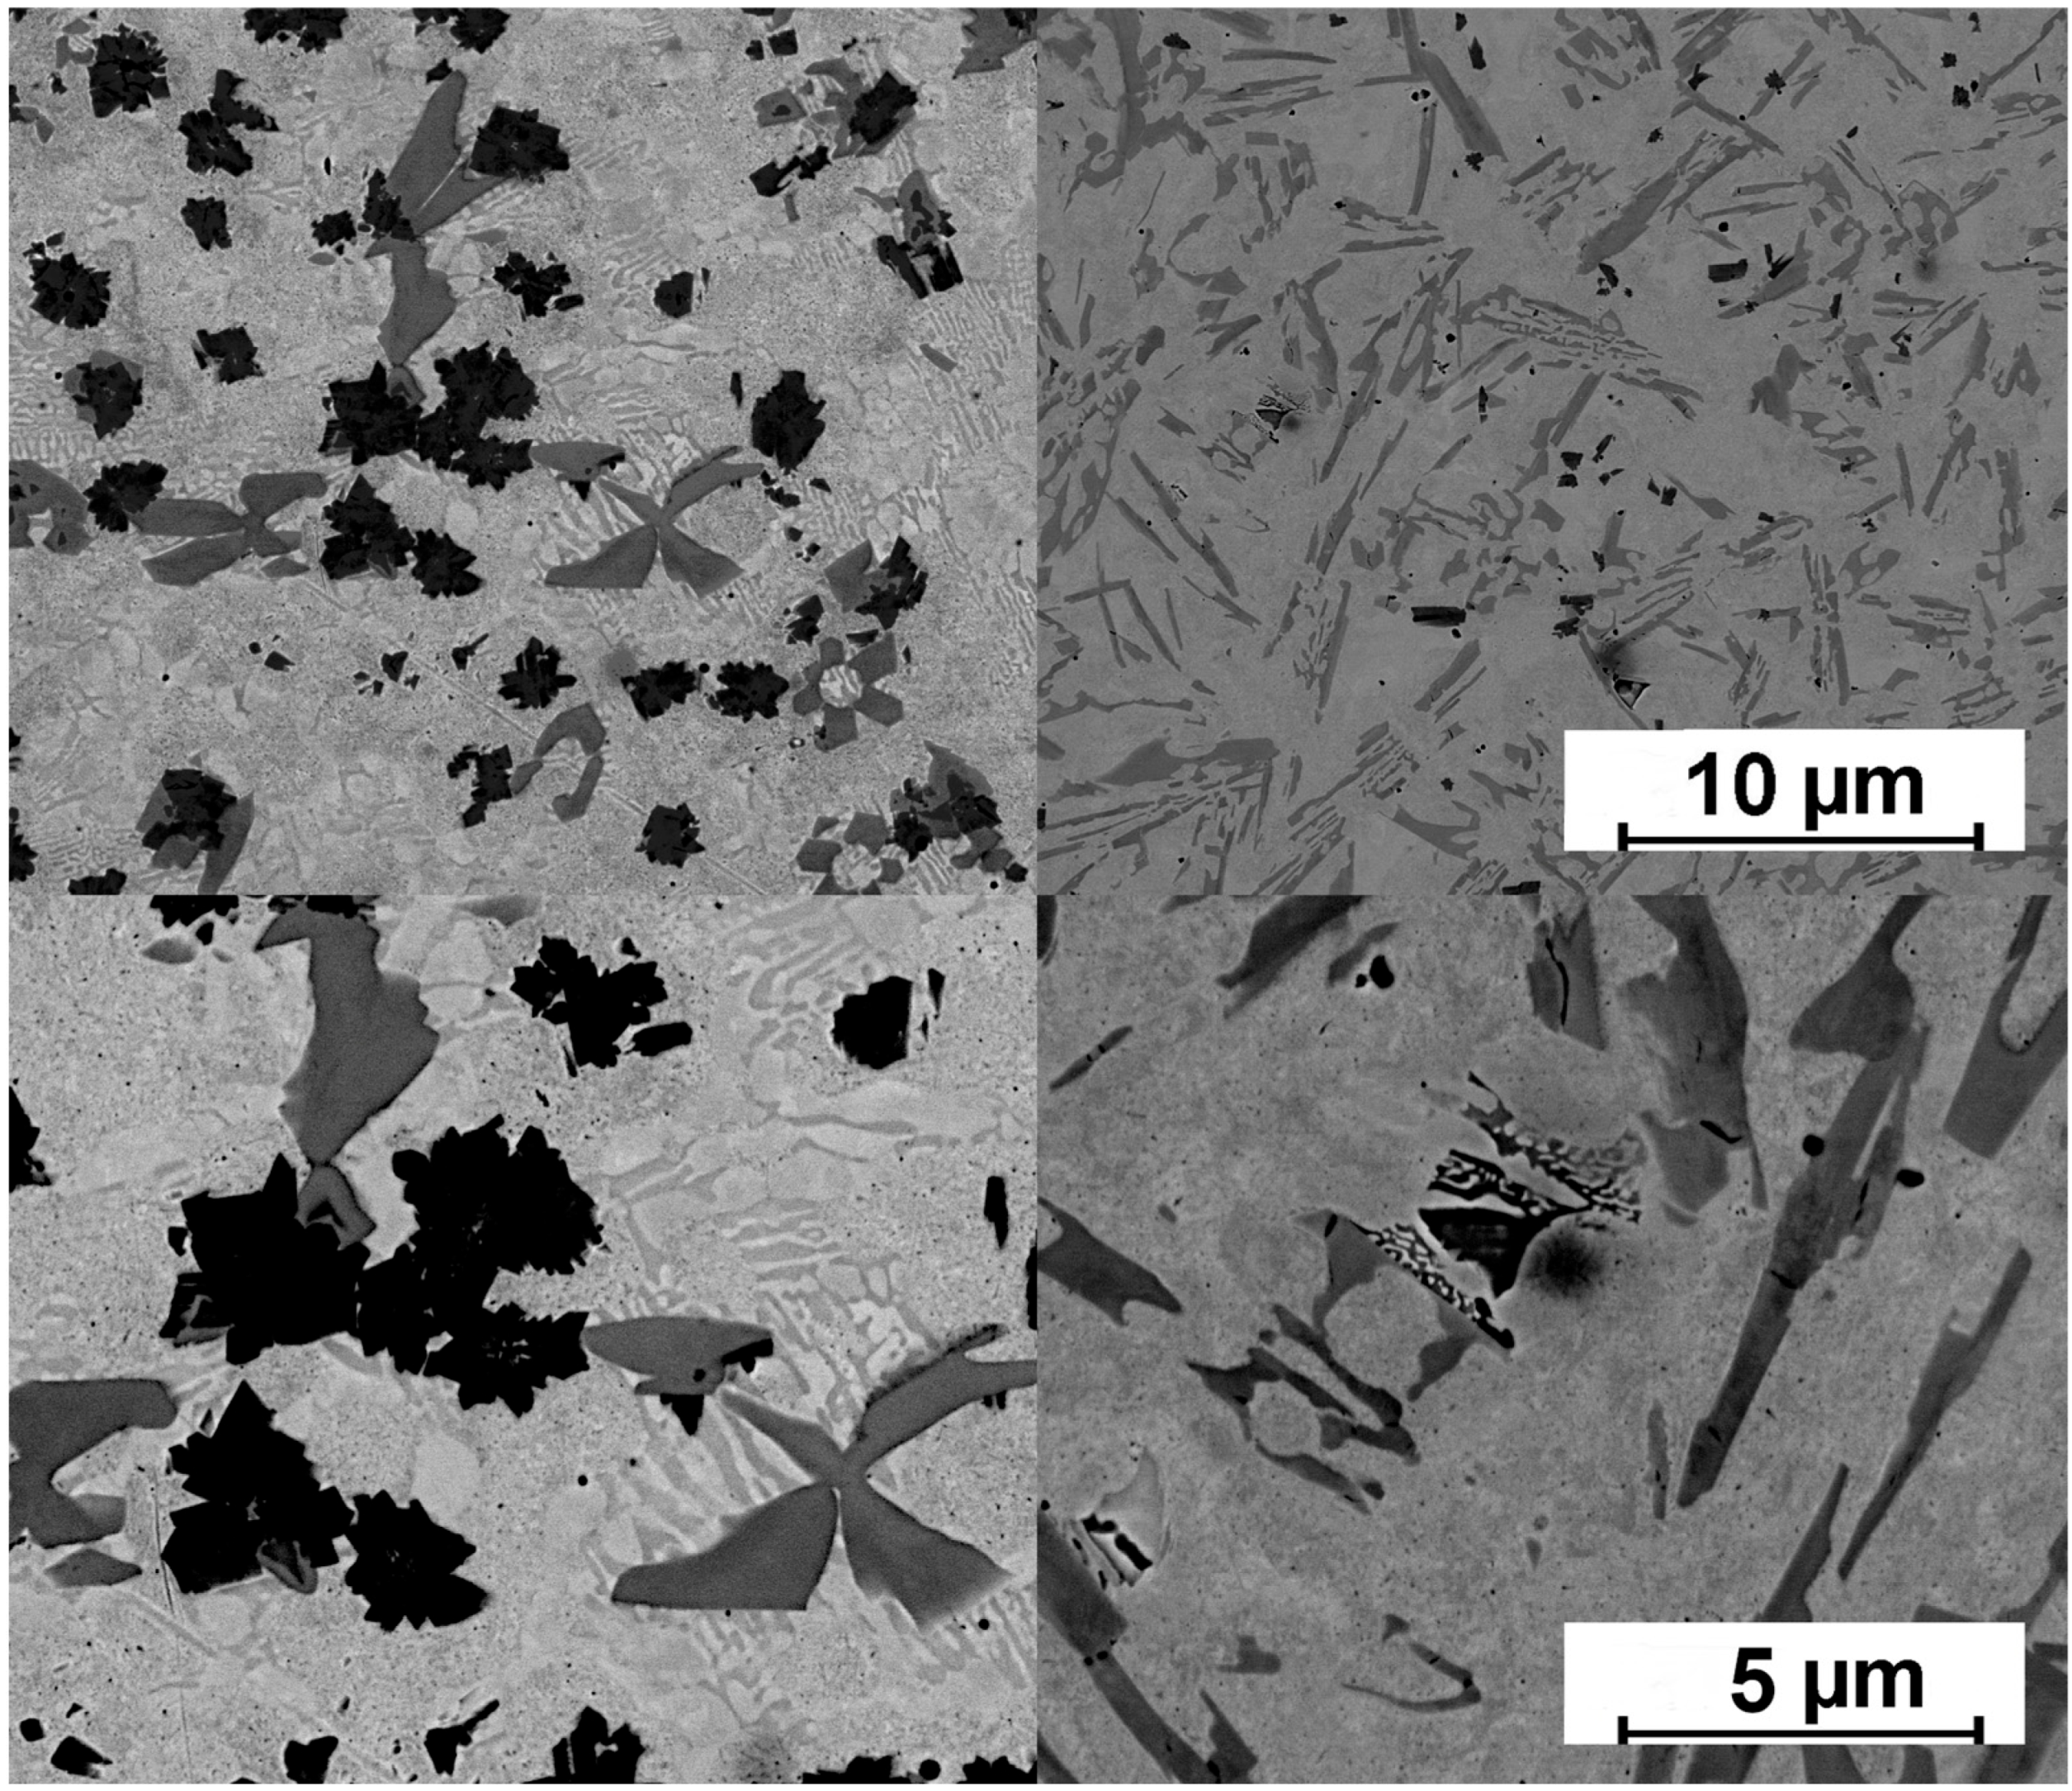
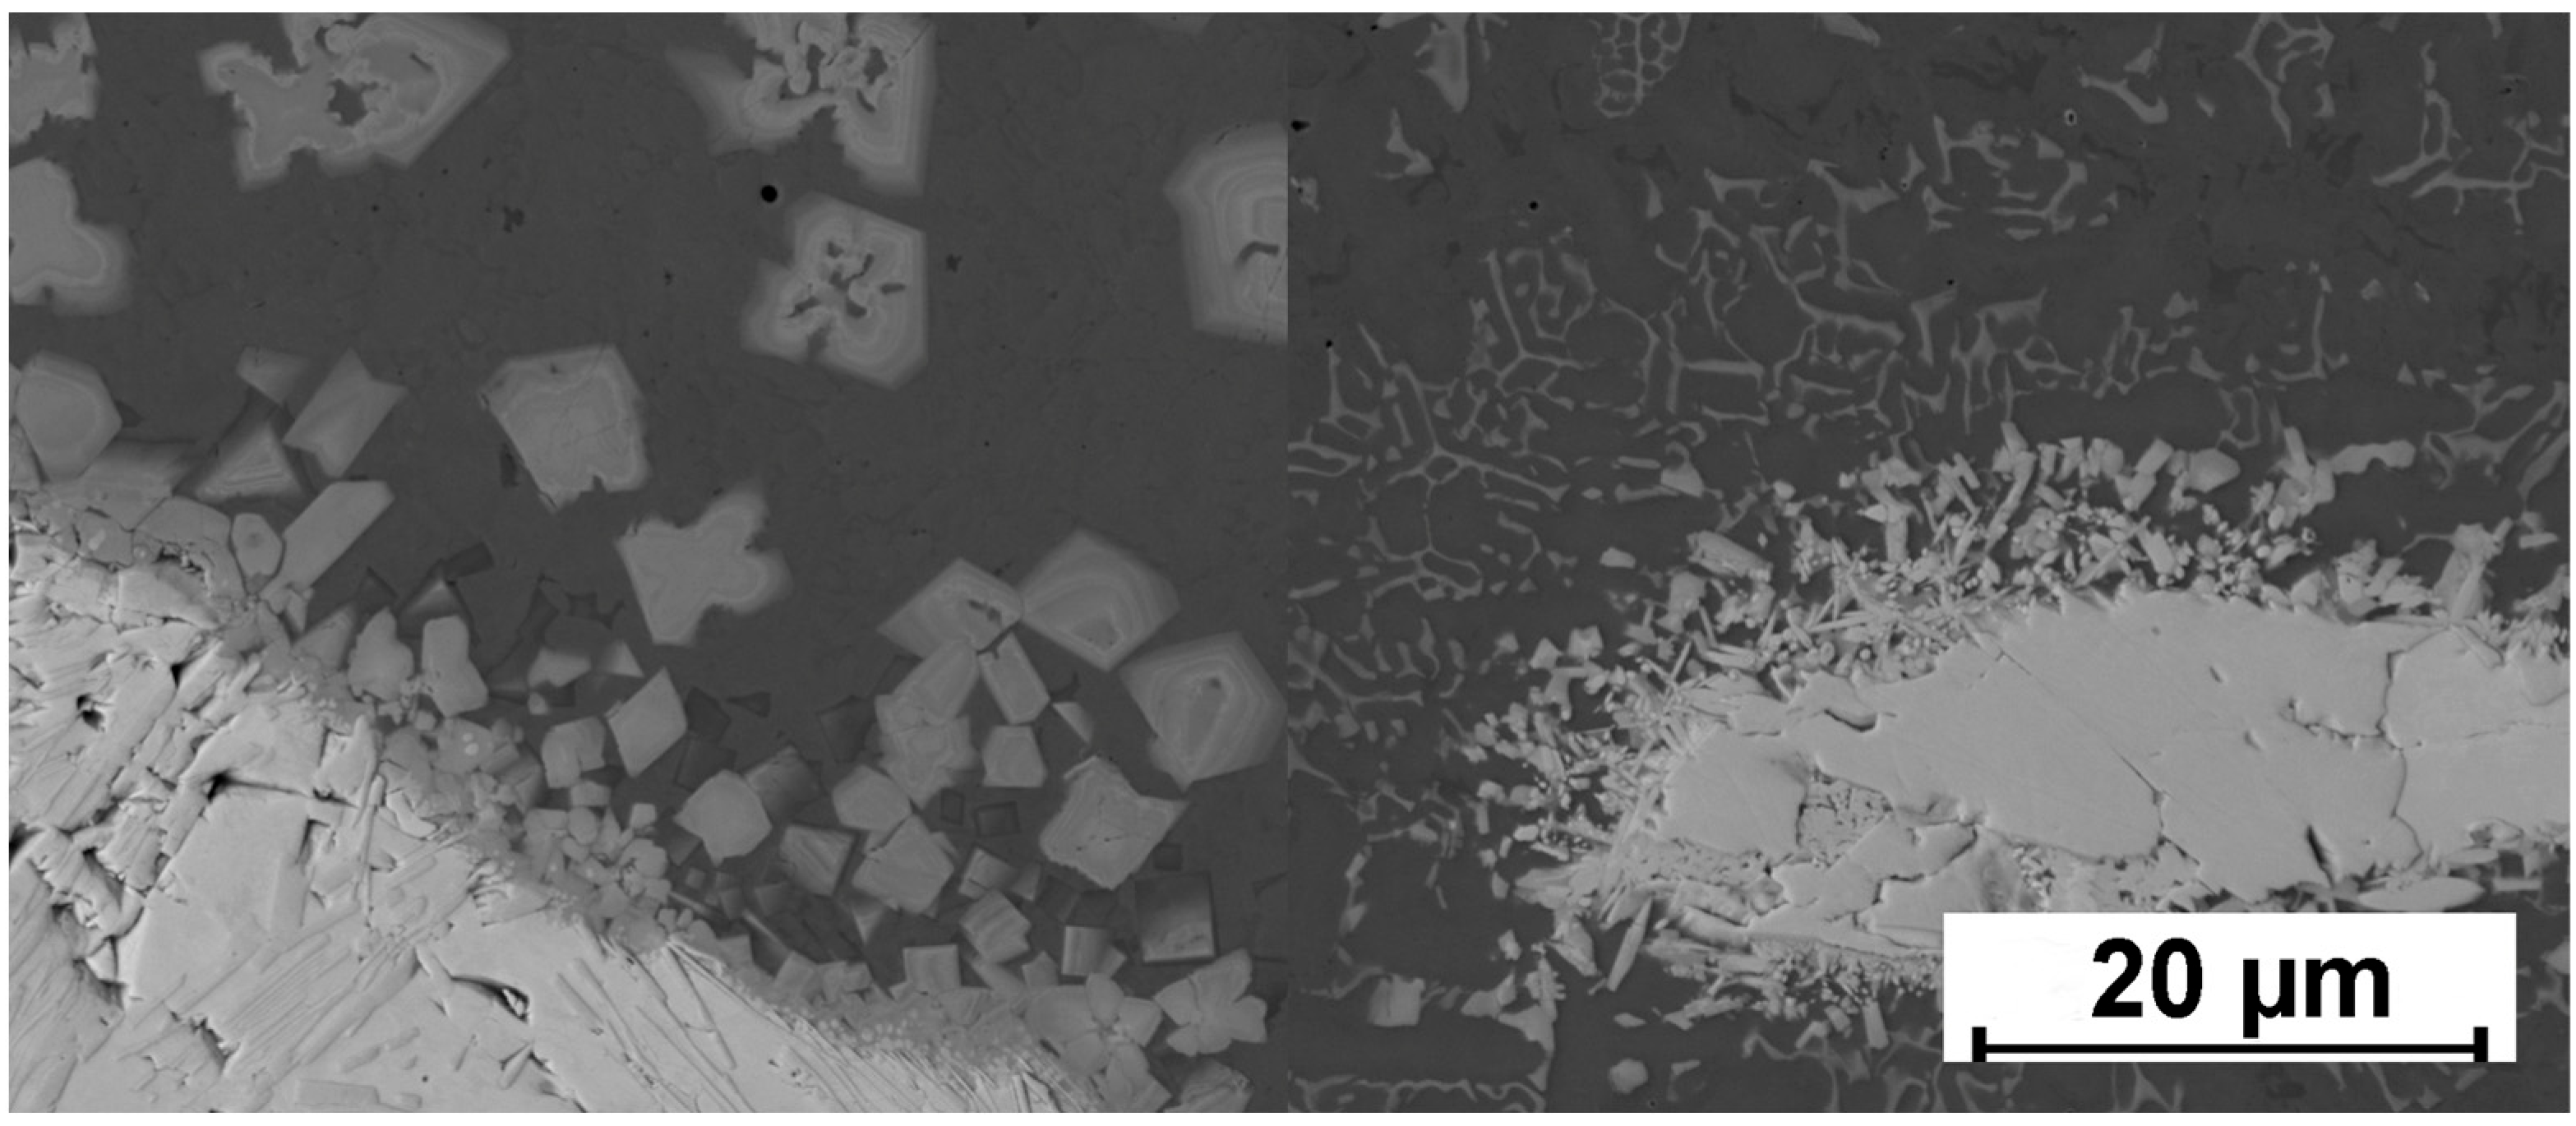
The research was carried out using an FEI Nova NanoSEM 450 microscope (FEI Europe B.V. GH Eindhoven, The Netherlands) together with an EDAX Octane Elect energy-dispersive spectroscopy (EDS) analyzer. Beads no. 5 and 8 were selected for SEM and EDS analysis due to the minimal fusion for bead no. 5 and for comparative purposes of the effect of increased dilution for bead no. 8. The samples were etched in the same etchant as for light microscopy. The accelerating voltage for all the presented photos and EDS analysis was set for 15 kV. Working distance was around 10 mm, and the BackScattered Electron Detector was used to achieve better elemental and phase contrast. Figure 13, Figure 14, Figure 15 and Figure 16 show a comparison of beads no. 5 and no. 8 of powders P1-P4 after EBR, respectively. Figure 17, Figure 18, Figure 19 and Figure 20 show EDS analysis results for all the tested powders along with the chemical compositions given in Table 4, Table 5, Table 6 and Table 7. Figure 21, Figure 22, Figure 23, Figure 24, Figure 25 and Figure 26 show EDS mapping of elemental distribution of Cr, Ni, Fe, and W in EBR beads no. 5 and 8 for powders P2, P3, and P4. Dwell time for EDS Mapping was 200 s; the pixel size was 0.8 µm.
The EDS analysis was performed in two ways. Each of the tested powders from P1 to P4 (in EBR beads 5 and 8) was analyzed using point and area scans at high magnification to check the exact chemical composition of observed phases. In the case of powder P1, only the metallic matrix was analyzed, while in the case of powders P2 to P4, the interface between the strengthening phase (carbide or tungsten particles) and the metallic matrix was analyzed. Powders P2, P3, and P4 were also mapped for chemical composition using EDS technology to check the distribution of Cr, Ni, Fe, and W. Figure 17, Figure 18, Figure 19 and Figure 20 show EDS analysis points and areas on SEM photographs for powders P1 to P4, respectively. These figures are related to chemical compositions in Table 4, Table 5, Table 6 and Table 7.

3.4. Hardness Testing of the Remelted Powders

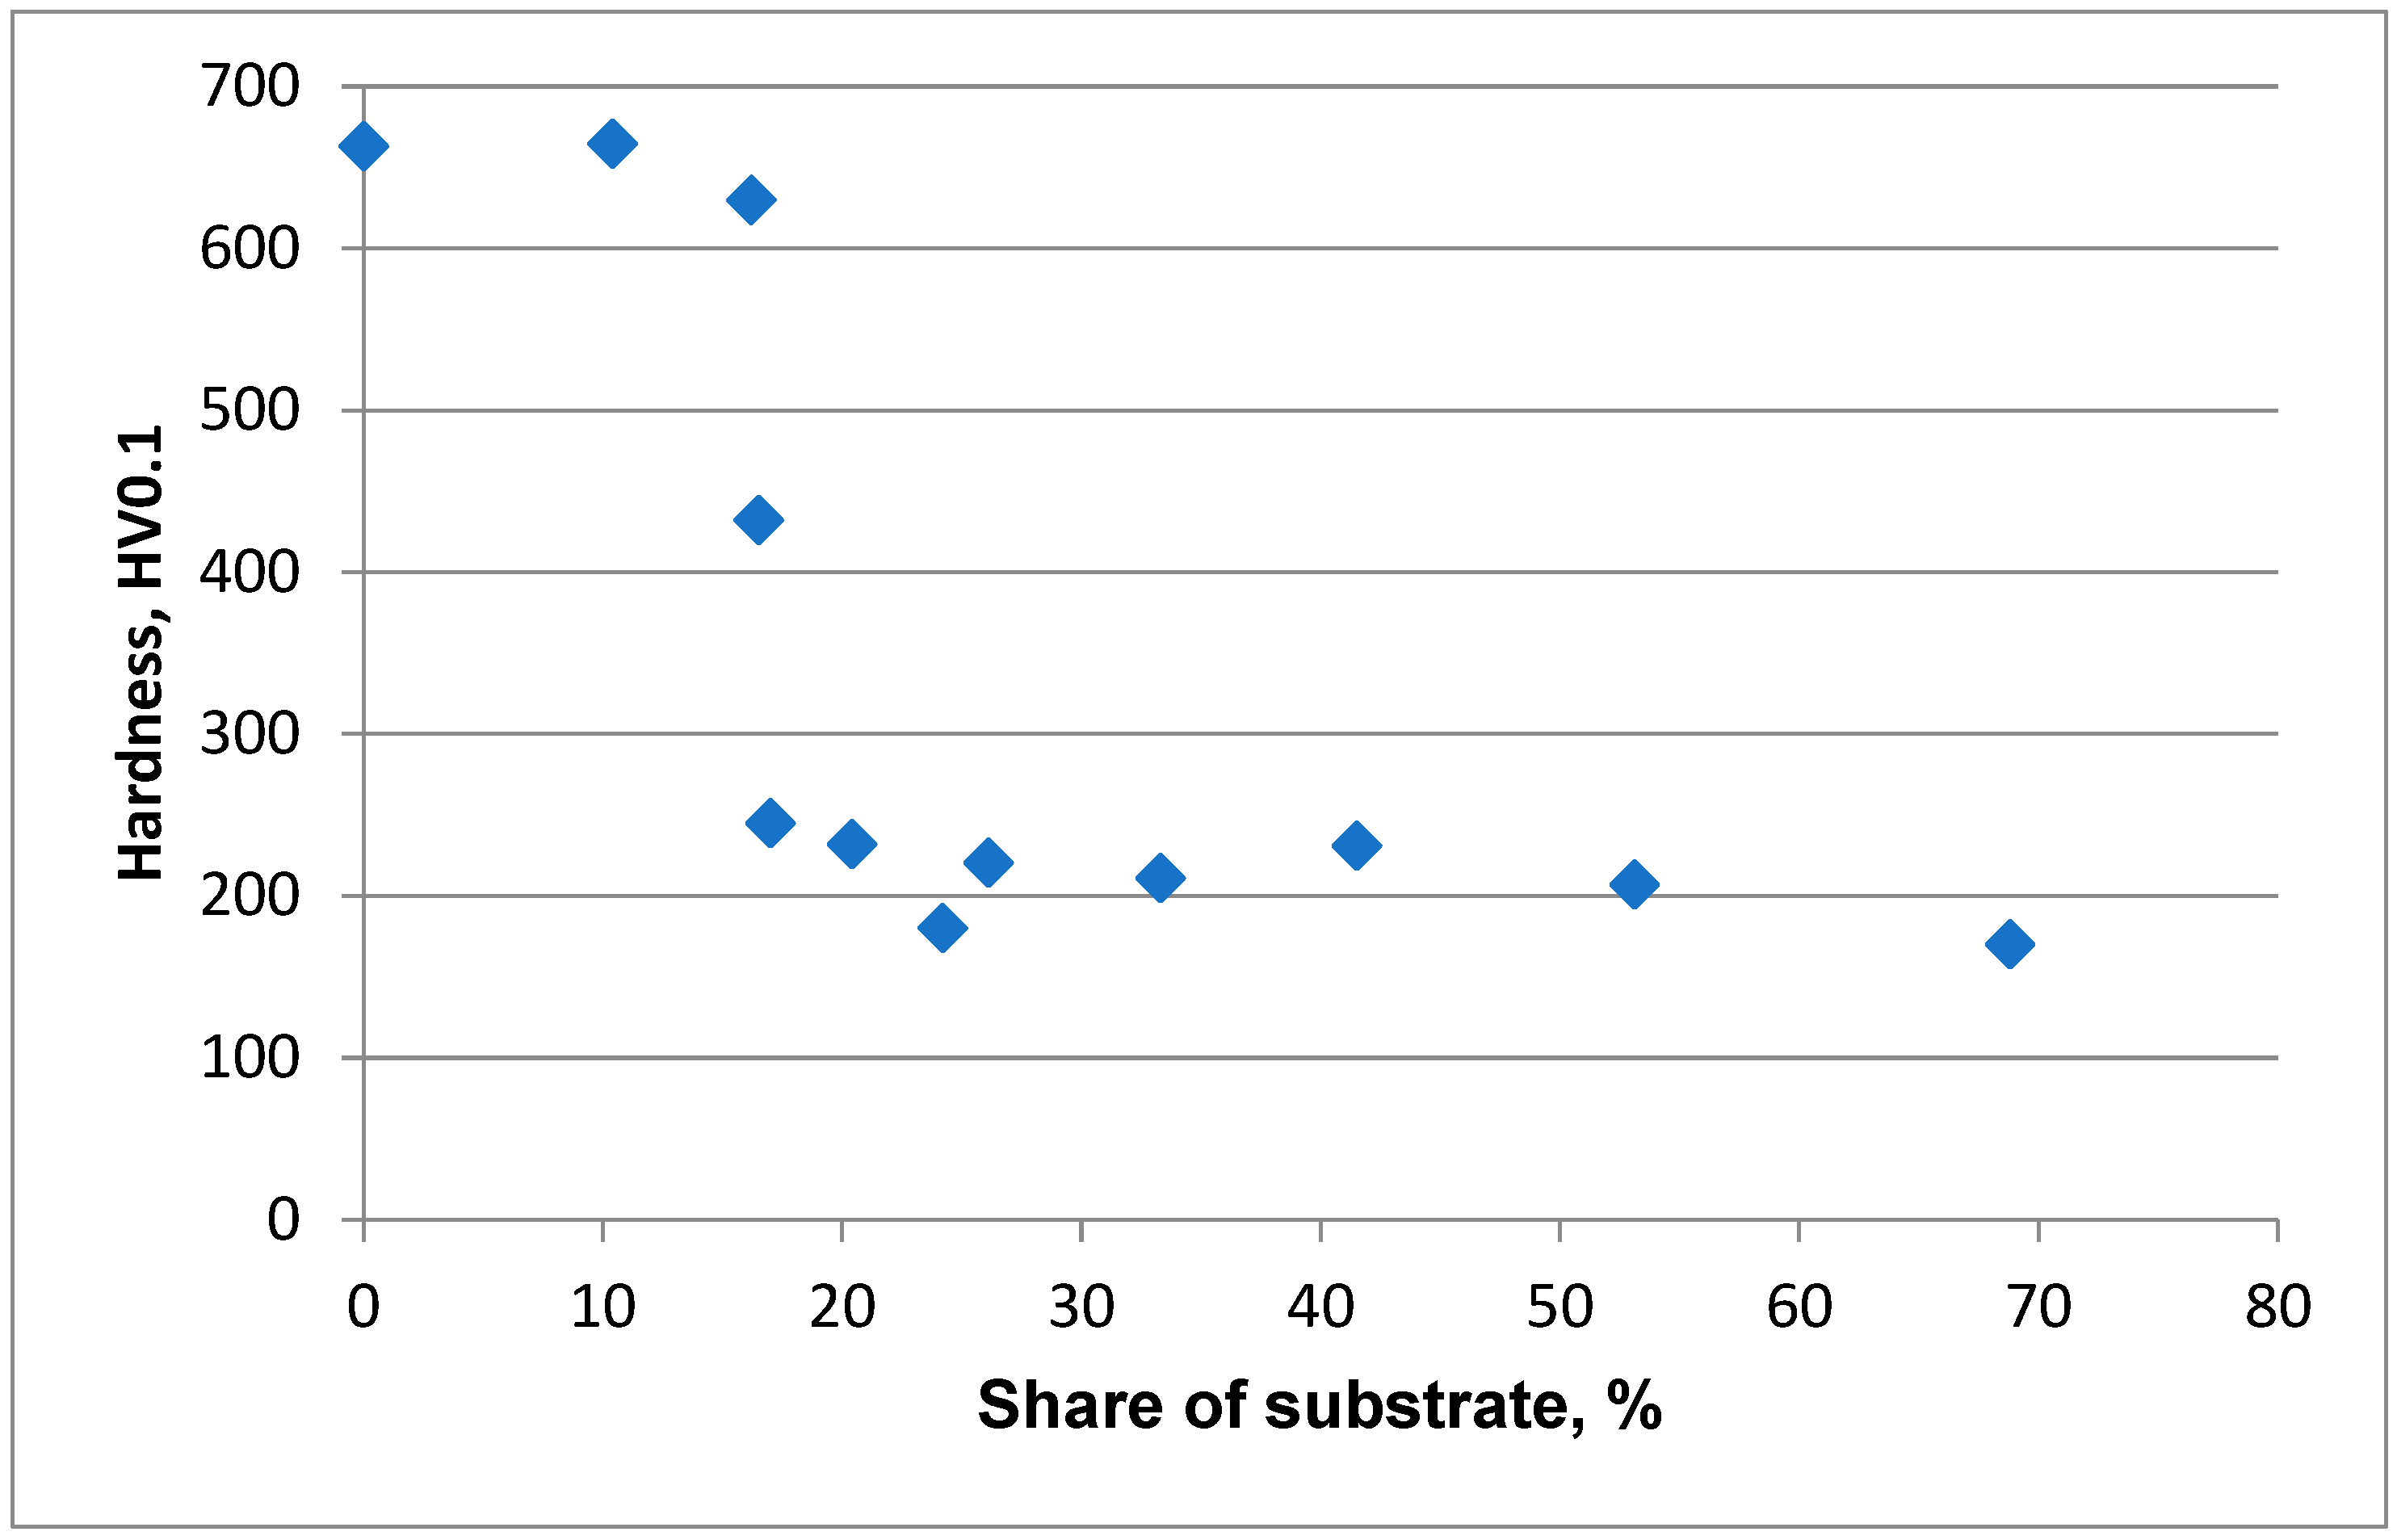
Vickers hardness was measured using an automated hardness tester from KB Prüftechnik (Hochdorf-Assenheim, Germany). Figure 27 shows a graph of the dependence of the average hardness of the obtained beads on the proportion of substrate for powder P1.

4. Discussion

As seen in Figure 3, beads no. 1 and no. 5 were characterized by the most favorable (due to the lowest proportion of substrate in the coating confirmed in Table 3)—that is, minimal—melting into the substrate material, in the case of powders P1 and P3. In the case of bead no. 9, the depth of melting of the sprayed layer did not reach the substrate material. For each set of parameters (1–4, 5–8, and 9–12), a clear effect of the electron beam power on the depth of the obtained remelting can be seen (Figure 4), as the remelting depth increases along with the beam power.
As seen in Figure 6, the microstructure of the powder after being sprayed onto the substrate is characterized by a lamellar structure, a lot of discontinuities, and porosity, as well as mechanical bonding to the substrate. After the electron beam remelting process, the microstructure becomes homogeneous and free from any discontinuities. Figure 5 shows that the EBR allowed for fusion into the base material, ensuring metallurgical bonding with the substrate instead of mechanical (as in the case of thermally sprayed coatings) or adhesive (as in the case of flame melting) bonding. The examples cited in the introduction show that metallurgical bonding to the substrate significantly increases the peel strength of such coatings under load. Appropriate tests need to be carried out to confirm this claim for our electron beam remelted NiCrBSi coatings, which will be the subject of future research.
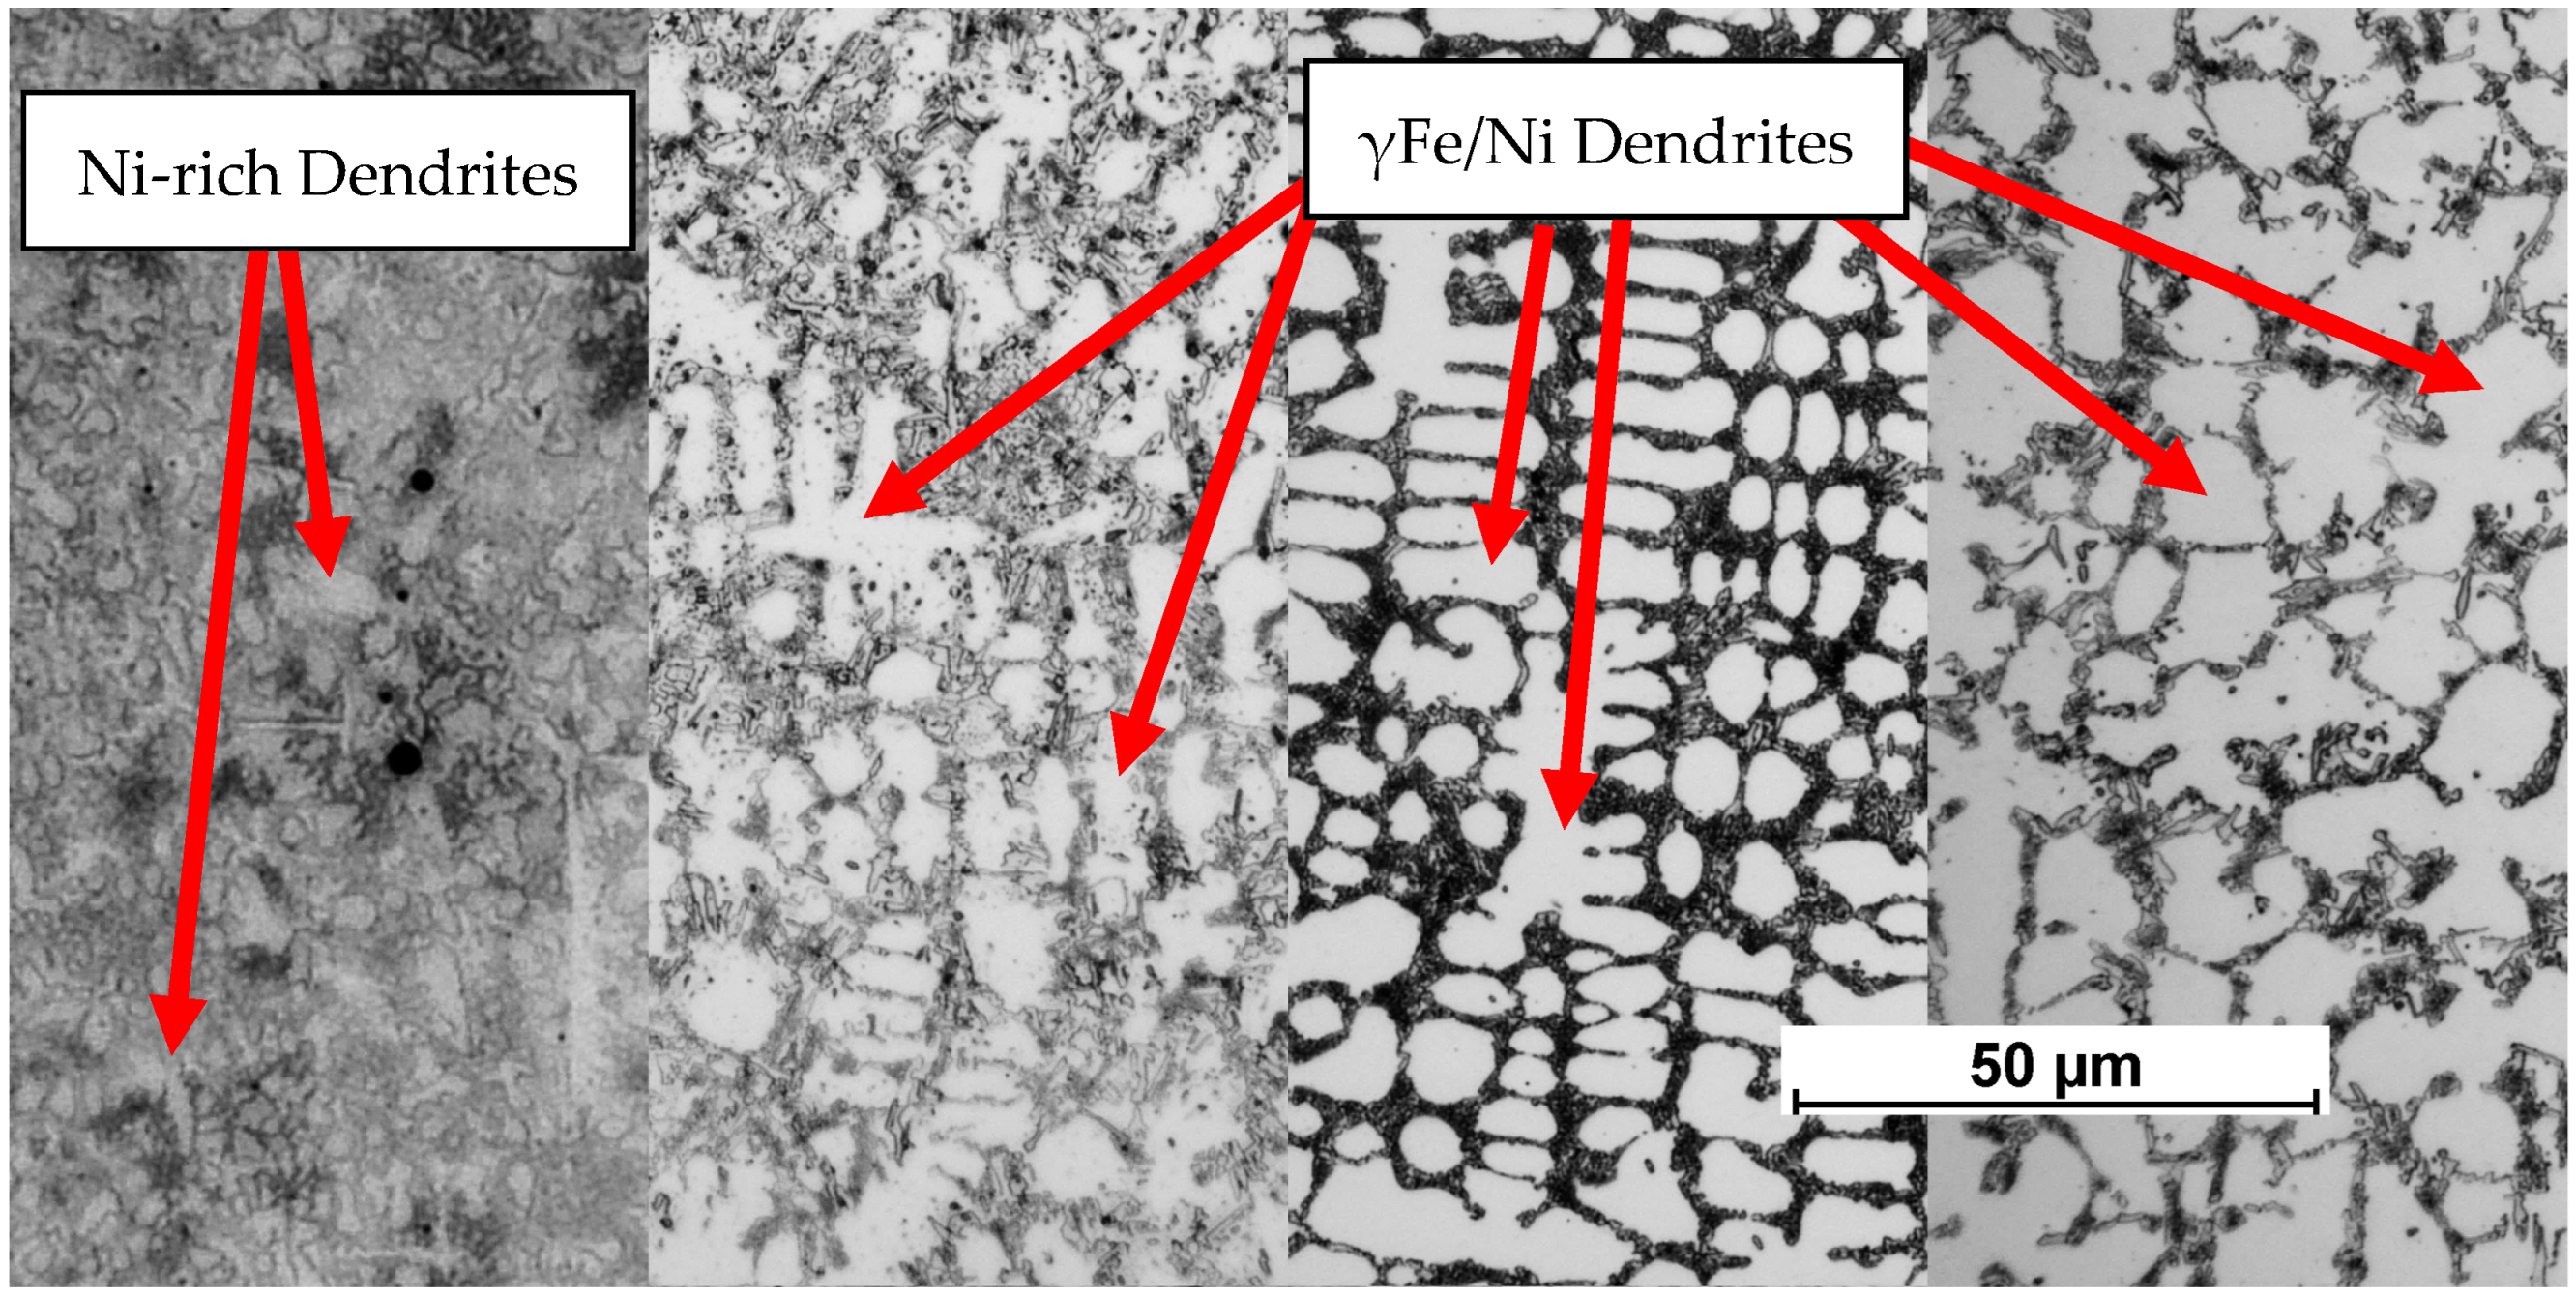
In Figure 7, Figure 8 and Figure 9, a clear increase in the proportion of the γFe/Ni dendritic phase can be seen as the proportion of substrate in the bead volume increases along with the process parameters. According to the literature, and examples mentioned in the introduction [3,4,6,10,24,25], typical NiCrBSi remelted coating microstructure mainly consists of a γ-Ni-rich phase, which could be in the form of globular clusters or small white dendrites, as well as in all the eutectic regions visible in SEM photographs. As the depth of melting increases along with the dilution, a mixed structure begins to dominate, in which the globular grains of the matrix contain more and more Fe instead of Ni. Finally, above a certain degree of dilution, a distinct dendritic or columnar-dendritic phase, which is a γFe/Ni solution, begins to dominate. This phase is also visible as a white phase marked on the figures. The interdendritic area typically contains eutectics rich in Ni, Fe, Cr, and W (in the case of powders with WC addition) as well as B and C, containing many hard phases such as borides and carbides. These phenomena are influenced by two basic factors: the amount of heat introduced and the variable chemical composition caused by mixing the coating (rich in Ni, Cr, B, Si, and C) with the substrate (which mostly contains iron). As the depth of penetration increases, and thus also the dilution of the chemical composition of the coating with the base material, the dendritic phase, which is a mixture of nickel (from the coating) and iron (from the base material), begins to dominate due to the diffusion-controlled and non-equilibrium characteristics of crystallization during EBR processes. The greater the penetration, the greater the proportion of visible dendrites in the microstructure of the surface layer. For bead numbers 1, 5, and 9, a multiphase structure without a dominant structure type dominates, while for bead numbers 3, 4, 8, 10, 11, and 12, a dendritic structure dominates. Bead numbers 2, 6, and 7 are characterized by a mixed structure.
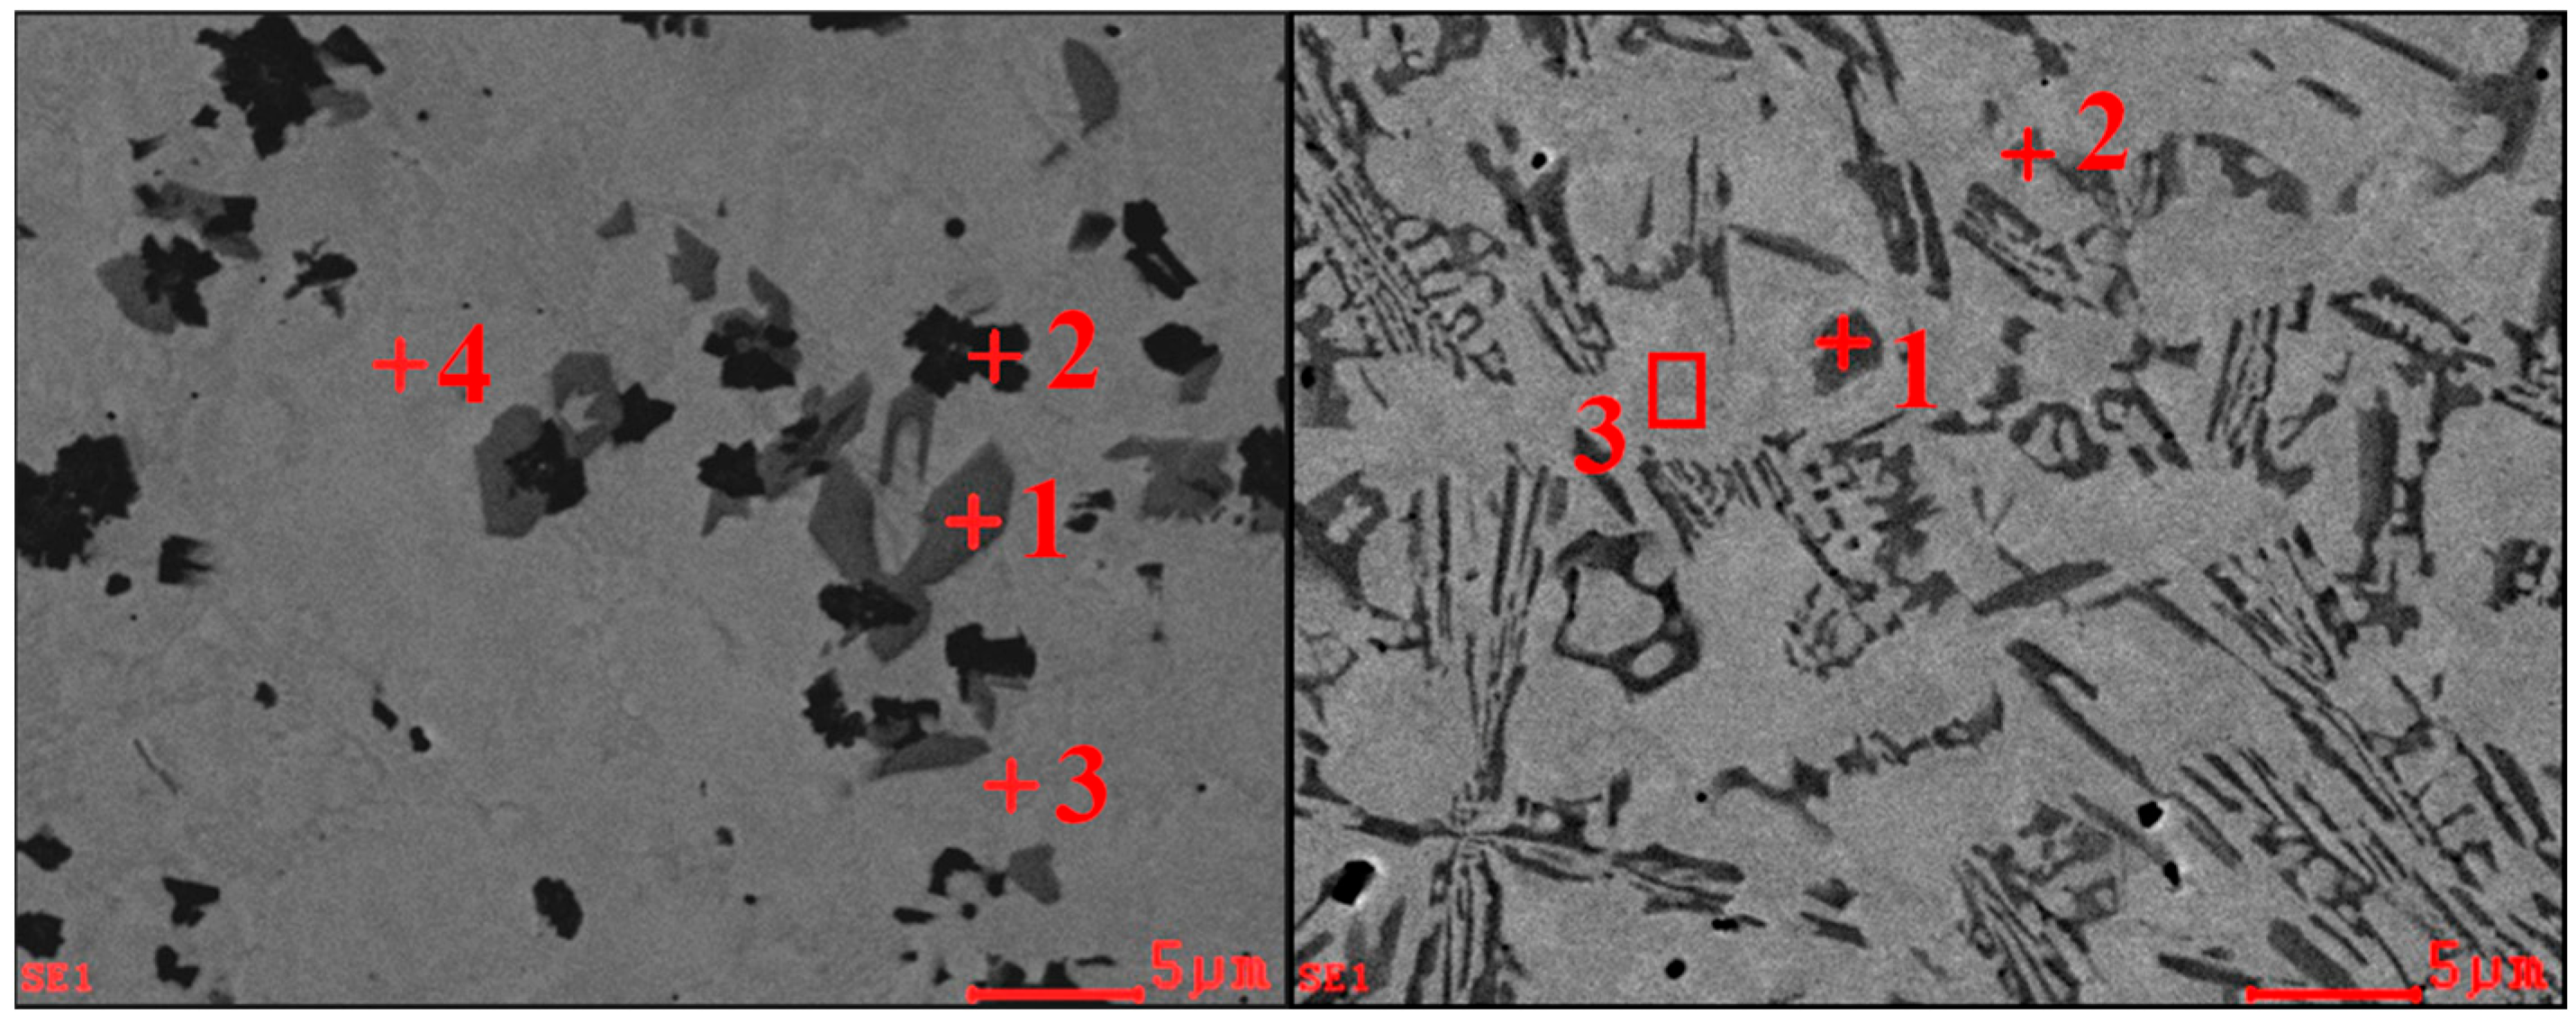
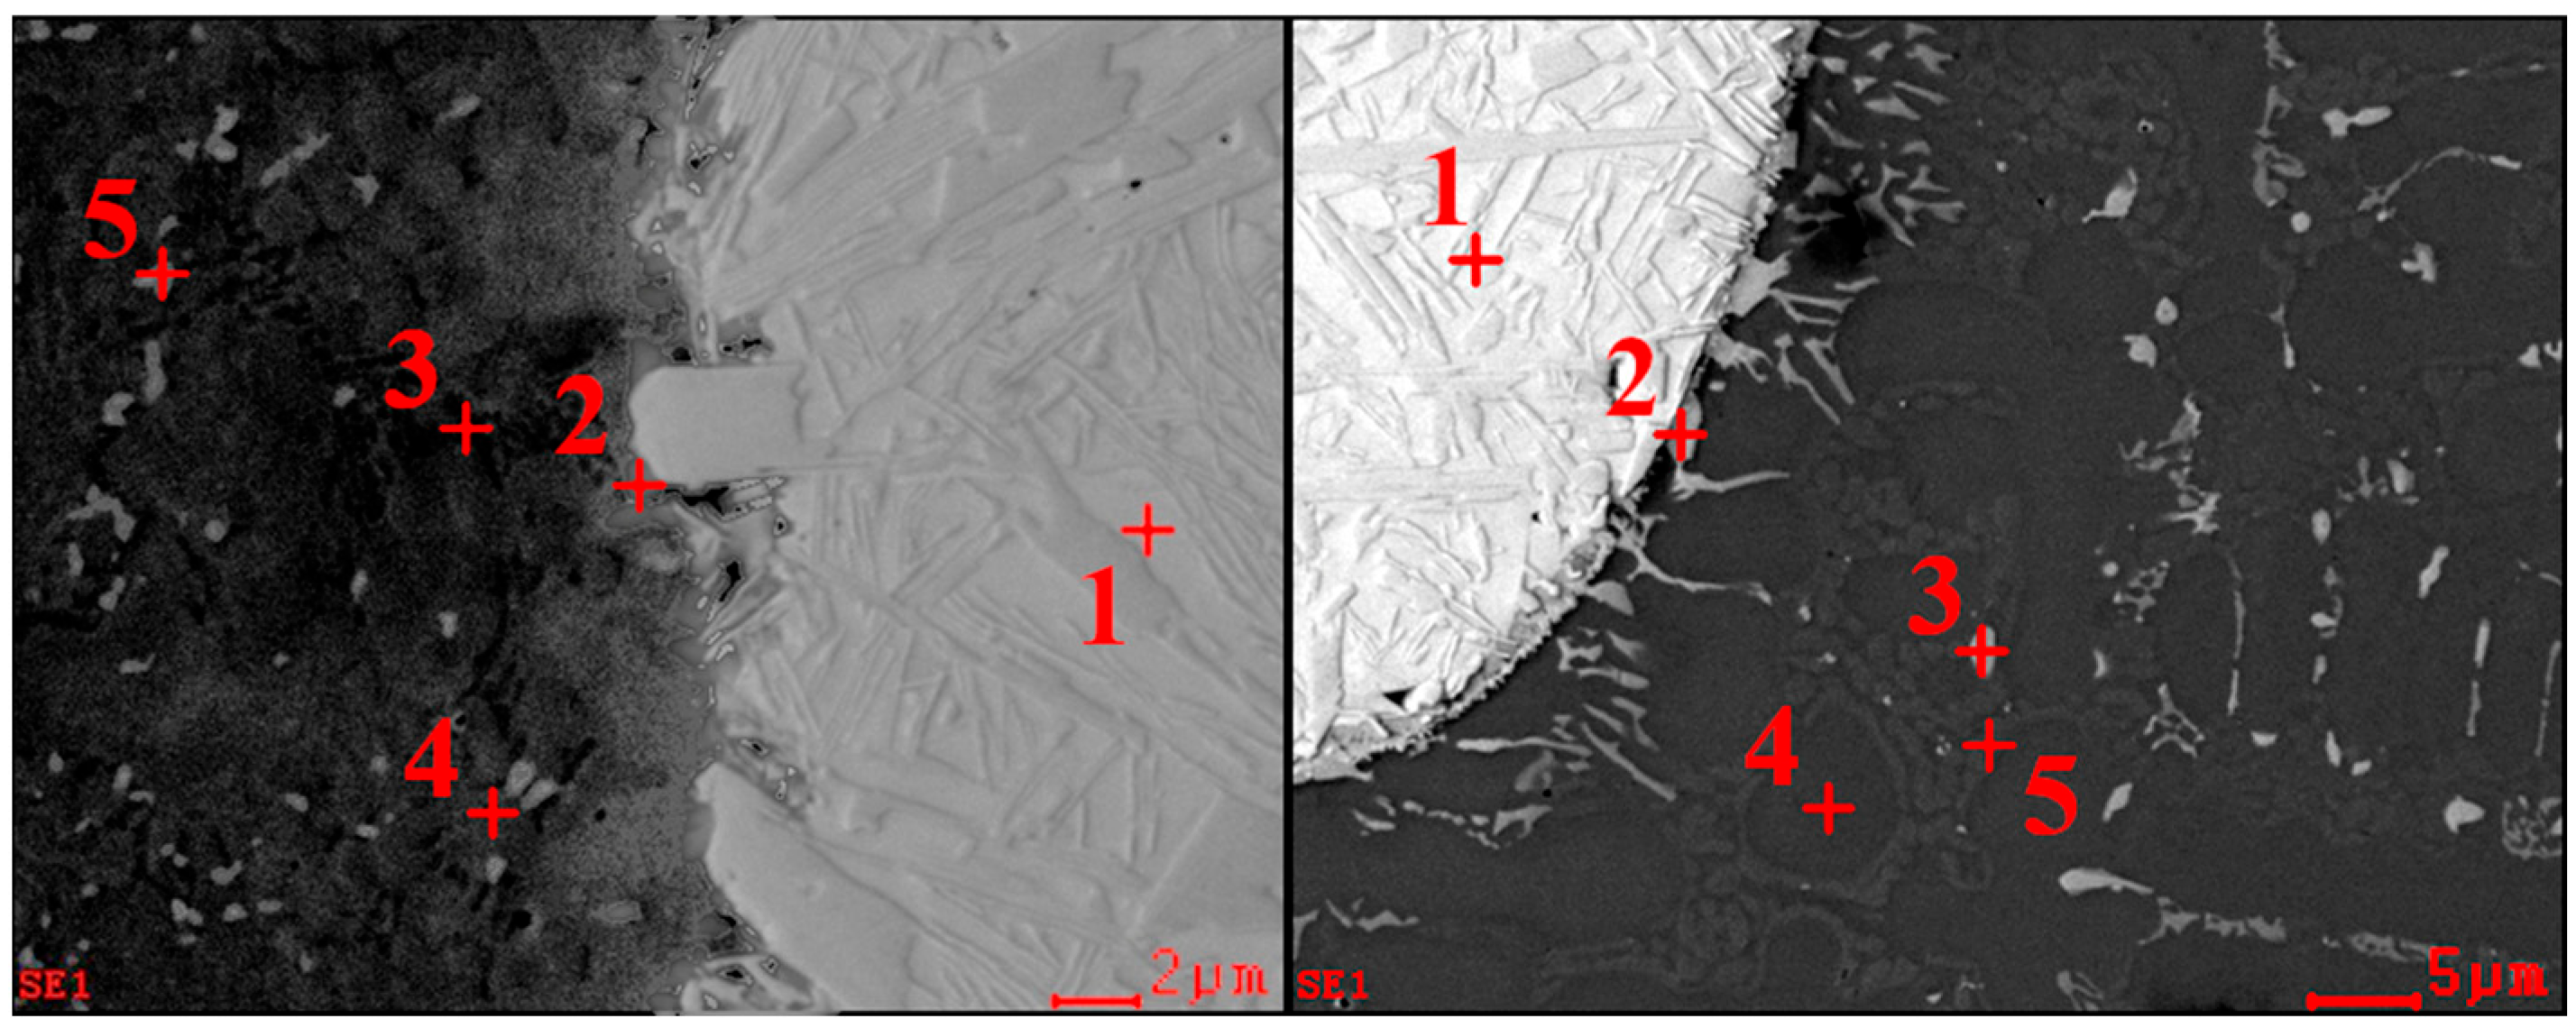
P1 powder EBR beads observed in SEM (Figure 13 and Figure 17) show a clear difference in the microstructure morphology of beads 5 and 8. Bead 5’s microstructure is characterized by an increased proportion of precipitates visible in the SEM photos as dark gray (point 1 in Figure 17 LS) and black (point 2 in Figure 17 LS) homogeneous areas, whose chemical composition analysis (Table 4) showed a high proportion of chromium; additionally, EDS analysis of point 2 in Figure 17 LS showed that these particles also contain a significant amount of boron. Therefore, these are probably chromium borides formed in situ, as in the literature examples. The microstructure of the bead number 5 matrix seen in Figure 13 consists of two phases—a light gray homogeneous phase rich in Ni, which, according to the literature, is a γ-Ni solution rich in submicron precipitates visible as numerous dark spots in the higher magnifications, and a lamellar structure resembling a Ni-Si-B eutectic microstructure [27,28]. Analysis of the lamellar structure in the matrix in point 3 (Figure 17 LS) showed a majority of nickel in the matrix (83.8%), as well as the presence of large amounts of silicon (5.3%). EDS analysis of the γ-Ni solution (point 4 Figure 17 LS) showed higher concentrations of Fe (7.9% compared to 4.0%) and Cr (8.6% compared to 4.7%). The microstructure of bead number 8 is much more homogeneous. It is dominated by the proportion of a homogeneous phase forming macroscopically visible dendrites (Figure 7 RS), whose chemical composition analysis (Table 4) shows a majority proportion of iron (38.9%) and nickel (50.0%), as well as a relatively high content of silicon (3.3% by weight). In the interdendritic space, two types of precipitates with different geometries than in the case of bead number 5 are visible. The precipitates in Figure 17 point 1 RS are rich in chromium and iron, while the precipitates analyzed in point 2 Figure 17 RS are rich in iron and nickel, but in the opposite ratio to the matrix (50.5% Fe and 31.4% Ni by weight), and poor in silicon, while containing a significant amount of boron (3.7%). All of the above leads to the conclusion that an increase in beam power causes a change in chemical composition resulting from an increase in the degree of dilution of the coating with the base material. In addition, an increase in power also causes an increase in the amount of heat introduced, which has a significant impact on the crystallization of multiphase alloys. Bead 8 has a completely different phase composition and microstructure than bead 5. The matrix in bead 8 is rich in iron, unlike bead 5, where Ni dominates. In addition, the strengthening phases in bead 5 are more numerous and do not contain such large amounts of Fe. Furthermore, no Si-rich eutectic was observed in the matrix of bead 8.
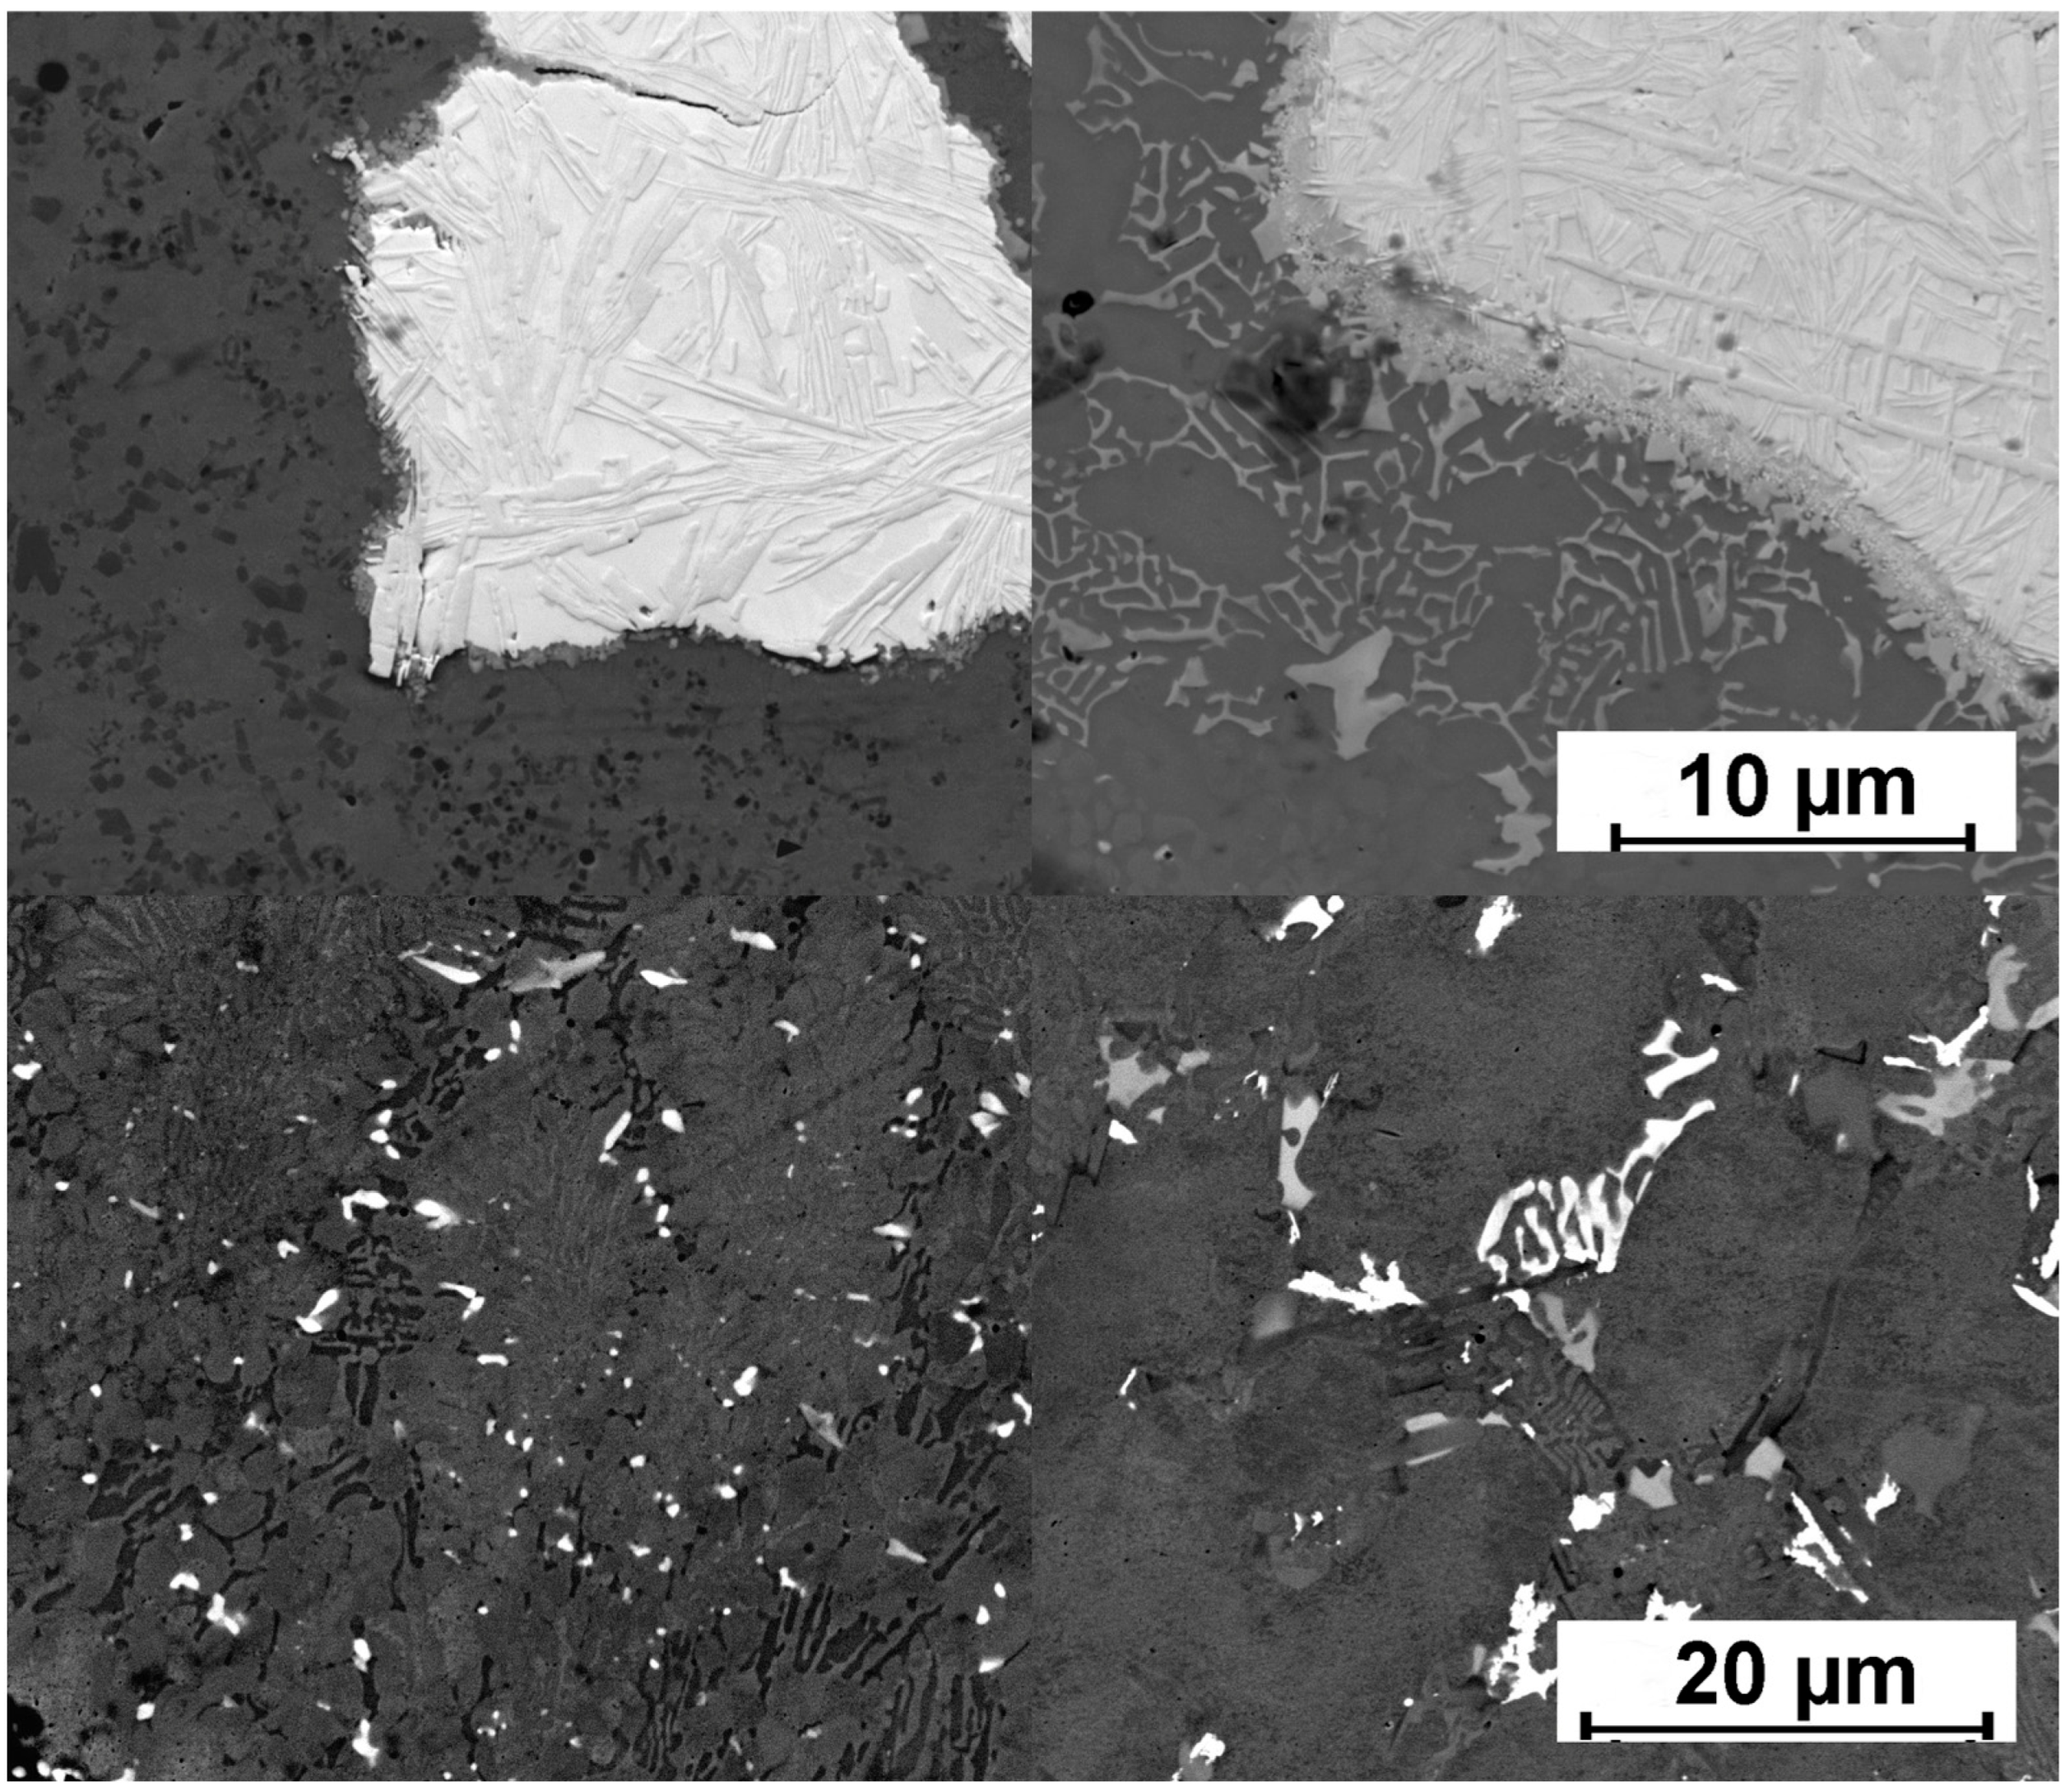
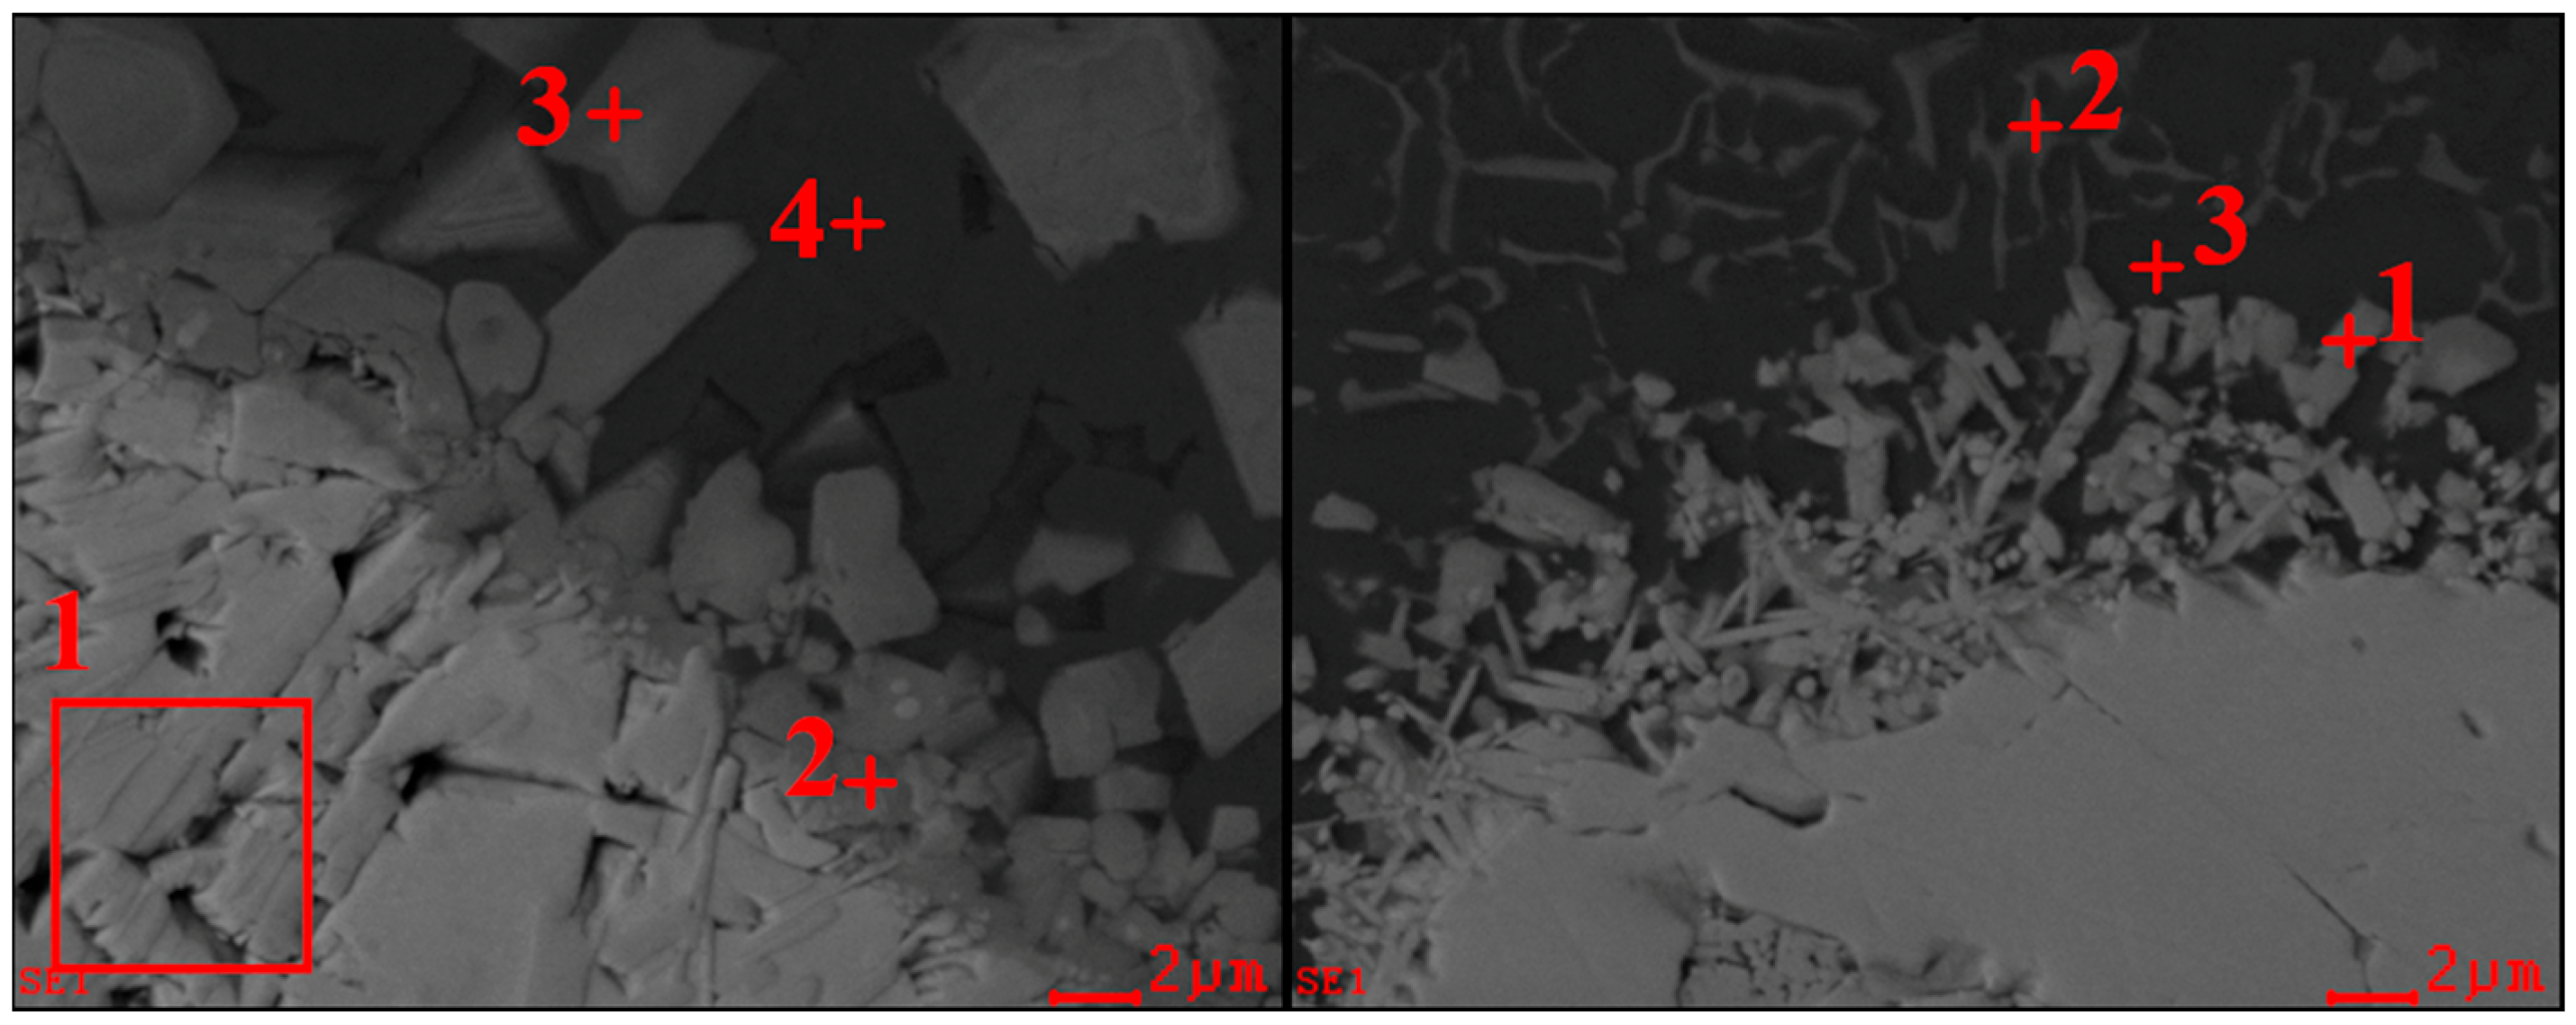
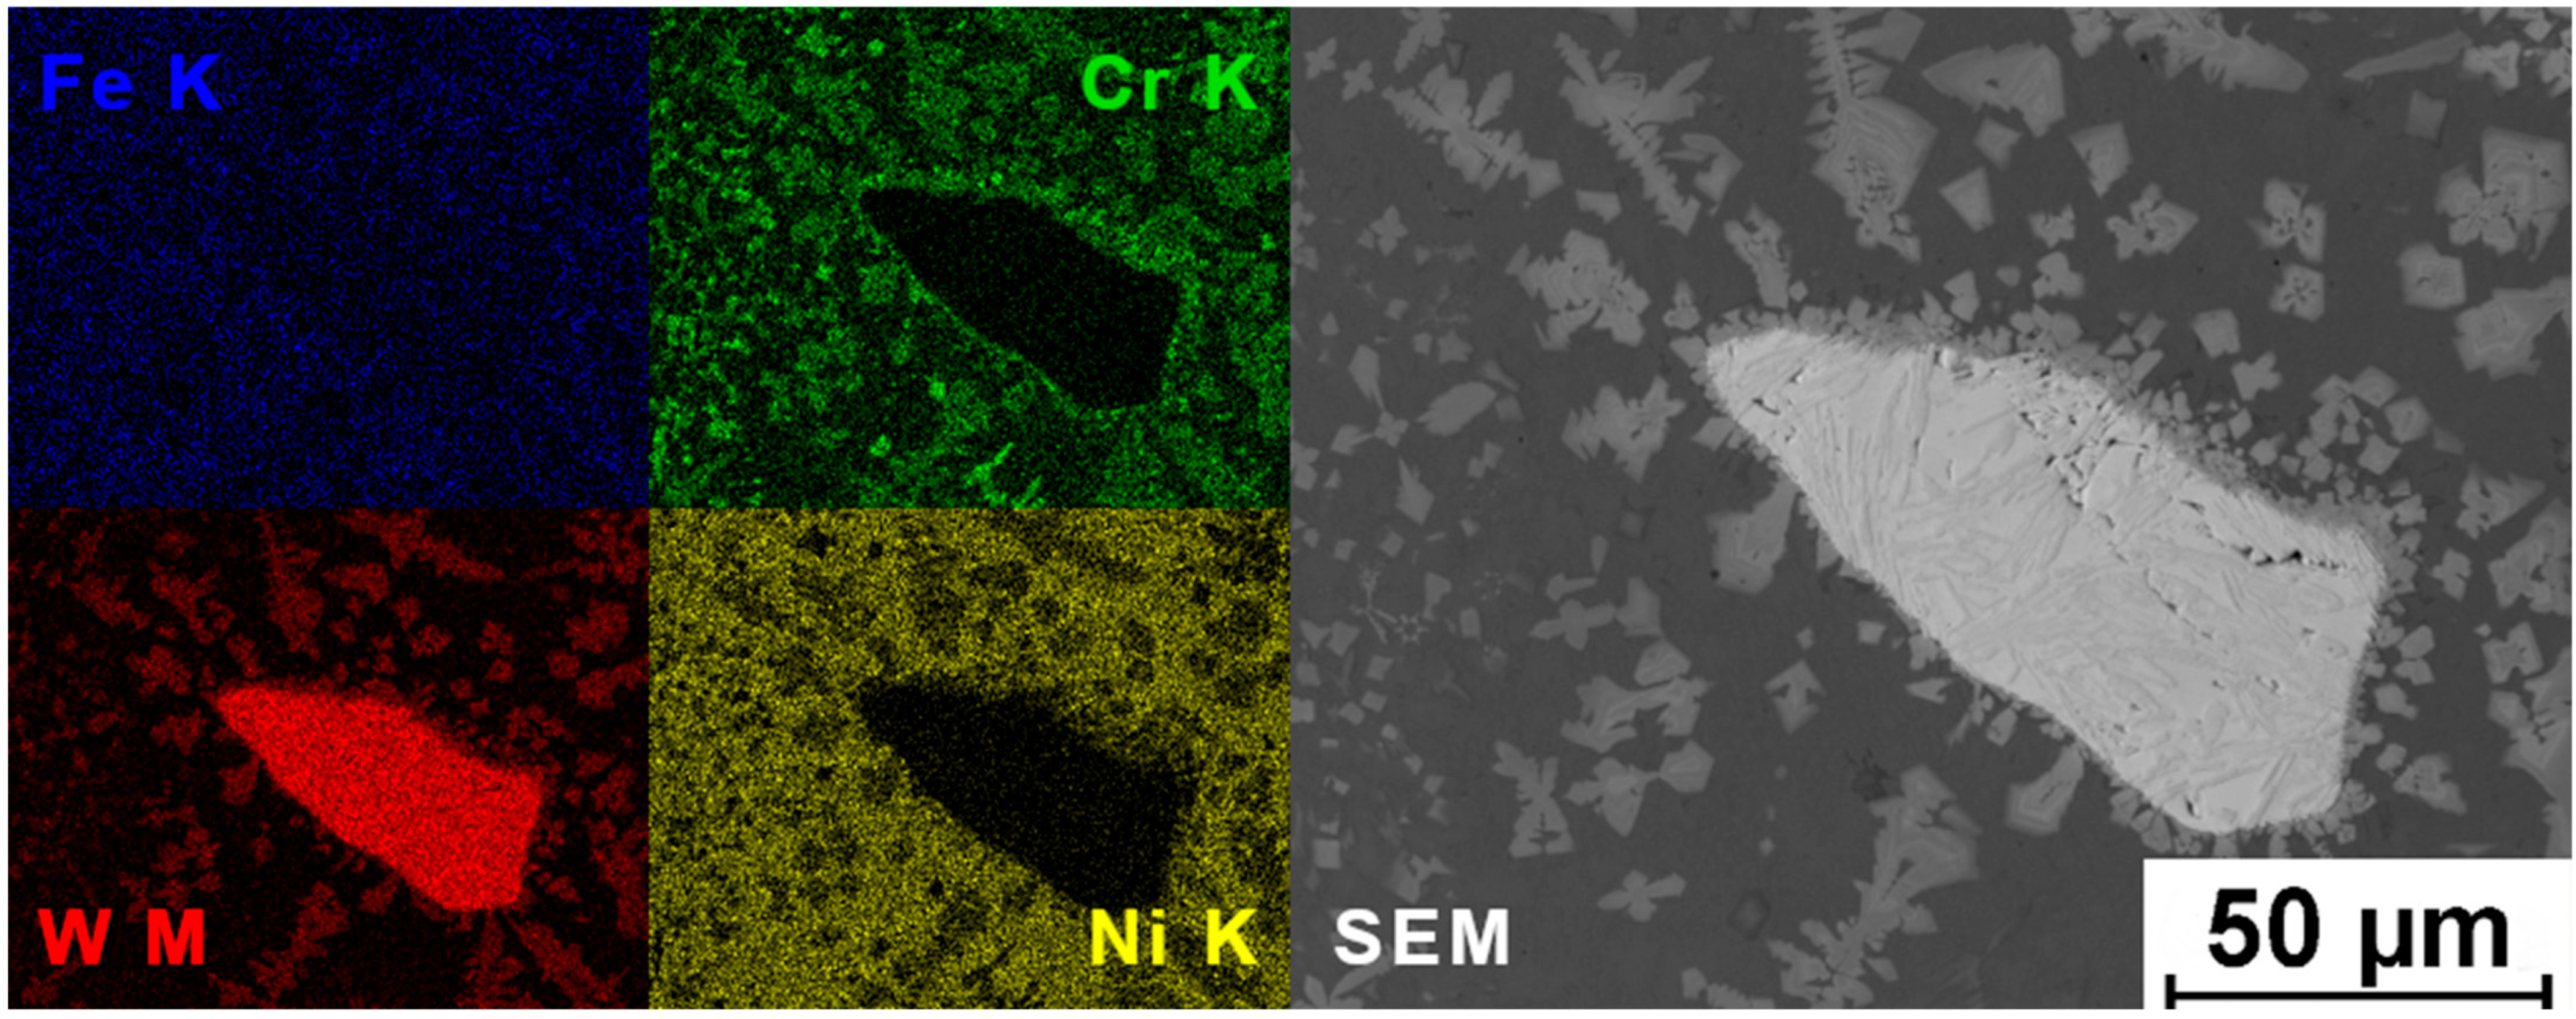
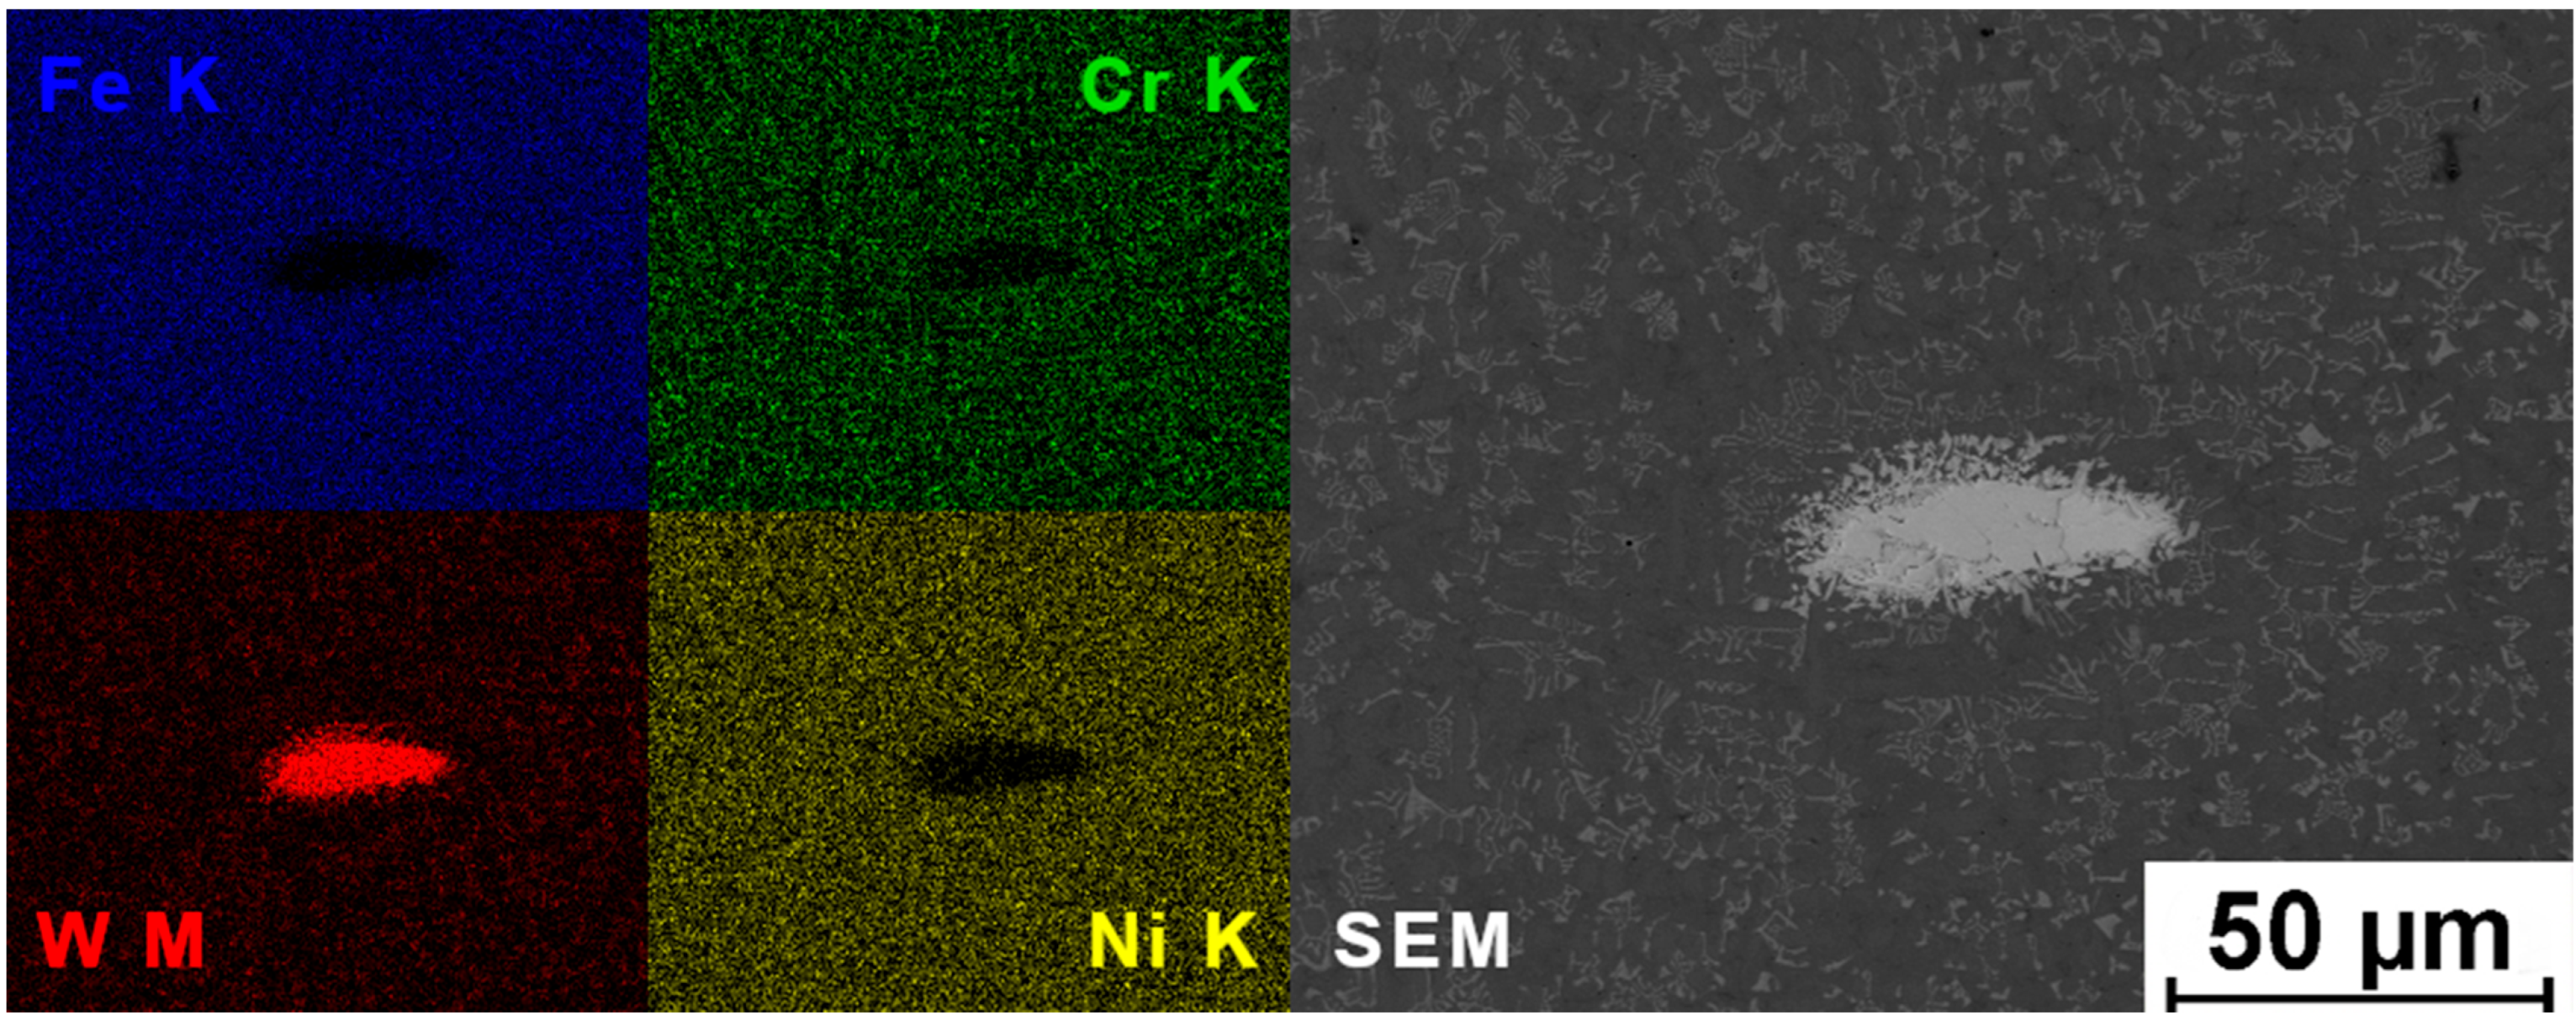
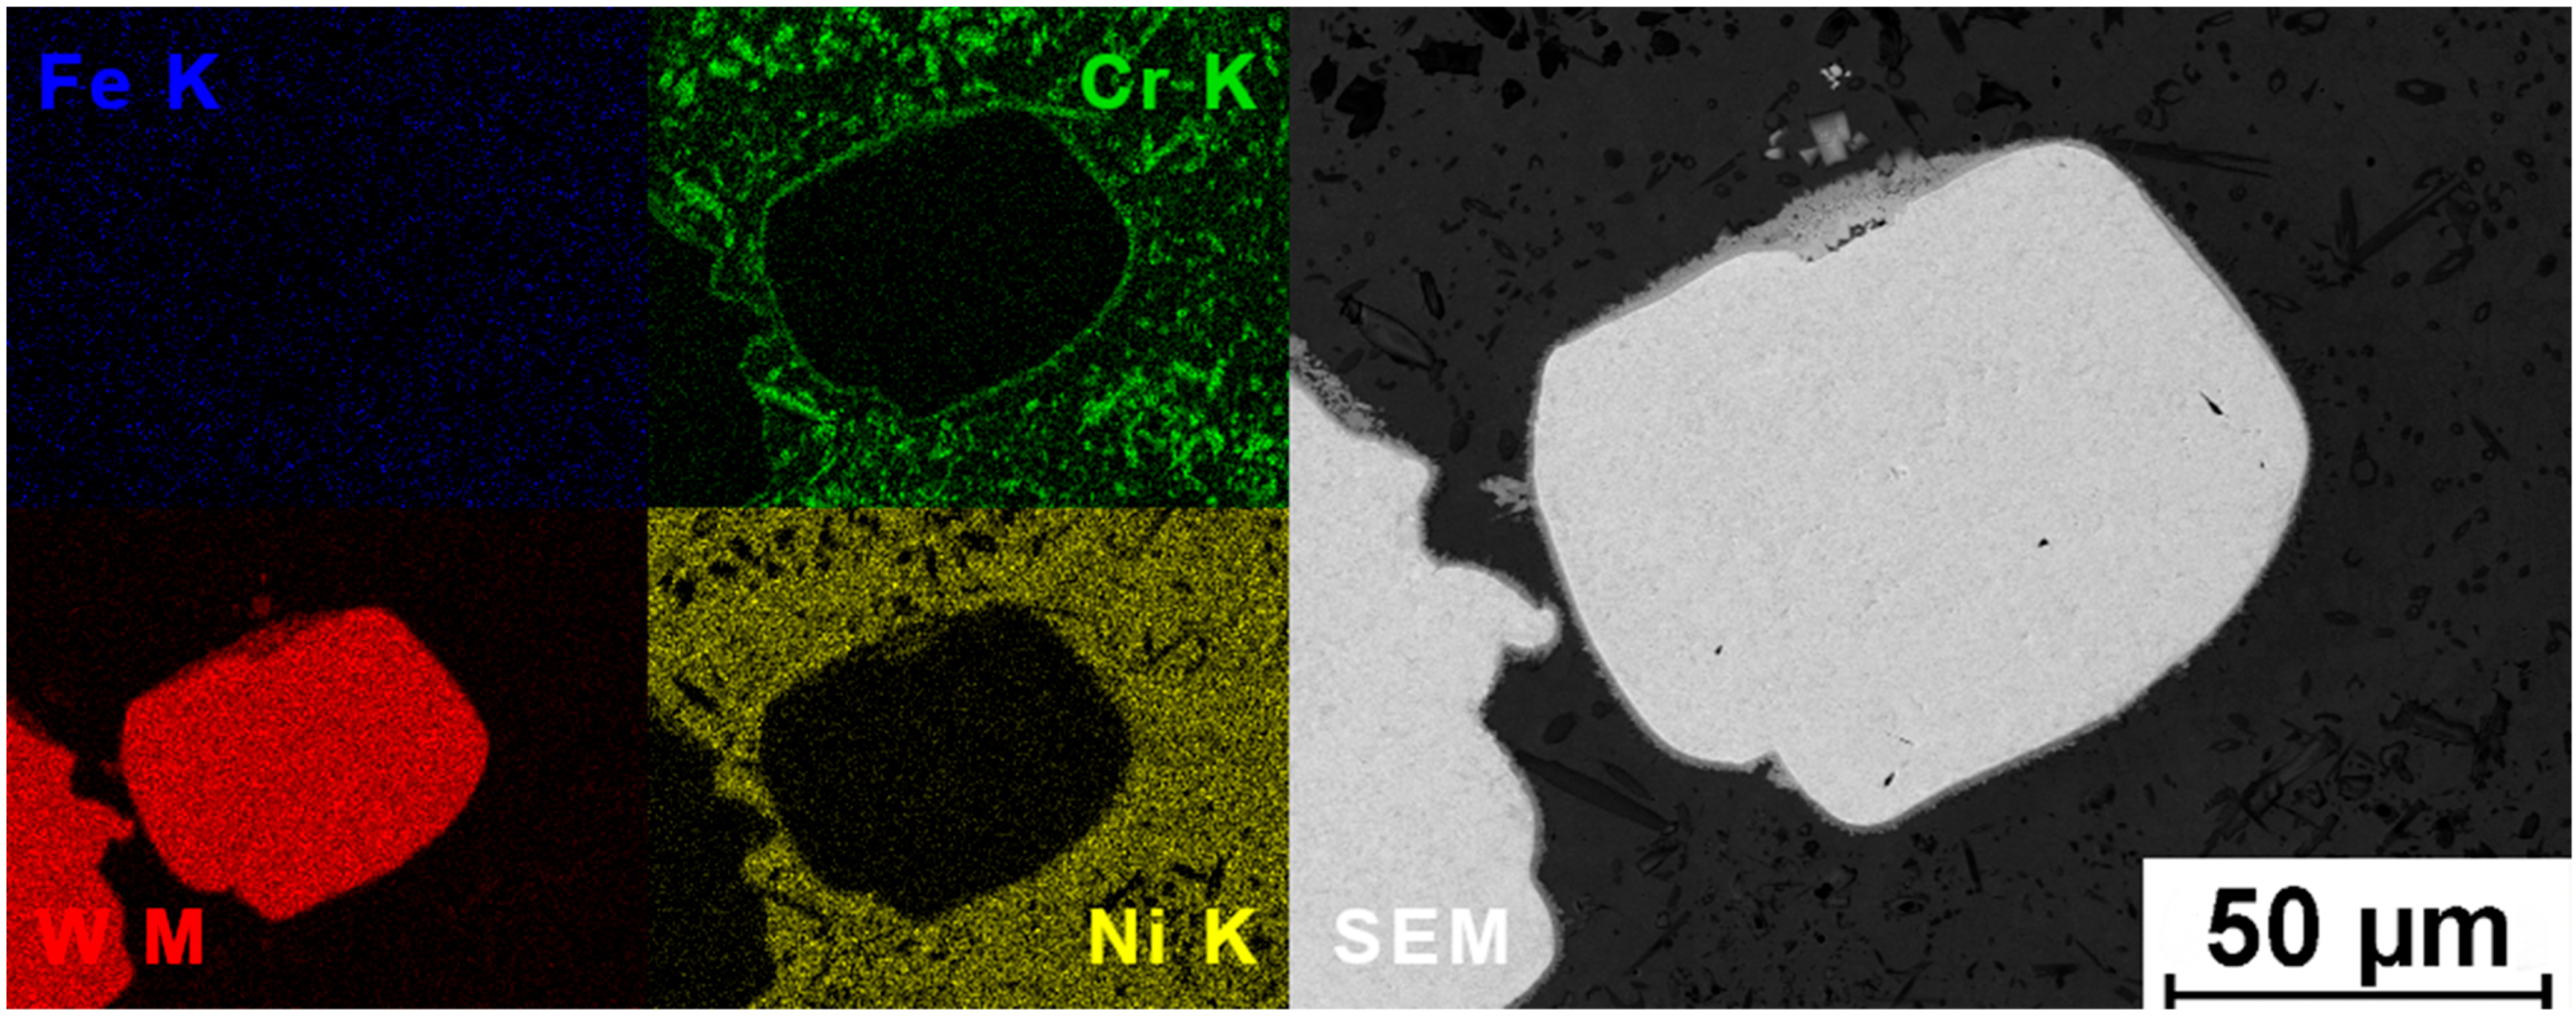
Microscopic analysis of the EBR beads of P2 powder (Figure 14 and Figure 18) shows a clear decrease in the number and size of the reinforcing phase grains in bead number 8 in comparison to bead number 5; the phases have an altered spherical shape, as shown in Figure 10. The matrix in bead 8 has a dominant dendritic structure, while the matrix of bead 5 is characterized by a multiphase structure with a small contribution of Ni-Cr-W-rich dendritic structure. SEM microstructures of WC interfaces visible in Figure 14 and Figure 18 reveal a completely different microstructure morphology. In the case of bead 5, a thin polycrystalline layer (approx. 3–5 μm) forms at the carbide interface, whose chemical composition, shown in Table 5 (point 2 in Figure 18 LS), shows a dominant share of tungsten with a significant share of chromium and nickel. Separations with similar morphology can also be observed at a greater distance from the ex situ-introduced tungsten carbide (point 3 in Figure 18 LS). This indicates its decomposition and the formation of secondary phases in situ. In the case of P2 powder, the tungsten carbide particles are coated with a layer of Ni to ensure better wettability of the strengthening phase by the matrix, in order to hinder the detachment of strengthening phase particles during coating wear. According to the manufacturer, the reinforcing phase used in Metco 36C powder is also supposed to provide a more uniform distribution of particles in the matrix and lower solubility of these particles. However, as shown in a literature example from the analysis of the same powders remelted by a different method [3], the addition of coated tungsten carbide improves the thermal diffusivity of Metco 36C powder (powder P2) compared to Metco15 (powder P1) and FTC-modified Metco15 (powder P3), thus facilitating the thermal decomposition of the strengthening phase during remelting with high-energy heat sources such as an electron beam. Bead 5’s matrix is composed mainly of γ-Ni solution (79.3% wt. Ni). In the case of bead 8, a significantly greater decomposition of the strengthening phase is visible. The polycrystalline layer present in WC bead 5 is no longer observed on the surface of the carbides, while the matrix consists of dendrites and numerous precipitates located in the interdendritic space. As in the case of P1 powder, the dendrites are a γFe/Ni solution containing 41.4% Fe and 48.1% Ni (point 3, Figure 18 RS). Secondary phases located near the ex situ-introduced tungsten carbide (point 1, Figure 18 RS) also contain mostly tungsten (75.1%), but unlike bead 5, they also contain large amounts of iron (8.9%) and nickel (9.7%) with a slightly lower chromium content (6.3%). Precipitates located in the interdendritic space (point 2, Figure 18 RS) contain mostly tungsten (34.5%) but also very high amounts of chromium (16.1%)—the rest is evenly distributed between Fe and Ni. This means that in the case of bead 8, there is also thermal decomposition of strengthening phases (to a much greater extent than in the case of bead 5) and the formation of in situ secondary phases rich in tungsten. In the case of bead 8, however, they also contain large amounts of iron, suggesting its participation in the strengthening of the alloy with secondary precipitates. Also, EDS map-scans in Figure 21 and Figure 22 show long-range tungsten diffusion in the case of both remelted beads. In bead 5 of powder P2 (Figure 21), the visible dendrites are rich in tungsten and chromium and not as much in nickel, which is mostly concentrated in the matrix. Bead 8 EDS map-scan (Figure 22) shows a homogenous chemical distribution of Fe, Cr, Ni, and W in the matrix in the form of Ni-Fe solution dendrites and Cr and W-rich precipitates in the interdendritic space.
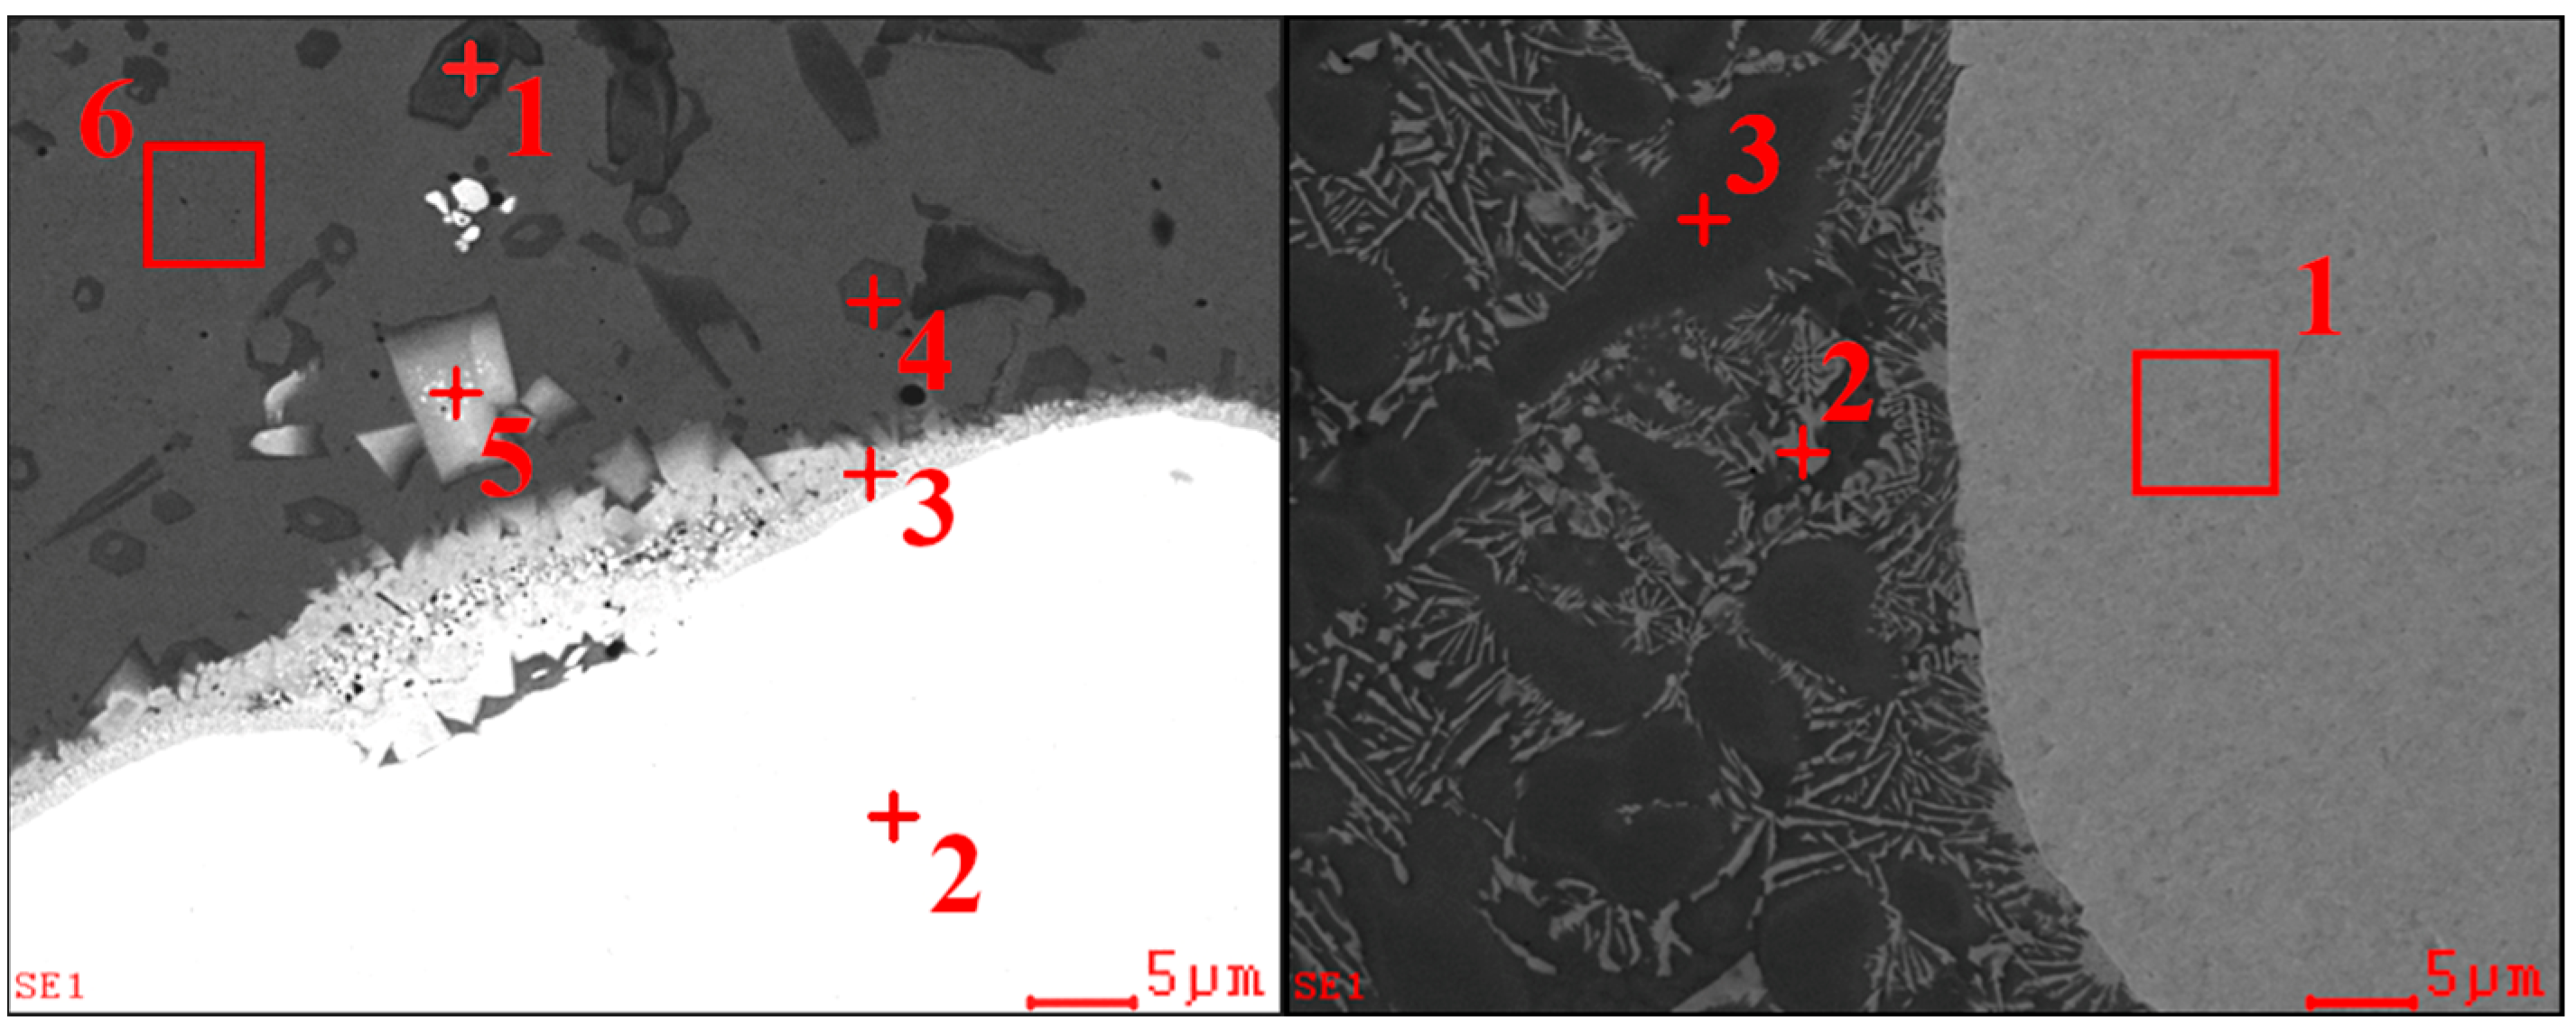
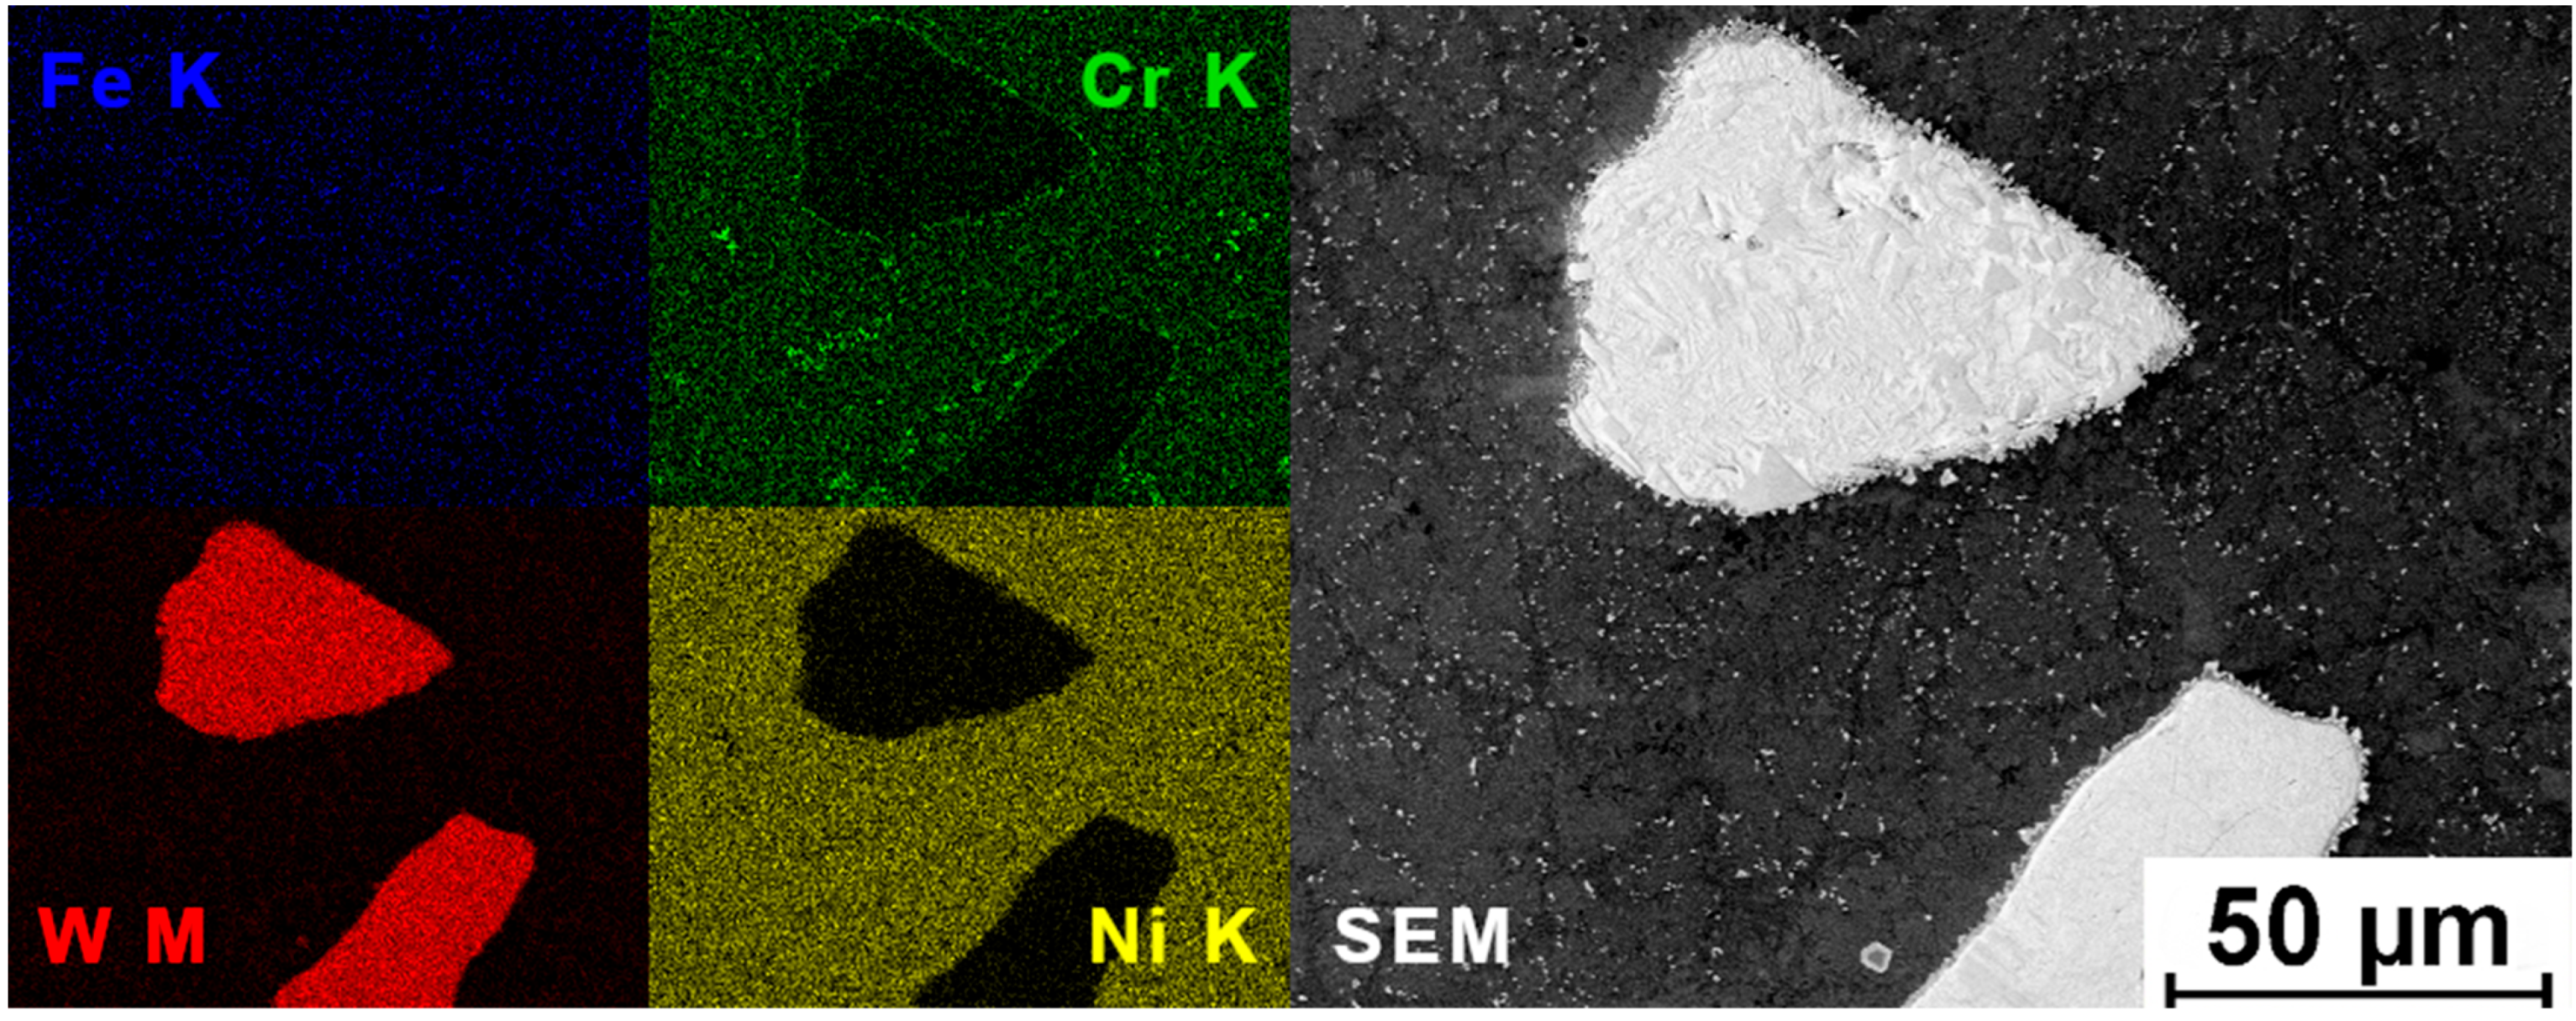
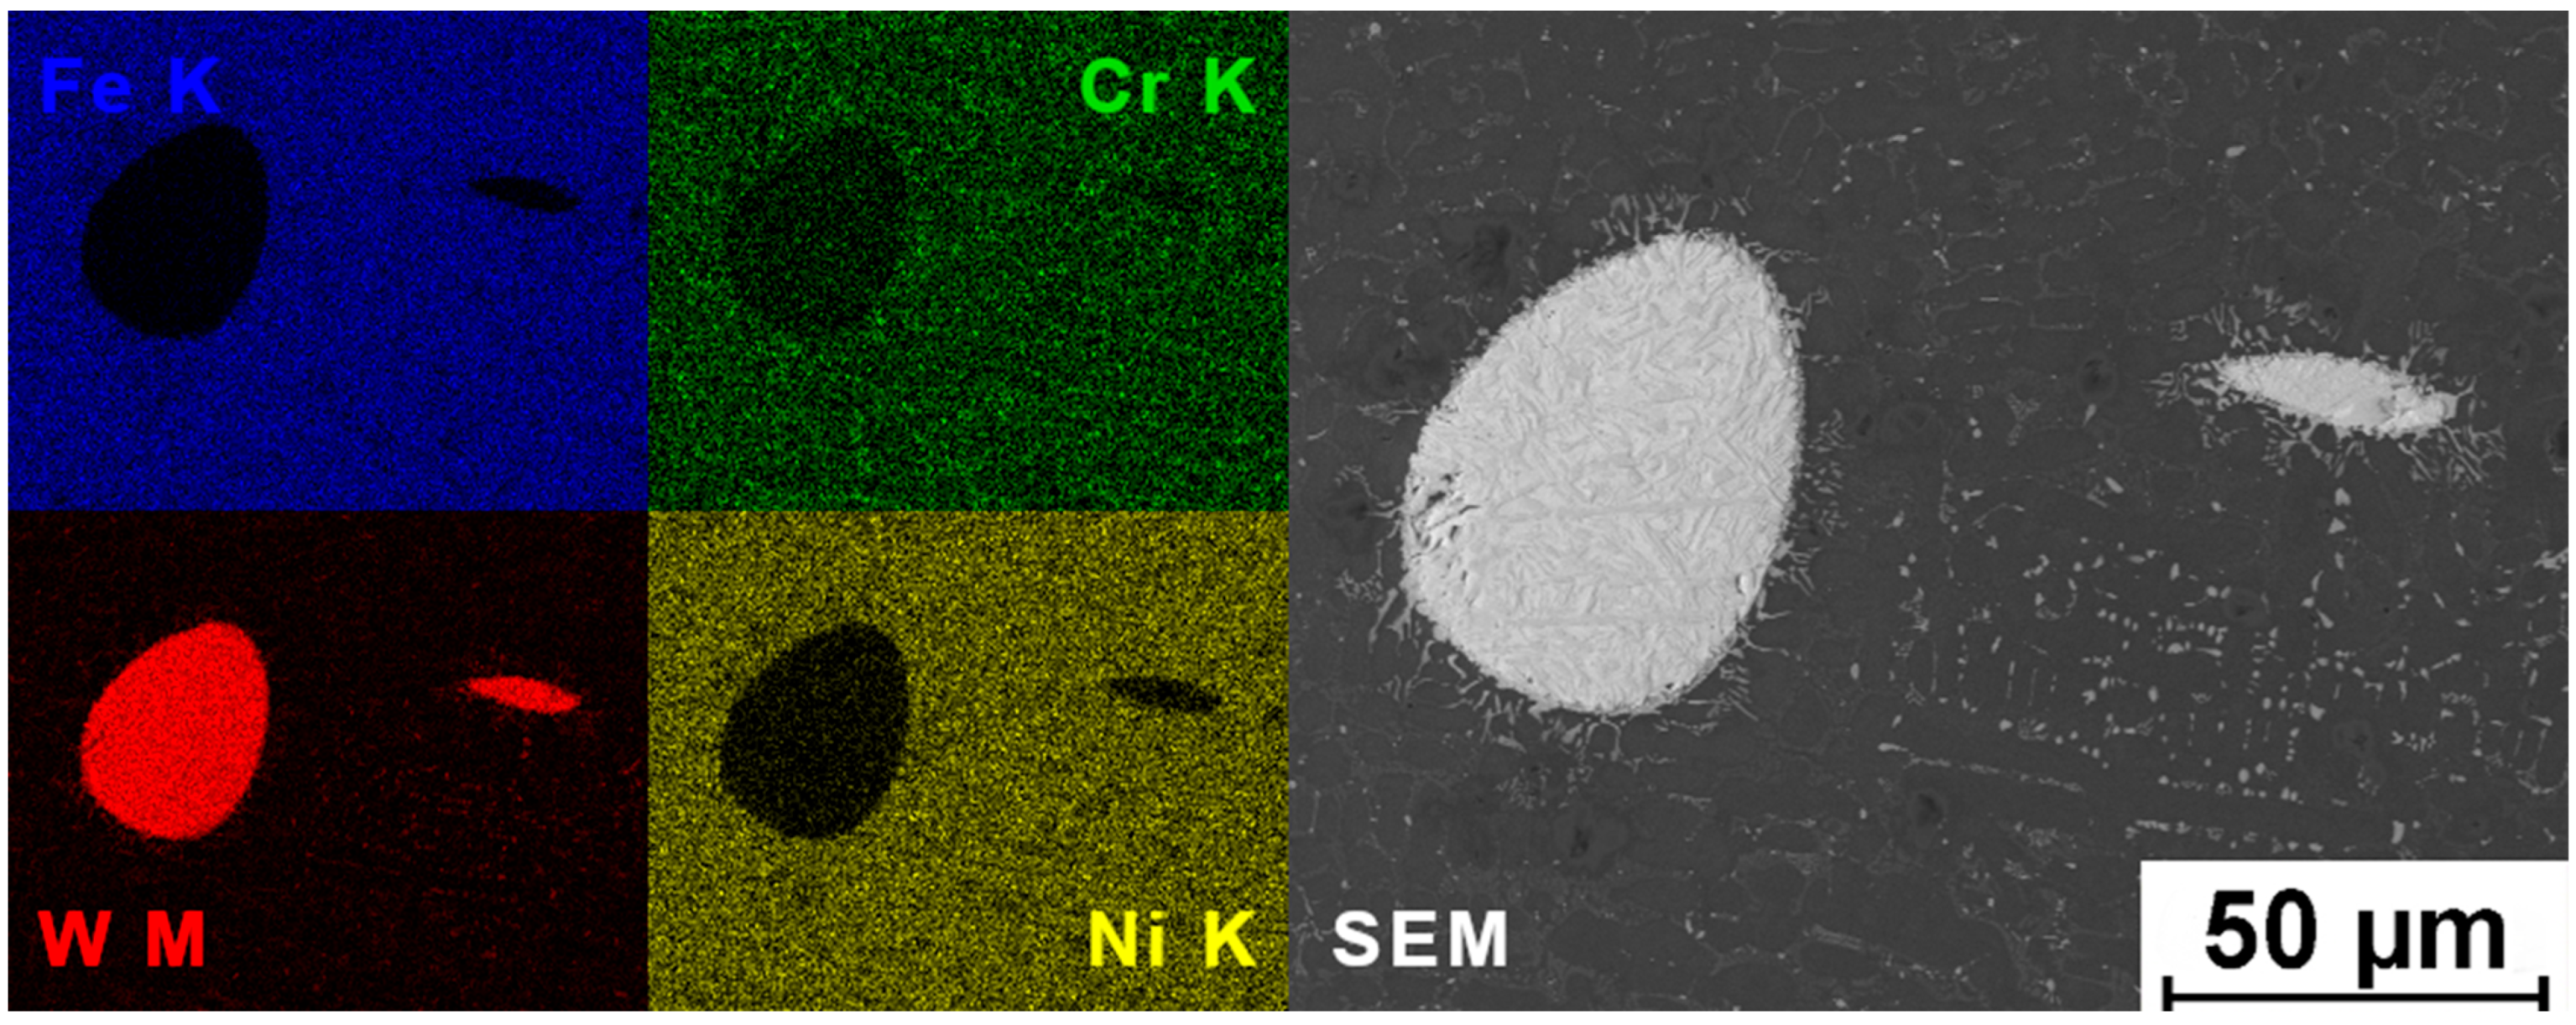
In contrast to P2 powder, there is no clear limitation in the number and size of the reinforcing phase grains in powder P3, as shown in Figure 11. As in the case of the previous powders described, there is a clear difference in the morphology of the microstructures of beads 5 and 8. The tungsten carbide grains in bead number 8, compared to bead number 5, are characterized by rounded edges, but their amount and size were not strongly influenced. These rounded edges are the result of partial dissolution of the tungsten carbide in the matrix. As in the case of the previous powders analyzed, with an increase in the depth of fusion in the case of bead number 8, we observe a dominant share of the dendritic phase, while the matrix of bead number 5 is characterized by a fine-grained multiphase structure similar to the one observed in powder P1—the only visible difference in microstructure that is visible in SEM (Figure 15 and Figure 19) photos is the presence of bright precipitations, which are secondary precipitates containing high amount of tungsten from decomposed FTC. The FTC that is present in powder P3 has a different morphology than the Ni-coated TC that we observed in powder P2. However, the EDS analysis (Figure 19, Table 6) at the FTC interface shows that there is also a visible interlayer that consists of high amounts of tungsten (55.7%) with a lot of Ni (20.2%) and Cr (23.3%). However, this interface has a completely different morphology with a much smaller particle size. The microstructure of the bead number 5 matrix, presented in Figure 15, comprises three distinct phases. The first is a light-gray, homogeneous phase rich in nickel, which, consistent with literature reports, corresponds to a γ-Ni solid solution as in the case of P1 powder. Also, similarly to P1 powder, the second phase exhibits a lamellar morphology. The third phase is the visible bright precipitates. Elemental analysis of the lamellar region (point 3, Figure 19 LS) revealed that, as in the case of the P1 powder matrix of bead 5, it is predominantly composed of nickel (83.5%), with a significant presence of silicon (10.3%). In contrast, EDS analysis of the γ-Ni solid solution (point 4, Figure 19 LS) indicated elevated concentrations of iron (2.1% vs. 1.7%) and chromium (6.5% vs. 4.5%) with much lower silicon (3.0%) and much higher nickel (88.4%) concentrations. The third, bright phase (point 5, Figure 19 LS) is also rich in tungsten with high nickel and chromium concentrations. In the microstructure of bead 8, the polycrystalline layer previously observed on the carbide surfaces in bead 5 is also present, and it is thicker and has a different morphology, contrary to the case of powder P2. The matrix displays a dendritic morphology with numerous precipitates distributed within the interdendritic regions. Similar to the P1 and P2 powders, the dendrites represent a γ-Ni solid solution enriched with iron, containing approximately 44.5% Ni and 47.7% Fe (point 4, Figure 19 RS). The secondary phases located adjacent to the ex situ-introduced WC particles (point 2, Figure 18 RS) consist predominantly of tungsten (77.4%), but also exhibit substantial amounts of iron (12.3%), with reduced chromium (5.7%) and nickel (4.6%) content compared to bead 5. Compared to powder P2, Ni concentration in this region is nearly two times lower, probably due to the Ni-coating of WC particles in powder P2. The lamellar phases within the interdendritic space (point 5, Figure 18 RS) contain high tungsten Fe (53.6%) concentrations, with a lot of Ni (34.7%) and Cr (8.3%). Both the dendrites and the lamellar areas in the interdendritic region share a similar silicon content of 3.7 and 3.4% of Si, respectively. These areas do not contain tungsten. The secondary tungsten carbide precipitates are also located in the interdendritic region, but in the SEM image, they are clearly distinguishable from the rest of the interdendritic space. These precipitates (point 3, Figure 18 RS) share similar chemical composition to the particles visible at the FTC interface, being composed mostly of tungsten (60.0%) with high amount of Fe (21.4%), Cr (10.6%), and Ni (8.0%). Figure 23 EDS map-scan shows that there is a very small visible diffusion of tungsten into the matrix in the case of bead 5. The Ni distribution is very uniform, but the Cr and W are distributed mainly in the form of small precipitates, contrary to the P2 powder where these crystallized in the form of large dendrites. Figure 24 shows that, for bead 8, there is also a lesser diffusion of tungsten into the matrix, mostly in the form of small evenly distributed secondary precipitates, while the Fe, Ni, and Cr are evenly distributed in the matrix. These observations indicate that the phenomena of thermal decomposition of the strengthening phase have occurred to a much lesser extent than in the case of P2 powder in both analyzed beads. However, the decomposition is still occurring, resulting in the in situ formation of secondary tungsten-rich precipitates. Furthermore, the elevated iron content within these precipitates suggests its active participation in secondary phase formation, thereby contributing to the overall strengthening of the alloy matrix, as it was in the case of powder P2.
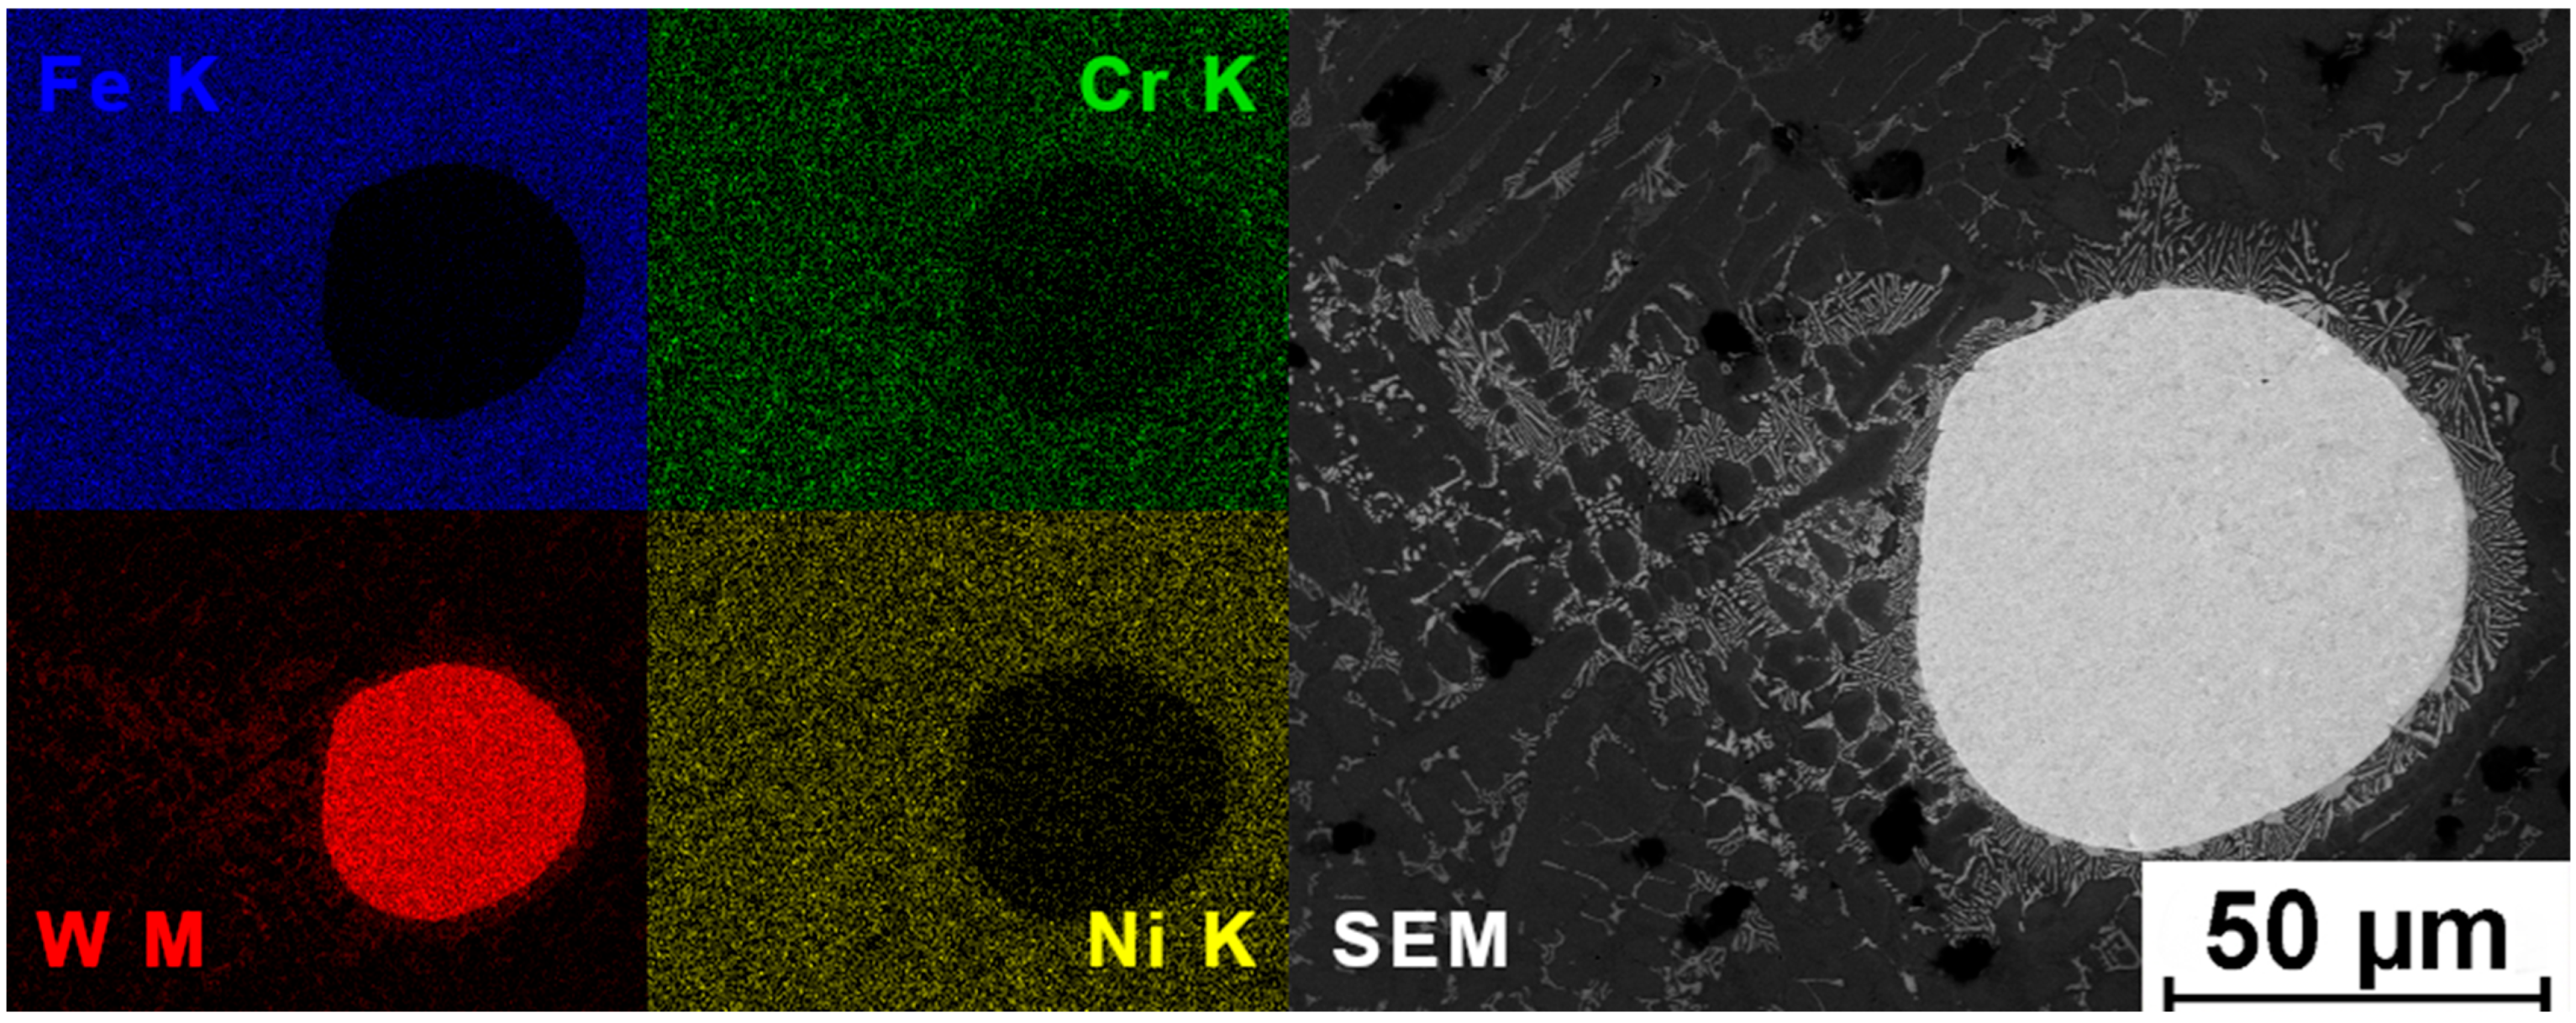
Analysis of the EBR beads of powder P4 (Figure 16 and Figure 20) shows that, for bead no. 5, the microstructure seen in optical microscopy is very similar to the previously analyzed powders, especially the P3 powder. Metallic tungsten particles dissolve (rather than decompose, as in the case of tungsten carbides) to a significant extent as the beam power increases, which is visible in Figure 12. However, the metallic tungsten particles dissolved to a much lesser extent than the decomposition of tungsten carbide particles in the case of P2 powder. SEM studies (Figure 16 LS) revealed the presence of a polycrystalline layer at the boundary of tungsten particles, very similar to those observed in the case of P2 powder. Their morphology is also very similar. EDS analysis showed that the polycrystalline layer (point 3, Figure 20 LS) consists mainly of tungsten (79.3%), as well as chromium (9.2%) and nickel (11.5%). Analysis of the five dark precipitates visible in the matrix (Figure 16 LS and points 4 and 1 in Figure 20 LS) showed that these are chromium compounds (Cr content of 93.3% and 76.3% for points 1 and 4, respectively). The visible light precipitate in the matrix (point 5, Figure 20 LS) contains 59% tungsten and 30% chromium, suggesting that, as in the case of P2 powder, these are secondary secretions of chromium and tungsten carbides. Also, similarly to the P2 powder, in the case of bead 8, there is no polycrystalline layer on the interface of the metallic tungsten particles (Figure 16 RS). Also, the matrix consists of two phases, γ-Ni solid solution (point 3 Figure 20 RS) containing 57.5% of Fe and 33.1% of Ni, and a lamellar interdendritic phase (point 2 Figure 20 RS) containing mostly tungsten (74%). The above statements are confirmed by the EDS map-scans visible in images 25 and 26.
Although boron is a critical alloying element in many Ni-based self-fluxing coatings, its quantification using EDS is highly unreliable due to several intrinsic physical and instrumental limitations. EDS is optimized for elements with atomic numbers above 10. Boron emits a Kα X-ray line at ~0.183 keV, which is very low. These photons are easily absorbed by both the detector window and the sample itself, leading to poor detection efficiency. At such low energies, the Bremsstrahlung background is high, and boron’s signal is very weak, producing poor peak resolution and high uncertainty in quantification. Surface oxides, hydrocarbons, or residual polishing compounds can further obscure boron’s signal since boron X-rays are emitted from only a few nanometers depth due to their short escape path. Additionally, in multi-element NiCrBSi coatings, boron peaks can overlap with other low-energy X-ray emissions or electronic noise, making deconvolution unreliable. Even when detected, quantitative results for boron can have errors exceeding ±50% due to uncertain absorption and fluorescence corrections in EDS algorithms. EDS may qualitatively suggest boron’s presence but cannot accurately measure its concentration. For precise compositional or phase analysis, WDS (Wavelength-dispersive X-ray spectroscopy) or XPS (X-ray photoelectron spectroscopy) are the preferred methods [29,30]. Therefore, only P1 powder was analyzed for boron presence, and the results should be taken with caution in light of the facts mentioned above.
The papers cited in the introduction [3,4,6,10,24,25] showed that XRD analyses of laser or electron beam remelted NiCrBSi coatings consistently identify γ-Ni-rich phase (Ni-Cr solid solution) as the main phase present, accompanied by Ni3B, CrB, Cr2B, and Ni3Si as hard secondary phases. In WC-reinforced systems, residual WC, W2C, and Cr7C3 and combined W-Cr carbides are also commonly present. The relative intensities of these peaks vary with processing parameters and substrate dilution, reflecting the strong influence of thermal input on phase evolution. The results we obtained for electron beam melting largely coincide with the results obtained for laser beam melting of the same powders by another Polish team of scientists, E. Szajna et al., who [3] determined that the deposited energy, the chemical composition of the coating powders—particularly the presence of WC carbides—and the mutual interactions between the alloying elements of the coating and the substrate alloy, including thermally activated mixing and phase transformations, exert a predominant influence on the microstructural evolution during the remelting of NiCrBSi-type self-fluxing alloys. Another crucial aspect to be considered involves the thermal properties of the materials used for coating deposition, particularly their thermal diffusivity and heat capacity. These parameters significantly affect the rate of energy (temperature) redistribution and, consequently, can also determine the thickness of the heat-affected zone (HAZ), the degree of dilution, and the final iron concentration within the coating.
Based on the hardness measurements shown in Figure 27, it can also be concluded that, as the proportion of the dendritic phase increases, resulting from the increase in the proportion of substrate in the structure, the average hardness of the obtained beads decreases. The graph shows that, for the P1 powder, the coating can be diluted with the base material by up to around 15%–16% before the hardness of the matrix drops down significantly.
The hardness tests of all the powders with reinforcing phases, shown in Table 8, revealed a marked decrease in the hardness in the matrix of all the tested powders. For powder P1, the decrease was the largest, dropping more than three times from 665 to 221 HV0.1 on average. The addition of strengthening phases resulted in an increase in hardness in both bead 5 and bead 8 of each of the analyzed powders. In addition, this addition caused a significant reduction in the decrease in hardness in the matrix in the case of bead 8 compared to bead 5, probably through the formation of secondary precipitates resulting from the decomposition of tungsten carbides (or metallic tungsten in the case of powder P4), but also by changing the crystallization conditions through different cooling conditions resulting from different thermal diffusivity values of the powders. The highest hardness is characteristic of the matrix in bead 5 for powder P3, reaching an average hardness of 881 +/− 40 HV0.1. This is an increase of 32.5% compared to the corresponding bead in powder P1, and also a value greater than powders P2 and P4 by 12.2% and 24.4%, respectively. For bead 5 of all powders, the hardness values near the strengthening phase and further away from it do not differ significantly, unlike bead 8, where the hardness differences between these two areas can be up to 156 HV0.1 in the case of P4 powder. This suggests, as confirmed by EDS testing, increased diffusion of tungsten (and carbon in the case of tungsten carbides as strengthening phases) in the case of bead 8 remelted with a higher beam power, due to the increased amount of thermal energy supplied during the process. Interestingly, P3 powder, which exhibits the highest hardness in the case of bead 5, also exhibits the lowest matrix hardness in both areas in the case of bead 8. Interestingly, the P3 powder, which exhibits the highest hardness in the case of bead 5, also exhibits the lowest matrix hardness in both areas in the case of bead 8, which also means that it is characterized by the greatest decrease in hardness with increasing electron beam power.
Hardness tests showed that the Ni-coated WC phase in powder P2 has a hardness approximately 20% lower than the FTC phase in powder P3. This is probably due to the increased content of harder W2C. The metallic tungsten phase present in powder P4 was characterized by a hardness of 438–445 HV0.1 in both analyzed beads.


5. Conclusions

The conducted research has shown the validity of using electron remelting technology to produce coatings based on NiCrBSi alloys. Based on the results, the following can be concluded:
  • The electron beam remelting process makes it possible to homogenize the chemical composition and remove discontinuities such as porosity, characteristic of thermally sprayed coatings. Electron beam remelting also ensures metallurgical bonding of the coating to the substrate, while thermally sprayed coatings are mechanically and adhesively bonded to the substrate.
  • The electron beam remelting process, compared to flame remelting, provides greater control over the process due to precise control over the remelting parameters as well as a fully automated process also allowing a large area to be remelted due to the ability to dynamically deflect the beam (up to 250 mm wide for the CVE Xw150:30 machine mounted in Łukasiewicz—the Upper Silesian Institute of Technology).
  • Tests conducted on the example of P1 powder (Metco 15E Ni-17Cr-3.5B-4Si-4Fe-1C) show a linear relationship between beam power and the depth of fusion. As the depth of fusion increases, the proportion of the substrate material in the obtained coating also increases. In the case of powders based on NiCrBSi alloys sprayed on steels, this affects the increase in the proportion of the iron- and nickel-rich soft dendritic phase, which leads to a decrease in hardness. This phenomenon was observed for all the powders tested.
  • The analysis shows that, for the P1 powder (Metco 15E Ni-17Cr-3.5B-4Si-4Fe-1C), the coating can be diluted with the base material by up to around 15%–16% before the hardness of the matrix drops down significantly.
  • The best properties had the electron beam remelted sample sprayed with P3 powder (Metco 15E Ni-17Cr-3.5B-4Si-4Fe-1C + FTC), bead no. 5, whose hardness of both the matrix (881 HV0.1 avg.) and the reinforcing phase (2546 HV0.1 avg.) significantly exceeded the other samples analyzed. This is probably related to the presence of a fine-grained multiphase structure with a lamellar submicron structure, as well as the presence of numerous tungsten-rich secondary precipitates. Therefore, the custom-made P3 powder is the most suitable for electron beam remelting among the four powders tested.
  • The reinforcing phase of the sample sprayed with P2 powder (Metco 36C Ni-17.5Cr-4B-4Si-4Fe-0.5C + WC/Ni) showed a much higher propensity to dissolve into the matrix than in the case of P3 powder (Metco 15E Ni-17Cr-3.5B-4Si-4Fe-1C + FTC), even though the particles were coated with a layer of metallic nickel to impede diffusion. In the case of P2 powder bead no. 5, the tungsten-rich secondary separations had a relatively large size and a distinctly dendritic structure compared to the other powders tested.
The fact that, even with increased beam power, it was not possible to achieve complete melting of the tungsten particles means that the process of adding metallic tungsten to produce in situ carbides and borides in the case of powder P4 (Metco 15E Ni-17Cr-3.5B-4Si-4Fe-1C + W-met) was not entirely successful. This is probably due to the fact that the particles used were too large and, under electron melting conditions (short thermal cycles, short beam exposure time), they could not melt, and long-range diffusion could not occur.
7.
The addition and the form of the strengthening phase (its phase composition and whether it is covered with a metallic layer) have a key influence on its thermal decomposition ratio and on the formation of the surrounding matrix after remelting. Recent studies show that this is due to differences in thermal diffusivity and heat capacity of the sprayed powders.

Author Contributions

Conceptualization, P.Ś.; methodology, P.Ś.; validation, P.Ś.; formal analysis, P.Ś. and M.K.; investigation, P.Ś., P.P., W.S. and M.K.; resources, K.S. and W.S.; data curation, P.Ś.; writing—original draft preparation, P.Ś.; writing—review and editing, A.N.W. and P.Ś.; visualization, P.Ś. and M.K.; supervision, P.Ś. and A.N.W. All authors have read and agreed to the published version of the manuscript.

Funding

This research was carried out in 2022 in Łukasiewicz—the Upper Silesian Institute of Technology, within the framework of the project titled “Development of technological conditions for remelting of laser and electron beam thermal sprayed coatings”. Funded from the institute’s own resources.

Institutional Review Board Statement

Not applicable.

Informed Consent Statement

Not applicable.

Data Availability Statement

The raw data supporting the conclusions of this article will be made available by the authors on request.

Acknowledgments

All equipment used for testing was owned by Łukasiewicz—the Upper Silesian Institute of Technology, Center for Mechanics and Surface Engineering Ltd. Company, and AGH University of Krakow. All equipment used for testing was validated according to normative requirements by the relevant notified bodies or equipment manufacturers.

Conflicts of Interest

Author Wojciech Szymański was employed by the company Centrum Mechaniki i Inżynierii Powierzchni Ltd. The remaining authors declare that the research was conducted in the absence of any commercial or financial relationships that could be construed as a potential conflict of interest.

Abbreviations

The following abbreviations are used in this manuscript:
EBElectron Beam
EBRElectron Beam Remelting
LBLaser Beam
LBRLaser Beam Remelting
LMLight Microscopy
SEMScanning Electron Microscopy
XRDX-Ray Diffraction
FZFusion Zone
TZTransition Zone
BMBase Material
HAZHeat Affected Zone
TSThermal Spray
FSFlame Spray
LSLeft Side
RSRight Side
FTCFused Tungsten Carbide

References

  1. Węglowski, M.S.; Jachym, R.; Krasnowski, K.; Kwieciński, K.; Pikuła, J.; Śliwiński, P. Electron Beam Melting of Thermally Sprayed Layers—Overview. Biul. Inst. Spaw. 2021, 3, 7–19. [Google Scholar] [CrossRef] [PubMed]
  2. Szymanski, K.; Formanek, B.; Grabowski, A.; Senderowski, C. Struktura natryskiwanych płomieniowo, przetopionych i napawanych laserowo powłok z proszku NiCrSiB.(eng. The structure of flame sprayed, remelted and laser hardfaced NiCrBSi coatings.). Inżynieria Mater. 2006, 6, 1036–1039. (In Polish) [Google Scholar]
  3. Szajna, E.; Moskal, G.; Tupaj, M.; Dresner, J.; Dudek, A.; Szymański, K.; Tomaszewska, A.; Trzcionka-Szajna, A.; Mikuśkiewicz, M.; Łysiak, K. The influence of laser remelting on microstructural changes and hardness level of flame-sprayed NiCrBSi coatings with tungsten carbide addition. Surf. Coat. Technol. 2024, 478, 130403. [Google Scholar] [CrossRef]
  4. Serres, N.; Hlawka, F.; Costil, S.; Langlade, C.; Machi, F. Microstructures and mechanical properties of metallic NiCrBSi and composite NiCrBSi–WC layers manufactured via hybrid plasma/laser process. Appl. Surf. Sci. 2011, 257, 5132–5137. [Google Scholar] [CrossRef]
  5. Serres, N.; Hlawka, F.; Costil, S.; Langlade, C.; Machi, F. An investigation of the mechanical properties and wear resistance of NiCrBSi coatings carried out by in situ laser remelting. Wear 2011, 270, 640–649. [Google Scholar] [CrossRef]
  6. Serres, N.; Hlawka, F.; Costil, S.; Langlade, C.; Machi, F. Microstructures and environmental assessment of metallic NiCrBSi coatings manufactured via hybrid plasma spray process. Surf. Coat. Technol. 2010, 205, 1039–1046. [Google Scholar] [CrossRef]
  7. Serres, N.; Hlawka, F.; Costil, S.; Langlade, C.; Machi, F. Microstructures of Metallic NiCrBSi Coatings Manufactured via Hybrid Plasma Spray and In Situ Laser Remelting Process. J. Therm. Spray Technol. 2011, 20, 336–343. [Google Scholar] [CrossRef]
  8. Chen, L.Y.; Wang, H.; Zhao, C.; Lu, S.; Wang, Z.X.; Sha, J.; Chen, S.; Zhang, L.C. Automatic remelting and enhanced mechanical performance of a plasma sprayed NiCrBSi coating. Surf. Coat. Technol. 2019, 369, 31–43. [Google Scholar] [CrossRef]
  9. Gonzalez, R.; Cadenas, M.; Fernández, R.; Cortizo, J.; Rodríguez, E. Wear behaviour of flame sprayed NiCrBSi coating remelted by flame or by laser. Wear 2007, 262, 301–307. [Google Scholar] [CrossRef]
  10. Gonzalez, R.; Garcia, M.; Peñuelas, I.; Cadenas, M.; Fernández, M.d.R.; Battez, A.H.; Felgueroso, D. Microstructural study of NiCrBSi coatings obtained by different processes. Wear 2007, 263, 619–624. [Google Scholar] [CrossRef]
  11. Yan, M.; Zhu, W.Z. Surface remelting of Ni-Cr-B-Si cladding with a micro-beam plasma arc. Surf. Coat. Technol. 1997, 92, 157–163. [Google Scholar] [CrossRef]
  12. Liu, J.; Bolot, R.; Costil, S.; Planche, M.P. Transient thermal and mechanical analysis of NiCrBSi coatings manufactured by hybrid plasma spray process with in-situ laser remelting. Surf. Coat. Technol. 2016, 292, 132–143. [Google Scholar] [CrossRef]
  13. Yang, H.; Shi, M.; Zhao, E.; Wang, Q.; Liu, H.; Hao, J. Microstructure evolution of laser cladded NiCrBSi coating assisted by an in-situ laser shock wave. J. Mater. Process. Technol. 2023, 321, 118132. [Google Scholar] [CrossRef]
  14. Hamatani, H.; Miyazaki, Y. Optimization of an electron beam remelting of HVOF sprayed alloys and carbides. Surf. Coat. Technol. 2002, 154, 176–183. [Google Scholar] [CrossRef]
  15. Utu, D.; Brandl, W.; Marginean, G.; Cartis, I.; Serban, V.A. Morphology and phase modification of HVOF-sprayed MCrAlY-coatings remelted by electron beam irradiation. Vacuum 2005, 77, 451–455. [Google Scholar] [CrossRef]
  16. Gavendová, P.; Čížek, J.; Čupera, J.; Hasegawa, M.; Dlouhý, I. Microstructure modification of CGDS and HVOF sprayed CoNiCrAlY bond coat remelted by electron beam. Procedia Mater. Sci. 2016, 12, 89–94. [Google Scholar] [CrossRef]
  17. Pogrebnjak, A.D.; Ruzimov, S.M.; Alontseva, D.L.; Żukowski, P.; Karwat, C.; Kozak, C.; Kolasik, M. Structure and properties of coatings on Ni base deposited using a plasma jet before and after electron a beam irradiation. Vacuum 2007, 81, 1243–1251. [Google Scholar] [CrossRef]
  18. Dragos, U.; Gabriela, M.; Waltraut, B.; Ioan, C. Improvement of the oxidation behaviour of electron beam remelted MCrAlY coatings. Solid State Sci. 2005, 7, 459–464. [Google Scholar] [CrossRef]
  19. Marginean, G.; Utu, D. Microstructure refinement and alloying of WC–CoCr coatings by electron beam treatment. Surf. Coat. Technol. 2010, 205, 1985–1989. [Google Scholar] [CrossRef]
  20. Marginean, G.; Frunzaverde, D.; Utu, D.; Crîsta, R.; Brandl, W. Influence of Electron Beam and Laser Remelting on the Oxidation Behaviour of HVOF-sprayed CoNiCrAlYCoatings. Berg Huettenmaenn Monatsh 2007, 152, 32–38. [Google Scholar] [CrossRef]
  21. Cizek, J.; Matejkova, M.; Kouril, J.; Cupera, J.; Dlouhy, I. Potential of New-Generation Electron Beam Technology in Interface Modification of Cold and HVOF Sprayed MCrAlY Bond Coats. Adv. Mater. Sci. Eng. 2016, 2016, 6. [Google Scholar] [CrossRef]
  22. Krajňáková, P.; Gouvêa, L.; Čupera, J.; Jan, V.; Dlouhý, I.; Spotz, Z. Influence of multiple electron-beam remeltings on the characteristics of HVOF and CGDS sprayed conicraly coatings. Mater. Technol. 2018, 52, 289–293. [Google Scholar] [CrossRef]
  23. Petrov, P. Electron beam surface remelting and alloying of aluminum alloys. Vacuum 1997, 48, 49–50. [Google Scholar] [CrossRef]
  24. Zhao, G.; Guo, Q.; Li, Y.; Li, J.; Ma, L.; Li, H. Wear behavior of electron beam remelting modified Ni/WC thermal spray coatings. Surf. Coat. Technol. 2024, 494, 131336. [Google Scholar] [CrossRef]
  25. Li, J.; Guo, Q.; Tang, Q.; Zhao, G.; Li, H.; Ma, L. Effect of electron beam remelting on microstructure and wear properties of HVOF Ni/WC coatings. Wear 2024, 558–559, 205560. [Google Scholar] [CrossRef]
  26. St Węglowski, M.; Śliwiński, P.; Dymek, S.; Kalemba-Rec, I.; Kapuściński, M.; Wrona, A.; Kustra, K. A comprehensive study on the microstructure of plasma spraying coatings after electron beam remelting. J. Phys. Conf. Ser. 2023, 2443, 012005. [Google Scholar] [CrossRef]
  27. Goldstein, J.I.; Newbury, D.E.; Michael, J.R.; Ritchie, N.W.; Scott, J.H.J.; Joy, D.C. Scanning Electron Microscopy and X-Ray Microanalysis. In Kluwer Academic, Microscopy and Microanalysis; Springer: Berlin/Heidelberg, Germany, 2003. [Google Scholar]
  28. Newbury, D.E.; Ritchie, N.W.M. Performing elemental microanalysis with high accuracy and high precision by scanning electron microscopy/silicon drift detector energy-dispersive X-ray spectrometry (SEM/SDD-EDS). J. Mater. Sci. 2015, 50, 493–518. [Google Scholar] [CrossRef]
  29. Homolová, V.; Čiripová, L. Experimental Investigation of Isothermal Section of the B-Cr-Fe Phase Diagram at 1353 K. Adv. Mater. Sci. Eng. 2017, 2017, 2703986. [Google Scholar] [CrossRef]
  30. Pereira, J.C.; Taboada, M.C.; Niklas, A.; Rayón, E.; Rocchi, J. Influence of the Chemical Composition on the Solidification Path, Strengthening Mechanisms and Hardness of Ni-Cr-Si-Fe-B Self-Fluxing Alloys Obtained by Laser-Directed Energy Deposition. J. Manuf. Mater. Process. 2023, 7, 110. [Google Scholar] [CrossRef]
Figure 1. Electron beam welding machine used in this work. On the left is an example of a thermally sprayed sample attached to an aluminum block and mounted on the work table of an electron beam welding machine inside the vacuum chamber. On the right is the Cambridge Vacuum Engineering model CVE 756 XW150:30.
Coatings 16 00175 g001
Figure 2. Representation of the oscillation pattern of the double broken curve.
Coatings 16 00175 g002
Figure 3. Cross-sections of all the electron beam remelted beads of powder P3. Numbers presented in the photos correspond to the numbers of beads presented in Table 2 and Table 3.
Coatings 16 00175 g003
Figure 4. Graph of the dependence of fusion depth on beam power for each of the remelted beads.
Coatings 16 00175 g004
Figure 5. Cross-section microstructure of the fusion line of bead no. 5, powder P2.
Coatings 16 00175 g005
Figure 6. Cross-section microstructure of powder P1. Left: after thermal spraying; right: after electron beam remelting, bead no. 2.
Coatings 16 00175 g006
Figure 7. Cross-section microstructure of EBR beads of powder P1. From left to right, beads no. 1 to 4 in sequence.
Coatings 16 00175 g007
Figure 8. Cross-section microstructure of EBR beads of powder P1. From left to right, beads no. 5 to 8 in sequence.
Coatings 16 00175 g008
Figure 9. Cross-section microstructure of EBR beads of powder P1. From left to right, beads no. 9 to 12 in sequence.
Coatings 16 00175 g009
Figure 10. Comparison of the microstructures in powder P2 on the example of beads no. 5 (left) and 8 (right). Cross-section microstructure.
Coatings 16 00175 g010
Figure 11. Comparison of the microstructures in powder P3 on the example of beads no. 5 (left) and 8 (right). Cross-section microstructure.
Coatings 16 00175 g011
Figure 12. Comparison of the microstructures in powder P4 on the example of beads no. 5 (left) and 8 (right). Cross-section microstructure.
Coatings 16 00175 g012
Figure 13. Comparison of the SEM microstructures in powder P1 on the example of beads no. 5 (left) and 8 (right). Cross-section microstructure.
Coatings 16 00175 g013
Figure 14. Comparison of the SEM microstructures in powder P2 on the example of beads no. 5 (left) and 8 (right). Cross-section microstructure.
Coatings 16 00175 g014
Figure 15. Comparison of the SEM microstructures in powder P3 on the example of beads no. 5 (left) and 8 (right). Cross-section microstructure.
Coatings 16 00175 g015
Figure 16. Comparison of the SEM microstructures in powder P4 on the example of beads no. 5 (left) and 8 (right). Cross-section microstructure.
Coatings 16 00175 g016
Figure 17. EDS analysis points and areas shown on SEM photograph of microstructures in EBR beads no. 5 (left) and no. 8 (right) for powder P1. Chemical compositions relative to presented points are shown in Table 4.
Coatings 16 00175 g017
Figure 18. EDS analysis points and areas shown on SEM photograph of microstructures in EBR beads no. 5 (left) and no. 8 (right) for powder P2. Chemical compositions relative to presented points are shown in Table 5.
Coatings 16 00175 g018
Figure 19. EDS analysis points and areas shown on SEM photograph of microstructures in EBR beads no. 5 (left) and no. 8 (right) for powder P3. Chemical compositions relative to presented points are shown in Table 6.
Coatings 16 00175 g019
Figure 20. EDS analysis points and areas shown on SEM photograph of microstructures in EBR beads no. 5 (left) and no. 8 (right) for powder P4. Chemical compositions relative to presented points are shown in Table 7.
Coatings 16 00175 g020
Figure 21. Results of EDS map-scan of Cr, Fe, Ni, and W distribution in EBR bead no. 5 for powder P2.
Coatings 16 00175 g021
Figure 22. Results of EDS map-scan of Cr, Fe, Ni, and W distribution in EBR bead no. 8 for powder P2.
Coatings 16 00175 g022
Figure 23. Results of EDS map-scan of Cr, Fe, Ni, and W distribution in EBR bead no. 5 for powder P3.
Coatings 16 00175 g023
Figure 24. Results of EDS map-scan of Cr, Fe, Ni, and W distribution in EBR bead no. 8 for powder P3.
Coatings 16 00175 g024
Figure 25. Results of EDS map-scan of Cr, Fe, Ni, and W distribution in EBR bead no. 5 for powder P4.
Coatings 16 00175 g025
Figure 26. Results of EDS map-scan of Cr, Fe, Ni, and W distribution in EBR bead no. 8 for powder P4.
Coatings 16 00175 g026
Figure 27. Graph of the dependence of the average hardness of the obtained beads on the proportion of substrate for powder P1.
Coatings 16 00175 g027
Table 1. Chemical compositions of remelted powders.
No. of PowderTrade NamesChemical Composition [% wt.]
ShareMatrixShareReinforcement
NiCrBSiFeCWCNiFTC
(WC + W2C)
W-Met
P1Oerlikon Metco 15E100bal.173.5441-----
P2Oerlikon Metco 36C65bal.17.54440.535928--
P3FTC + 15E50bal.173.544150--100-
P4W-met + 15E50bal.173.544150---100
Table 2. Remelting parameters of the target batch to be tested.
No. of Melted Bead
123456789101112
Beam current, mA101520258101316681012
Melting speed, mm/min1501501501507575757575757575
Deflection pattern14141414141414141111
Table 3. List of the calculated values of substrate material share in correlation to the depth of fusion in the remelted beads of the sample sprayed with P1 powder.
No. of Bead123456789101112
Depth of fusion, µm1505701280191013034065072001906401050
Substrate, % vol.16.241.553.168.810.417.024.226.1016.520.433.3
Table 4. EDS analysis chemical compositions (% wt.) for powder P1.
ElementBead No. 5Bead No. 8.
1234123
BK0.07.60.00.00.03.70.0
CrK79.584.04.78.642.613.77.8
FeK5.42.94.07.942.950.538.9
NiK15.05.583.878.214.531.450.0
SiK0.00.07.55.30.00.73.3
Table 5. EDS analysis chemical compositions (% wt.) for powder P2.
ElementBead No. 5Bead No. 8.
1234123
WM100.074.352.90.075.134.50.0
CrK0.011.521.89.06.316.16.3
FeK0.00.71.86.68.927.641.4
NiK0.013.523.579.39.721.848.1
SiK0.00.00.05.10.00.04.2
Table 6. EDS analysis chemical compositions (% wt.) for powder P3.
ElementBead No. 5Bead No. 8.
1234512345
WM10055.70.00.034.410077.460.0--
CrK0.023.34.56.519.9-5.710.64.18.3
FeK0.00.81.72.101.9-12.321.447.753.6
NiK0.020.283.588.443.8-4.68.044.534.7
SiK0.0-10.33.0----3.73.4
Table 7. EDS analysis chemical compositions (% wt.) for powder P4.
ElementBead No. 5Bead No. 8.
123456123
WM0.010079.30.059.00.010074.00.0
CrK93.30.09.276.330.26.10.04.65.3
FeK0.00.00.00.01.73.40.014.957.5
NiK3.80.011.520.19.184.10.06.533.1
SiK2.90.00.03.60.06.40.00.04.1
Table 8. Hardness results of selected beads in all the tested powders.
PowderMeasured AreaBead 5Bead 8
Average Hardness, HV0.1Standard Deviation HV0.1Maximum Hardness, HV0.1Average Hardness, HV0.1Standard Deviation, HV0.1Maximum Hardness, HV0.1
P1Matrix6654874922117270
P2Ni-coated WC2055171236217943282257
Matrix near-WC7885792560867756
Matrix7855590350058647
P3WC-FTC2546359299626892303035
Matrix near-WC87027914538103735
Matrix8814093946022495
P4Pure W4452550543822493
Matrix near-W7084882760143743
Matrix7263979244521501
Disclaimer/Publisher’s Note: The statements, opinions and data contained in all publications are solely those of the individual author(s) and contributor(s) and not of MDPI and/or the editor(s). MDPI and/or the editor(s) disclaim responsibility for any injury to people or property resulting from any ideas, methods, instructions or products referred to in the content.