Article

The Influence of PEO Process Parameters on the Mechanical and Sclerometric Properties of Coatings on the Ultralight Magnesium Alloy LA141

1
Institute of Materials Engineering, Faculty of Science and Technology, University of Silesia in Katowice, 75 Pułku Piechoty 1a, 41-500 Chorzów, Poland
2
Faculty of Chemistry, Silesian University of Technology, 44-100 Gliwice, Poland
*
Author to whom correspondence should be addressed.
Coatings 2025, 15(8), 961; https://doi.org/10.3390/coatings15080961
Submission received: 25 July 2025 / Revised: 12 August 2025 / Accepted: 16 August 2025 / Published: 18 August 2025
(This article belongs to the Section Corrosion, Wear and Erosion)

Abstract

This study explores the influence of significant manufacturing parameters, i.e., peak current density and frequency, on the oxide coatings’ micromechanical and sclerometric properties. The parameter levels were determined using a full experimental design with two variables at three levels. Plasma electrolytic oxidation (PEO) was conducted on an ultralight LA141 magnesium alloy in an alkaline ternary electrolyte. Coating performance was characterized by measuring hardness (HIT) and Young’s modulus (EIT), as well as three loads significant to coating failure: Lc1, the initiation of Hertzian tensile cracks; Lc2, the initiation of cohesive coating failure; and Lc3, full delamination of the coating. Scratch testing was complemented by profilographic analysis to provide isometric surface images. Statistical analysis was then employed to ascertain correlations of process parameters with the developed mechanical and sclerometric properties.

1. Introduction

Magnesium alloys have garnered significant interest in recent years due to their exceptionally low density, high specific strength and stiffness, and excellent machinability [1]. Electrolyte composition has an extremely crucial role in the plasma electrolytic oxidation of magnesium alloys due to its ability to control the discharge mechanism, the coating growth kinetics, and the formation of some phases of oxides [2,3]. Characterized PEO electrolytes for Mg-based substrates typically consist of alkaline silicate solutions (e.g., Na2SiO3, K2SiO3) that promote the incorporation of Si and the formation of hard silicate phases, phosphate-based systems (e.g., Na3PO4, Na2HPO4) that enhance corrosion resistance by introducing Mg–P–O compounds, and aluminate-based systems (e.g., NaAlO2) that improve wear resistance and microhardness. Blended systems are also widely used to integrate hardness, adhesion, and corrosion resistance [4]. In the present study, a silicate- and phosphate-containing ternary alkaline electrolyte was selected to combine the high potential of hardness for silicate-derived phases (e.g., Mg2SiO4) with the corrosion prevention potential of phosphate inclusion. This compositional selection follows previous studies on the formation of mechanical and protective properties of oxide coatings on Mg–Li alloys [5]. The properties of magnesium alloys make magnesium-based materials economically appropriate when weight reduction is decisive, e.g., automotive structural components [6], aerospace [7], airframes [8], casing of portable communication devices, and light defence hardware [9]. However, conventional magnesium alloys have been restricted due to their inherently poor corrosion resistance and low surface hardness, which cause them to weaken rapidly in aggressive environments and fail to deliver sufficient wear performance under mechanical loading [10]. Among the new ultralight magnesium alloys, LA141—a high-lithium-content Mg–Li–Al–Y-based alloy—offers even greater potential for mass reduction [11,12].
The addition of lithium reduces the density below 1.50 g/cm3 and brings about a unique combination of formability and ductility at low temperatures not achievable in commercial Mg alloys. Because of this, LA141 is being targeted for next-generation transport and aerospace applications where extreme lightness and structural integrity are required [12]. Although LA141 offers advantages such as low weight and good mechanical compliance, its surface remains highly vulnerable to wear, localised plastic deformation, and electrochemical degradation. Its surface durability must be significantly improved to ensure suitability for real-world applications. Despite these inherent benefits, LA141 is still prone to mechanical damage and oxidation, highlighting the need for robust, strongly bonded surface coatings to unlock its full performance potential [13]. In addressing these challenges, plasma electrolytic oxidation (PEO) has emerged as a promising surface treatment for magnesium alloys [14]. During the PEO process, high-voltage microdischarges generate localized plasma at the metal–electrolyte interface, promoting rapid oxidation and sintering of a new oxide coating [15].
The outcome is a ceramic-like coating with high hardness, porosity, and strong bonding with the substrate. PEO coatings have shown significant improvements in wear resistance [16], corrosion protection [17,18], thermal stability, and they are well-suited for aggressive-service applications [19]. Most critically, the microstructure, phase structure, porosity distribution, and thickness of the PEO coating are all susceptible to the process parameters, including current density, applied voltage, pulse frequency, duty cycle, and electrolyte chemistry [20,21]. Several experiments have systematically varied these parameters in typical Mg alloys (AZ31, AZ91) and observed that higher currents and voltages enhance coating growth rates, excessive plasma intensity, and thus large pores and cracks. In contrast, pulse frequency and duty cycle regulate the timing and intensity of individual discharges and consequently influence the interaction between oxide growth and defect nucleation [21,22,23].
Despite these results, systematic investigations of PEO of ultralight Mg–Li alloys, such as LA141, are scarce, and the sole influence of process parameters on both micromechanical properties (elastic modulus, microhardness) and sclerometric behavior (critical loads for scratch-induced failure) has not yet been comprehensively investigated [5,24,25,26]. In this case, the present study aims to fill this research gap by examining the effect of two crucial PEO parameters, peak current density and pulse frequency, on the mechanical, micro-mechanical, and sclerometric properties of oxide coatings developed on the LA141 alloy. The employment of a full-factorial design enables the identification of main effects and interactions, if any, thereby enabling process–property relationships unique to ultralight magnesium systems to be evaluated.

2. Materials and Methods

2.1. Research Material

The study focused on creating oxide coatings on LA141 magnesium alloy substrates through the Plasma Electrolytic Oxidation (PEO) method. Test samples 62.5 mm × 16 mm × 5 mm were machined out of a 5 mm-thick rolled sheet and further prepared to expose the surfaces for oxidation. The surface preparation began with step-by-step mechanical grinding using a rotary polisher at 250 rpm. Silicon carbide (SiC) abrasives of progressively finer grits (240, 600, 800, 1000, and 1200) were employed to create a fine, flat finish. After each grit change, the specimens were thoroughly cleaned with isopropanol to remove debris. Following grinding, all samples were submerged in isopropanol and ultrasonically cleaned for one minute to strip surface contaminants before oxidation. This resulted in the alloy reaching an initial surface roughness of Sa = 0.467 ± 0.015 µm before the oxidation process for all samples.
Plasma electrolytic oxidation coatings were deposited using a square-voltage waveform from a KIKUSUI PCR2000WEA power supply (Kikusui Electronics Corporation, Yokohama, Japan). Oxidation was carried out for 12 min and consisted of three consecutive steps:
  • Step I (70 s): Linear voltage ramping from 5 V to 195 V.
  • Step II (450 s): Voltage was once more linearly increased to a terminal value of 265 V. A pulsed voltage signal growing linearly from 0 V to 46 V was superimposed on the base voltage during this stage.
  • Step III (200 s): Terminal voltage levels were constant. Gradual fading in intensity of the current was observed in this stage, a sign of self-limiting coating growth.
The pulsed voltage supply was provided at a 30% duty cycle. The electrolyte temperature was maintained at 303 ± 5 K through an external cryostat, and a circulation pump provided continuous stirring to maintain uniform electrolyte conditions. The oxidation electrolyte consisted of three components: a solution of sodium metasilicate (Na2SiO3) at 15 g/L, a solution of sodium hydroxide (NaOH) at 2.5 g/L, and disodium hydrogen phosphate (Na2HPO4) at 1 g/L. The experiment was carried out in a complete factorial plan with two independent parameters: peak current density and pulse frequency, at three levels each (Table 1). Specifically, the process was carried out with peak current densities of 10, 12, and 14 A/dm2 and pulse frequencies of 1000, 1500, and 2000 Hz. This design made it possible to ensure a strict analysis of the influence of the parameters on the microstructure and mechanical properties of the resulting oxide coatings. Peak current density and pulse frequency were selected as independent variables according to preliminary testing and literature evidence of their pervasive influence on the controlling coating growth rate, microstructure, and mechanical properties [20]. Voltage and duty cycle were kept constant in an effort to isolate the effects of the chosen parameters and preclude confounding interactions for the factorial design.
One of the typical features of the resulting oxide coatings is the porous morphology of their surface, with pores of various diameters. The surface topography of a typical coating is presented in Figure 1 (Sample A), which was produced under scanning electron microscopy (SEM) at ×1000 magnification. The image suggests the typical topography of the plasma electrolytic oxidation process, i.e., the presence of a discharge channel and surface ridges resulting from localized microarc activity.
The chemical makeup of the oxide coating (Table 2) confirms the presence of critical constituents from both the substrate and the electrolyte. An MgO-based matrix is present due to high magnesium and oxygen content, while the high silicon contribution (31.08 wt%) suggests the inclusion of silicate phases. Phosphorus and sodium, originating from the electrolyte, were likewise present in trace quantities, indicative of partial incorporation of phosphate species and trace amounts of residual sodium species. These results demonstrate the PEO process’s effectiveness in producing a complex, multi-component oxide coating with potential for enhanced mechanical and protective properties. The relatively high content of silicon, originating from the silicate electrolyte, promotes the formation of Mg2SiO4 and other silicate phases. These phases have the ability to improve hardness and elastic modulus by the formation of a ceramic-like dense matrix. Silicates promote wear resistance at high loads, but local brittleness also leads to early microcracking.

2.2. Research Methodology

The surface morphology was examined with a Hitachi S-4700 scanning electron microscope (Hitachi, Tokyo, Japan) at ×1000 magnification. Elemental analysis was performed using a Noran Vantage Energy Dispersive X-ray Spectroscopy (EDS) system (Hitachi, Tokyo, Japan) integrated with a Hitachi S-4700 microscope (Hitachi, Tokyo, Japan). The coating thickness was measured using the contact method by a Fischer Dualoscope MP40 (Helmut Fischer GmbH + Co. KG, Sindelfingen, Germany), an eddy current principle instrument. Ten thickness measurements were taken on each sample’s surface, and the mean coating thickness and standard deviation were computed.
Micromechanical surface coating characteristics were tested with a Micro Combi Tester MCT3 (Anton Paar, Corcelles-Cormondrèche, Switzerland) using a Vickers diamond indenter (V-M 86). The loading and unloading were carried out within 30 s, and the maximum load was held for 10 s. For each sample, eight impressions were made, and the distances between them in the x and y axes were set at 100 µm, according to ISO 14577 [27]. The hardness, HIT, and the elastic modulus, EIT, were calculated using the Oliver–Pharr method. [20,28].
The scratch resistance of the coatings was measured using the Micro Combi Tester MCT3 (Anton Paar, Corcelles-Cormondrèche, Switzerland) according to the scratch test procedure. The tests were conducted in compliance with ISO 19252 [26,29], ISO 20502 [27,30], ASTM C1624 [28,31], and ASTM D7027 [29,32] using a diamond Rockwell indenter with a 100 μm radius. The test was conducted in three phases. In the first phase (pre-scan), the surface profile of the sample was recorded under a 0.03 N load. The second operation (scan) was the main scratch test, where the load was gradually increased from 0.03 N to 6 N. Each single scratch was 6 mm long, with the indenter moving at a speed of 12 mm/min. The surface profile was once again scanned under a 0.03 N load in the final step (post-scan) following scratching. Throughout the tests, the following parameters, such as applied load (Fn [N]), friction force (Ft [N]), and penetration depth of the indenter (Pd [μm]), were measured. Three significant loads on the reference samples were recognized: Lc1 (onset of coating deformation), Lc2 (onset of visible damage), and Lc3 (coating failure) [20].
The sample surface was three-dimensionally scanned on a contact profilometer with a motorized stage for precise movement along the Y-axis (Taylor Hobson, Leicester, England). Scratches of the coating were examined within a small rectangular area, ca. 2 mm wide by 8 mm long, and with a vertical resolution of 1 μm. The collected measurements were then evaluated and plotted with the help of TalyMap 3.2 software (Digital Surf, Besançon, France). Parameters such as Ra and Rz used for assessing surface roughness were acquired from subsequent profilometric scanning performed on the Form TalySurf Series 2 50i (Taylor Hobson Ltd., Leicester, UK). One of the two measured scratch marks was selected for 3D visualization using axonometric projection. The surface had previously been subjected to standard procedures for normalization, including levelling, straightening, and trimming. The marks along the scratch test were separated into 2D profiles, maintaining a 0.5 mm margin before and after.
To evaluate the influence of input parameters on microhardness (HIT), Young’s modulus (EIT), and critical load values (Lc1, Lc2, and Lc3), a full factorial design was used with assistance from Statistica 13 (TIBCO Software Inc., San Ramon, CA, USA). Two independent variables, peak current density and pulse frequency, each having three levels, were considered in the study. This is a small-scale complex design type for identifying the response surface, i.e., model fitting with experimental data for output variables. A master composite design was selected for experimental analysis. Three-level input variables, x1 (peak current density j, A/dm2) and x2 (pulse frequency f, Hz), were studied as the dependent output variables (microhardness HIT (GPa), Young’s modulus EIT (GPa), and critical loads Lc1, Lc2, and Lc3). Model adequacy and response surface fit were illustrated graphically using spatial response surface plots. Aside from this, a Pareto chart was also made to identify the most critical variables, and marginal mean plots with 95% confidence intervals were used to further illustrate the statistical importance of the results.

3. Results and Discussion

3.1. The Thickness of the Oxide Coating

The thickness of the oxide coating in Table 3 also exhibits a clear dependence on peak current density and frequency. The highest oxide coating thickness (10.22 μm) was obtained with Sample A, which was treated at the lowest current density (10 A/dm2) and lowest frequency (1000 Hz). In general, lower current densities and frequencies produced thicker oxide coatings. With the rise in frequency, the oxide coating thickness usually decreases. For example, when the current density was maintained at a constant value of 12 A/dm2, an increase in frequency from 1000 Hz to 2000 Hz reduced the thickness from 8.31 μm to 8.17 μm.

3.2. The Role of Plasma Electrolytic Oxidation in Modifying Micromechanical Properties

Table 4 provides measured microhardness (HIT) and Young’s modulus (EIT) values of oxide coatings formed under different PEO conditions. The highest hardness (HIT = 2.57 GPa) and Young’s modulus (EIT = 62.25 GPa) were determined for Sample A, which was treated at the lowest peak current density (10 A/dm2) and lowest pulse frequency (1000 Hz). Such conditions are ideal for forming thick and mechanically strong oxide coatings. Sample B (j = 14 A/dm2, f = 1000 Hz) also performed reasonably well mechanically (HIT = 1.65 GPa, EIT = 56.25 GPa), demonstrating that low pulse frequency significantly enhances coating properties regardless of the current density. HIT and EIT values show a tendency to decrease with increasing pulse frequency. For instance, with a current density of 10 A/dm2 (Samples A → C) kept constant, increasing the frequency from 1000 Hz to 2000 Hz caused the hardness to decrease from 2.57 GPa to 1.04 GPa and Young’s modulus to decrease from 62.25 GPa to 43.78 GPa. The same behavior was observed at 12 A/dm2 (Samples G → H), when HIT dropped from 1.35 GPa to 1.12 GPa and EIT from 44.85 GPa to 43.80 GPa. Under constant frequency, a rise in peak current density (e.g., from 10 A/dm2 to 14 A/dm2) typically caused a drop in coating mechanical properties, although the effect was weaker compared with frequency effects. The lowest hardness and modulus values were found for Sample D (HIT = 0.83 GPa, EIT = 38.55 GPa), subjected to the highest current and frequency combination (14 A/dm2, 2000 Hz). This validates the conclusion that excessive input energy, such as exceptionally high pulse frequency, will cause the weakening of the coating microstructure through increased thermal stresses and microdefect formation. It is significant that relatively large standard deviations, especially in the case of HIT measurements, were observed for different samples. This variability is due to the highly porous surface morphology of the coatings, leading to local mechanical response differences upon indentation testing. Although lower peak current density usually results in a lower growth rate of the coating, in this research, it contributed to higher values of hardness due to improved structural integrity of the oxide layer. Single microdischarges are less intense at low current density, reducing the formation of large pores, microcracks, and thermal stresses, resulting in a denser, more uniform oxide microstructure with fewer defects. Therefore, the indentation response is more intense, although the coating thickening is slower.
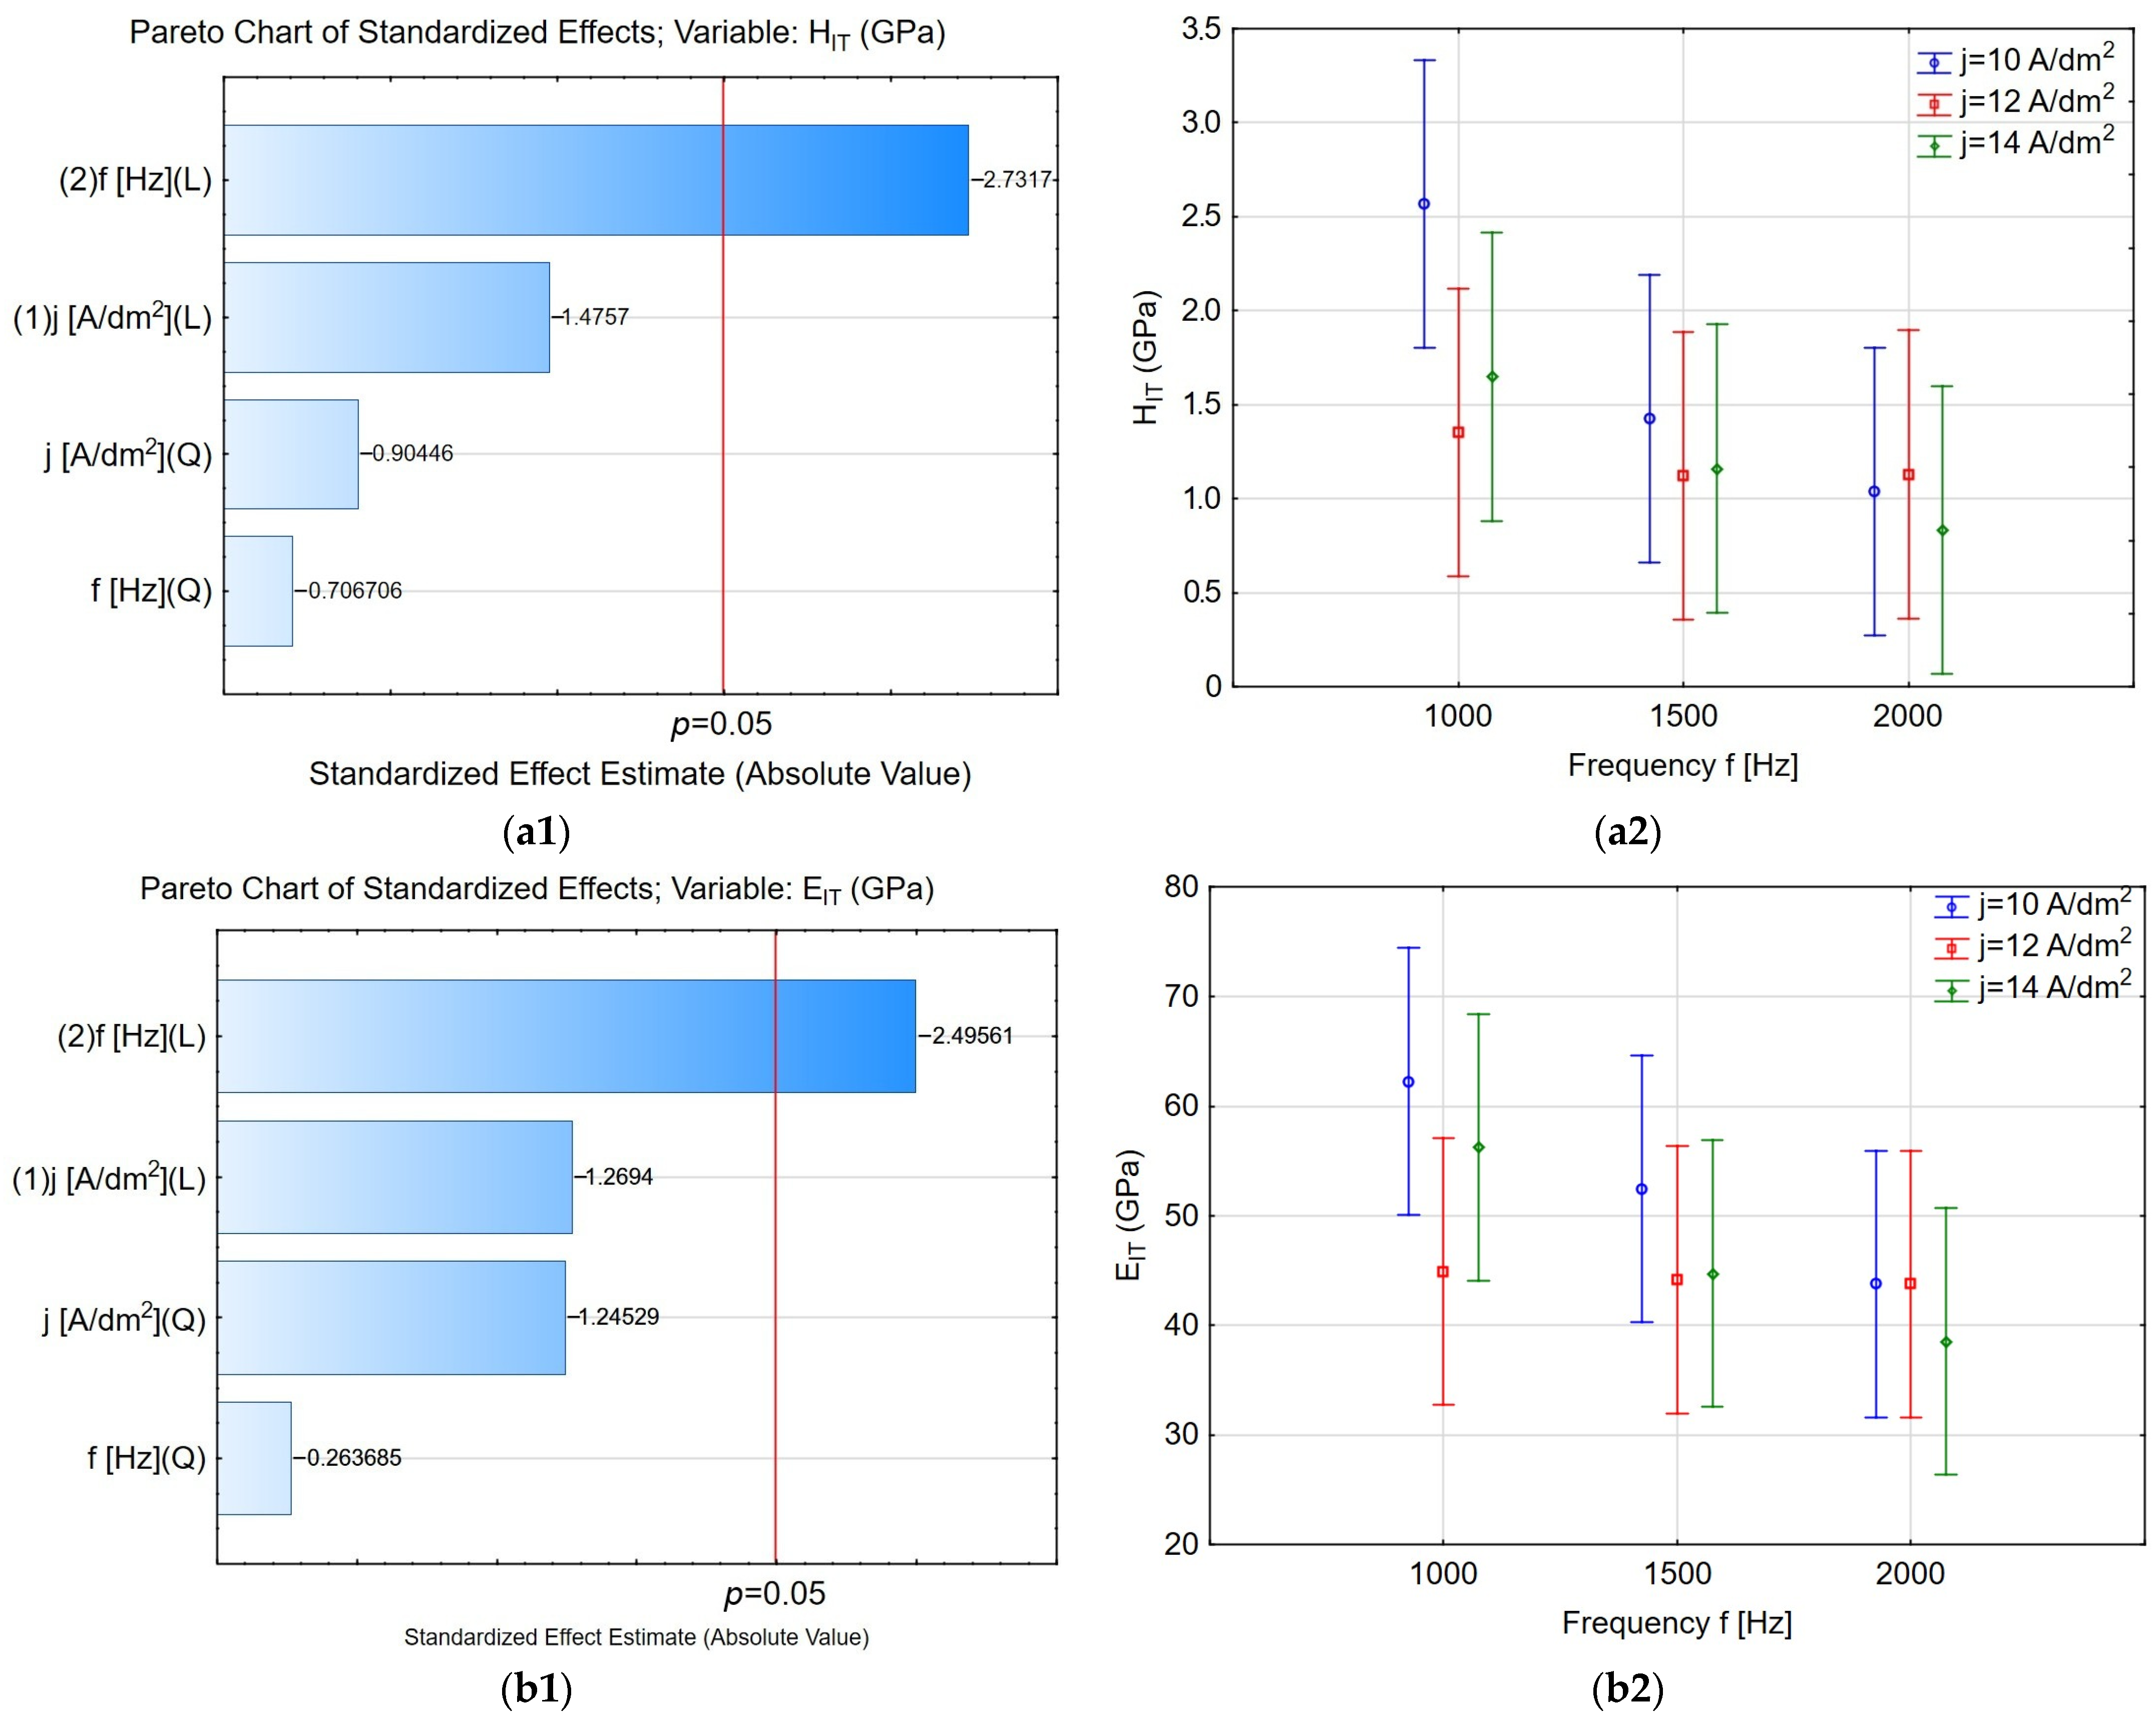
Figure 2(a1,b1) show Pareto charts of the normalized effect sizes of PEO process parameters on the oxide coatings’ hardness (HIT) and elastic modulus (EIT). A precise analysis of the results indicates that only the linear effect of pulse frequency (f [Hz]) has a statistically significant influence on the two mechanical properties, above the significance limit (p = 0.05). The normalised effect values were −2.73 for HIT and −2.50 for EIT, respectively, suggesting that raising the pulse frequency negatively affects the coatings’ mechanical properties by lowering their hardness and elastic modulus. This is because the period of a single discharge is short, so less synthesis and densification occur in the oxide coating. Peak current density (j), linear and quadratic, does not acquire statistical significance in ANOVA tests, i.e., it has comparatively little effect on HIT and EIT compared to frequency. The quadratic effects of frequency and current density are also not statistically significant, indicating the absence of nonlinear dependencies within the tested parameter range. Figure 2(a2,b2) show the effect of pulse frequency (f [Hz]) and peak current density (j [A/dm2]) on oxide coating hardness (HIT) and elastic modulus (EIT). One can observe a trend of reduction in hardness and modulus with increasing pulse frequency—for each of the considered peak current densities (j = 10, 12, 14 A/dm2), the maximum HIT values at 1000 Hz were found, and further frequency growth up to 2000 Hz was accompanied by a normal decrease in hardness and elastic modulus. This is due to the reduced duration of isolated discharges at higher frequencies, which holds back practical coating synthesis and densification. The best mechanical properties were obtained with the lowest current density (j = 10 A/dm2) and frequency (f = 1000 Hz), confirming the beneficial role of mild anodizing conditions on coating structure and quality. The HIT was over 2.5 GPa, and the EIT was over 60 GPa, far higher than the remaining variants. Still, the difference between the samples anodized at j = 12 and 14 A/dm2 is insignificant. It falls within the margin of error, which means that the maximum current density is secondary, affecting the hardness and elasticity of the coatings compared to frequency. The wide error bar range (standard deviation) is also significant, particularly in samples anodized at j = 10 A/dm2 and f = 1000 Hz. This is due to local microstructure variability induced by inhomogeneous discharges and the highly porous surface morphology, contributing to the microindentation measurement result variation.
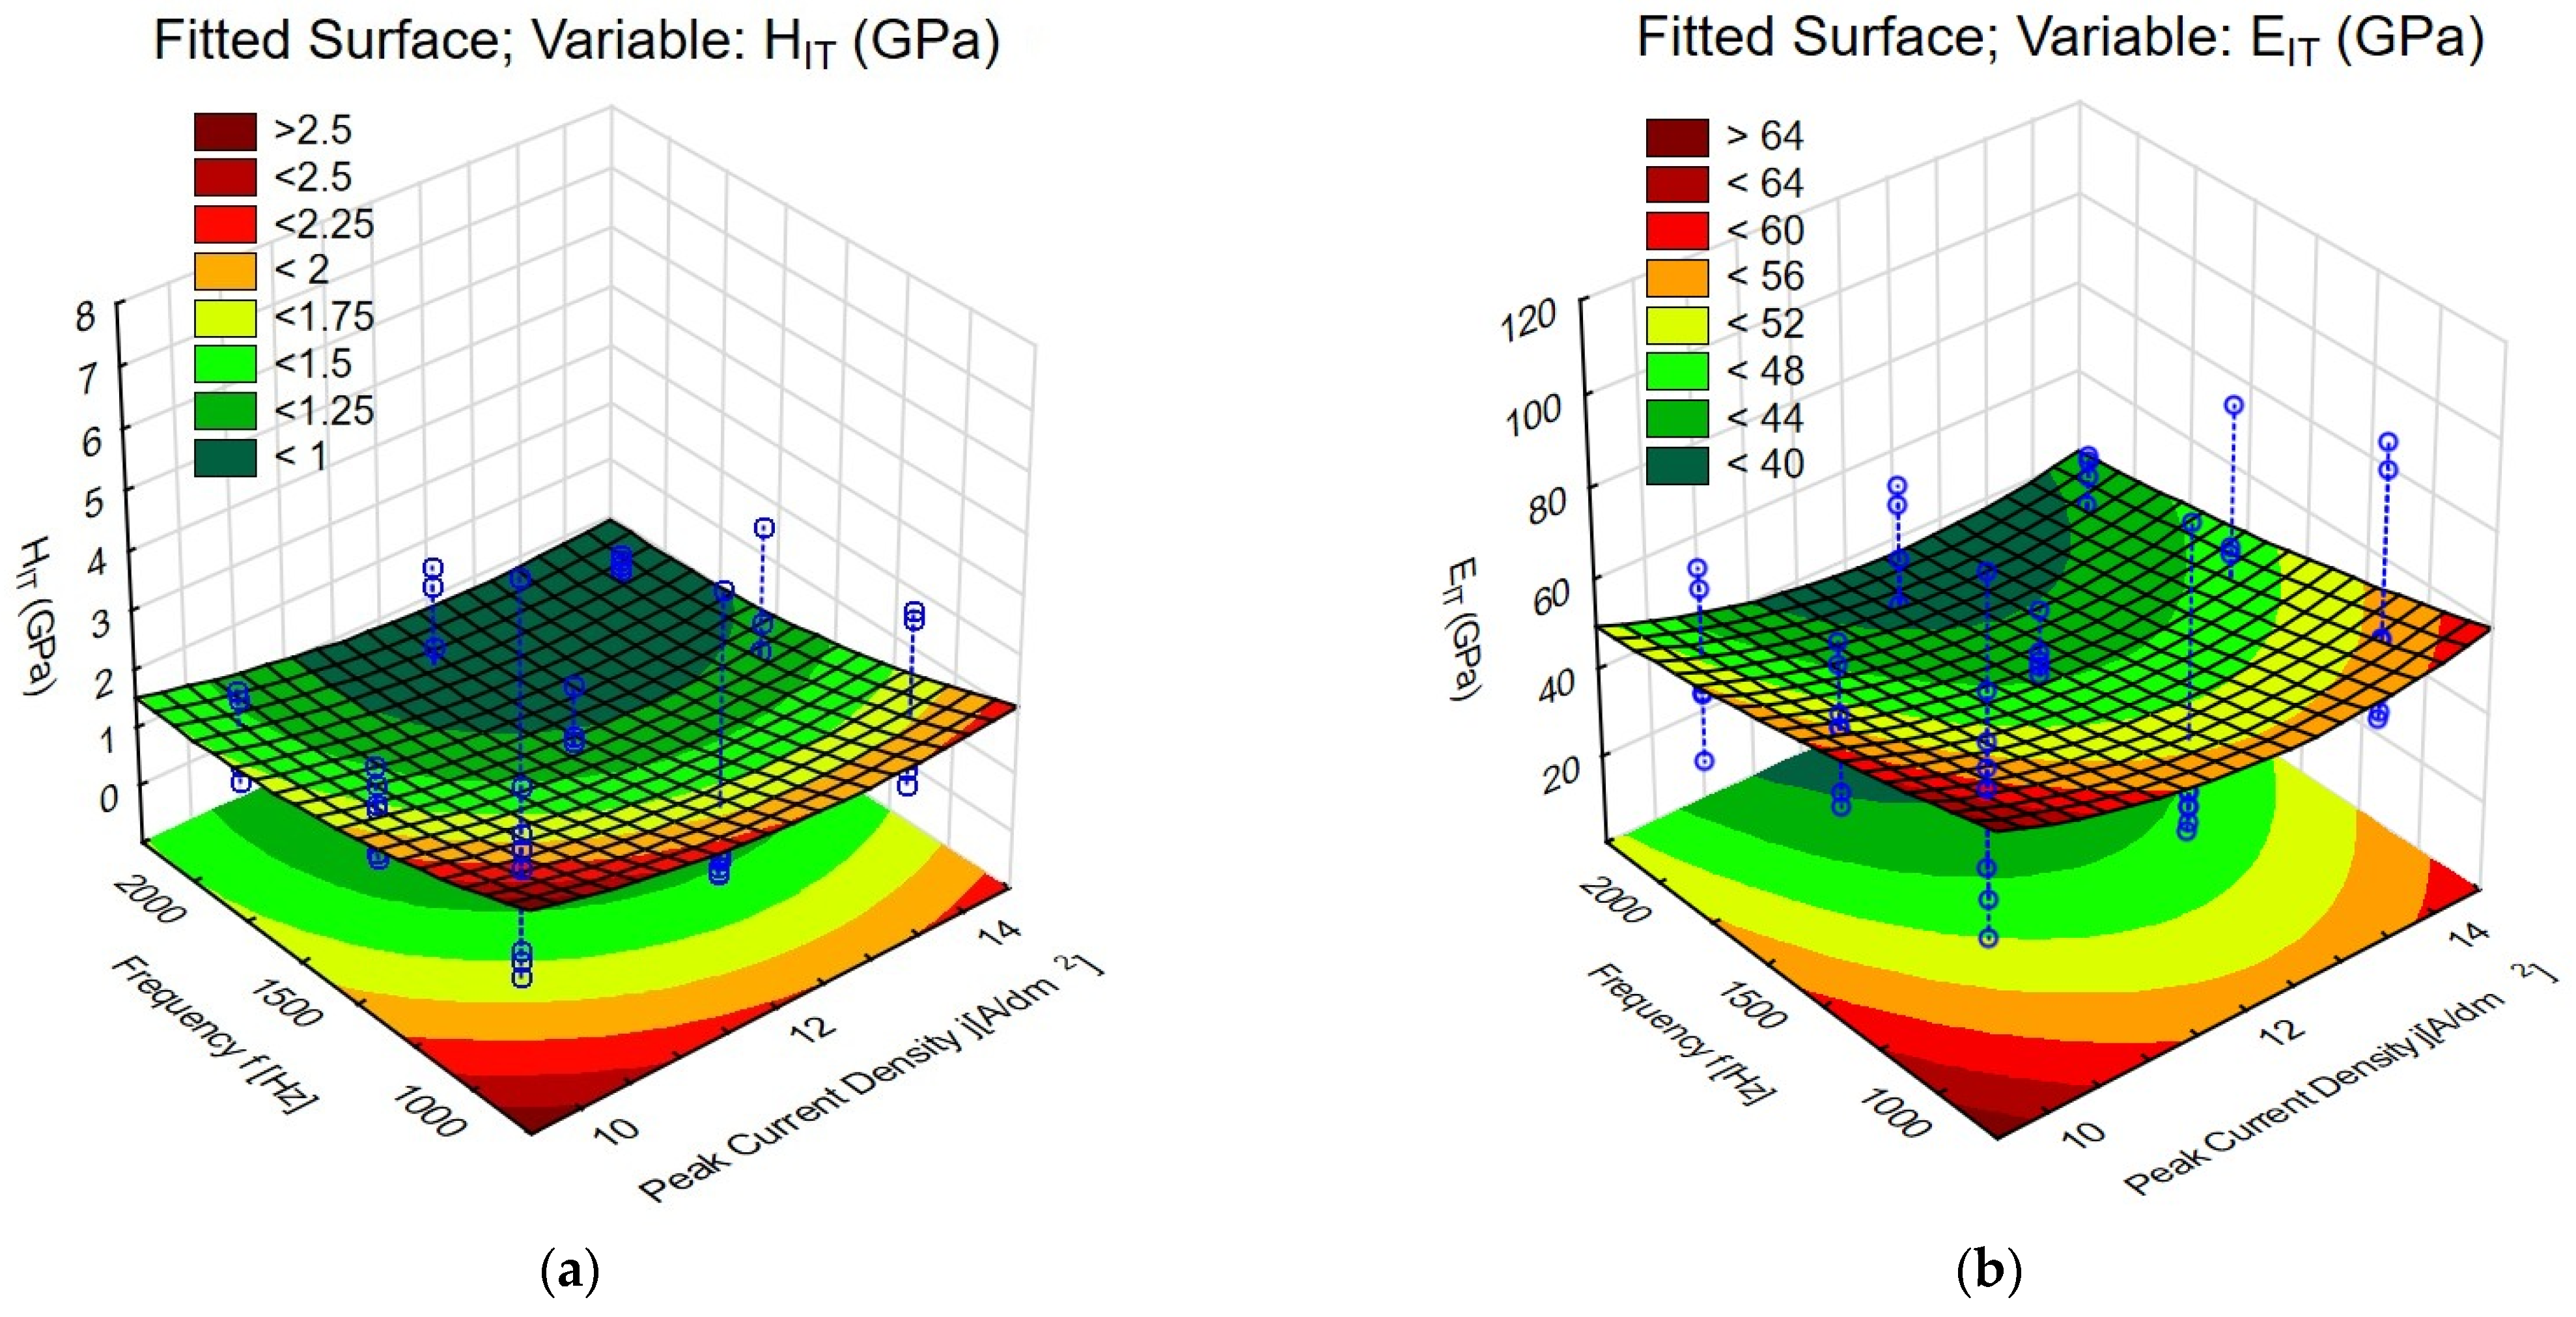
Figure 3a,b show the fitted response surfaces and contour plots of the influence of peak current density (j) and frequency (f) on indentation hardness (HIT) and indentation modulus (EIT), respectively. The graphs reveal a clear and systematic relationship between the process parameters and the mechanical properties of the coating. As indicated in Figure 3a, both factors affect the indentation hardness (HIT). Hardness values rise with an increase in peak current density (j) and decrease with an increase in frequency (f). Peak hardness values, in the range greater than 2.5 GPa, occur at the high peak current density (14 A/dm2) and low frequency (1000 Hz). At the same time, minimum hardness values (<1 GPa) are found in the other corner of the design space with low peak current density (10 A/dm2) and high frequency (2000 Hz). The elliptical shape of the contours and the curvature of the response surface indicate a high interaction between the two factors, such that their combined effect is greater than the sum of their individual effects. The same pattern is observed for indentation modulus (EIT) in Figure 3b. The response surface for EIT resembles HIT well. Indentation modulus increases with increasing peak current density (j) and decreases with increasing frequency (f). The highest modulus values, over 64 GPa, are realized under the same conditions that realise the highest hardness: high peak current density (14 A/dm2) and low frequency (1000 Hz). The lowest modulus values (<40 GPa) are realised at low peak current density and high frequency.

3.3. Adhesive Properties of Anodic Oxide Coatings

Figure 4 shows a microscope image of a scratch on Sample A. The image shows the critical loads Lc1 (concentric areas on the scratch, showing the first visible symptoms of coating damage, not yet indicating its detachment from the substrate), Lc2 (local detachment of the coating (delamination, spalling,) and Lc3 (load at which the coating is completely removed from the substrate—complete detachment).
Table 5 presents the values of critical forces Lc1, Lc2, and Lc3, corresponding to the following stages of damage to the coating during the sclerometric test. The parameter Lc1 represents the occurrence of microcracks or initiation of the first surface damage, Lc2 represents crack propagation or local delamination, and Lc3 represents complete detachment or coating destruction along the indenter path. For the tested set of samples, the Lc1 values are within a comparatively narrow range from 2.00 N (Samples F and I) to 2.60 N (Sample C). The highest values of Lc2 and Lc3, equal to 2.97 N and 4.73 N, respectively, were obtained for Samples B and G. Sample G, in particular, exhibited very high resistance to complete coating destruction (Lc3 = 4.73 N), which may be indicative of good adhesion of the coating to the substrate, even though comparatively low Lc1 and Lc2 values were measured. In contrast, the lowest Lc3 values were calculated for Sample F (2.98 N), which pointed to poor coating adhesion and integrity. The findings indicate that although Sample A is characterised by high elastic modulus and hardness, it does not achieve the highest adhesion values; Lc3 values of 3.30 N are midway. Despite its high modulus and hardness, Sample A exhibited quite moderate adhesion strength. The coating was of relatively high average thickness (as determined by eddy current techniques) and had a porous surface microstructure with discharge channels and localized defects. These attributes can generate residual stresses at the coating–substrate interface during growth and cooling, which initiate delamination under scratch loading. Additionally, EDS analysis confirmed extensive inclusion of silicate-derived phases and minor electrolyte residues, which can form brittle areas, reducing interfacial toughness. Samples D and G show relatively high values of Lc3 (4.00 N and 4.73 N), which may indicate a beneficial effect of some process parameters (e.g., increase of frequency for Sample G) on the adhesion of the coating, but not necessarily on the hardness of the coating. The relatively low standard deviations of Lc1 and Lc2 for most samples are notable, testifying to the reproducibility of the coatings’ behavior in the early part of the test. Nevertheless, larger differences in Lc3 (notably Sample G: 0.78 N) can be due to local differences in the structure and porosity of the coating, affecting its resistance to damage.
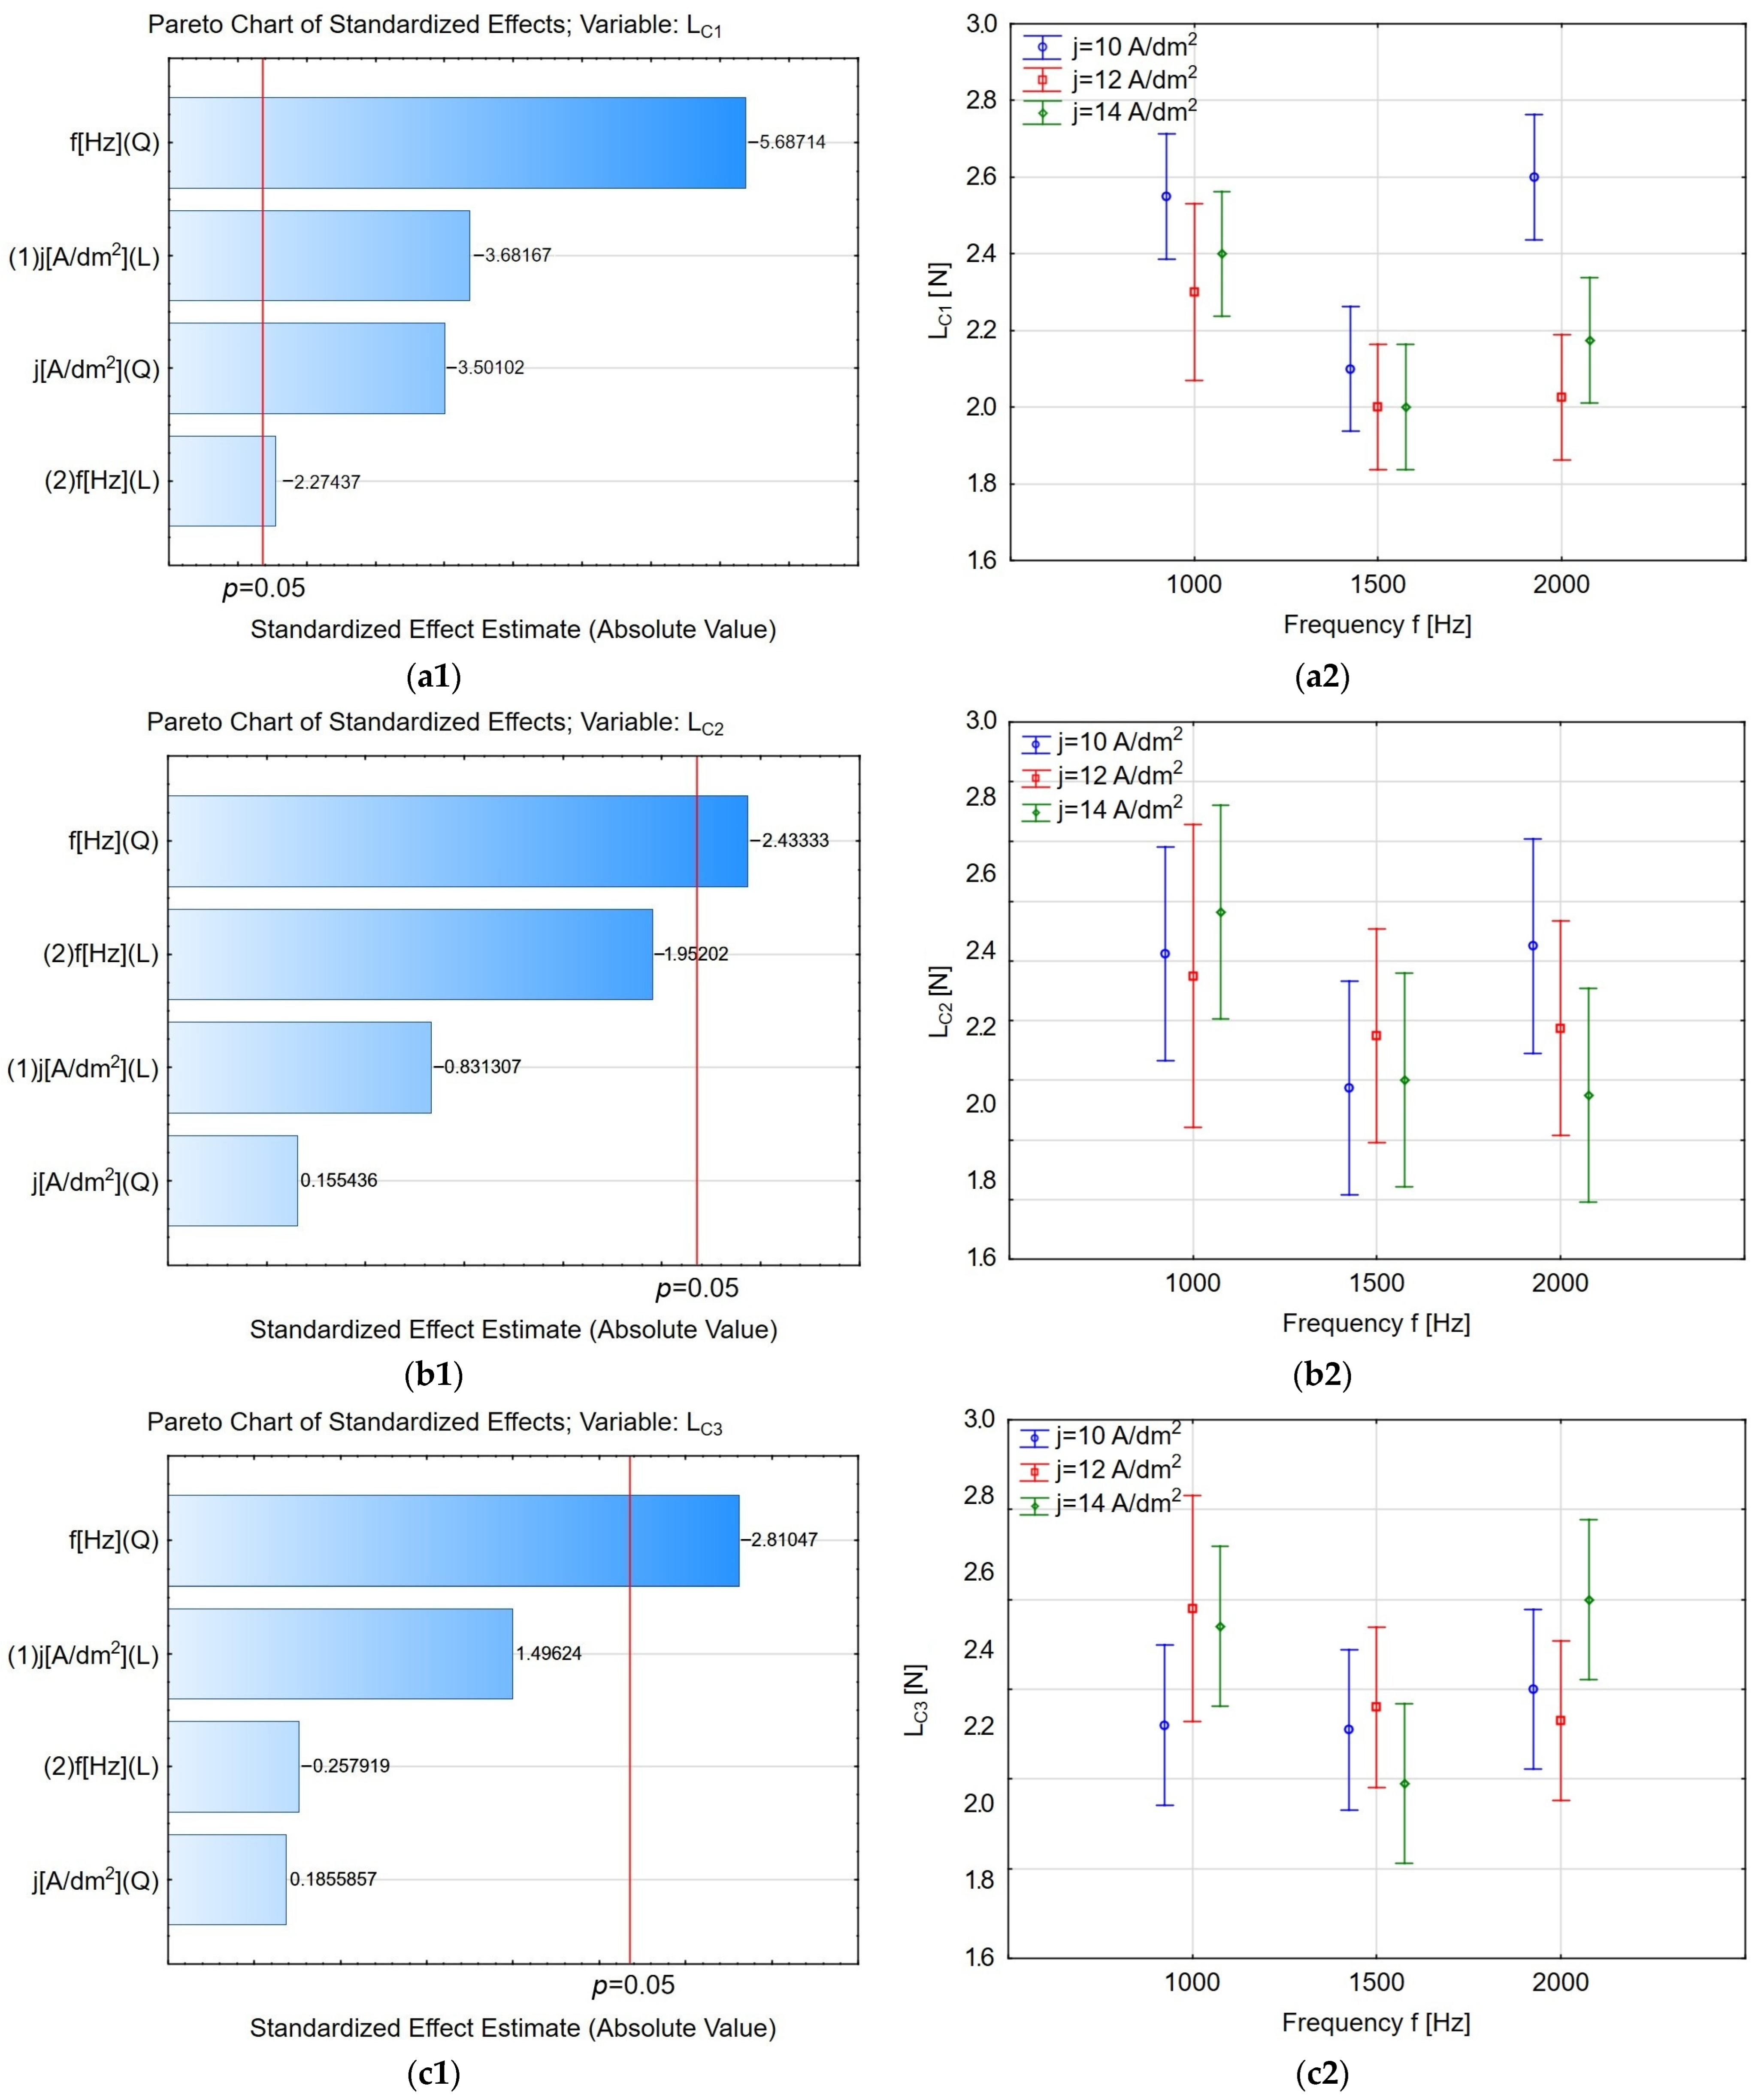
Based on the data presented in Table 5, a critical load analysis was conducted for the three-level experiment. Pareto charts of the standardised effects of the PEO process parameters on the initial critical load Lc1, the intermediate critical load Lc2, and the final critical load Lc3 are shown in Figure 5a1, 5b1, and 5c1, respectively. Analysis indicates that peak current density and pulse frequency significantly impact the initial critical load Lc1. In contrast, for higher critical loads Lc2 and Lc3, the quadratic effect of pulse frequency itself is statistically significant, suggesting a nonlinear relationship between frequency and coating failure resistance for more advanced damage stages. Figure 5(a2,b2,c2) show the plot of marginal means and confidence intervals for the influence of pulse frequency (f [Hz]) and peak current density (j [A/dm2]) on Lc1, Lc2, and Lc3. The maximum value of Lc1 was found at a current density of 10 A/dm2 and a frequency of 2000 Hz. For Lc2, the maximum value was found at a peak current density of 14 A/dm2 and a frequency of 1000 Hz. For Lc3, the maximum critical load was found at 2000 Hz and 14 A/dm2, indicating that these values are best suited for the strongest adhesion and coating delamination resistance.
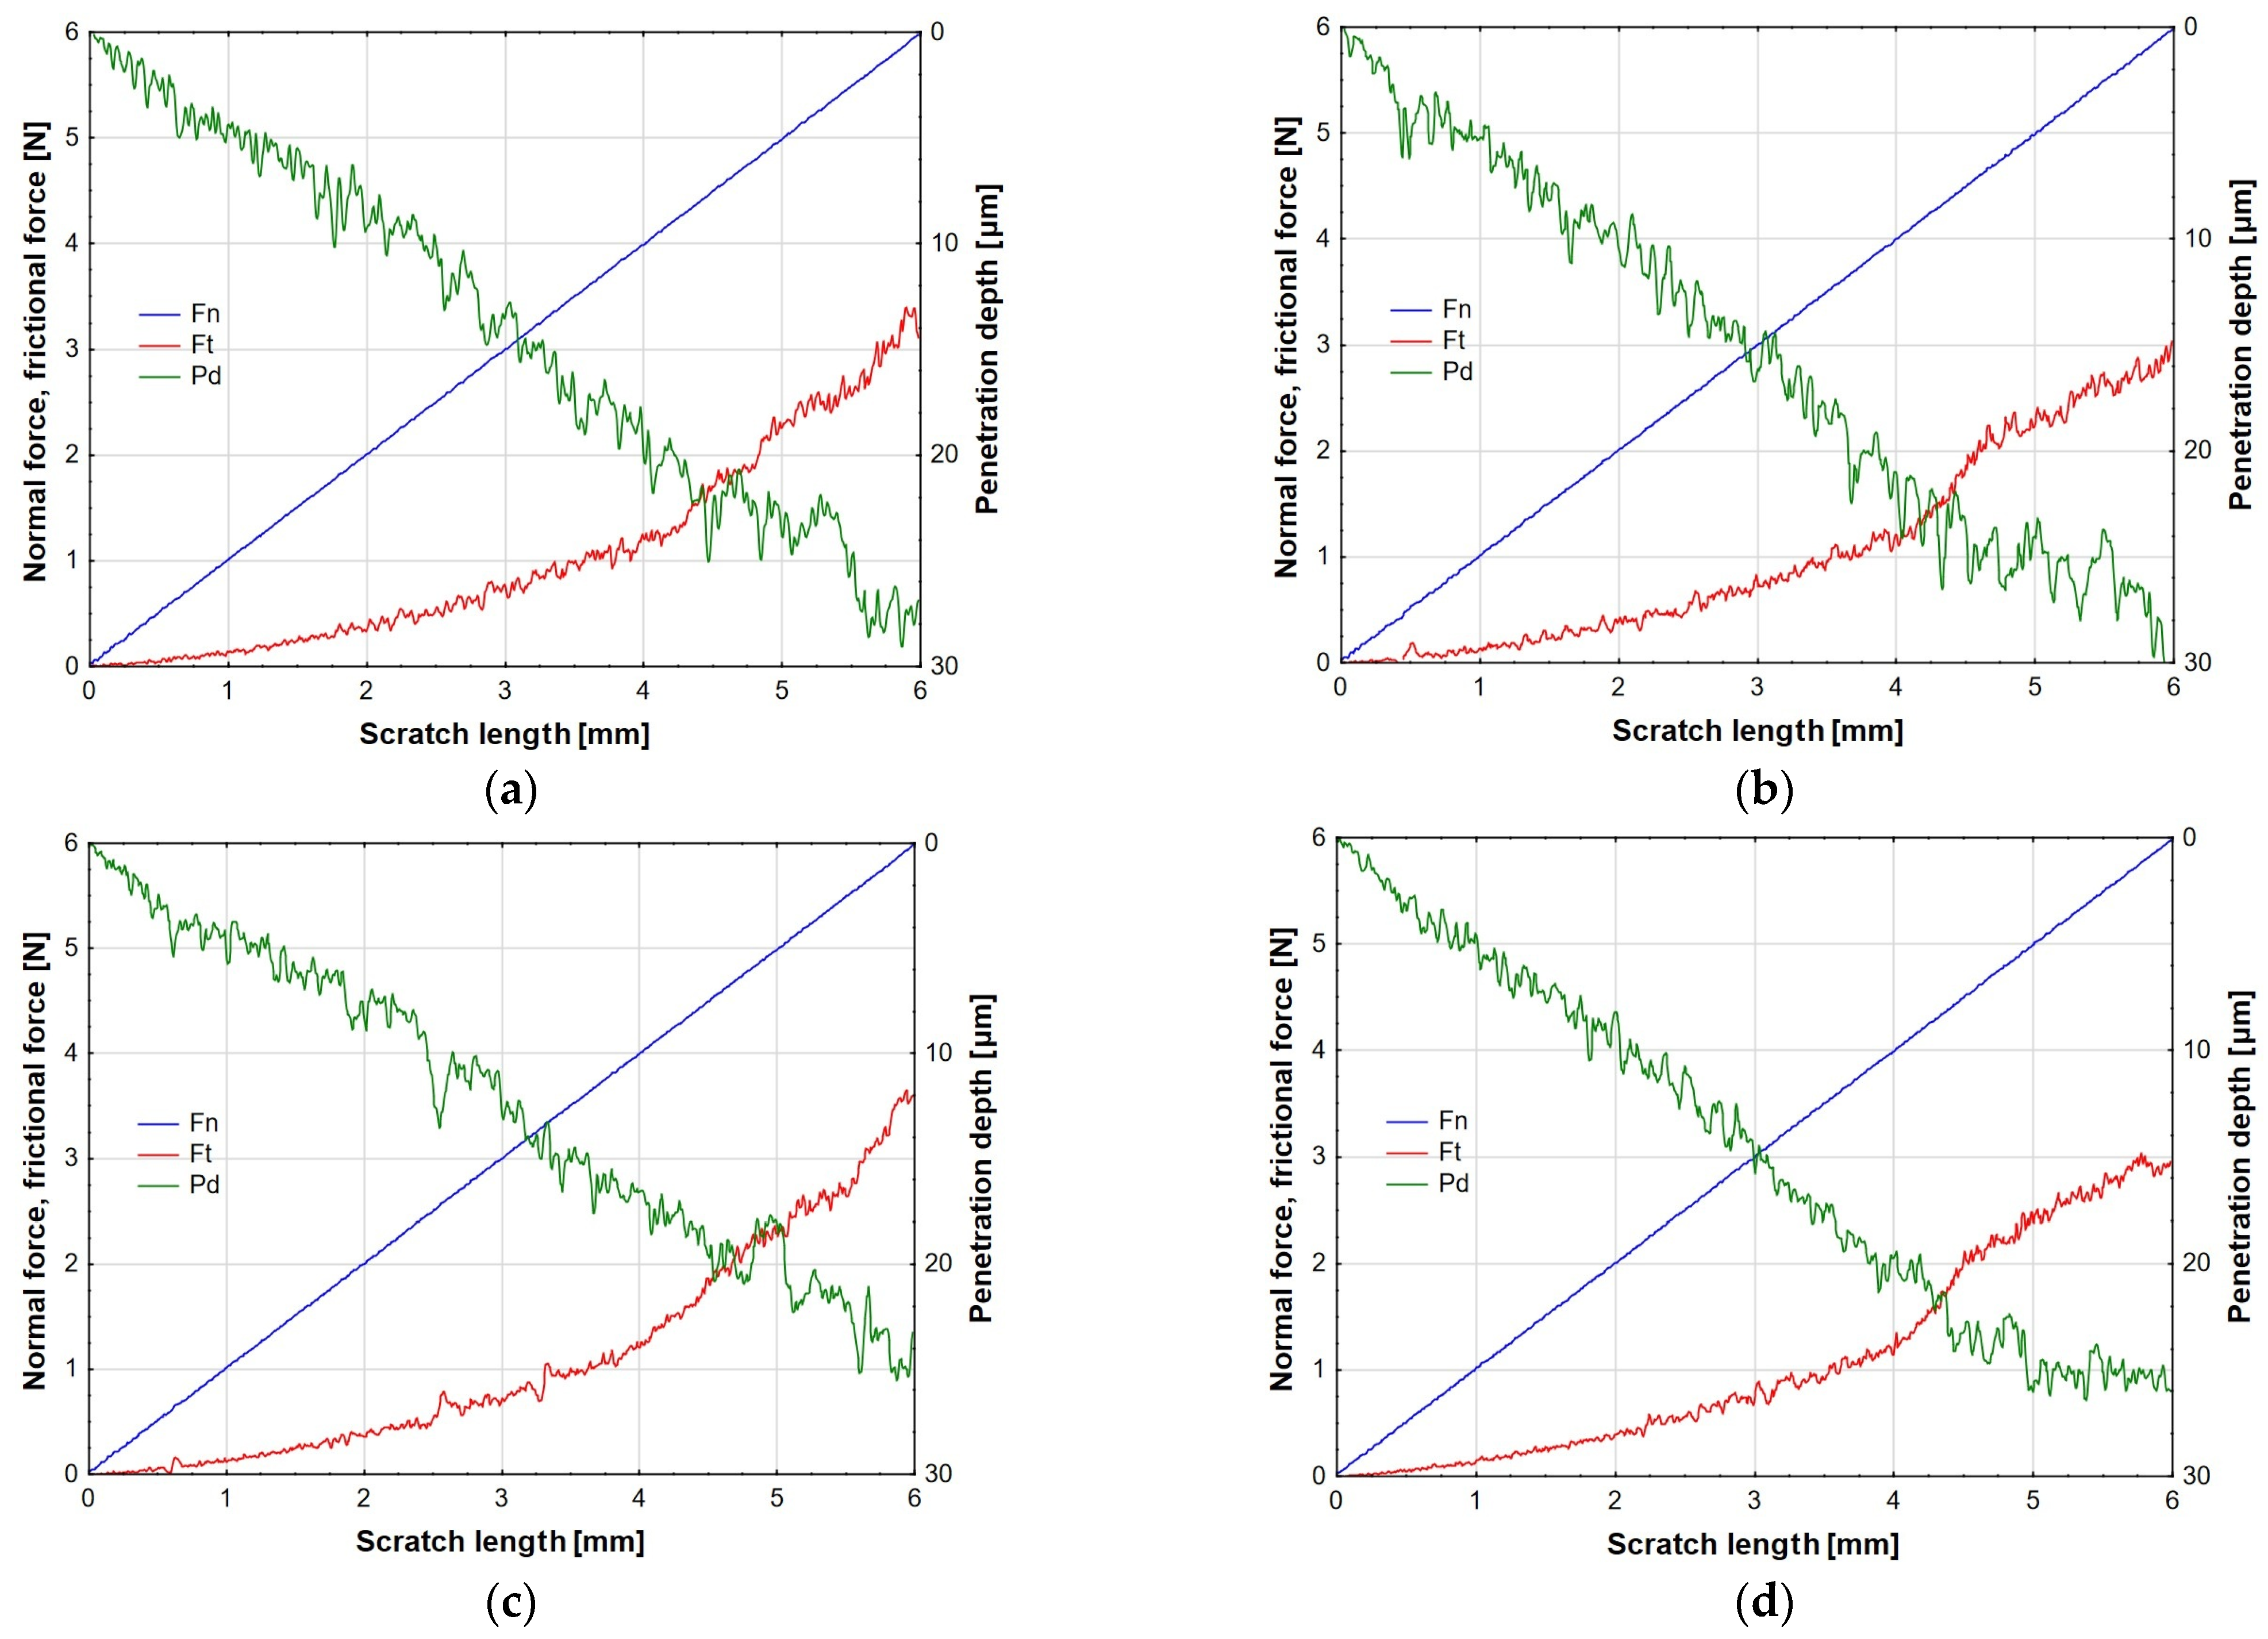
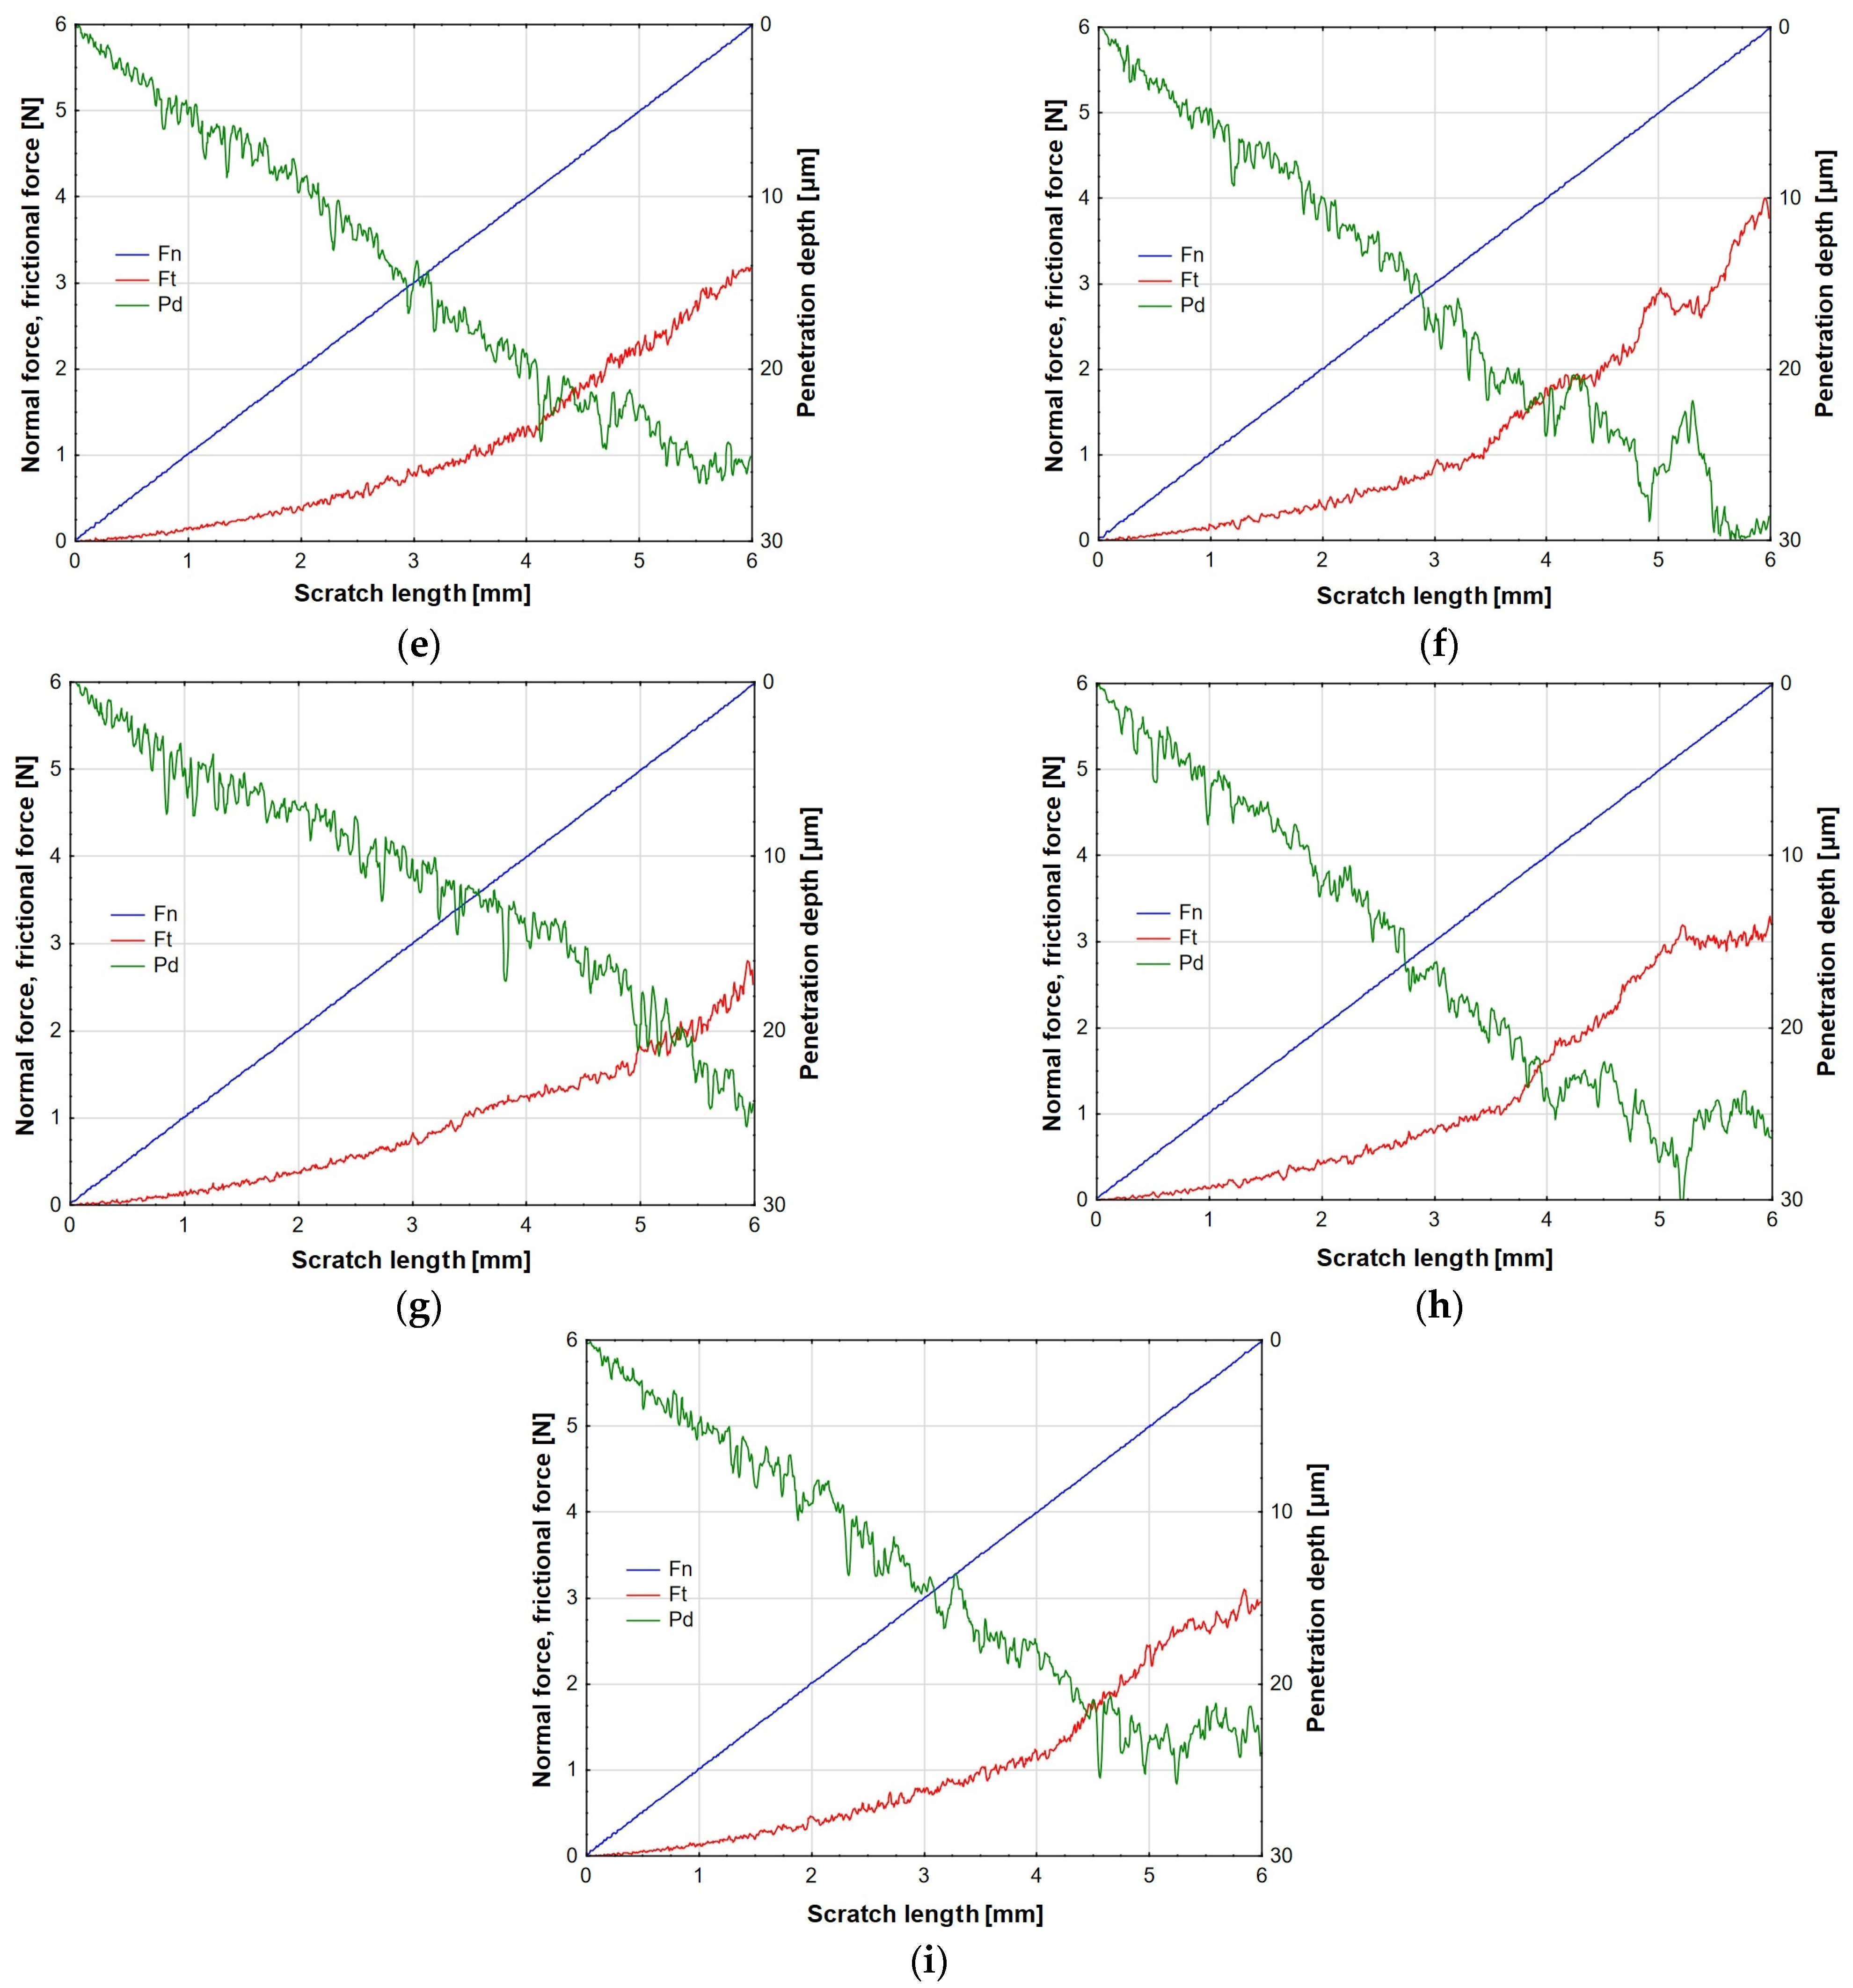
The sclerometric test parameters for the coatings allowed for the plotting of the characteristics of the indenter’s impact force on the oxide coating, the friction force between the indenter and the coating, and the indenter’s penetration depth under load (Figure 6). The Fn characteristic represents the indenter’s normal force, which was proportionally increased from 0.03 N to 6 N along the entire scratch length. Therefore, the Fn characteristics are rectilinear and are the same for all tested coatings. The Ft curves represent changes in friction force. For all tested coatings, the friction force increases as the indenter penetrates the coating structure, which is an obvious effect resulting from the increase in normal force. The Ft curves for the tested coatings adopt a nonlinear shape. The nature of the curves results from the heterogeneity of the coating structure. Coatings produced by the PEO method are characterized by irregular porosity and a heterogeneous structure, with numerous surface cracks. An increase in load in the range of 3-4 N causes the first complete detachment of the coating from the substrate. The graphs then show a step change in the friction force. From this point, the Ft curve represents the friction force occurring between the indenter and the coating-substrate system or between the indenter and the substrate. In most cases, the friction force for the coating–substrate system is demonstrated by a sudden increase in the Ft value and occurs at the location designated Lc3. The Pd curves reflect changes in the indenter penetration value. Their nature is also nonlinear. This is also due to the irregular structure of the coatings, both in terms of pore size and pore density. In the case of samples I, H, and F, a local decrease and then an increase in the Pd parameter value are visible. This may be due to the inhomogeneity of the coating substrate or the formation of adhesive material adhesions and their pushing along the test path, resulting in significant deviations in the Pd and Ft characteristics.
Figure 7a,b show the scratch test results analysis regarding the frictional force (Ft) recorded during progressive loading. The Pareto chart (Figure 7a) shows the standardized effects of PEO process parameters on Ft. The analysis reveals that the linear effect of pulse frequency f [Hz] has the most statistically significant influence on the frictional force, exceeding the significance threshold (p = 0.05), with a standardised effect estimate of 2.53. The peak current density j [A/dm2] also shows a noticeable, though less significant, linear impact (1.70), indicating its moderate contribution to the tribological response. Quadratic effects of both variables remain below the significance threshold, suggesting no strong nonlinear dependencies in the tested parameter range. The diagram in Figure 7b shows the average Ft values with standard deviation bars for all tested current density and frequency combinations. The results show that increasing pulse frequency generally leads to a rise in frictional force, especially at j = 14 A/dm2, where the Ft value peaks at 2000 Hz. This trend suggests that higher frequencies may result in coatings with greater resistance to frictional loads, possibly due to changes in microstructure such as denser oxide formation. However, current density also influences this effect, as variations in j cause significant dispersion in Ft values.
Figure 8 shows isometric images of coatings taken after scratch tests. The indenter penetration profile is visible on the coating surface. The scratch profile level decreases with increasing normal force, Fn, and indenter penetration depth, Pd, and its width also increases. In the final phase of the scratch (>3 mm), swelling of the material occurs on both sides of the scratch, visible above the zero point. This most likely represents swelling of the coating–substrate material. The shape and size of these areas change, and the ratio of their cross-sectional area to the scratch indentation determines the wear process of the tested samples and the substrate. At the end of the scratch, an accumulation of coating and substrate material pushed through by the indenter is visible. The highest level of this material was determined for Sample F, for which the Ft and Pd parameter characteristics were characterized by significant jumps in values visible above 4 mm of the scratch length (Figure 6f).
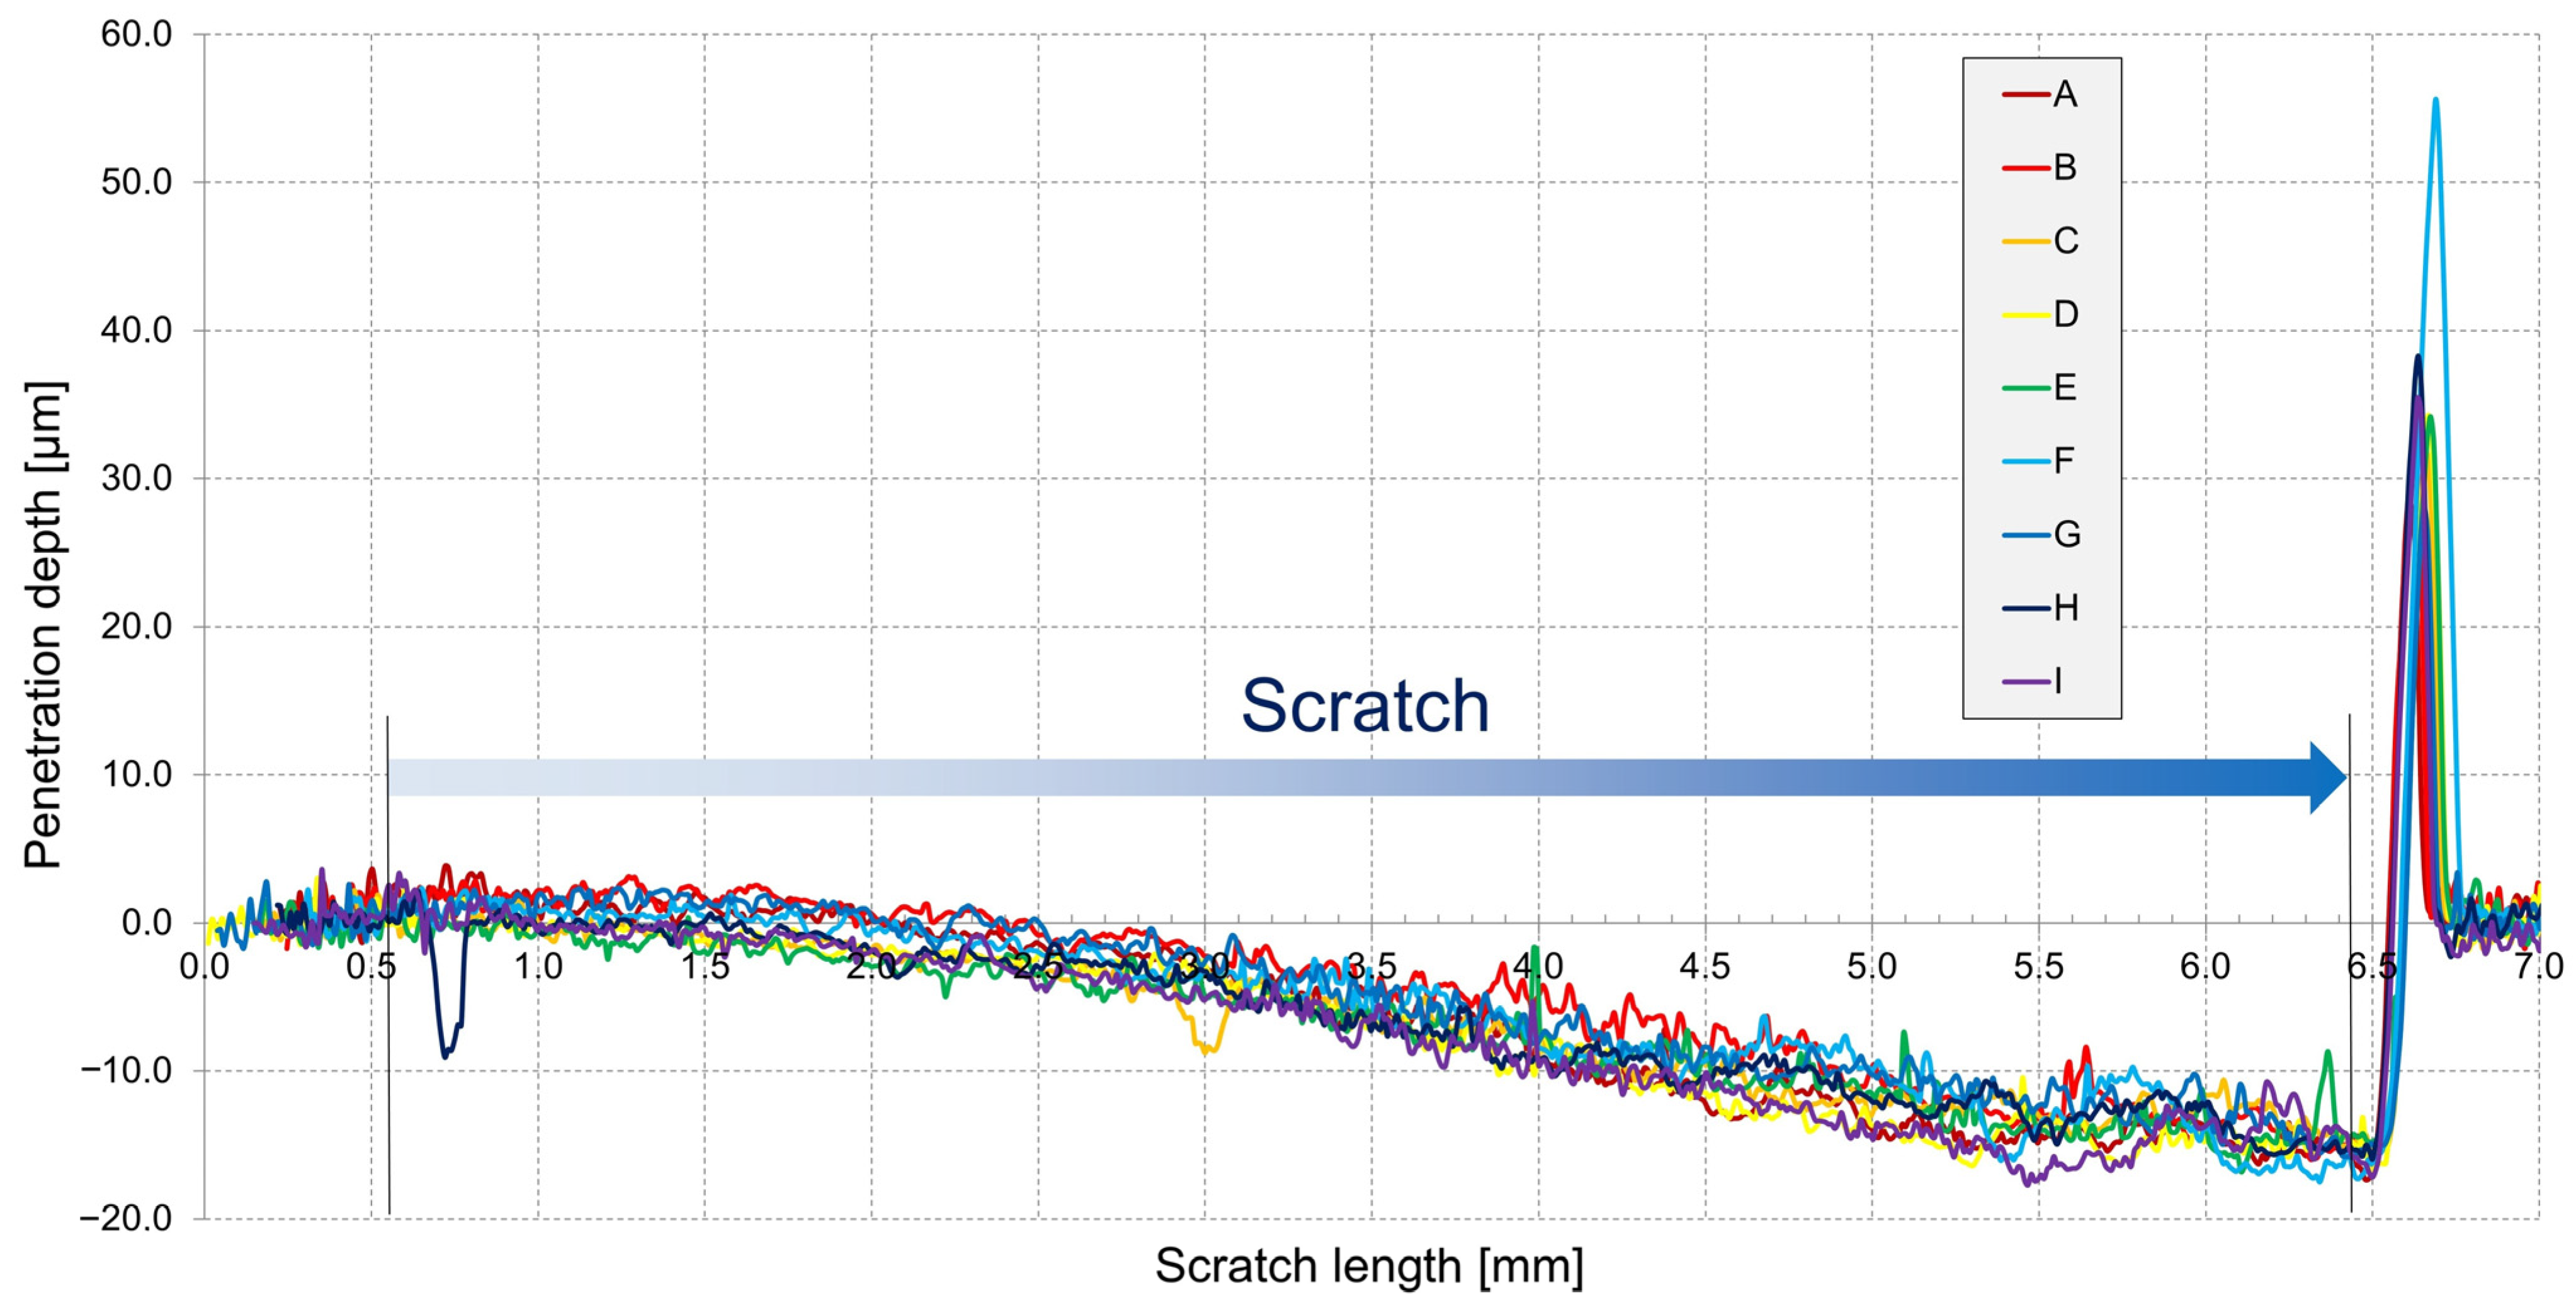
Figure 9 shows the penetration depth versus scratch length for oxide coatings formed under various PEO conditions (Samples A–I). The curves describe the coating’s response to increasing mechanical loading and may be used to assess its cohesion and adhesion. There is a distinct relationship between process parameters, i.e., peak current density (j) and pulse frequency (f), and the performance of the coating during scratch testing. Coatings prepared with a reduced pulse frequency of 1000 Hz (Samples A, B, G) usually possess shallower and more stable scratch penetration profiles along the scratch length. Sample A (j = 10 A/dm2, f = 1000 Hz), prepared with the lowest values of both parameters, has one of the most stable curves with slight fluctuation. This signifies good structural integrity and high resistance to progressive mechanical damage. The reverse is true for samples prepared at the highest frequency of 2000 Hz (C, D, H), which show a tendency for deeper penetration and earlier coating failure. For example, Sample D (j = 14 A/dm2, f = 2000 Hz), subjected to the highest parameters, shows a relatively unstable profile with an abrupt peak at the scratch finish, consistent with weaker cohesive strength and tendencies toward brittle failure. This is consistent with previous results, which show that high-frequency anodizing decreases coating quality due to insufficient time for adequate oxide formation and densification. Interestingly, Sample F (j = 14 A/dm2, f = 1500 Hz) also exhibits a considerable final penetration depth (>50 µm), although it was fabricated at an intermediate frequency. This suggests that the adverse effect of high current density may be boosted when combined with moderate-to-high frequency conditions, possibly due to increased microcracking in the oxide coating. Samples run with centre-point or intermediate values of parameters (e.g., Sample I, j = 12 A/dm2, f = 1500 Hz) demonstrate average performance with moderate penetration depth and delayed failure. Their behavior supports the view that neither high current density nor high frequency ensures optimal mechanical behavior; a balance between them is essential.
The dependence between the surface topography parameters of the oxide coatings, presented in Table 6, illustrates a significant variation in roughness due to the process parameters employed in PEO. The Sa average surface height deviation and Sz maximum height difference were evaluated as measures of the coatings’ microstructural features. The highest roughness values were found for Samples I (Sa = 0.878 µm, Sz = 7.269 µm) and B (Sa = 0.848 µm, Sz = 8.966 µm). Both samples were prepared at increased peak current densities (12–14 A/dm2), which means that more electrical energy promotes more energetic microdischarges, producing larger surface irregularities. On the other hand, minimum values of Sa and Sz were found for Samples D (Sa = 0.801 µm, Sz = 6.538 µm) and C (Sa = 0.686 µm, Sz = 7.094 µm), generated at the highest pulse frequency (2000 Hz). This may indicate a smoothing effect of shorter pulses, limiting the microarc duration and, hence, the severity of localized topographic disturbances. For samples produced at intermediate frequency (1500 Hz), i.e., Samples E, F, and I, roughness parameters indicated intermediate values, consistent with the combined effect of current density and frequency on the resulting surface character. Samples E and G, which were produced at lower current densities, showed moderate roughness values, which would be desirable in tribological applications where a balance between surface roughness and adhesion is necessary.

4. Conclusions

The plasma electrolytic oxidation process parameters, viz., peak current density and pulse frequency, strongly regulate both the micromechanical (indentation hardness, HIT; elastic modulus, EIT) and sclerometric (critical scratch loads Lc1, Lc2, and Lc3) properties of oxide coatings formed on the ultralight LA141 magnesium alloy. The full-factorial experiment identified statistically significant main and interaction effects between these parameters.
Lower peak current densities (10 A/dm2) and lower pulse frequencies (1000 Hz) were observed to be optimal conditions for mild anodizing, resulting in improved mechanical properties in the oxide coatings. Under these conditions, the coatings exhibited maximum thickness, maximum hardness (up to 2.57 GPa), and maximum elastic modulus (up to 62.25 GPa), indicating that mild anodizing conditions are responsible for more efficient oxide growth and densification.
Higher pulse frequency had a consistently negative effect on mechanical properties, reducing both HIT and EIT. This may be due to reduced discharge time at higher frequencies, restricting thermal input and oxide crystallisation. Peak current density, on the other hand, had comparatively weaker effects on these parameters, and in some cases, its effect was not statistically significant.
The adhesion and cohesion of the coating, as evaluated using the critical loads under scratch tests, were not always directly correlated with hardness or modulus. Even though Sample A had high micromechanical properties, samples such as G (14 A/dm2, 1000 Hz) showed better resistance to coating delamination (Lc3 = 4.73 N). This shows that the adhesion and coating strength are complex and depend on many microstructural parameters such as porosity and defect distribution.
Statistical analysis showed that the most signifigant linear effect was from pulse frequency on both tribological and micromechanical properties was observed, negatively affecting HIT and EIT, while correlating positively with friction force Ft. A high quadratic correlation with frequency was found for the higher-order sclerometric parameters (Lc2, Lc3), representing nonlinearity in coating failure mechanisms at advanced damage states.
Surface topography measurements indicated that higher current densities enhance surface roughness (Sa, Sz), and increased pulse frequencies reduce it, demonstrating a smoothing action caused by shorter and less energetic plasma discharges. This has a direct bearing on the functional performance of coatings in tribological applications, where controlled roughness is often required.
The optimum combination of PEO parameters depends on the end-use application for the coated material. For the highest hardness and modulus, the lowest current density and frequency are required. However, for best adhesion and scratch resistance, in general, a moderate-to-high current density and moderate frequency may be ideal. Hence, a compromise level, e.g., 12 A/dm2 at 1500 Hz, yields the best overall balanced performance for all measured properties.

5. Patents

As a result of applying the research method described in the manuscript, an application for patent protection was submitted to the Polish Patent Office.

Author Contributions

Conceptualisation, M.N., M.S. and W.S.; methodology, M.N., M.S. and W.S.; software, M.N., S.K., J.K. and K.A.; formal analysis, M.N., S.K., J.K. and M.B.; writing—original draft, M.N. and J.K.; writing—review and editing, M.N., M.B., J.K., M.S. and S.K.; visualisation, M.N., J.K. and S.K.; supervision, M.N. All authors have read and agreed to the published version of the manuscript.

Funding

This research was funded in whole or in part by the National Science Centre, Poland, DEC-2024/08/X/ST11/00626. For the purpose of Open Access, the author has applied a CC-BY public copyright licence to any Author Accepted Manuscript (AAM) version arising from this submission.

Institutional Review Board Statement

Not applicable.

Informed Consent Statement

Not applicable.

Data Availability Statement

The data presented in this study are available upon request from the corresponding author. The data is not public due to its very large amount, but it can be made available upon request.

Conflicts of Interest

The authors declare no conflicts of interest.

References

  1. Mordike, B.L.; Ebert, T. Magnesium Properties-Applications-Potential. Mater. Sci. Eng. A 2001, 302, 37–45. [Google Scholar] [CrossRef]
  2. Huang, Z.; Wang, R.; Liu, X.; Wang, D.; Zhang, H.; Shen, X.; Shen, D.; Li, D. Influence of Different Electrolyte Additives and Structural Characteristics of Plasma Electrolytic Oxidation Coatings on AZ31 Magnesium Alloy. Coatings 2020, 10, 817. [Google Scholar] [CrossRef]
  3. Toulabifard, A.; Rahmati, M.; Raeissi, K.; Hakimizad, A.; Santamaria, M. The Effect of Electrolytic Solution Composition on the Structure, Corrosion, and Wear Resistance of PEO Coatings on AZ31 Magnesium Alloy. Coatings 2020, 10, 937. [Google Scholar] [CrossRef]
  4. Yang, C.; Chen, P.; Wu, W.; Sheng, L.; Zheng, Y.; Chu, P.K. A Review of Corrosion-Resistant PEO Coating on Mg Alloy. Coatings 2024, 14, 451. [Google Scholar] [CrossRef]
  5. Li, Z.; Yuan, Y.; Sun, P.; Jing, X. Ceramic Coatings of LA141 Alloy Formed by Plasma Electrolytic Oxidation for Corrosion Protection. ACS Appl. Mater. Interfaces 2011, 3, 3682–3690. [Google Scholar] [CrossRef] [PubMed]
  6. Joost, W.J.; Krajewski, P.E. Towards Magnesium Alloys for High-Volume Automotive Applications. Scr. Mater. 2017, 128, 107–112. [Google Scholar] [CrossRef]
  7. Bai, J.; Yang, Y.; Wen, C.; Chen, J.; Zhou, G.; Jiang, B.; Peng, X.; Pan, F. Applications of Magnesium Alloys for Aerospace: A Review. J. Magnes. Alloys 2023, 11, 3609–3619. [Google Scholar] [CrossRef]
  8. Dziubińska, A.; Gontarz, A.; Dziubiński, M.; Barszcz, M. The Forming of Magnesium Alloy Forgings for Aircraft and Automotive Applications. Adv. Sci. Technol. Res. J. 2016, 10, 158–168. [Google Scholar] [CrossRef]
  9. Mathaudhu, S.N.; Nyberg, E.A. Magnesium Alloys in U.S. Military Applications: Past, Current and Future Solutions. In Essential Readings in Magnesium Technology; Springer International Publishing: Cham, Switzerland, 2016; pp. 71–76. [Google Scholar]
  10. Song, G. Recent Progress in Corrosion and Protection of Magnesium Alloys. Adv. Eng. Mater. 2005, 7, 563–586. [Google Scholar] [CrossRef]
  11. Wu, R.; Yan, Y.; Wang, G.; Murr, L.E.; Han, W.; Zhang, Z.; Zhang, M. Recent Progress in Magnesium–Lithium Alloys. Int. Mater. Rev. 2015, 60, 65–100. [Google Scholar] [CrossRef]
  12. Abdullaev, R.N.; Khairulin, R.A.; Kozlovskii, Y.M.; Agazhanov, A.S.; Stankus, S.V. Density of Magnesium and Magnesium-Lithium Alloys in Solid and Liquid States. Trans. Nonferrous Met. Soc. China 2019, 29, 507–514. [Google Scholar] [CrossRef]
  13. Xu, C.; Feng, X.; Deng, H.; Zhong, T.; Zou, C.; Wu, R.; Yu, Z.; Ma, X. The Impact of Mn Alloying and Rolling Processing on the Microstructure and Mechanical Properties of LA141 Alloy. J. Alloys Compd. 2025, 1010, 178052. [Google Scholar] [CrossRef]
  14. Arrabal, R.; Matykina, E.; Hashimoto, T.; Skeldon, P.; Thompson, G.E. Characterization of AC PEO Coatings on Magnesium Alloys. Surf. Coat. Technol. 2009, 203, 2207–2220. [Google Scholar] [CrossRef]
  15. Sikdar, S.; Menezes, P.V.; Maccione, R.; Jacob, T.; Menezes, P.L. Plasma Electrolytic Oxidation (Peo) Process—Processing, Properties, and Applications. Nanomaterials 2021, 11, 1375. [Google Scholar] [CrossRef]
  16. Arun, S.; Hariprasad, S.; Saikiran, A.; Ravisankar, B.; Parfenov, E.V.; Mukaeva, V.R.; Rameshbabu, N. The Effect of Graphite Particle Size on the Corrosion and Wear Behaviour of the PEO-EPD Coating Fabricated on Commercially Pure Zirconium. Surf. Coat. Technol. 2019, 363, 301–313. [Google Scholar] [CrossRef]
  17. Ostapiuk, M. Corrosion Resistance of PEO and Primer Coatings on Magnesium Alloy. J. Asian Ceram. Soc. 2021, 9, 40–52. [Google Scholar] [CrossRef]
  18. Pastorek, F.; Štrbák, M.; Kajánek, D.; Jacková, M.; Pastorková, J.; Florková, Z. Corrosion Behaviour of Preserved Peo Coating on Az31 Magnesium Alloy. Commun. Sci. Lett. Univ. Zilina 2021, 23, B76–B88. [Google Scholar] [CrossRef]
  19. Tian, G.; Wang, J.; Wang, S.; Xue, C.; Yang, X.; Su, H. An Ultra-Light Mg-Li Alloy with Exceptional Elastic Modulus, High Strength, and Corrosion-Resistance. Mater. Today Commun. 2023, 35, 105623. [Google Scholar] [CrossRef]
  20. Niedźwiedź, M.; Bara, M.; Korzekwa, J.; Barylski, A.; Kaptacz, S. The Influence of the Plasma Electrolytic Oxidation Parameters of the Mg-AZ31B Alloy on the Micromechanical and Sclerometric Properties of Oxide Coatings. Coatings 2024, 14, 1446. [Google Scholar] [CrossRef]
  21. Niedźwiedź, M.; Bara, M.; Korzekwa, J.; Kaptacz, S.; Sowa, M.; Olesiński, A.; Simka, W. Tribological Properties and Surface Wettability of Coatings Produced on the Mg-AZ31B Alloy by Plasma Electrolytic Oxidation. Coatings 2024, 14, 780. [Google Scholar] [CrossRef]
  22. Wang, Y.; Zhang, P.; Du, Y.; Zhang, W.; Cao, H. Correlations between the Growth Mechanism and Corrosion Resistance of Plasma Electrolytic Oxidation Coatings on AZ31B Magnesium Alloy. Int. J. Electrochem. Sci. 2019, 14, 10465–10479. [Google Scholar] [CrossRef]
  23. Korzynski, M.; Zarski, T. Slide Diamond Burnishing Influence on of Surface Stereometric Structure of an AZ91 Alloy. Surf. Coat Technol. 2016, 307, 590–595. [Google Scholar] [CrossRef]
  24. Feng, X.; Deng, H.; Ma, X.; Yang, Z.; Zhang, H.; Yu, Z.; Liu, W.; Wang, J.; Hou, L.; Qian, B.; et al. Balancing Strength and Ductility of LA141 Alloy with a Micro-Nano Laminated Structure. J. Magnes. Alloys 2024, in press. [Google Scholar] [CrossRef]
  25. Mou, F.; Wang, Z.; Zeng, H.; Ma, Y.; Guo, F.; Chai, L.; She, Z.; Zhang, L. Fabricating a Corrosion-Protective Li2CO3/Mg(OH)2 Composite Film on LA141 Magnesium lithium Alloy by Hydrothermal Method. Surf. Coat Technol. 2023, 472, 129939. [Google Scholar] [CrossRef]
  26. Xu, N.; Qiu, Z.; Song, Q.; Liu, Z.; Ji, X.; Wang, D. Enhanced Mechanical Properties and Corrosion Resistance of Friction-Stir Processed Ultralight LA141 Magnesium-Lithium-Aluminum Alloy. J. Mater. Res. Technol. 2024, 30, 1553–1571. [Google Scholar] [CrossRef]
  27. ISO 14577-4; Metallic Materials—Instrumented Indentation Test for Hardness and Materials Parameters—Part 4: Test Method for Metallic and Non-Metallic Coatings. ISO: Geneva, Switzerland, 2016.
  28. Oliver, W.C.; Pharr, G.M. An Improved Technique for Determining Hardness and Elastic Modulus Using Load and Displacement Sensing Indentation Experiments. J. Mater. Res. 1992, 7, 1564–1583. [Google Scholar] [CrossRef]
  29. ISO 19252:2008; Plastics—Determination of Scratch Properties. ISO: Geneva, Switzerland, 2008.
  30. ISO 20502:2005; Fine Ceramics (Advanced Ceramics, Advanced Technical Ceramics)—Determination of Adhesion of Ceramic Coatings by Scratch Testing. ISO: Geneva, Switzerland, 2005.
  31. ASTM C1624-22(2022); Standard Test Method for Adhesion Strength and Mechanical Failure Modes of Ceramic Coatings by Quantitative Single Point Scratch Testing. ASTM International: West Conshohocken, PA, USA, 2022.
  32. ASTM D7027-20(2020); Standard Test Method for Evaluation of Scratch Resistance of Polymeric Coatings and Plastics Using an Instrumented Scratch Machine. ASTM International: West Conshohocken, PA, USA, 2020.
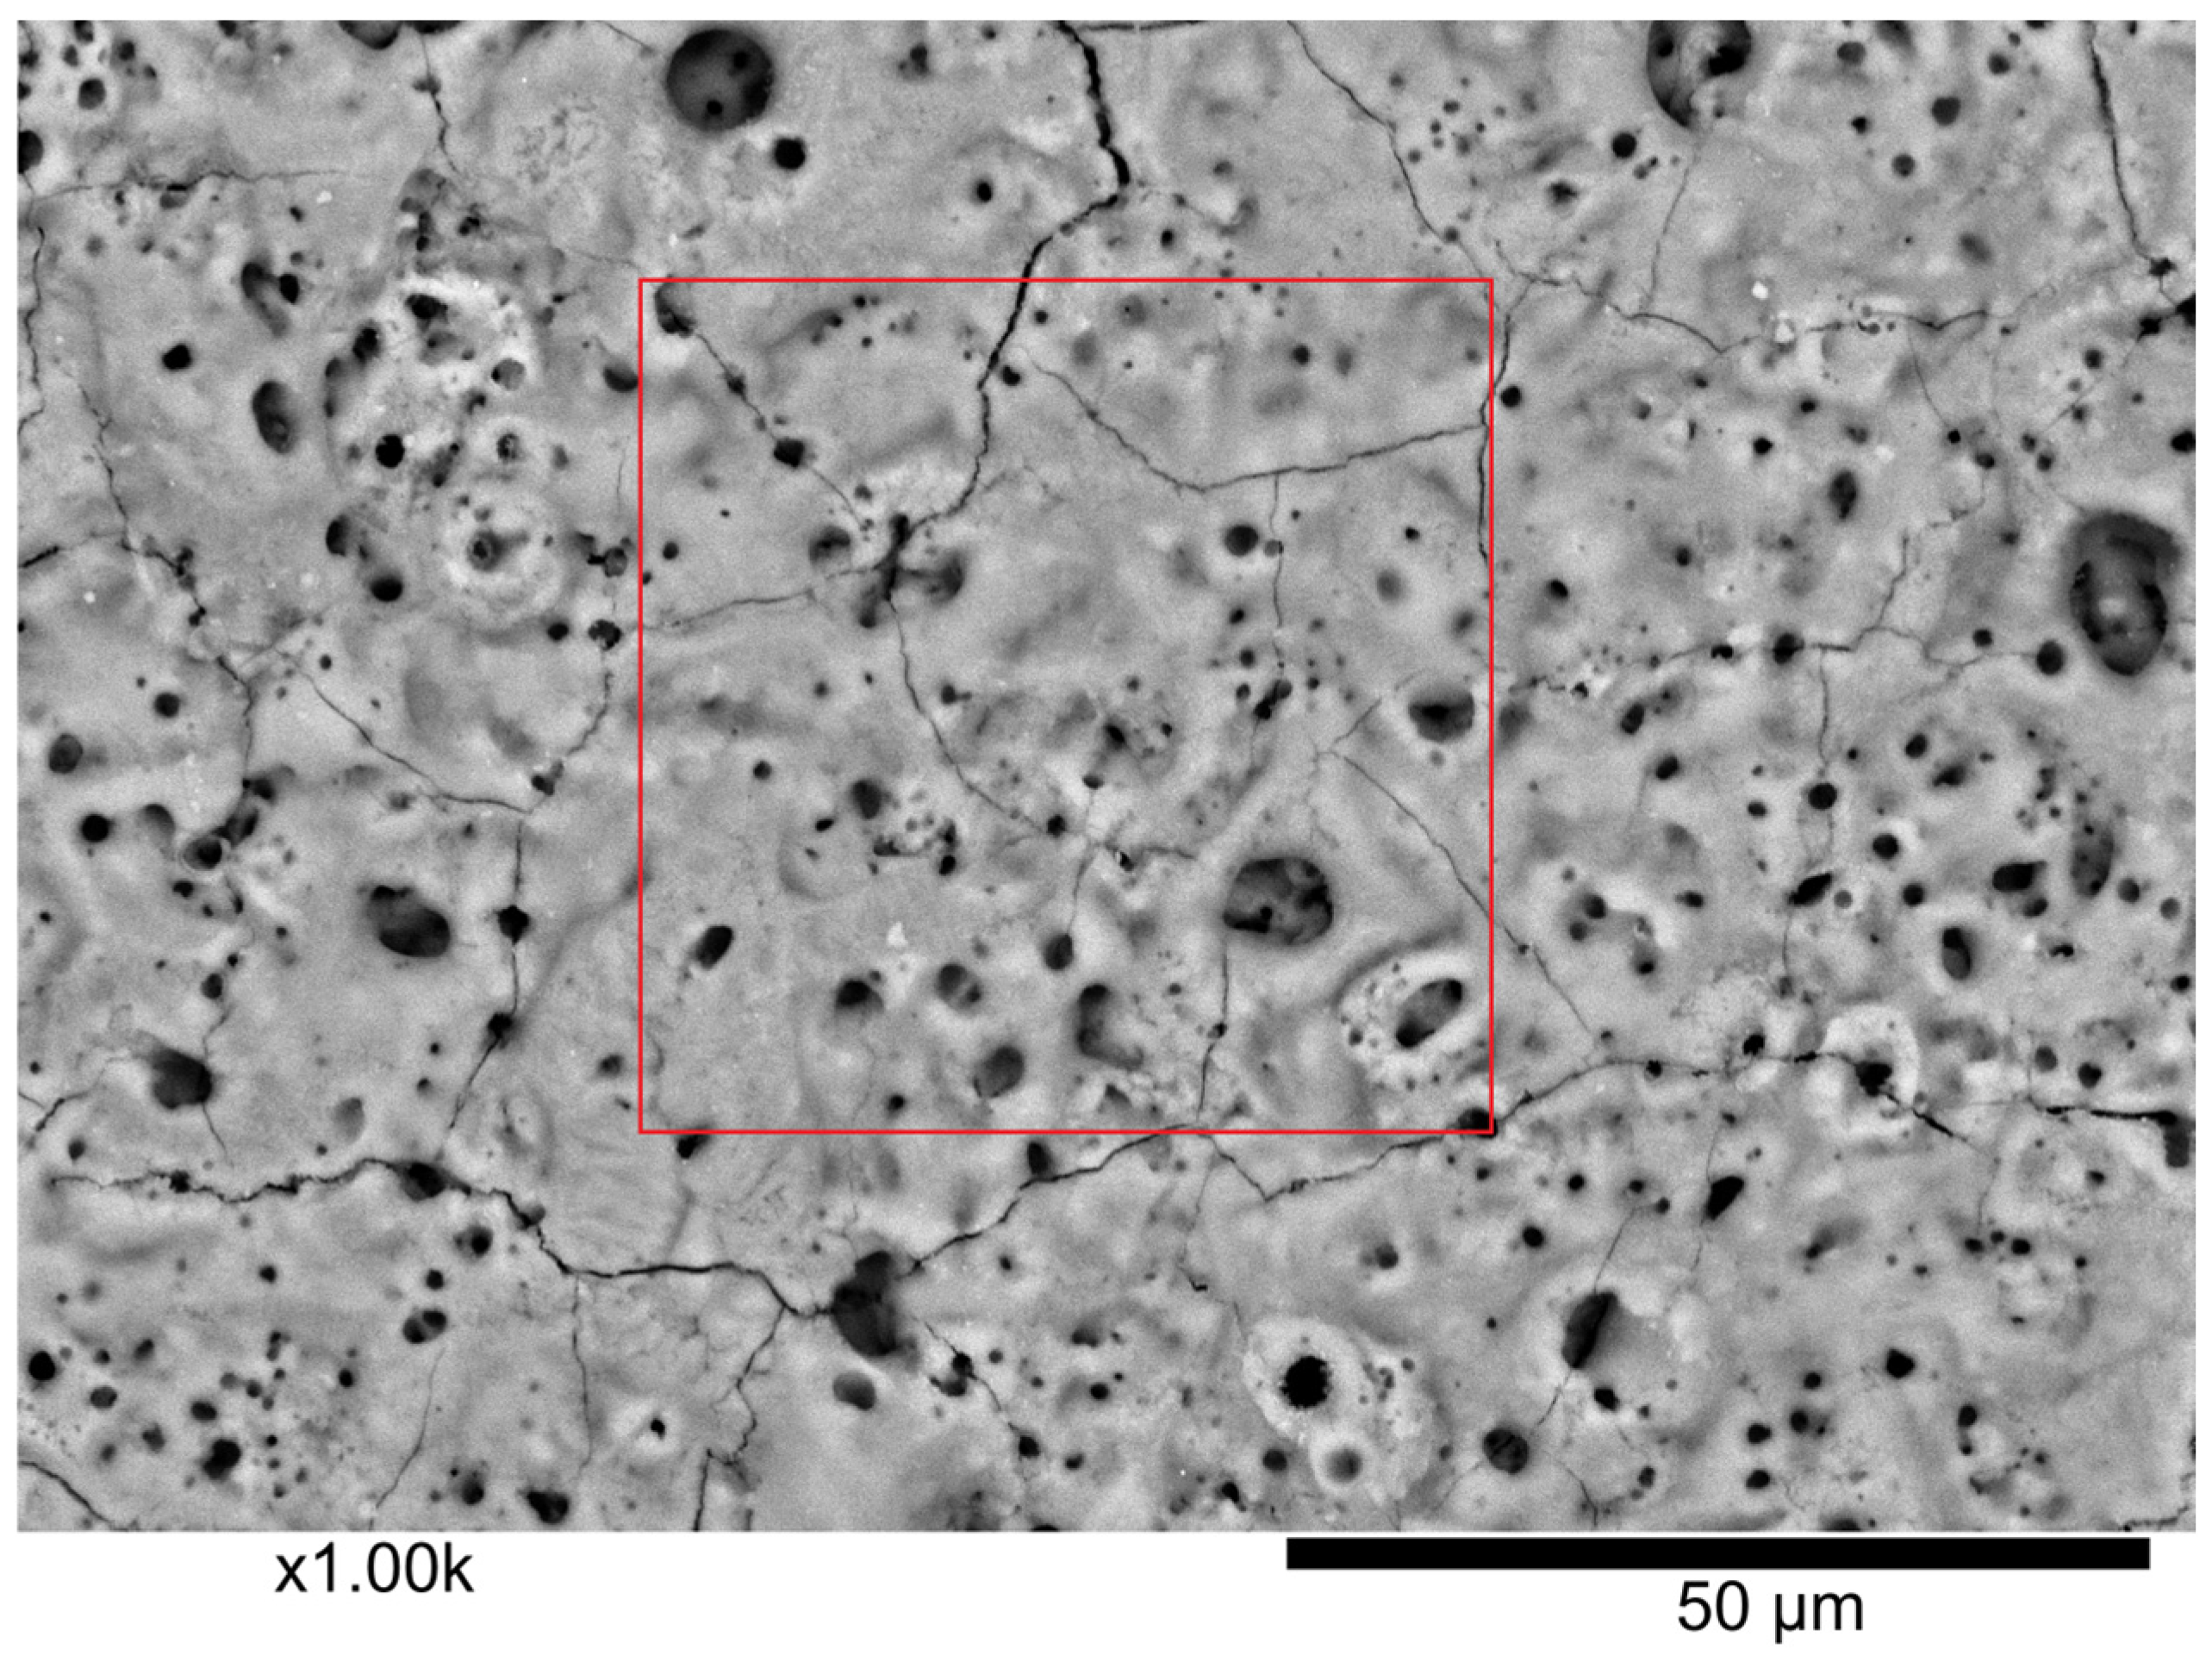
Figure 1. SEM image of an oxide coating (Sample A) showing the surface morphology. The red square indicates the area selected for EDS analysis.
Coatings 15 00961 g001
Figure 2. Pareto charts presenting the absolute values of standardized effects on microhardness (a1) and Young’s modulus (b1), along with plots of marginal means with 95% confidence intervals for microhardness (a2) and Young’s modulus (b2).
Coatings 15 00961 g002
Figure 3. Response surface models of manufacturing parameters versus (a) HIT and (b) EIT.
Coatings 15 00961 g003
Figure 4. Photograph of an example crack for Sample A with critical loads Lc1, Lc2, and Lc3 marked.
Coatings 15 00961 g004
Figure 5. Pareto charts presenting the absolute values of standardized effects influencing critical loads Lc1 (a1); Lc2 (b1); Lc3 (c1), along with plots of marginal means with 95% confidence intervals for critical loads Lc1 (a2); Lc2 (b2); Lc3 (c2).
Coatings 15 00961 g005
Figure 6. Scratch test parameter characteristics for samples (ai); Fn—normal force, Ft—friction force, Pd—penetration depth.
Coatings 15 00961 g006aCoatings 15 00961 g006b
Figure 7. Pareto chart showing the absolute values of standardized effects influencing frictional force Ft (a), and a plot of marginal means with 95% confidence intervals for frictional force Ft (b).
Coatings 15 00961 g007
Figure 8. Isometric images after scratch tests of sample coatings: (AI).
Coatings 15 00961 g008
Figure 9. Penetration depth versus scratch length for oxide coatings formed under various PEO conditions (Samples A–I).
Coatings 15 00961 g009
Table 1. Total experiment plan.
SampleControlled Factors
On a Natural ScaleOn a Standard Scale
Peak Current Density
j [A/dm2]
Frequency
f [Hz]
x1x2
A101000−1−1
B1410001−1
C102000−11
D14200011
E101500−10
F14150010
G1210000−1
H12200001
I12150000
Table 2. The chemical composition by weight of the coating is shown in Figure 1 (expressed in %).
MgONaSiP
40.8325.380.5031.082.21
Table 3. Measured thicknesses of oxide coatings formed during the oxidation process.
SampleOxide Coatings Thickness
d [μm]
Standard Deviation [μm]
A10.220.74
B9.920.86
C8.400.76
D8.510.74
E8.910.62
F8.620.81
G8.310.59
H8.170.81
I8.580.68
Table 4. Measuring the hardness (HIT) and Young’s modulus (EIT).
SampleHIT [GPa]EIT [GPa]
A2.57 ± 1.9662.25 ± 23.77
B1.65 ± 0.5256.25 ± 22.13
C1.04 ± 0.5243.78 ± 12.94
D0.83 ± 0.3738.55 ± 11.95
E1.43 ± 0.5152.46 ± 11.43
F1.16 ± 0.9144.73 ± 17.10
G1.35 ± 1.4944.85 ± 20.47
H1.12 ± 0.7443.80 ± 11.87
I1.12 ± 0.4344.17 ± 6.96
Table 5. Critical loads for the examined coatings.
SampleLc1 [N]Lc2 [N]Lc3 [N]
A2.55 ± 0.052.83 ± 0.033.30 ± 0.10
B2.40 ± 0.002.97 ± 0.123.85 ± 0.05
C2.60 ± 0.002.85 ± 0.103.50 ± 0.10
D2.18 ± 0.032.35 ± 0.204.00 ± 0.10
E2.10 ± 0.002.38 ± 0.283.28 ± 0.13
F2.00 ± 0.002.40 ± 0.202.98 ± 0.03
G2.30 ± 0.002.23 ± 0.534.73 ± 0.78
H2.03 ± 0.032.58 ± 0.033.33 ± 0.03
I2.00 ± 0.002.55 ± 0.053.40 ± 0.00
Table 6. Measured values of the Sa and Sz roughness parameters.
SampleSa
[µm]
Sz
[µm]
A0.8478.776
B0.8488.966
C0.6867.094
D0.8016.538
E0.7607.299
F0.8527.950
G0.7357.111
H0.8106.871
I0.8787.269
Disclaimer/Publisher’s Note: The statements, opinions and data contained in all publications are solely those of the individual author(s) and contributor(s) and not of MDPI and/or the editor(s). MDPI and/or the editor(s) disclaim responsibility for any injury to people or property resulting from any ideas, methods, instructions or products referred to in the content.