Article

Preparation of Tung Oil Microcapsules Coated with Chitosan Sodium Tripolyphosphate and Their Effects on Coating Film Properties

1
Co-Innovation Center of Efficient Processing and Utilization of Forest Resources, Nanjing Forestry University, Nanjing 210037, China
2
College of Furnishings and Industrial Design, Nanjing Forestry University, Nanjing 210037, China
*
Author to whom correspondence should be addressed.
Coatings 2025, 15(8), 867; https://doi.org/10.3390/coatings15080867
Submission received: 3 July 2025 / Revised: 19 July 2025 / Accepted: 21 July 2025 / Published: 23 July 2025
(This article belongs to the Section Functional Polymer Coatings and Films)

Abstract

To address the high drying temperature, low yield, and low coating rate that characterize traditional chitosan/gum arabic microcapsules, this study used chitosan/sodium tripolyphosphate (STPP) ionic crosslinking to construct a composite wall, combined with optimized emulsifier compounding (T-80/SDBS), to prepare tung oil self-healing microcapsules. Orthogonal testing determined the following optimal parameters: a core-to-wall ratio of 2.0:1.0, a T-80/SDBS ratio of 4.0:6.0 (HLB = 12.383), an STPP concentration of 4%, and a spray-drying temperature of 120 °C. With these parameters, a yield of 42.91% and coating rate of 68.50% were achieved. The microcapsules were spherical (1–6 μm), with chitosan–STPP electrostatic interactions forming a dense wall. Adding 5% microcapsules to the UV topcoat enabled self-healing after 60 s UV curing: the scratch-healing rate reached 25.25% (width decreased from 11.13 μm to 8.32 μm), the elongation at break increased by 110% to 9.31%, the light transmission remained >82.50%, and the color difference (ΔE = 2.16) showed no significant change versus unmodified coating.

1. Introduction

Coatings are widely used as surface protection and decorative materials in the fields of construction, automobiles, furniture, and industrial equipment [1,2,3,4,5,6]. Traditional coatings are susceptible to mechanical damage, chemical corrosion, or environmental aging during long-term use [7,8,9,10,11], leading to cracking, peeling, or functional failure of the coating and shortening the service life of the material [12,13,14]. In recent years, with the rising demand for environmental protection and high performance, ultraviolet (UV)-curable coatings have attracted attention due to their fast curing, low volatile organic compound (VOC) emissions, and high hardness [15,16,17,18]. However, traditional UV coatings still suffer from insufficient toughness and a lack of damage self-healing ability, limiting their application in precision or high-durability scenarios [19,20,21,22,23]. Self-healing technology can significantly extend the service life of materials and reduce maintenance costs by giving them the ability to heal themselves after damage through their internal design [24,25,26,27,28,29]. Currently, self-healing mechanisms mainly include microencapsulated healing agents, reversible chemical bond reorganization, and microvascular network delivery [30,31,32,33,34]. Among them, microencapsulated self-healing technology has become a research hotspot because of its easy process and high healing efficiency [35,36,37].
The technology encapsulates the healing agent in microcapsules. When the coating is damaged, the microcapsule ruptures to release the healing agent, which heals the damaged area through polymerization, crosslinking, and other reactions [38,39,40,41]. However, the preparation parameters of microcapsules (e.g., core-to-wall ratio, wall stability, etc.) directly affect the healing effect, and how to optimize the performance of microcapsules to adapt to different coating systems is still a technical difficulty [42,43].
Self-healing microcapsules consist of a wall material with good mechanical strength and encapsulation stability, and a core material that is the healing agent (e.g., monomer, oil, or catalyst) [44,45,46]. In existing studies, natural polymers (e.g., chitosan, gum arabic) are widely used as wall materials due to their biocompatibility, degradability, and low cost [47]. However, the traditional chitosan–gum arabic microcapsules have defects such as a high drying temperature and a low yield and coating rate [48]. To overcome these problems, this study innovatively used sodium tripolyphosphate (STPP) and crosslinked it with chitosan to form a composite wall material, utilizing the phosphoric acid root in STPP to form electrostatic interaction and hydrogen bonding with the amino and hydroxyl groups of chitosan to enhance the stability of the wall material. The core is made of tung oil, which is rich in conjugated double bonds and reactive groups that can polymerize under oxidation to heal cracks. The core-to-wall ratio, emulsifier ratio, and other parameters were optimized through orthogonal and one-way tests to significantly improve the yield and coating rate of microcapsules, which provided technical support for the development of high-efficiency self-healing UV coatings. Externally reinforced self-healing materials utilize physical mixing to place the healing agent in the material. When the material is damaged, the wall ruptures and the healing agent flows out and cures to achieve the effect of filling the crack [49,50]. Self-healing materials based on microcapsule technology contain a variety of typical systems, such as a dicyclopentadiene/Grubbs catalyst system, an epoxy resin-based system, an isocyanate system, a dry oil system, a polar solvent system, a silicone system, and a silicone oil-based system, which are wrapped around the healing agent through microcapsules, releasing the core healing agent to realize the self-healing function when the material is damaged [51,52,53].
Li et al. prepared tung oil-loaded microcapsules protected with polyurea formaldehyde (PUF) shells using in situ polymerization [54]. The microcapsules maintained a spherical shape with a core content greater than 80.0 wt%. The microcapsules had good thermal stability. A bifunctional coating was prepared by incorporating tung oil microcapsules in epoxy resin. Under scarring or abrasion conditions, tung oil was released from the microcapsules, realizing the self-repairing and self-lubricating functions of the coating. The tung oil had excellent film-forming properties when in contact with oxygen. The self-healing anti-corrosion and self-lubricating anti-wear properties were evaluated by salt immersion corrosion test and wear test. Ji et al. prepared microcapsules using sodium alginate, chitosan, and Bifidobacterium longum as a wall material, an emulsification method and an endogel encapsulation method, respectively [55]. Both the alginate microcapsules and the chitosan-coated alginate microcapsules possessed sphere-forming properties. The alginate microcapsules retained their spheronization properties after freeze-drying.
Microcapsules made from chitosan and gum arabic as wall materials have the problems of high temperature during drying and low yield and coating rate of the microcapsules produced [56]. To solve this problem, sodium tripolyphosphate was used to crosslink with chitosan to form the wall material in order to produce microcapsules with better yield and encapsulation. Self-healing microcapsules were prepared by the ionic crosslinking method, using chitosan and sodium tripolyphosphate as wall materials and tung oil as the core material. Polyoxyethylene sorbitan monooleate (T-80) and sodium dodecylbenzene sulfonate (SDBS) were used as emulsifiers to be mixed with the core to form the emulsion. Sodium tripolyphosphate (STPP) is crosslinked with chitosan to form the wall. By changing the solution pH, chitosan crosslinks with STPP, and the phosphate and sodium ions in STPP can form electrostatic interactions, as well as hydrogen bonding with the amino and hydroxyl groups in chitosan, so that the microcapsule obtains a more stable shell. In this study, a four-factor, three-level orthogonal test was designed, and a one-factor test was further used to explore the preparation parameters that could produce microcapsules with a better coating rate and yield. The produced chitosan sodium tripolyphosphate-coated tung oil (CST-T) microcapsules were added to the UV topcoat to investigate the effect of the addition of different CST-T microcapsules on the performance of the coating film.

2. Test Materials and Methods

2.1. Materials

The materials used for the microcapsule preparation are detailed in Table 1. A UV topcoat (supplier: Jiangsu Haidian Technology Co., Ltd., Jiangsu, China), comprising polyurethane acrylic resin, propylene glycol diacrylate, hexylene glycol diacrylate, photoinitiator, functional fillers, matting agents, wax additives, defoamer, dispersant, and anti-settling agents, was applied to 75 mm × 25 mm glass substrates using silicone molds (50 mm × 25 mm × 25 mm). The experimental equipment used is cataloged in Table 2.

2.2. Preparation of CST-T Microcapsules

As shown in Table 3, a four-factor, three-level orthogonal test was designed to investigate the more favorable conditions for the preparation of CST-T microcapsules. We prepared different microcapsule samples by varying the preparation conditions. Our aim was to investigate how these conditions would affect the microcapsule yield and coating rate. This study was conducted to identify the optimal conditions for achieving an improved yield and coating rate. We investigated four factors in microcapsule preparation: the core-to-wall ratio, emulsifier ratio, the STPP concentration (as crosslinker), and the spray-drying temperature. Each factor was tested at three distinct levels. The selection of factor levels for the four-factor, three-level orthogonal test is shown in Table 3. The specific experimental arrangement is shown in Table 4.
For microcapsule sample 1, Table 5 shows the material dosages in the orthogonal experimental design with four factors at three levels each.
A 3% emulsifier solution was prepared by dissolving 0.119 g of T-80 and 2.261 g of SDBS in deionized water. Subsequently, 0.800 g of tung oil (1:1 core-to-wall ratio) was added to this emulsifier solution. The mixture was stirred at 50 °C and 1800 rpm for 1 h using a magnetic stirrer. Subsequently, it was ultrasonicated (1 s on/2 s off pulses) for 5 min to form a homogeneous milky-white core emulsion.
A 1% chitosan solution was prepared by dissolving 0.800 g of chitosan in 79.200 g of 1% acetic acid, followed by stirring (50 °C, 1000 rpm, 1 h). This solution was added dropwise to the core emulsion at pH 4.5, then mixed under identical stirring conditions for 1 h. Separately, 0.200 g of STPP was dissolved in 9.800 g of deionized water to form a 2% solution of STPP. This solution was added dropwise to the emulsion–wall mixture and crosslinked (50 °C, 1000 rpm, 2 h). After 24 h aging at room temperature, the product was spray-dried (inlet: 125 °C; feed rate: 150 mL/h) to obtain microcapsule powder.

2.3. Preparation of UV Coating Film with Addition of CST-T Microcapsules

CST-T microcapsules (5 wt%) were incorporated into the UV topcoat films according to Table 6. Specifically, 0.95 g of UV topcoat and 0.05 g of microcapsules were magnetically stirred (800 rpm, 15 min). The mixture was then applied to glass substrates, leveled for 10 min, and UV-cured (60 s).

2.4. Testing and Characterization

2.4.1. Sample Characterization of Microcapsules

Fourier transform infrared (FTIR) spectra of microcapsules were measured using a Bruker instrument model Equinox 55 spectrometer (Bruker Technology Co., Ltd., Hamburg, Germany), and FTIR spectra of polymers were measured using the attenuated total reflection (ATR) mode in the spectral range of 500–4000 cm−1.
Yield test: After the sample had been dried, the mass of the collected sample was weighed and recorded as Ma, and the mass of the raw material used in the sample-making was recorded as Mb; the ratio of the mass of the collected sample to the mass of the input material was the yield of the sample. The formula for the yield Y is shown in Equation (1).
Y = M a   M b   ×   100 %
Encapsulation rate test: A certain mass of the sample M0 was weighed and poured into a mortar, then grinded sufficiently to rupture the microcapsule walls. The ground sample was poured into a beaker and a certain amount of ethanol was added to the beaker so that the sample was well soaked. After 48 h, the samples were filtered using a vacuum filtration machine. The samples were continuously rinsed during the filtration process to separate the residual core material from the wall material. After filtration, the resulting product was dried in a blast oven at 50 °C until a constant weight was reached, at which time the weight was recorded as M1. C was calculated as shown in Equation (2).
C = M 0 M 1 M 0   ×   100 %
Characterization of morphology: The scanning electron microscope QUANTA-200 was used to characterize the microscopic morphology of microcapsules and coating films. To characterize the sample morphology using SEM, the sample was fixed on the sample stage with conductive adhesive. The sample was mounted on the sample holder according to the experimental requirements. The scanning electron microscope sample chamber was opened and the sample tray was mounted on the sample holder. The sample chamber was closed and a vacuum was applied to the sample chamber. After the vacuum was drawn, the sample was observed and images were taken through the software interface.
Characterization of chemical composition: The chemical composition of microcapsules and varnish films were tested and characterized using the FTIR spectrometer VERTEX 80V (Bruker Technology Co., Ltd., Hamburg, Germany). To test the lacquer film samples, the surface of the ATR crystals was cleaned first. The samples to be tested were prepared to the appropriate size. The parameters were adjusted according to the experimental requirements of the sample. The sample to be measured was placed on the surface of the ATR crystal, ensuring the sample was in good contact with the surface, and the sample was pressed by rotating the sampling holder. Spectra were collected and data were saved on the software interface. The KBr pressing method was used for testing the microcapsules and other powdered samples. A 1 mg sample of microcapsules was placed in a mortar with 100 mg of KBr powder and a pestle was used for thorough grinding. Subsequently, the powder was poured into a mold for tableting. Finally, the insert plate containing the mold cover and the sample ingot was inserted directly into the sample holder of the instrument for measurement.

2.4.2. Coating Film Performance Tests

Self-healing performance test: The self-healing performance of the coating film was tested using the scratch test. The surface of the coating was scratched with a razor blade, and the width of the scratch was observed and recorded with an optical microscope, which was recorded as W1. Then, 48 h later, the scratch was observed again and the width of the scratch was recorded as W2; the self-healing rate of the coating film was calculated from W2 and W1. The formula for calculating the self-healing rate H is shown in Equation (3).
H = W 1 W 2 W 1   ×   100 %
Glossiness test of coating film: According to GB/T 4893.6-2013 [57], the coating film was tested for glossiness. The glossiness tester HG268 can be used to measure the glossiness presented by the coating when it is irradiated by light sources of different angles. To test the surface gloss of a coating using the glossiness tester, the coating was covered with the measuring window at the bottom of the instrument and the data were subsequently recorded by clicking on the measuring button. The surface gloss of the coating with the addition of microcapsules was recorded as G1, and the surface gloss of the coating film without microcapsules was recorded as G0. The formula for calculating the rate of loss of gloss G is shown in Equation (4).
G = G 0 G 1 G 0   ×   100 %
Color difference test of coating film: The Colorimeter CR7 was used to measure the color difference of the coating film surface. During the test, the color value of the UV topcoat without microcapsules was measured first, and then the color value of the coating film after microcapsules were added was measured, and the instrument automatically calculated the color difference value ΔE. The L value stood for the degree of lightness and darkness: the larger the L value was, the brighter the color of the sample was, and vice versa. The a value was used to measure the tendency of the color to be reddish–greenish: if the a value was negative, it meant that the color was greenish, and if the a value was positive, it meant that the color was reddish. The b value was used to indicate the tendency of the color to be yellowish-blue: if the b value was negative, it meant the color was bluish, and if the b value was positive, it meant the color was yellowish.
Visible light transmittance test of coating film: Visible light transmittance is the ability of light to pass through a sample, and the percentage of the luminous flux passing through the sample to its incident luminous flux is the light transmittance of the prepared coating film. The UV spectrophotometer U3900 was used to test the visible transmittance of coatings with and without microcapsules, and the visible transmittance τ of each sample was calculated according to Equation (5). τ_t(λ) represents the measured transmittance of the sample at wavelength λ as measured by the UV spectrophotometer, v(λ) is the CIE standard bright-vision visual function, and d(λ) is the relative spectral power distribution of the light source.
τ = λ d λ v ( λ ) τ t ( λ ) λ d λ v ( λ )
Roughness test of coating film: The fine roughness tester J8-4C was used to test the roughness. The sample was placed on the sample stage and the probe position was adjusted using the knob. When the probe was in contact with the sample surface, the test was started and the data were recorded.
Elongation at break test: The universal mechanical testing machine AGS-X was used to test the elongation at break of the coating film. Each sample formulation was tested in quintuplicate (n = 5), and results are reported as mean values. The UV topcoat, after mixing it with the microcapsules, was poured into a mold, cured, and demolded. The ends of the coating film were clamped in the fixture of the universal mechanical testing machine. The speed during stretching was set to 0.5 mm/min and the samples were stretched to break. The elongation at break of the coating film was calculated as shown in Equation (6), where e denotes the elongation at break of the coating film at the break point, L0 is the initial distance between the upper and lower fixtures when the coating film was stretched, and L1 is the distance between the upper and lower fixture arms when the coating film was broken.
e = L 1 L 0 L 0   ×   100 %

3. Results and Discussion

3.1. Yield and Encapsulation Rate of CST-T Microcapsules

A four-factor, three-level orthogonal experimental design was implemented to optimize the encapsulation efficiency of the chitosan–STPP/tung oil (CST-T) microcapsules, yielding nine distinct formulations. As quantified in Table 7, the encapsulation rates ranged from 42.00% (sample 1) to 68.00% (samples 5 and 9). Statistical analysis revealed the significance hierarchy of factors affecting encapsulation efficiency as B > A > D > C, indicating that the emulsifier ratio (ratio of T-80 to SDBS) exerted the strongest influence, followed by the core-to-wall ratio and the spray-drying temperature, while the STPP concentration demonstrated minimal impact. The optimal condition combination was identified as A2B3C3D1, with a core-to-wall ratio of 2.0:1.0, a T-80-to-SDBS ratio of 3.5:6.5, an STPP concentration of 4%, and spray-drying temperature of 125 °C. These parameters produced microcapsules with maximized encapsulation efficiency.
Analysis of variance for the microcapsule encapsulation rates is presented in Table 8. The factor significance hierarchy for the chitosan–sodium tripolyphosphate-coated tung oil microcapsule yield was as follows: emulsifier ratio (T-80:SDBS) > core-to-wall ratio > spray-drying temperature > STPP concentration. Factors A (core-to-wall ratio) and B (emulsifier ratio) showed highly significant effects (p < 0.01) on encapsulation rates, whereas Factors C (STPP concentration) and D (temperature) demonstrated no statistical significance. These findings align with the range analysis of encapsulation rates.
The results of the yield of microcapsules in the four-factor, three-level orthogonal test were analyzed as shown in Table 9. The highest yield of all the samples produced in the orthogonal test was obtained for the sample 5 microcapsules, with 50.68%, followed by the sample 3 microcapsules with 41.94%, while the sample 9 microcapsules had the lowest yield of 25.09%. The effect of the four factors on microcapsule yield was A > C > B > D, i.e., the core-to-wall ratio had the greatest effect on microcapsule yield, followed by STPP concentration and emulsifier ratio. The levels of each factor more favorable for making high yield microcapsules were A2 B2 C3 D1, respectively. This indicates that the microcapsule samples produced in this orthogonal test when the microcapsules were prepared under the conditions of core-to-wall ratio of 2.0:1.0, the ratio of emulsifier T-80 to SDBS of 2.0:8.0, the concentration of STPP of 4%, and the spray-drying temperature of 125 °C achieved a high yield.
The analysis of variance of the results of the encapsulation rate of microcapsules in the orthogonal test is shown in Table 10. The order of influence on microcapsule yield was as follows: the core-to-wall ratio, the concentration of the crosslinker STPP, the ratio of T-80 to SDBS in the emulsifier, and finally, the drying temperature. Factor A: the core-to-wall ratio, Factor B: the emulsifier compounding ratio, and Factor C: the crosslinker STPP concentration all had a significant effect on the results of the microencapsulation yield. Factor D: the spray-drying temperature had no significant effect on the results of the microcapsule encapsulation rate.
In order to obtain a better coating rate and yield, a one-way test was designed based on the results of the orthogonal test. In the orthogonal test, the factor that had the greatest effect on the encapsulation rate of the microcapsules was Factor B: the emulsifier compounding ratio. Factor A: the core-to-wall ratio had the greatest effect on the yield of microcapsules, and there was a higher yield of microcapsules when A2 was used. Since microcapsules with a high encapsulation rate provide more restorative agents when applied, a one-factor test was designed focusing on the results of the encapsulation rate test. According to the results of orthogonal tests, it was found that the preparation conditions for the samples with the best yield and the best coating rate were somewhat similar. The samples with the optimal coating rate were prepared under the conditions of A2 B3 C3 D1, and the samples with the optimal yield were prepared under the conditions of A2 B3 C3 D1. Therefore, a one-way test was designed to prepare microcapsules using the ratio of the two emulsifiers as a variable. Considering the effects of the levels of other factors on the experiments, levels A2 C3 D1 were used for the other three factors in the one-way test, i.e., a core-to-wall ratio of 2.0:1.0, a crosslinking agent STPP concentration of 4%, and a spray-drying temperature of 120 °C, respectively.
The yield and encapsulation rate of microcapsules obtained in the one-way test are shown in Table 11. The highest yield was 44.08% for microcapsule Sample 12 prepared at an emulsifier ratio of 3.0:7.0; this was followed by microcapsule sample 14 prepared at an emulsifier ratio of 4.0:6.0 with a yield of 42.91%. The lowest yield was 34.95% for microcapsule sample 16 prepared at an emulsifier ratio of 5.0:5.0. The HLB value of the compounded emulsifier was calculated as shown in Equation (7). The HLB value of the compounded emulsifier was calculated from the HLB values of the two emulsifiers used, and the mass was added. The HLB value of T-80 was 15.000, and the HLB value of SDBS was 10.638. W1 represents the mass of T-80 added to the complex emulsifier, and W2 represents the mass of SDBS added to the complex emulsifier.
HLB = W 1 × 15.000 +   W 2 × 10.638   W 1 + W 2
The yield of microcapsules produced in the one-way test showed a general trend of increasing and then decreasing. The HLB value of the emulsifier gradually decreased as the content of SDBS in the compound emulsifier increased, so the selection of emulsifiers with lower HLB values was not conducive to the enhancement of the yield of CST-T microcapsules. The highest encapsulation rate of 69.25% in the univariate test was achieved for microcapsule sample 15, followed by sample 14 with 68.50%, while the lowest encapsulation rate was only 49.50% for microcapsule sample 10. The encapsulation rate of the microcapsules produced in the test basically showed a trend of increasing and then decreasing, reaching a maximum under the preparation conditions of two emulsifiers in a ratio of 4.5:5.5, and the emulsifier used in the preparation of sample 15 had a higher HLB value compared to the other samples in the one-way test. The HLB value of the emulsifier was positively correlated with the encapsulation rate of sodium chitosan tripolyphosphate-coated tung oil microcapsules.
The STPP concentration critically influenced the capsule wall density through ionic crosslinking. At lower concentrations, insufficient crosslinking between chitosan’s amine groups and STPP’s phosphate anions resulted in porous walls, reducing encapsulation efficiency. Conversely, excess STPP caused over-aggregation of chitosan–STPP complexes, leading to irregular capsule morphology and lowered yield.
The optimal HLB value (12.383 for T-80/SDBS = 4:6) stabilized the oil-in-water emulsion by balancing its hydrophilic–lipophilic properties. A higher HLB value increased the emulsion viscosity, hindering droplet breakup during ultrasonication and yielding larger, less uniform capsules. A lower HLB value reduced the interfacial film rigidity, promoting the coalescence of tung oil droplets and lowering the encapsulation rate.

3.2. Morphology and Chemical Composition of CST-T Microcapsules

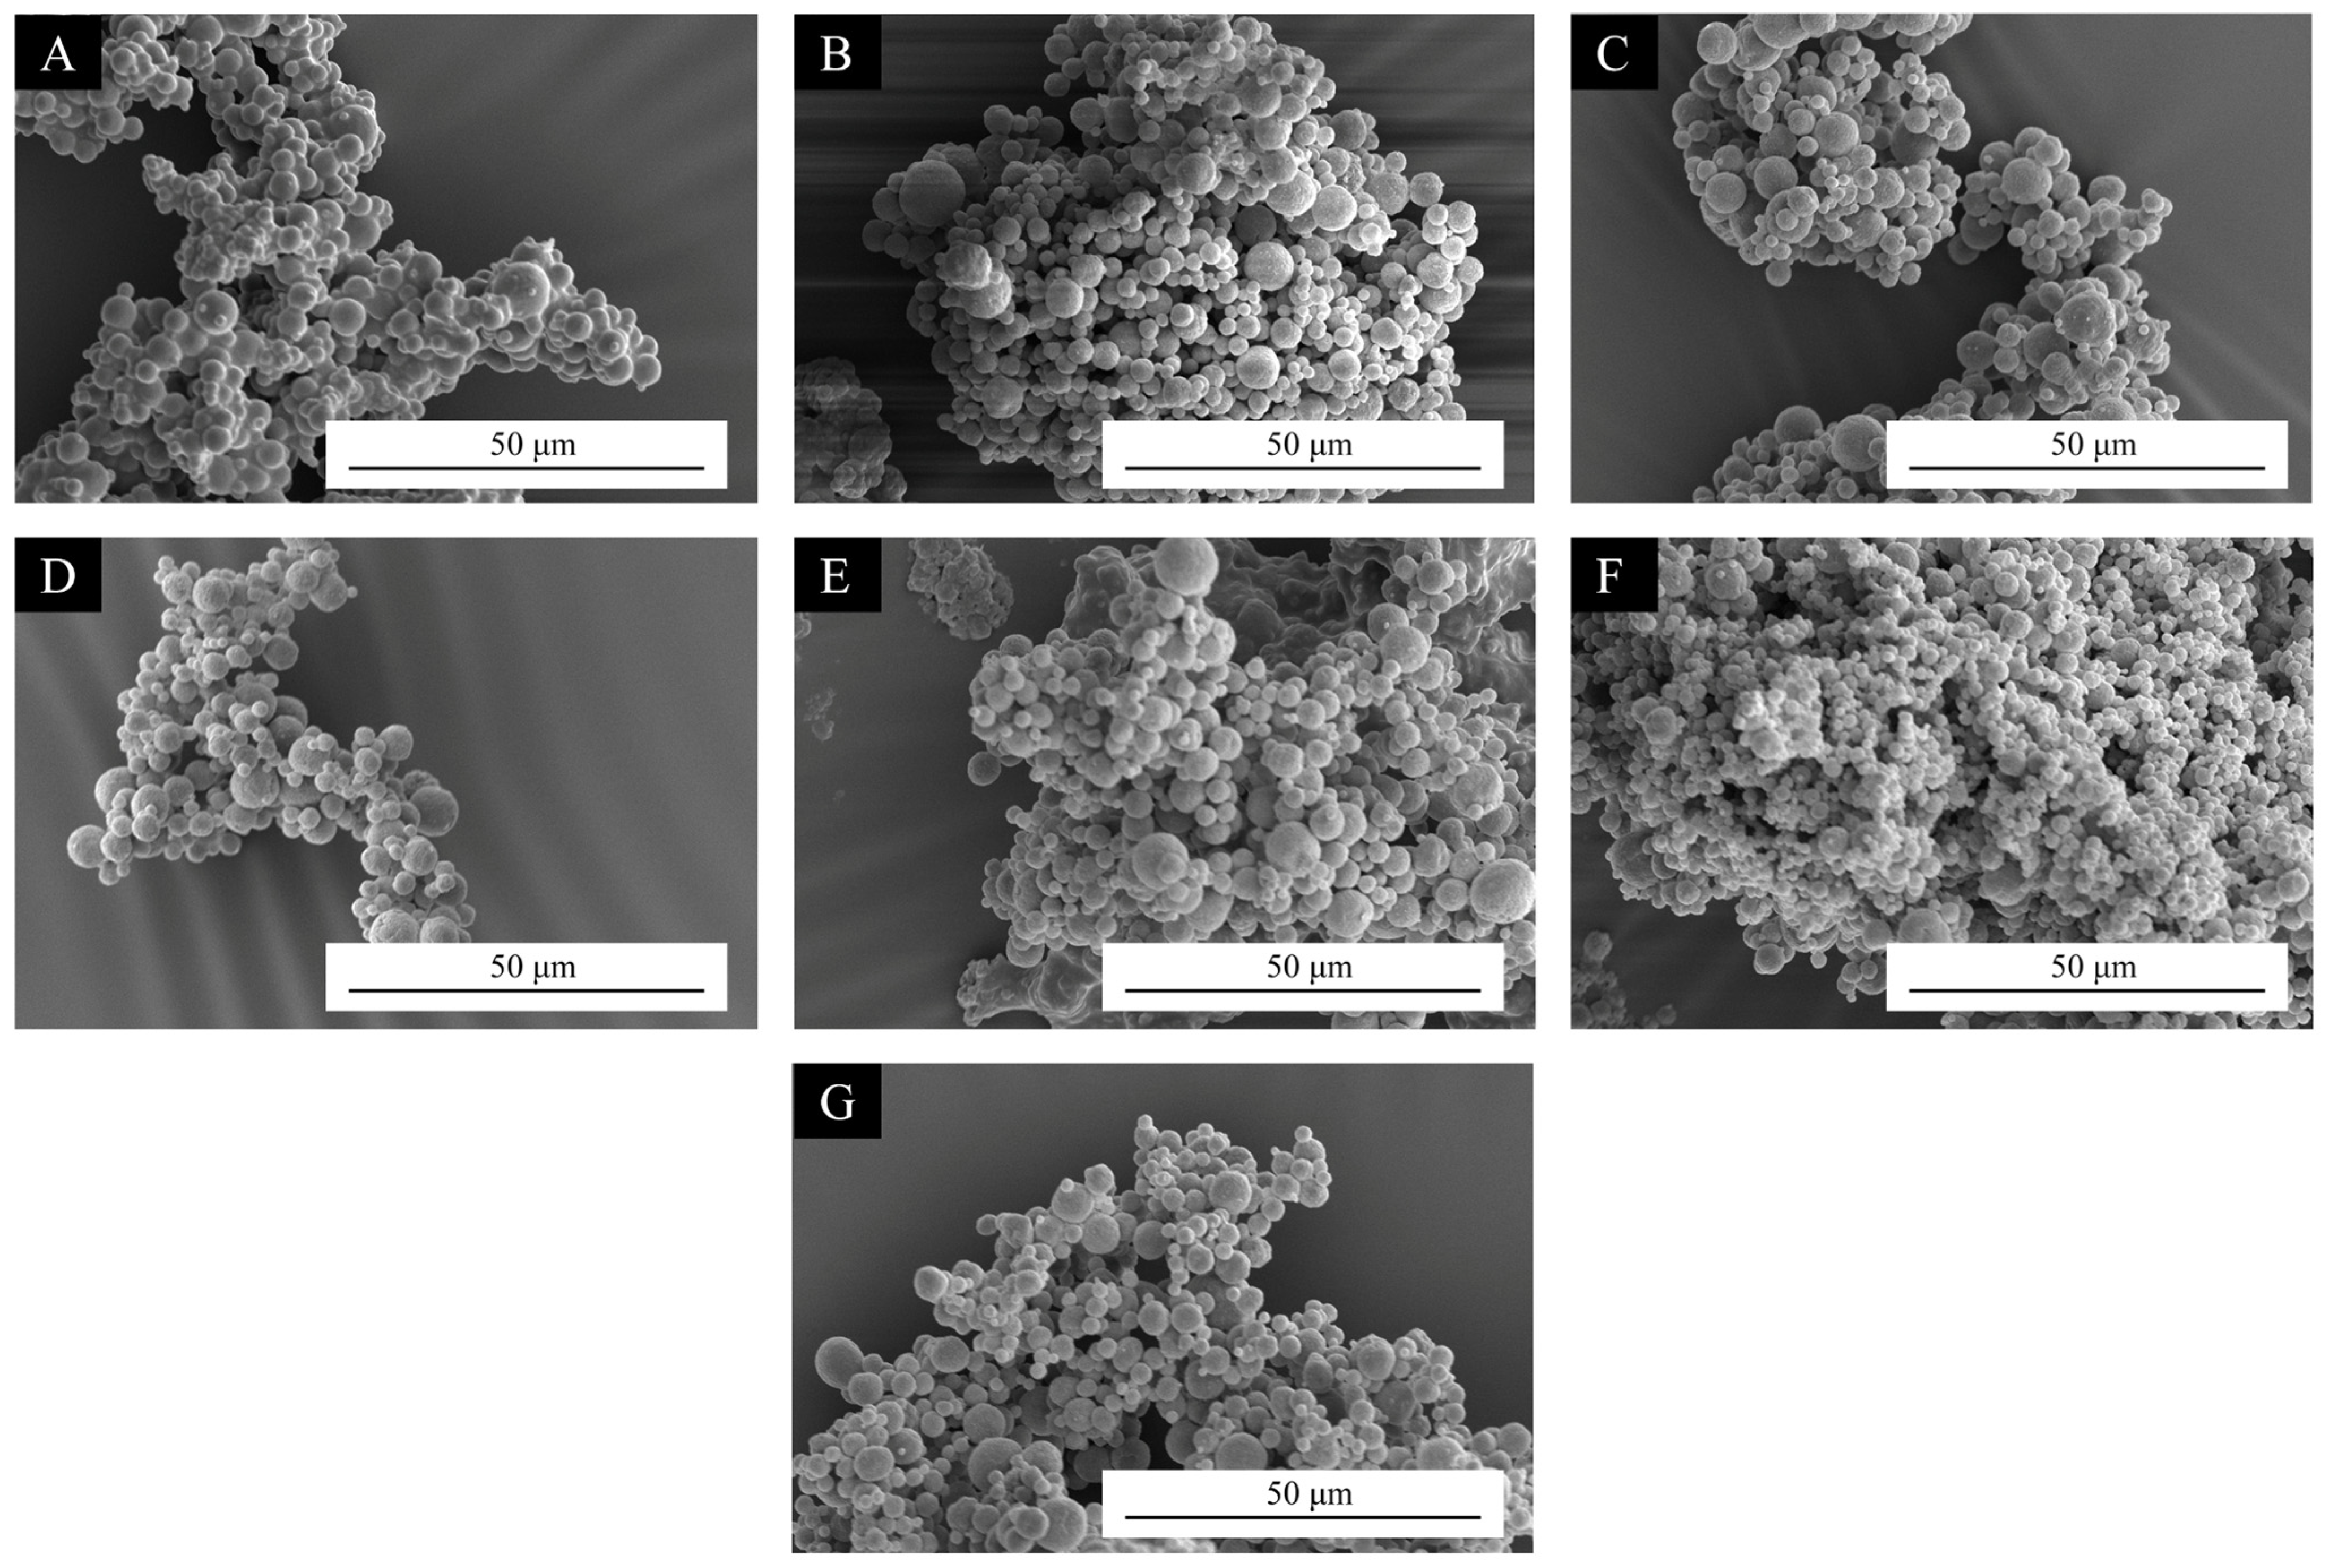
3.2.1. Morphology of Microcapsules

According to the microscopic morphology of the microcapsules produced in the one-way test, the microcapsule samples were all spherical, as shown in Figure 1. Except for sample 10, where the adhesion between the microcapsules was stronger and separate spheres could not be presented, the microcapsules made under the other conditions could be observed to present complete spheres for each microcapsule when observed by SEM. This was due to the 2.0:8.0 ratio of the two emulsifiers used in the preparation of sample 10. The HLB value of the emulsifier at this case was 11.510, which is a lower HLB value of the emulsifier used in the preparation compared to other microcapsule samples. These results indicate that lower HLB values of emulsifiers have a negative effect on microcapsule morphology.
The particle size distribution of the microcapsules produced in the one-way test is shown in Figure 2. In the samples of CST-T microcapsules produced by the one-way test, the particle sizes of microcapsule sample 10 were mainly distributed in the range of 1–4 μm, those of microcapsule sample 11 in the range of 1–3 μm, those of microcapsule sample 12 in the range of 1–4 μm, those of microcapsule sample 13 in the range of 2–4 μm, those of microcapsule sample 14 in the range of 1–5 μm, those of microcapsule sample 15 in the range of 1–6 μm, and those of microcapsule sample 16 in the range of 1–4 μm. The differences in the particle sizes of the microcapsules were small, due to the fact that the particle sizes of the microcapsules were mainly affected by the stirring speed. The higher the magnetic stirring speed, the smaller the particle sizes of the sample. The samples had a similar particle size distribution because the magnetic stirring speed used in preparing the microcapsules was the same. This also indicates that the particle size was minimally affected by the emulsifier.

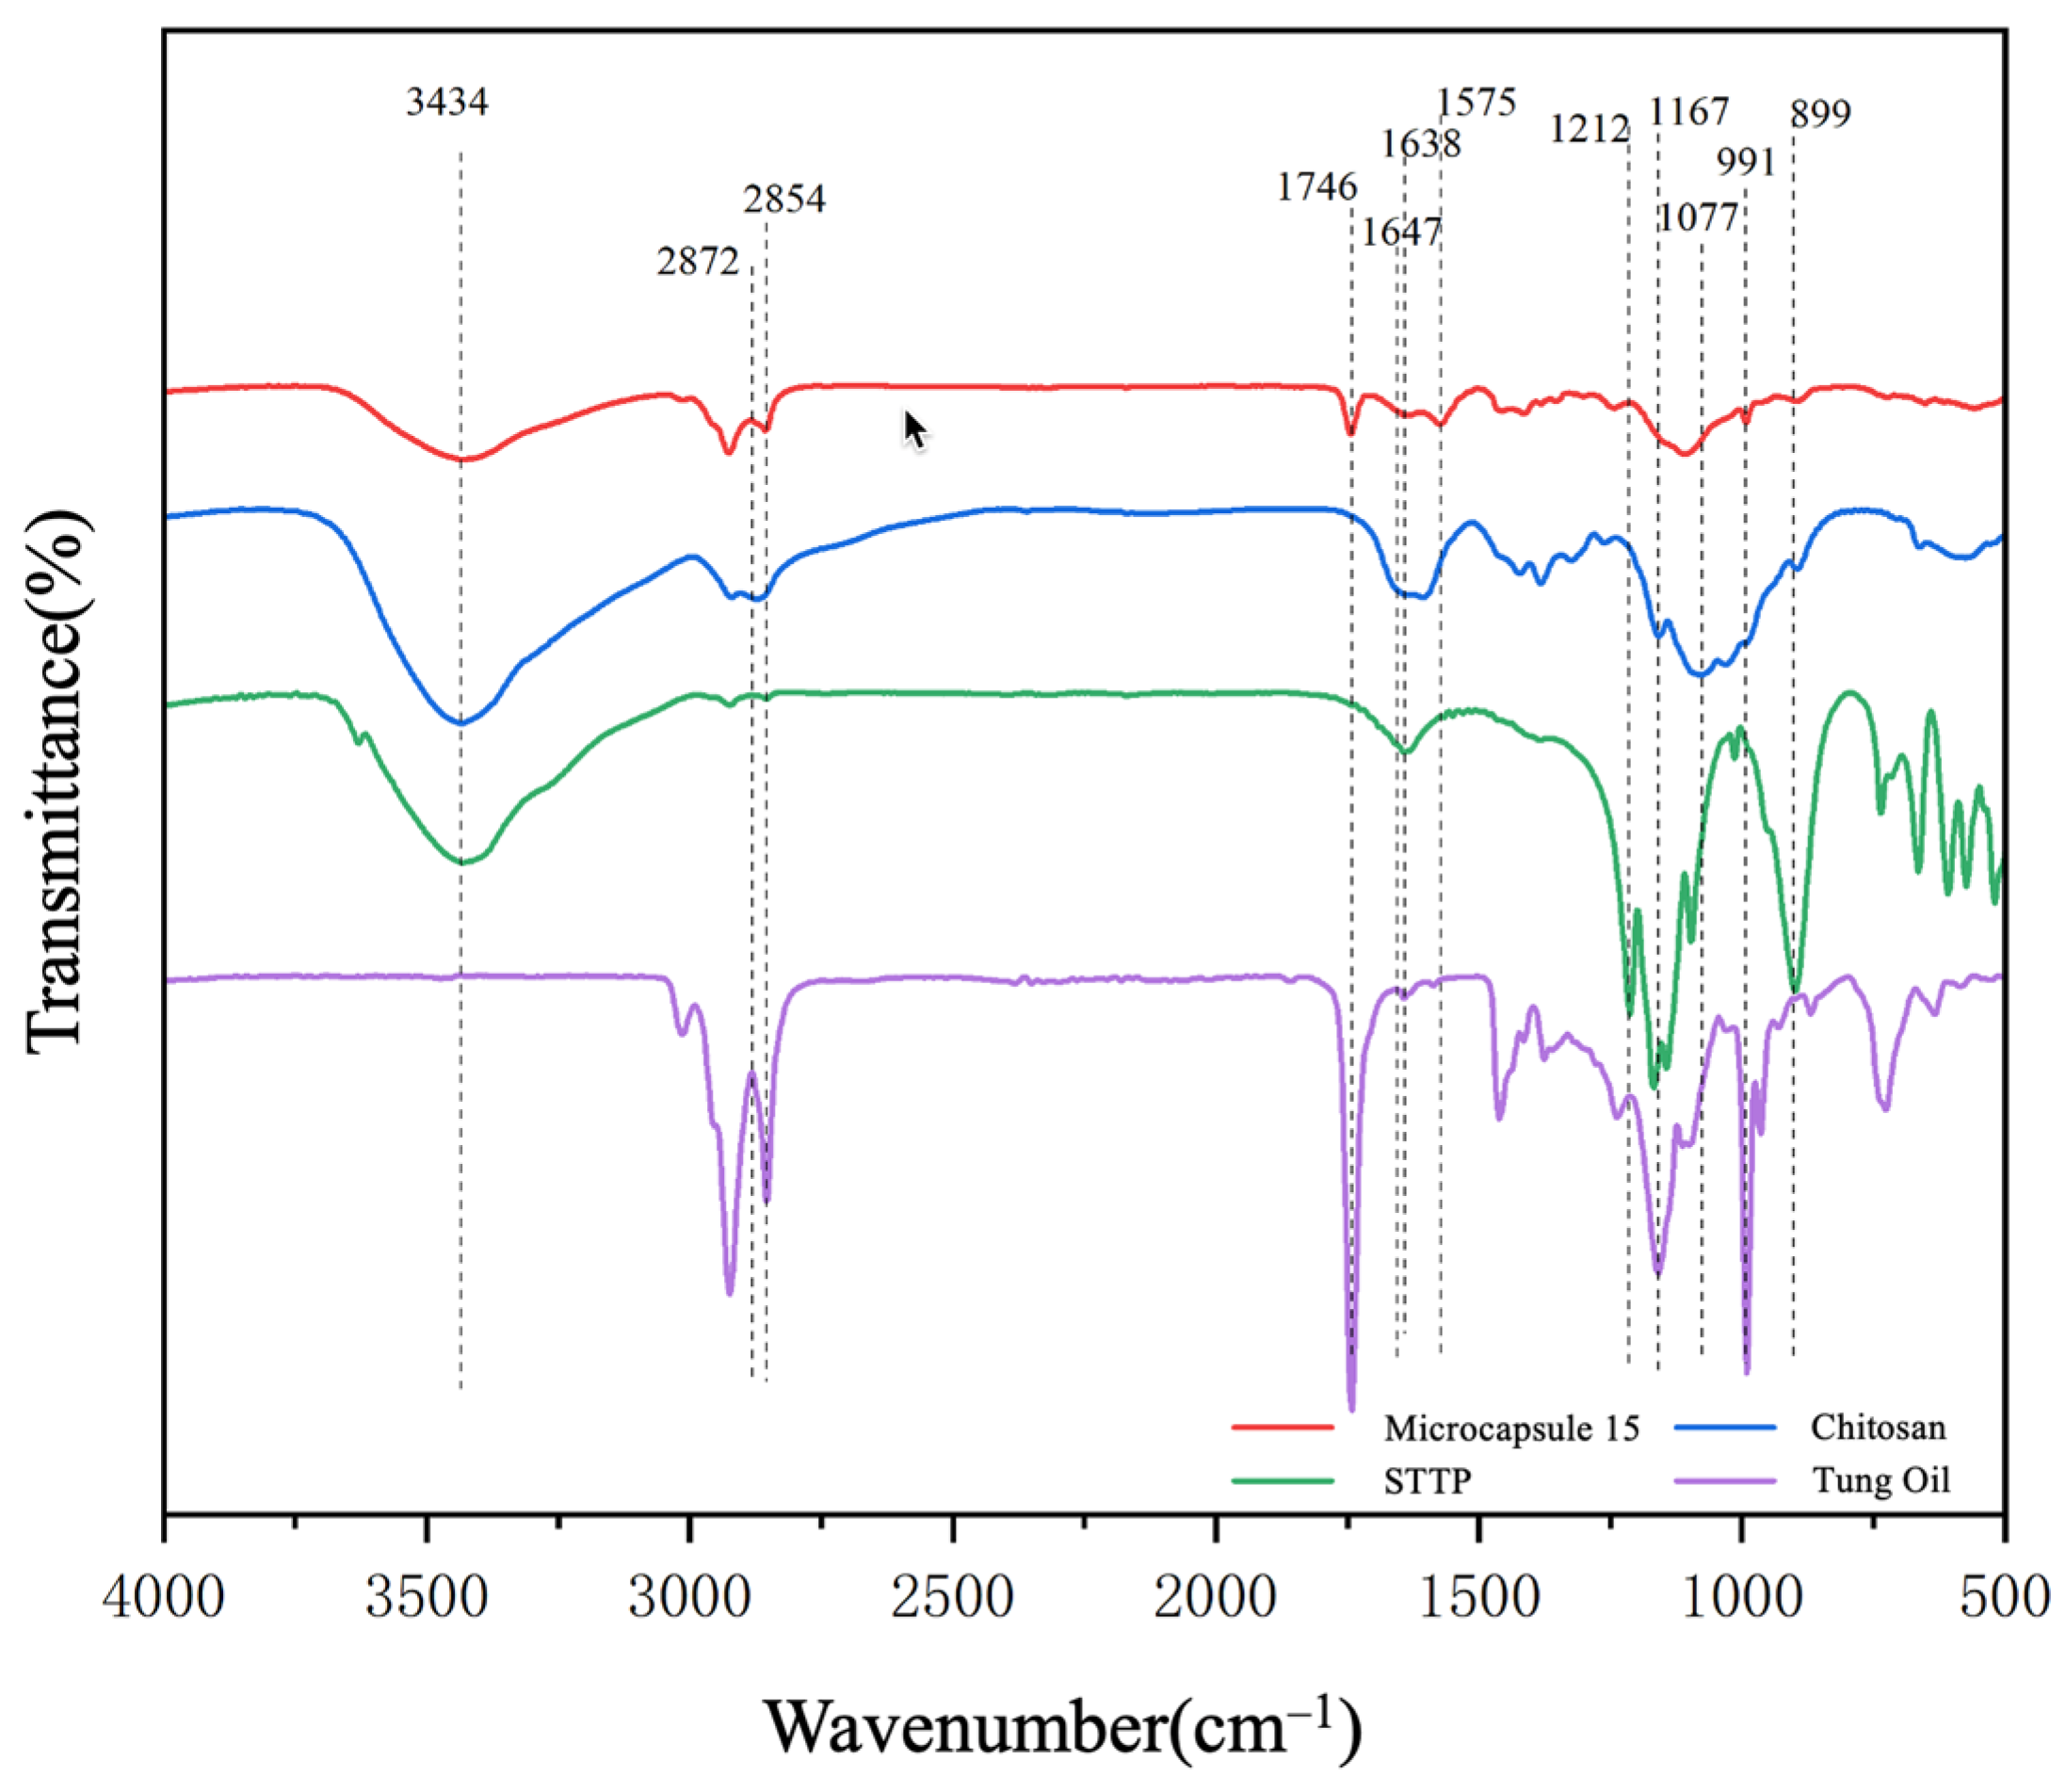
3.2.2. Chemical Composition Analysis of CST-T Microcapsules

Figure 3 shows the infrared spectra of the wall materials, chitosan and sodium tripolyphosphate; the core material, tung oil; and microcapsule sample 15. During testing, measurements for chitosan, sodium tripolyphosphate, and the microcapsules were taken using the KBr compression method, and tung oil was tested by dropping it directly on the surface of ATR crystals.
The C-H telescopic vibration peak at 2854 cm−1, the C=O telescopic vibration peak at 1746 cm−1, and the conjugated double bond bending vibration at 991 cm−1 are characteristic peaks of tung oil, which indicates the presence of tung oil in the sample. The vibration absorption peak of -OH at 3434 cm−1, the -CH telescopic vibration peak at 2873 cm−1, and the -NH2 vibration absorption peak at 1647 cm−1 are characteristic peaks of chitosan, indicating that chitosan is present in the sample. Sodium tripolyphosphate in the wall material exhibits a -OH vibrational absorption peak at 3434 cm−1, a characteristic peak of the P=O bond at 1212 cm−1, a peak at 1168 cm−1 from the telescopic vibration of the P-O bond, and a peak at 899 cm−1 due to the P-O bond’s bending vibration. In the IR spectrum of microcapsule sample 15, the vibrational absorption peak at 1647 cm−1 from -NH2 in chitosan, the telescopic vibration peak of P-O at 1168 cm−1 for sodium tripolyphosphate, and the bending vibration peak of P-O at 899 cm−1, which are shifted, as well as the new peak at 1575 cm−1, which arises from the interaction of the amino group of chitosan with the phosphate group of sodium tripolyphosphate, suggest that the wall of the microcapsules consists of both chitosan and sodium tripolyphosphate [58,59].
The characteristic peak of tung oil can be observed in the spectrum of microcapsule sample 15, and it can be judged that the core material, tung oil, was been successfully encapsulated in the wall material composed of chitosan and sodium tripolyphosphate, and the CST-T microcapsule was successfully prepared.

3.3. Morphology and Chemical Composition of UV Coating Films with Added CST-T Microcapsules

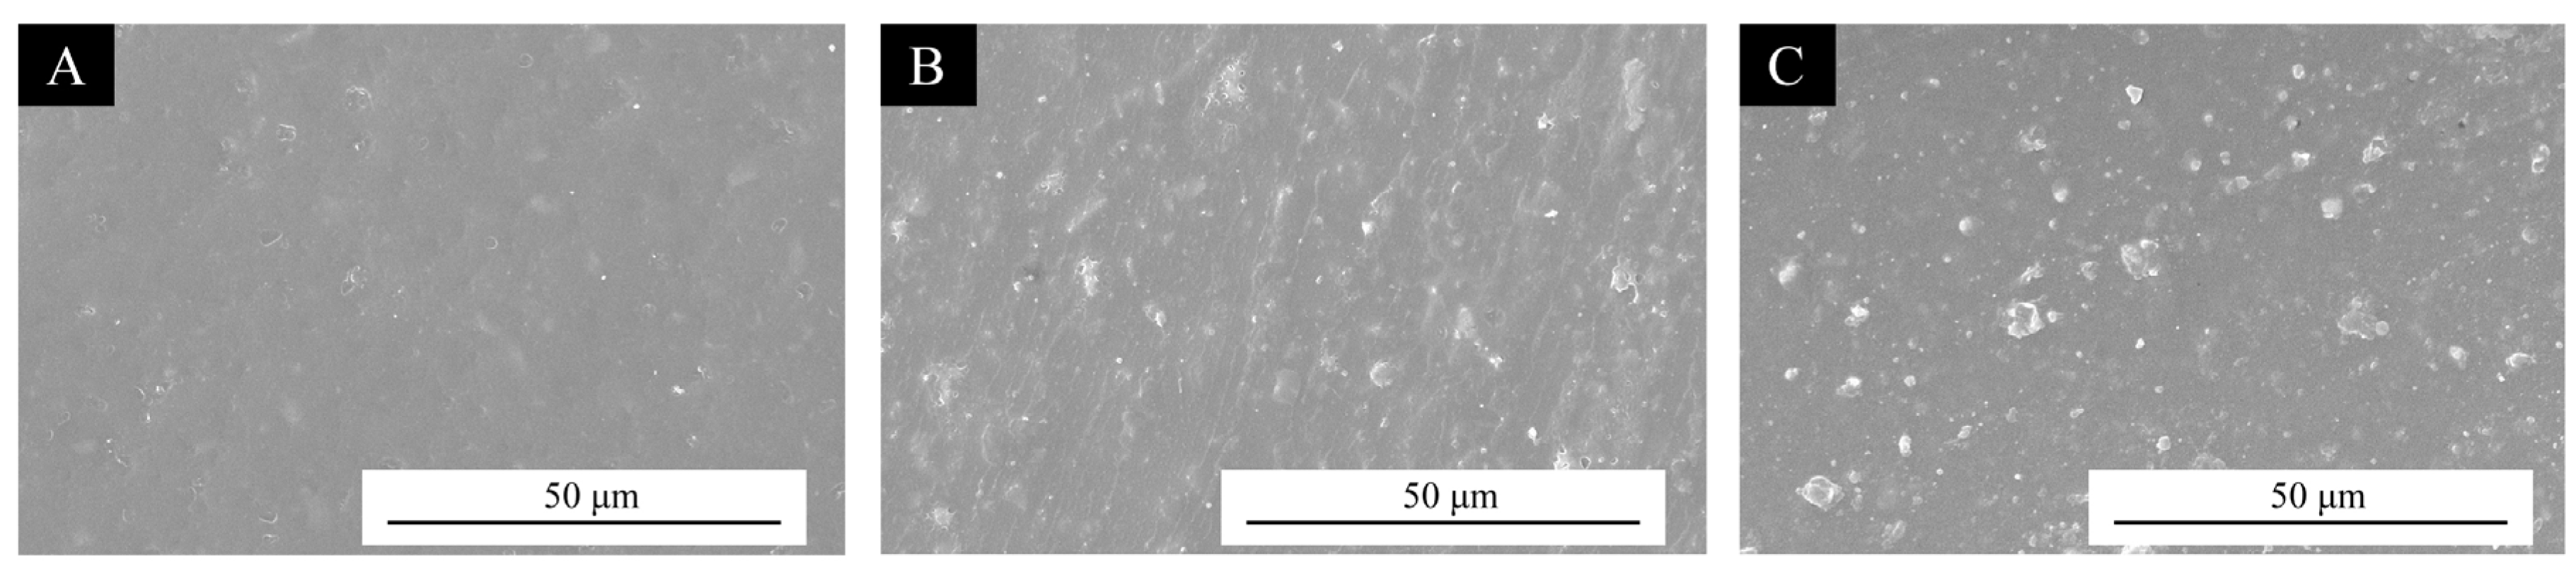
3.3.1. Morphology of UV Coating Film

Sample 12 microcapsules, with the highest yield in the one-way test, and sample 15 microcapsules, with the highest encapsulation rate in the one-way test, were selected to be added to the UV topcoat at a level of 5%, respectively, and poured into a silicone mold to make a coating film. As shown in Figure 4, the surface morphology of the UV topcoat, the UV topcoat with the addition of 5% sample 12 microcapsules, and the UV topcoat with the addition of 5% sample 15 microcapsules, respectively, were photographed using SEM. The surface of the blank UV topcoat is relatively flat, while the surface of the coating film with 5% microcapsules added shows uneven particles, but the surface of the coating film with the addition of these two microcapsule samples has a similar flatness due to the similar particle size of the microcapsules in sample 12 and sample 15.

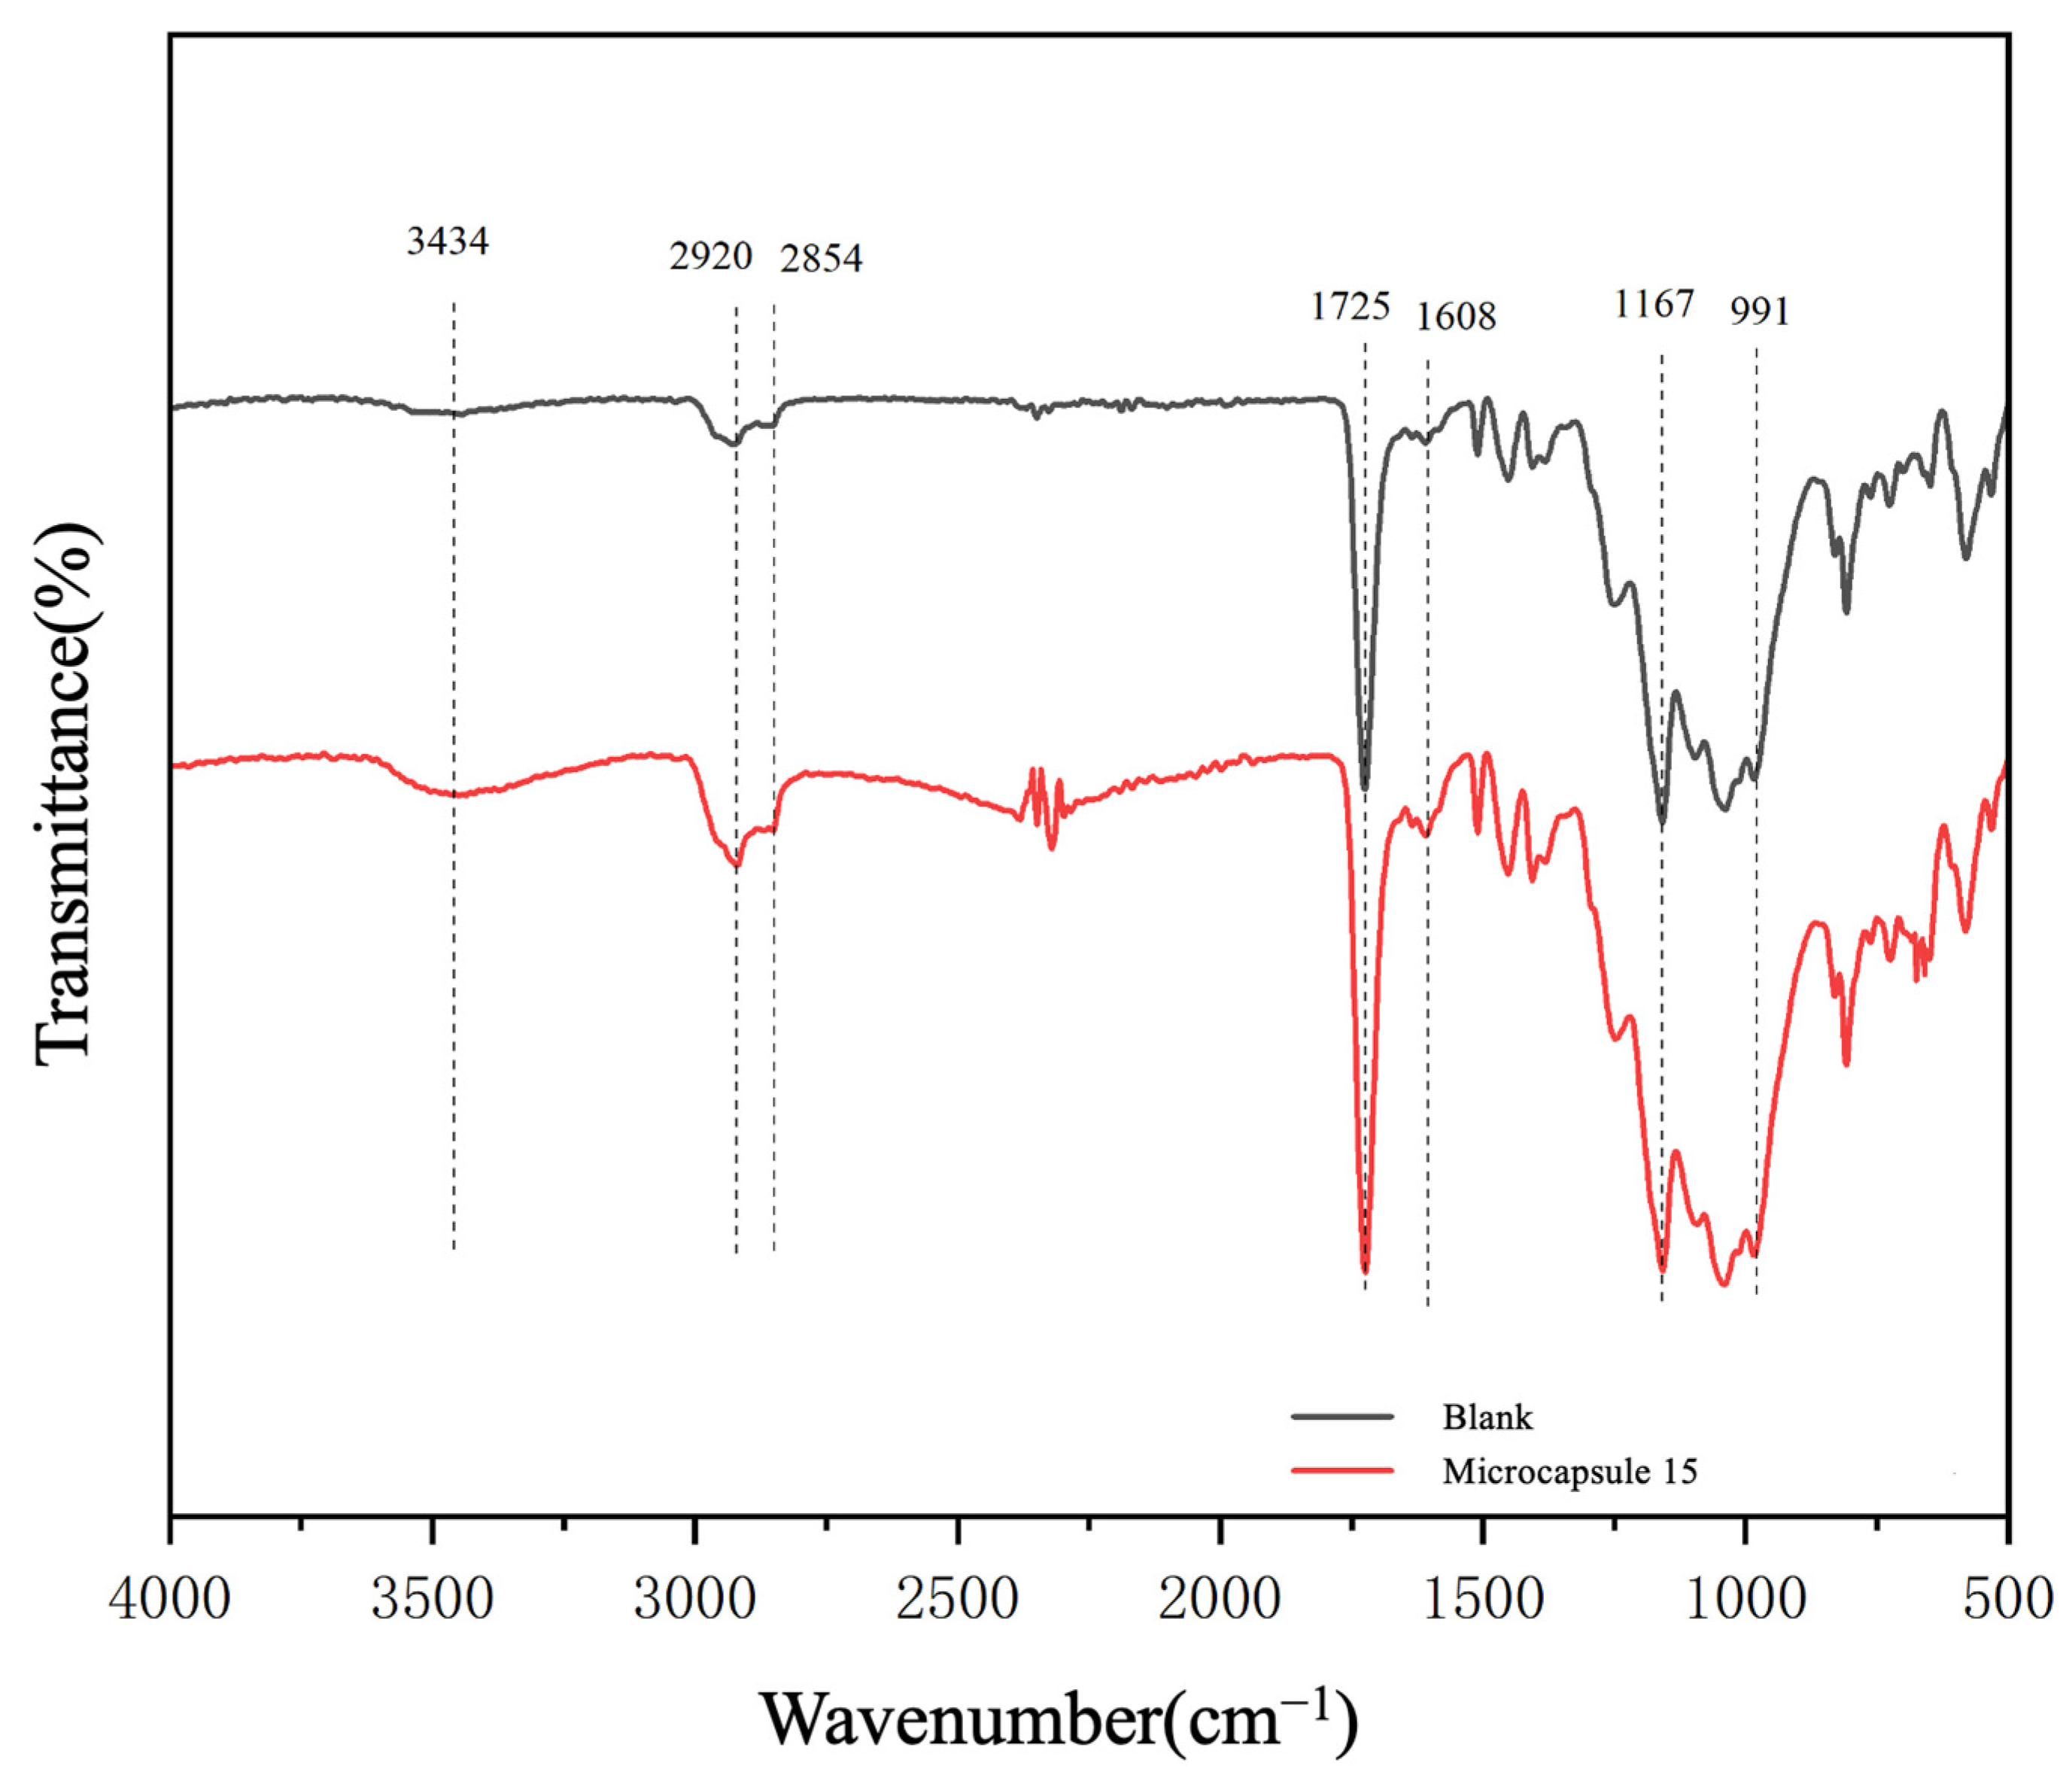
3.3.2. Chemical Composition Analysis of UV Coating Film

The FTIR spectra of the UV topcoat film with the addition of microcapsule sample 15, and the UV topcoat film without the addition of microcapsules, used as a blank control sample, are shown in Figure 5. The main components of the UV topcoat are urethane acrylic resin, propylene glycol diacrylate, and hexylene glycol diacrylate, and the common characteristic peaks of these components can be observed in the C=C telescopic vibration peak at 1608 cm−1, the C=O vibration peak at 1725 cm−1, and the C-H telescopic vibration peak at 2920 cm−1. These vibrational peaks of the blank UV topcoat can also be observed in the spectrum of the UV topcoat with the addition of sample 15 microcapsules, in addition to the vibrational absorption peak of -OH at 3434 cm−1 and the -CH stretching vibrational peak at 2920 cm−1, brought about by the microcapsules in the UV topcoat with the addition of sample 15 microcapsules [60,61]. The characteristic peaks of the UV topcoat and sample 15 microcapsules appear at the same time in the infrared spectra of the UV topcoat with the addition of microcapsules, which indicates that the microcapsules added to the UV topcoat were able to be maintained in a stable state.

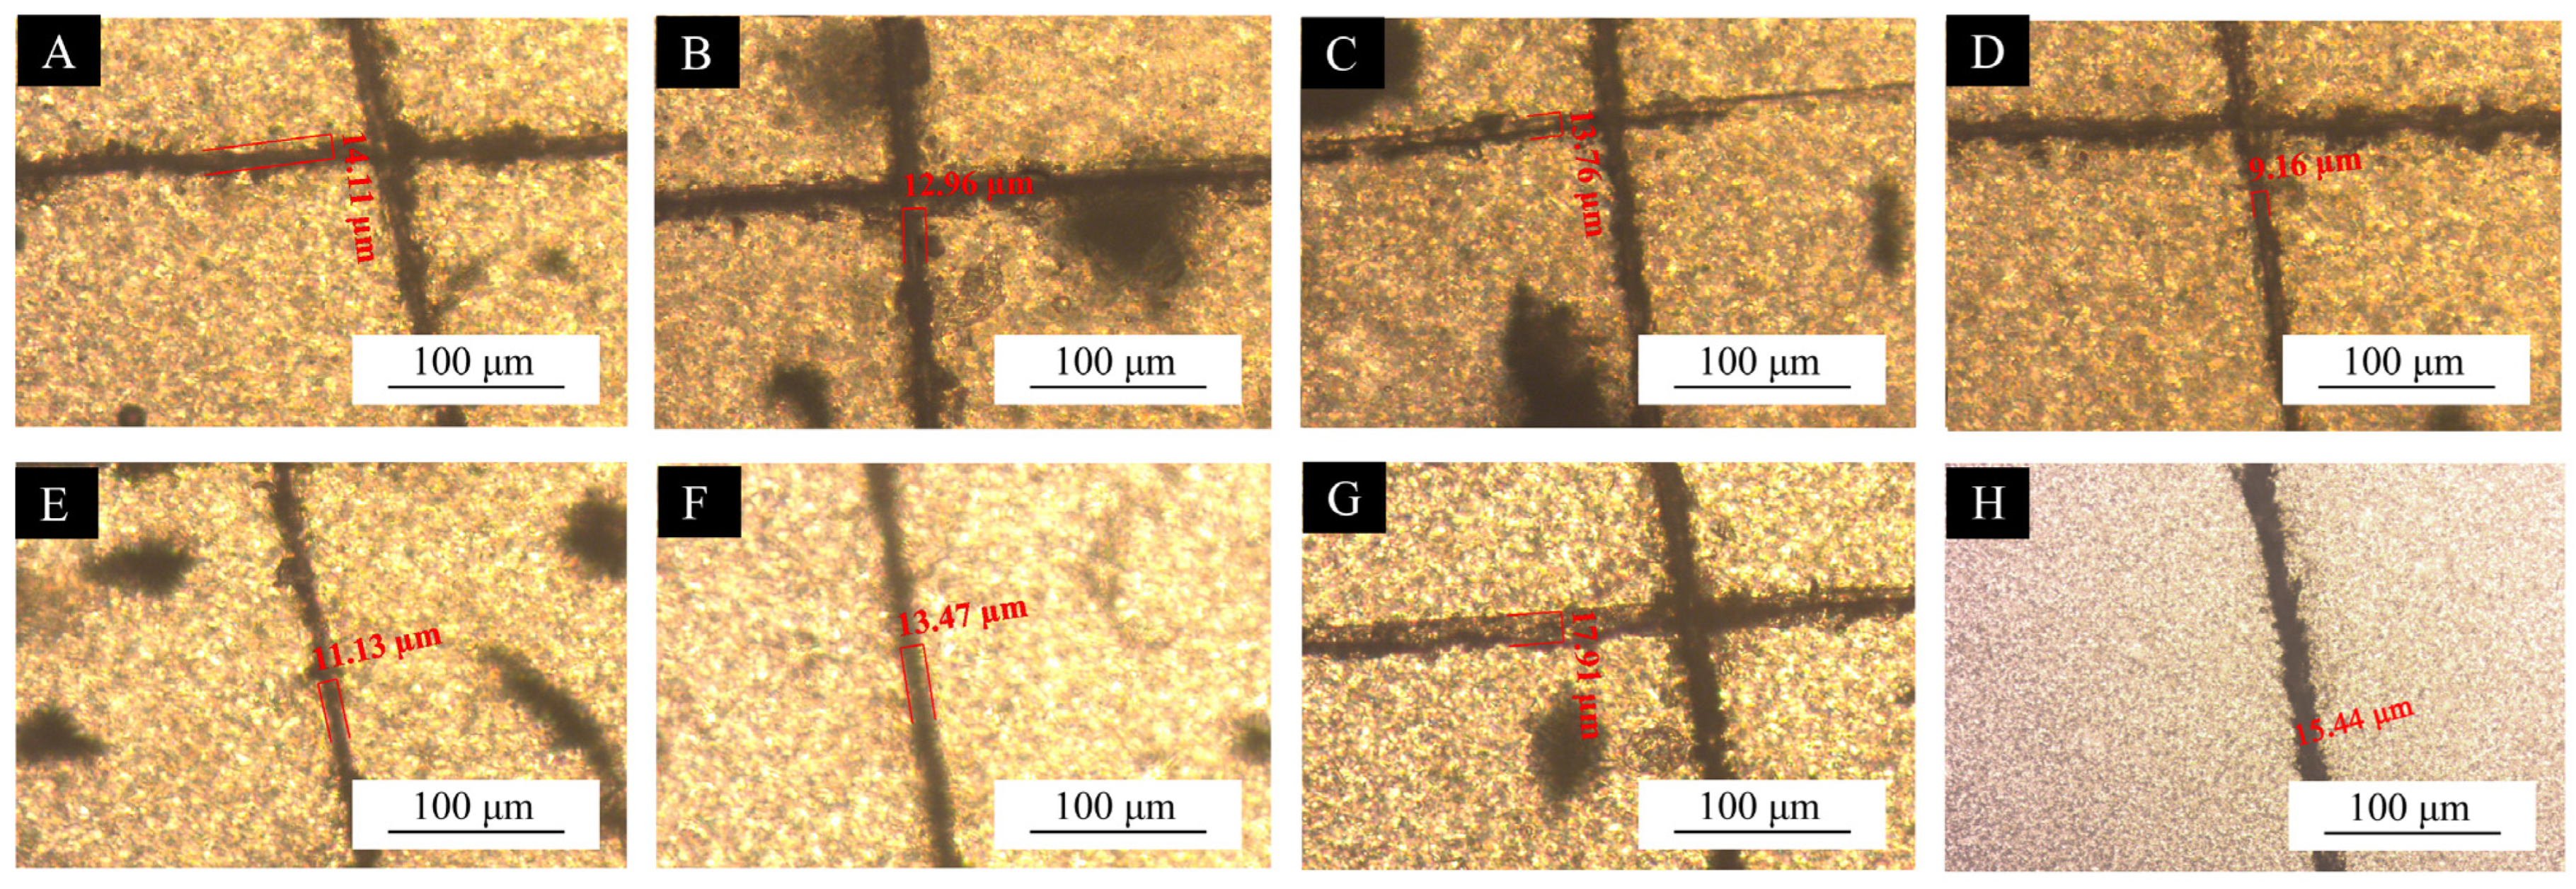
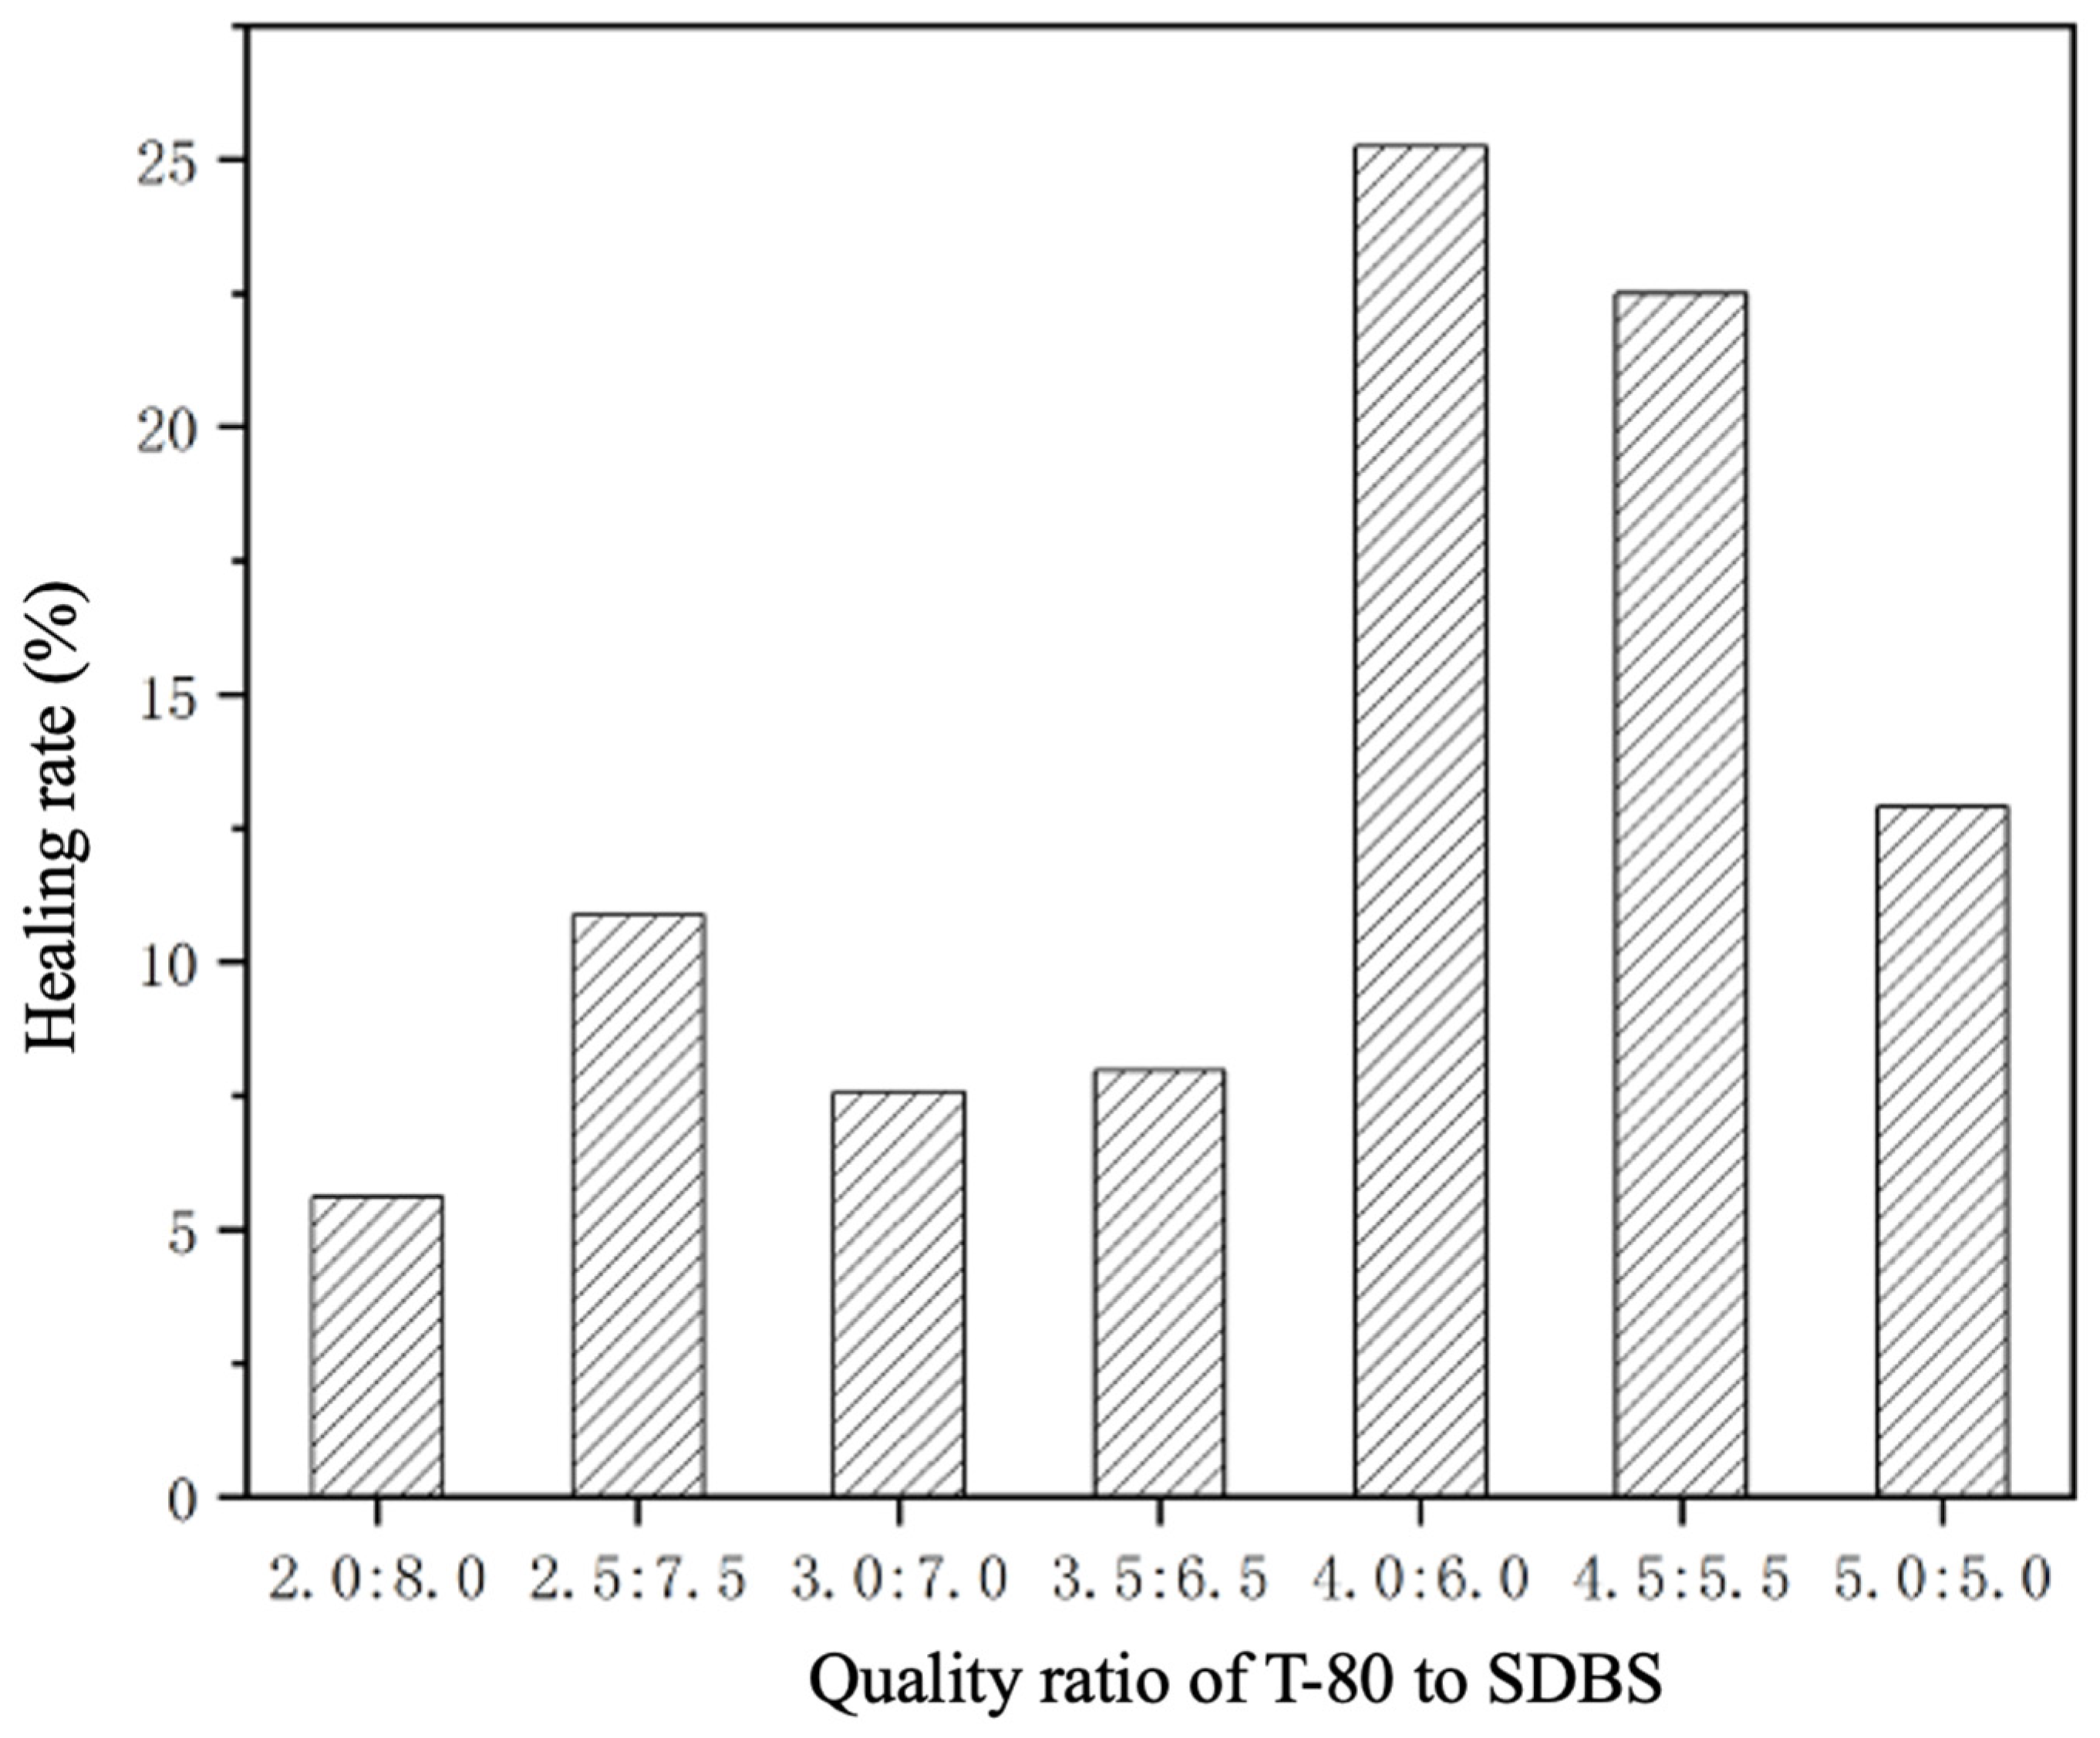
3.4. Self-Healing Properties of UV Coating Films with the Addition of CST-T Microcapsules

The microcapsules produced in the one-way test were added to the UV topcoat at a level of 5%, respectively, and the mixed coatings were coated on glass panels for the scratch test to test the self-repairing properties of the coating film. The scratch results are shown in Figure 6 and Figure 7, and Table 12; there was 48 h between measurements. The coating film with the addition of 5% sample 14 microcapsules had the highest repair rate of 25.25%, with a scratch width of 11.13 μm before repair and 8.32 μm after repair. The UV topcoat film with the addition of sample 15 microcapsules also obtained a high repair rate of 22.49%, with the scratch width reduced from 13.47 μm before repair to 10.44 μm after repair. The lowest repair rate was for the UV topcoat film with the addition of sample 10 microcapsules, with a repair rate of only 5.60%, and the width of scratches reduced from 14.11 μm before repair to 13.32 μm after repair. The repair rates of UV topcoats with the addition of sample 10, 11, 12, and 13 microcapsules were all low, ranging from 5% to 11%. The UV topcoats with the addition of sample 14 and 15 microcapsules presented higher repair rates, which decreased again when sample 16 microcapsules were added. With an increase in the SDBS content of the emulsifier in the microcapsules, the repair rate of the UV coating films with the addition of microcapsules showed an overall tendency to increase first and then decrease. The UV topcoats prepared with sample 14 and 15 microcapsules when the two emulsifiers were in ratios of 4.0:6.0 and 4.5:5.5 had good repair rates.
Figure 8 shows the relationship between the ratio of the two emulsifiers in the preparation of the microcapsules and the self-repair rate of the UV topcoat film with the addition of microcapsules. All the microcapsule samples produced in the one-way test resulted in some self-repairing properties of the coating film when added to the UV topcoat. The UV topcoat with the addition of sample 14 microcapsules, prepared with an emulsifier ratio of 4.0:6.0, showed the highest self-healing rate. When 5% sample 14 microcapsules were added to the UV topcoat, a repair rate of 25.25% was achieved when scratches appeared on the surface of the coating film. This was followed by the UV topcoat with the addition of sample 15 microcapsules, prepared with an emulsifier ratio of 4.5:6.5, which also resulted in a self-healing rate of 22.49% of the coating film. The self-healing rate was as low as 5.60% for the coating film with the incorporation of sample 10 microcapsules prepared with an emulsifier ratio of 2.0:8.0. Comparing the results of the one-way test with those of the scratch test, it was found that the two emulsifiers were in the ratio of 4:6 for the preparation of the film with sample 14 microcapsules, and the HLB value of the emulsifier was 12.383; the two emulsifiers were in the ratio of 4.5:5.5 for the preparation of the film with sample 15 microcapsules, and the HLB value of the emulsifier was 12.601; the two emulsifiers were in the ratio of 2.0:8.0 for the preparation of the film with sample 10 microcapsules, and in this case, the HLB value of the emulsifier was 11.510. The test results showed that when the ratio of the two emulsifiers was 4.0:6.0, i.e., the HLB value of the emulsifiers was 12.383, the addition of microcapsules to the UV topcoat at a content of 5% improved the self-healing properties of the coating film.
While absolute healing efficiencies (5–25%) were modest, microcapsules prepared with emulsifier ratios of 4.0:6.0 (sample 14 microcapsules, HLB = 12.383) and 4.5:5.5 (sample 15 microcapsules, HLB = 12.601) exhibited significantly higher scratch closure (22–25%) compared to those with emulsifiers with a lower HLB value (5–8%, e.g., sample 10 microcapsules). This trend suggests that the HLB value of the emulsifiers critically influences healing agent release and crack-filling efficacy. Future work will focus on improving healing magnitude via capsule size/distribution optimization.
The 25.25% healing efficiency for sample 14 (HLB = 12.383) arose from two factors: (1) a dense chitosan–STPP wall ensured mechanical rupture under scratch stress, releasing tung oil; (2) tung oil’s conjugated double bonds underwent oxidative polymerization upon O2 exposure, filling cracks via in situ film formation. Emulsifiers with lower HLB values (e.g., sample 10: HLB = 11.51) produced agglomerated capsules, hindering uniform dispersion and healing agent release.

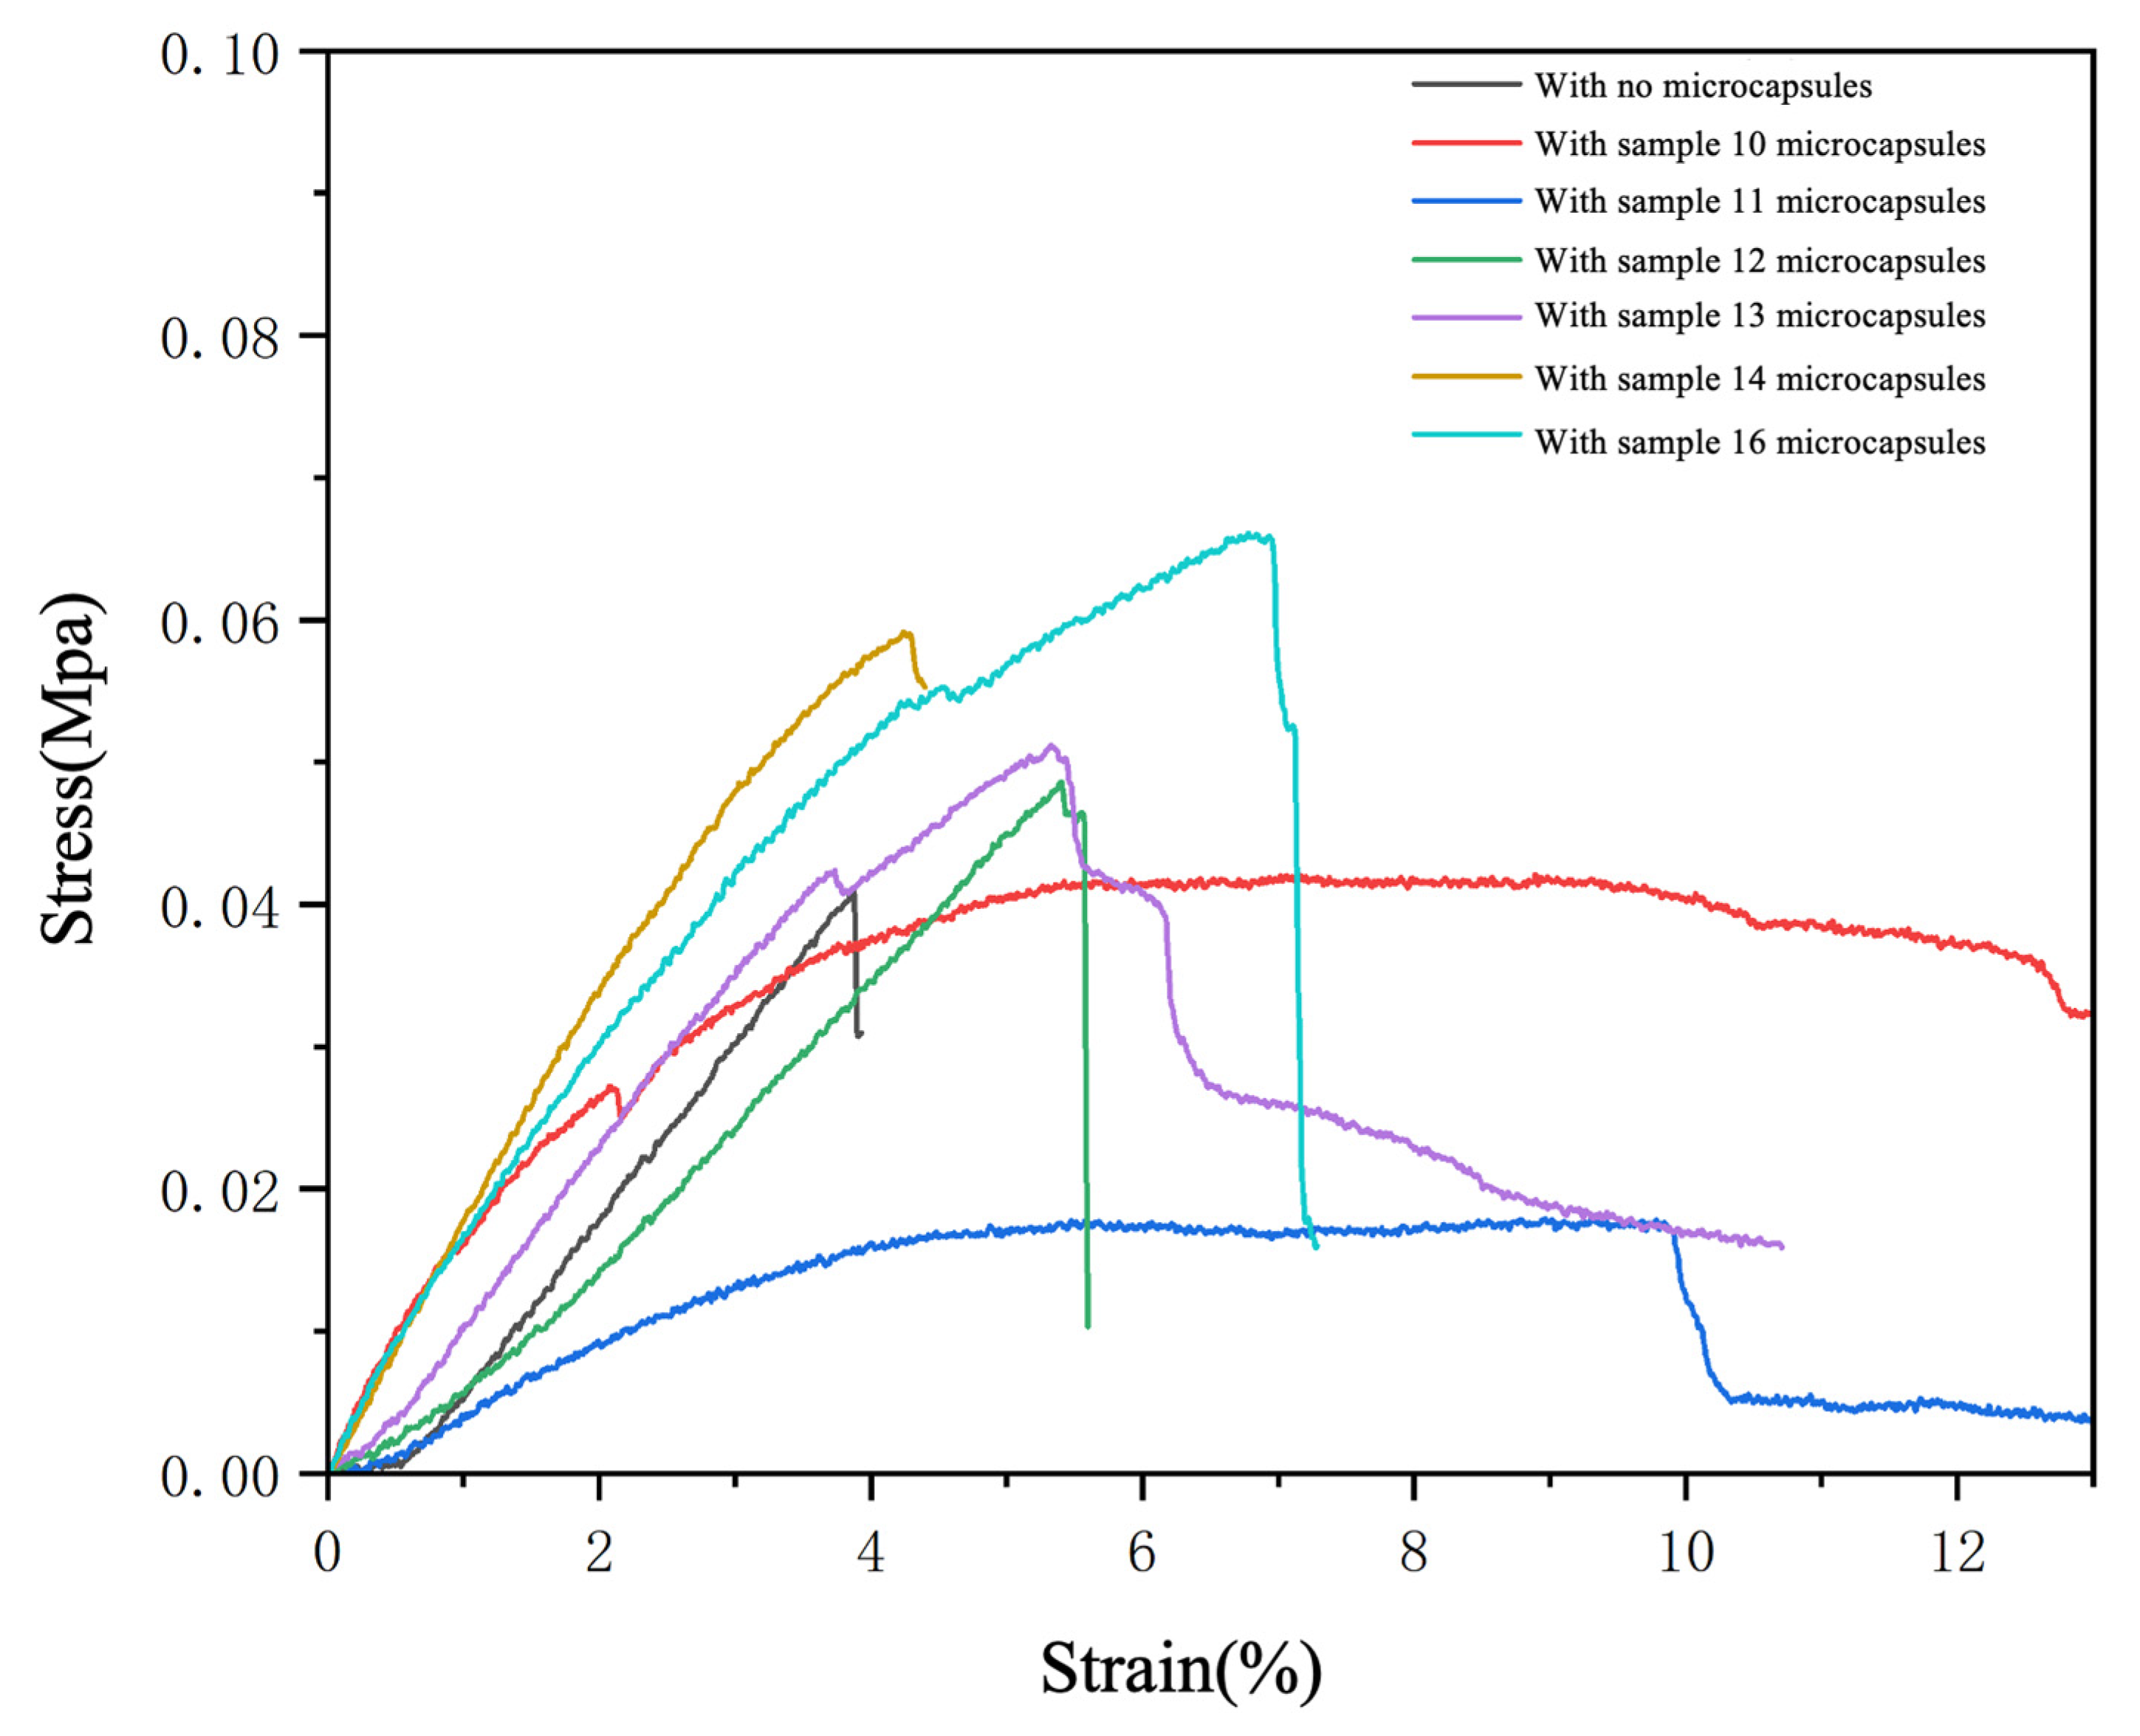
3.5. Mechanical Properties of UV Coating Films with Added CST-T Microcapsules

The mechanical properties of roughness and elongation at break of the coating films were measured. As shown in Table 13, because the UV topcoat had better leveling, the surface of the film without microcapsules was smooth, and the roughness was only 0.31 μm. The roughness of the surface of the UV topcoat film with 5% CST-T microcapsules increased significantly, and the overall trend of the film first decreased and then increased. The highest roughness reached 0.88 μm for the UV topcoat film with sample 10 microcapsules. The roughness of the UV topcoat film with sample 11 microcapsules was 0.76 μm, and the surfaces of the UV topcoat films with sample 15 microcapsules and sample 13 microcapsules were still relatively flat, with a roughness of 0.54 μm, which may be attributed to the fact that the sample 10 microcapsules were more agglomerated than the other microcapsule samples, which could not easily be uniformly dispersed when mixed into the UV topcoat and thus generated more agglomerates, producing flatness of the surface of the films with the addition of sample 15 microcapsules and sample 13 microcapsules.
Figure 9 shows the stress–strain curves of the coating films. As shown in Table 13, the elongation at break of the coating film without the addition of microcapsules is only 4.43%, which is due to the fact that UV coatings usually contain components with high hardness, such as resins and monomers, and thus UV coatings are usually less ductile and have lower elongation at break. The elongation at break of the coating film increased after the addition of the microcapsules in the one-factor test. The coating film with the addition of sample 11 microcapsules had the highest elongation at break of 9.31%, indicating that the toughness of the coating film was enhanced with the addition of microcapsules.

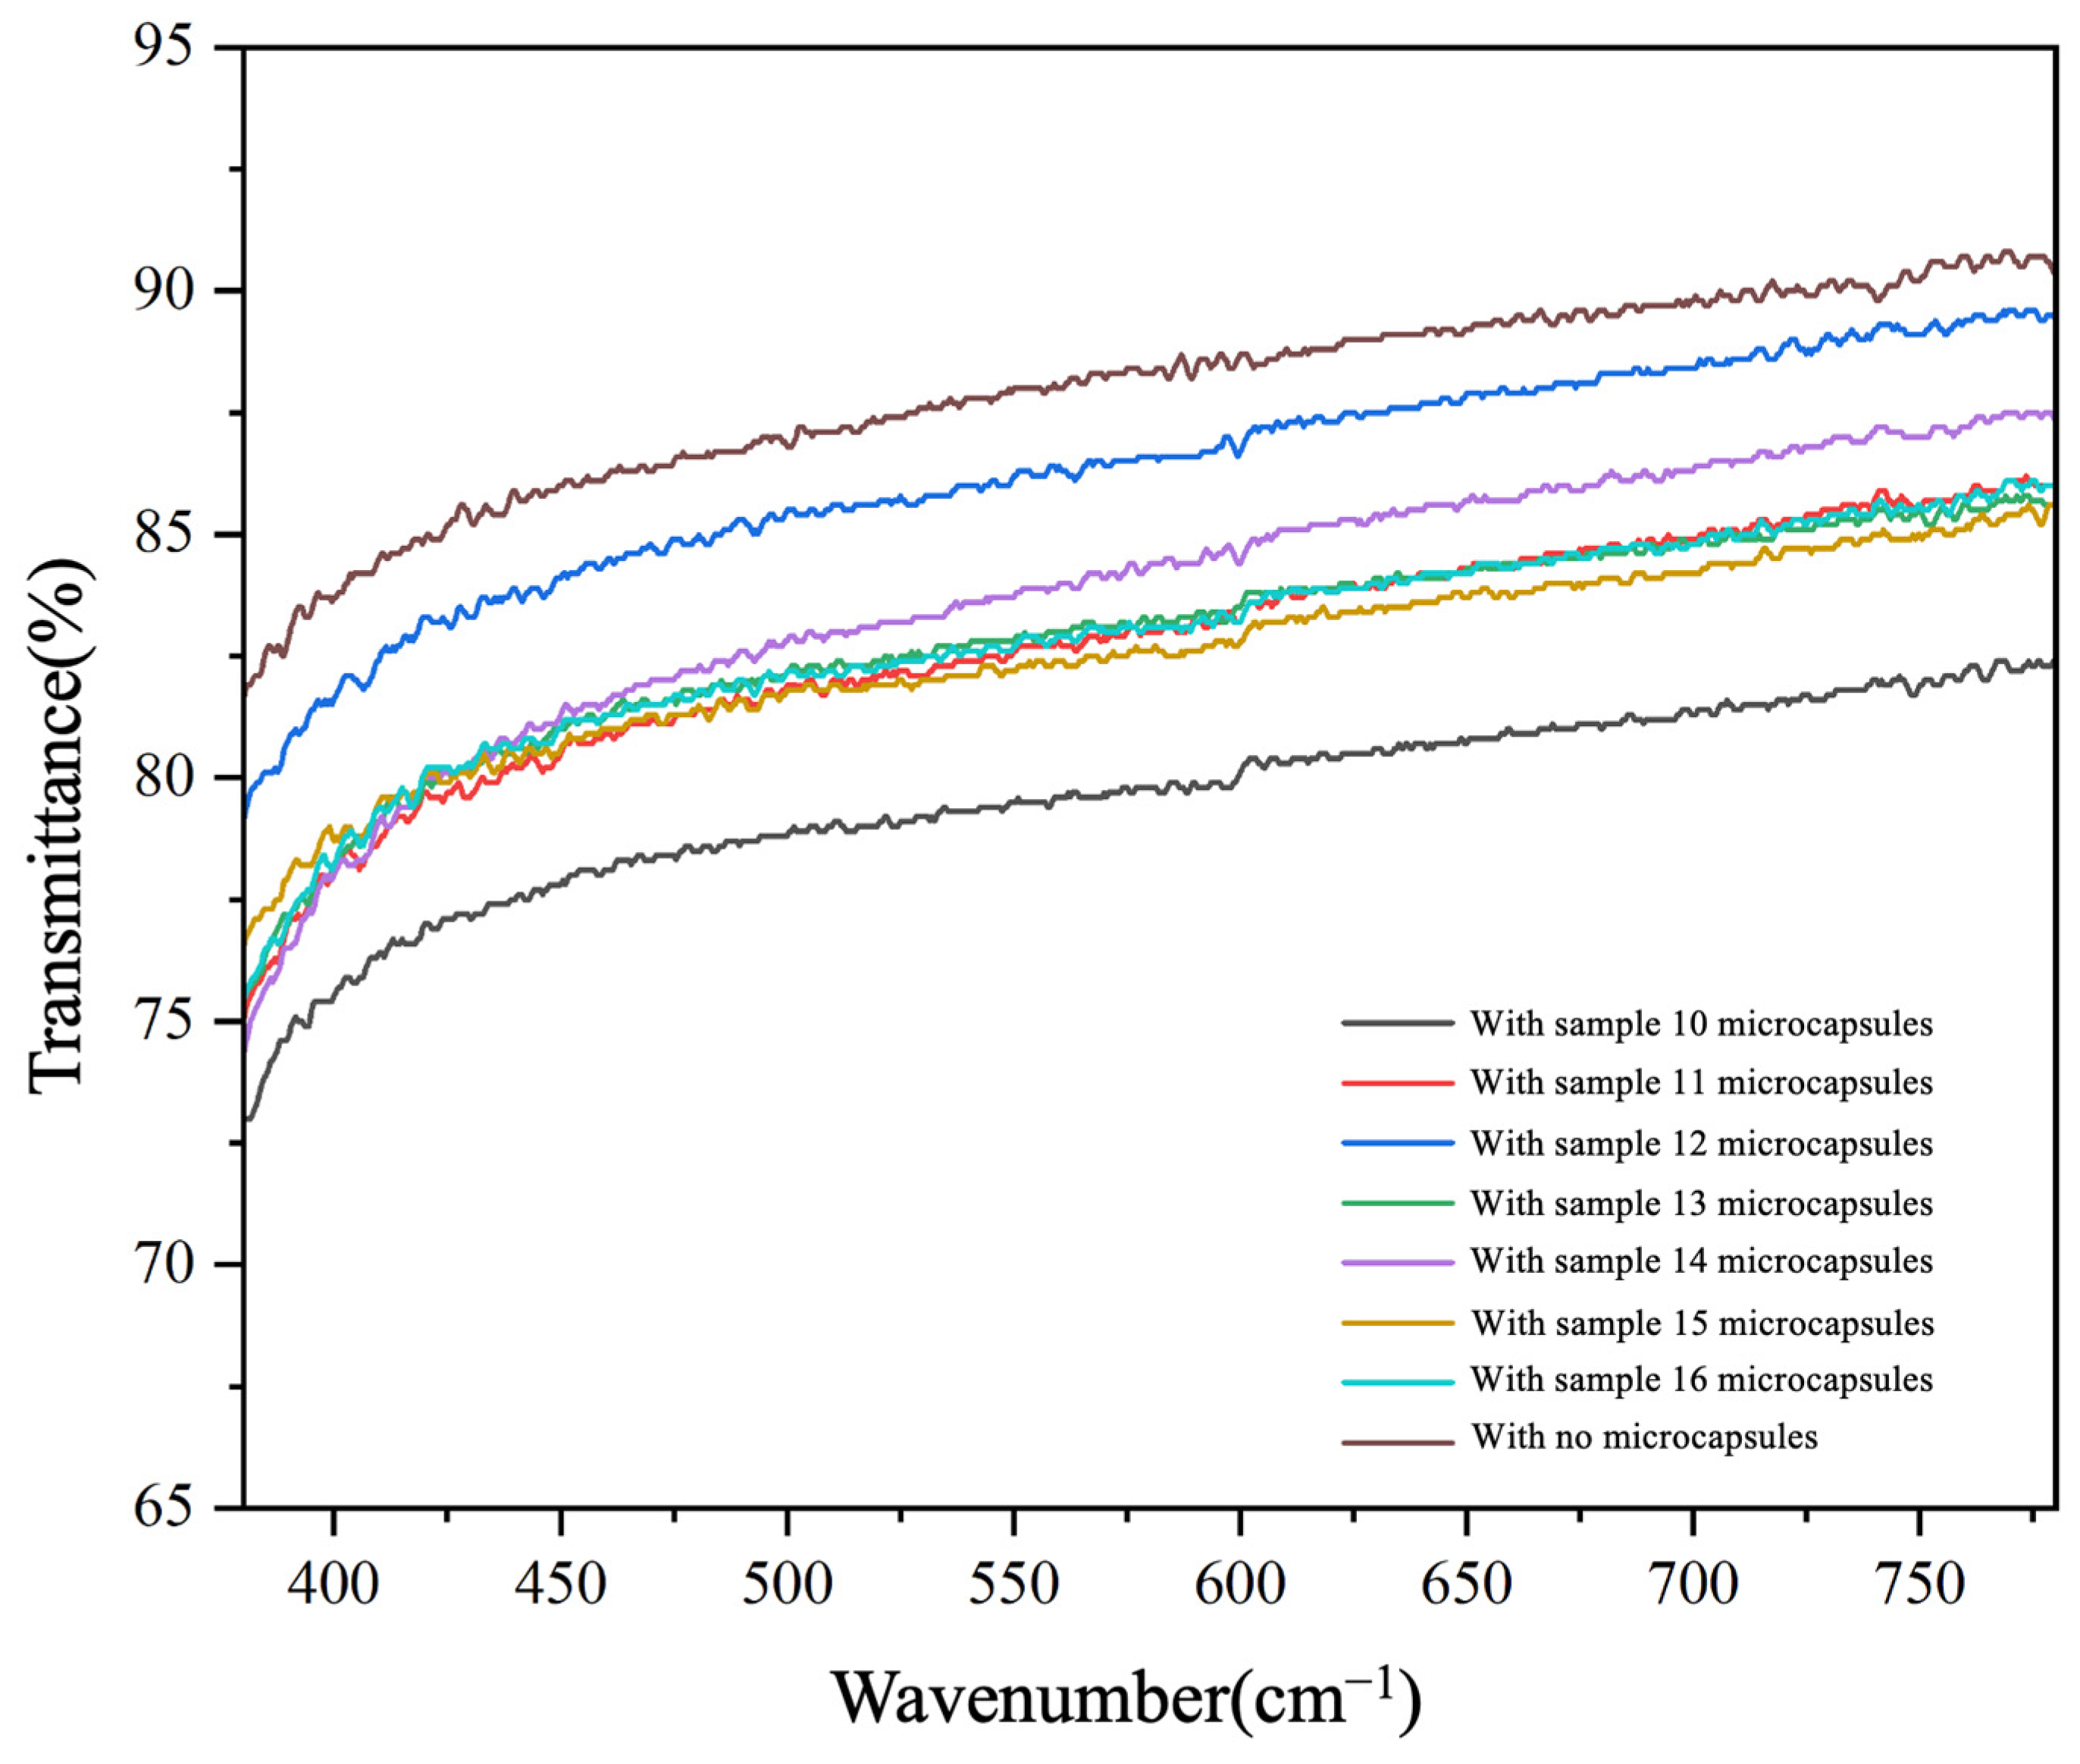
3.6. Optical Properties of UV Coating Films with Added CST-T Microcapsules

Figure 10 and Table 14 show the visible light transmittance of the coating films with the addition of microcapsules. The UV topcoat without microcapsules has the highest visible light transmittance of 87.90%, and the visible light transmittance of the UV topcoat with microcapsules is decreased compared with that of the UV topcoat without microcapsules. The transmittance rate of all the films with microcapsules shows a general trend of increasing and then decreasing. The UV topcoat with sample 10 microcapsules has the lowest transmittance of 79.56%, which is 8.34% lower than that of the UV topcoat without microcapsules. This may be due to the poor morphology of the sample 10 microcapsules prepared under the conditions of a 2.0:8.0 ratio of the two emulsifiers, and the serious agglomeration of the microcapsules, which could not be distributed uniformly in the UV topcoat, resulting in a significant decrease in the transmittance rate of the coating film.
Notably, the coating with sample 12 microcapsules (HLB = 11.947) achieved 86.31% visible light transmittance, nearing the blank coating’s value of 87.90%. This anomaly stems from its optimal emulsifier ratio (T-80-to-SDBS = 3.0:7.0), which promoted particle dispersion (Figure 1C) and minimized interfacial light scattering. By contrast, a higher SDBS content (e.g., sample 10, HLB = 11.510) induced agglomeration, while a higher T-80 content (e.g., sample 16, HLB = 12.819) reduced matrix compatibility, with both lowering the visible light transmittance.
While coating thickness is a known factor that influences visible light transmittance, our controlled application process ensured uniform thickness (50 ± 5 μm) across all samples. Thus, the observed visible light transmittance differences primarily arose from light scattering at microcapsule–matrix interfaces. Agglomerated microcapsules (e.g., sample 10) exacerbated scattering, reducing the visible light transmittance by ~8.34%, whereas optimized microcapsules (samples 14–15) minimized scattering losses (<5.40% reduction).
Table 15 shows the gloss of UV topcoat films containing different microcapsules measured at 20°, 60°, and 85° incident angles, along with the gloss loss at 60°. Films without microcapsules had high gloss values of 12.00 GU at 20°, 49.30 GU at 60°, and 56.40 GU at 85°. Adding microcapsules prepared with different emulsifiers reduced the gloss. These films showed gloss values between 29.70 GU and 34.50 GU at 60°. Compared to the film without microcapsules, the gloss loss at 60° ranged from 30.02% to 39.76%. This similar gloss loss indicates that microcapsules made using different emulsifier combinations had a comparable effect on film gloss when added at the same amount. The lowest gloss loss was 30.02%. This occurred when adding 5% sample 14 microcapsules to the UV topcoat. This result shows that films containing sample 14 microcapsules had better surface gloss than films containing microcapsules made using only one emulsifier factor. The gloss values for films with sample 14 microcapsules were 8.20 GU at 20°, 34.50 GU at 60°, and 39.50 GU at 85°.
The minimal loss in transparency at 5% microcapsule loading stemmed from sub-wavelength capsule sizes, minimizing light scattering. The 110% increase in elongation at break was attributed to microcapsules acting as stress concentrators, inducing matrix plastic deformation and dissipating energy. However, an excessive amount of the emulsifier SDBS (sample 16: T-80/SDBS = 5:5) increased the surface roughness (0.74 μm) due to hydrophilic particle aggregation, reducing gloss.
Table 16 shows the chromaticity and color difference values of UV topcoat films without microcapsules and with different CST-T microcapsules. The film without microcapsules had high brightness, with a brightness value of 76.93. The brightness value of the UV topcoat film with CST-T microcapsules was slightly darker than that of the blank UV topcoat, and the brightness of the film with sample 11 microcapsules was the lowest, with a brightness value of 73.32. Since the CST-T microcapsules were white powder, the addition of microcapsules had little change on the red–green and yellow–blue values of the coating film compared with those of the UV topcoat without the addition of microcapsules, indicating that the addition of microcapsules did not have much of an effect on the red–green and yellow–blue tendencies of the color of the coating film. The color difference between all the films with microcapsules and those without microcapsules showed a tendency of decreasing and then increasing. The color difference of the UV topcoat with sample 12 microcapsules was the smallest, at only 1.64.

4. Conclusions

Orthogonal optimization employing four factors at three levels revealed the emulsifier ratio between T-80 and SDBS to be the dominant variable governing CST-T microcapsule performance. The optimal parameters, under which a peak encapsulation efficiency of 68.50% and yield of 42.91% were achieved, were identified to be the following: a core-to-wall ratio at 2.0:1.0, a T-80-to-SDBS ratio of 4.0:6.0, an STPP concentration of 4%, and a spray-drying temperature of 120 °C. At a loading level of 5% into the UV topcoat, these microcapsules induced characteristic non-monotonic responses, with the surface roughness, elongation at break, and visible light transmittance exhibiting unimodal trends with increasing SDBS content, while the color difference ΔE followed a concave profile. The UV topcoar with sample 15 microcapsules demonstrated optimal comprehensive performance at this loading, delivering 22.49% self-healing efficiency alongside critical properties: 82.50% visible light transmittance, 35.50% light loss, an ΔE value of 2.16, a surface roughness of 0.54 micrometers, and an elongation at break of 6.92%.

Author Contributions

Conceptualization, methodology, and writing—review and editing: Y.D.; validation, resources, and data management: J.D.; formal analysis, investigation, and supervision: X.Y. All authors have read and agreed to the published version of the manuscript.

Funding

This project was partly supported by the Postgraduate Research and Practice Innovation Program of Jiangsu Province (SJCX25_0453).

Institutional Review Board Statement

Not applicable.

Informed Consent Statement

Not applicable.

Data Availability Statement

Data are contained within the article.

Conflicts of Interest

The authors declare that there are no conflicts of interest.

References

  1. Hu, J.; Liu, Y.; Xu, W. Influence of Cell Characteristics on the Construction of Structural Color Layers on Wood Surfaces. Forests 2024, 15, 676. [Google Scholar] [CrossRef]
  2. Brito, A.F.; Calonego, F.W.; Bond, B.H.; Severo, E. Color Changes, EMC and Biological Resistance of Thermally Modified Yellow Poplar. Wood Fiber Sci. 2018, 50, 439–446. [Google Scholar] [CrossRef]
  3. Syed, M.R.; Aati, S.; Flematti, G.; Matinlinna, J.P.; Fawzy, A. Development and Characterization of 3D-printed Denture Base Resin Composites Having Self-Healing Potential. Dent. Mater. 2025, 41, 451–463. [Google Scholar] [CrossRef] [PubMed]
  4. Hu, W.; Yang, Z.; Shi, N.; Yu, X. Experimental study on effects of the selected load parameters on fatigue life of the mortise-and-tenon furniture joint. Wood Mater. Sci. Eng. 2025, 1–7. [Google Scholar] [CrossRef]
  5. Hu, W.; Yang, P.; Wang, Y.; Zhang, J. Damage zone analysis and its effect on the elastic constants of beech blocks with different grain orientations under compression. Wood Sci. Technol. 2025, 59, 62. [Google Scholar] [CrossRef]
  6. Hu, W.-G.; Zhao, Y.; Xu, W.; Liu, Y. Study on withdrawal force capacity of insert nut in wood-based materials used for case furniture. Wood Mater. Sci. Eng. 2024, 1–10. [Google Scholar] [CrossRef]
  7. Chang, Y.; Yan, X.; Wu, Z. Application and prospect of self-healing microcapsules in surface coating of wood. Colloid Interface Sci. Commun. 2023, 56, 100736. [Google Scholar] [CrossRef]
  8. Aguirresarobe, R.H.; Nevejans, S.; Reck, B.; Irusta, L.; Sardon, H.; Asua, J.M.; Ballard, N. Healable and self-healing polyu-rethanes using dynamic chemistry. Prog. Polym. Sci. 2021, 114, 101362. [Google Scholar] [CrossRef]
  9. Hu, W.; Zhao, Y.; Xu, W.; Liu, Y. The Influences of Selected Factors on Bending Moment Capacity of Case Furniture Joints. Appl. Sci. 2024, 14, 10044. [Google Scholar] [CrossRef]
  10. Yu, R.; Liu, Y.; Konukcu, A.C.; Hu, W. A METHOD OF SIMULATING SEAT LOAD FOR NUMERICAL ANALYSIS OF WOOD CHAIR STRUCTURE. Wood Res. 2024, 69, 432–444. [Google Scholar] [CrossRef]
  11. Hu, W.-G.; Yu, R.-Z.; Yang, P. Characterizing Roughness of Wooden Mortise and Tenon Considering Effects of Measured Position and Assembly Condition. Forests 2024, 15, 1584. [Google Scholar] [CrossRef]
  12. Zhang, A.; Li, J.; Fan, H.; Xiang, J.; Wang, L.; Yan, J. Effect of mechanical properties on the self-healing behavior of waterborne polyurethane coatings. J. Appl. Polym. Sci. 2022, 139, 52364. [Google Scholar] [CrossRef]
  13. Nesterova, T.; Dam-Johansen, K.; Kiil, S. Synthesis of durable microcapsules for self-healing anticorrosive coatings: A comparison of selected methods. Prog. Org. Coatings 2011, 70, 342–352. [Google Scholar] [CrossRef]
  14. Beach, M.; Davey, T.; Subramanian, P.; Such, G. Self-healing organic coatings–Fundamental chemistry to commercial ap-plication. Prog. Org. Coat. 2023, 183, 107759. [Google Scholar] [CrossRef]
  15. Zeng, X.; Guo, H.; Liu, H.; Liu, C.; Fang, B.; Li, Y.; Jiang, Z.; Liu, J. Self-healing performance and anti-corrosion mechanism of microcapsule-containing epoxy coatings under deep-sea environment. Prog. Org. Coatings 2025, 203, 109176. [Google Scholar] [CrossRef]
  16. Yabuki, A.; Nishikawa, C.; Fathona, I.W. Synergistic effect by release of corrosion inhibitors via cellulose nanofibers in self-healing polymer coatings to prevent corrosion of carbon steel. J. Ind. Eng. Chem. 2024, 145, 764–772. [Google Scholar] [CrossRef]
  17. Wan, J.; Cao, Y.; Li, Y.; He, Y.; Wang, S.; Wang, Y.; Song, D.; Zhang, T.; Liu, J. Robust pH-responsive double-layered self-healing coating with synergistic effects of tannic acid and Ce ions applied on Mg alloy via the phytic acid pretreatment. Prog. Org. Coatings 2025, 203, 109152. [Google Scholar] [CrossRef]
  18. Zhao, D.; Du, Z.; Liu, S.; Wu, Y.; Guan, T.; Sun, Q.; Sun, N.; Ren, B. UV Light Curable Self-Healing Superamphiphobic Coatings by Photopromoted Disulfide Exchange Reaction. ACS Appl. Polym. Mater. 2019, 1, 2951–2960. [Google Scholar] [CrossRef]
  19. Xia, Y.; Yan, X. Preparation of UV Topcoat Microcapsules and Their Effect on the Properties of UV Topcoat Paint Film. Polymers 2024, 16, 1410. [Google Scholar] [CrossRef]
  20. Ling, J.; Rong, M.-Z.; Zhang, M.-Q. Effect of molecular weight of PEG soft segments on photo-stimulated self-healing performance of coumarin functionalized polyurethanes. Chin. J. Polym. Sci. 2014, 32, 1286–1297. [Google Scholar] [CrossRef]
  21. Hu, W.-G.; Luo, M.; Yu, R.; Zhao, Y. Effects of the selected factors on cyclic load performance of T-shaped mortise-and-tenon furniture joints. Wood Mater. Sci. Eng. 2024, 1–10. [Google Scholar] [CrossRef]
  22. Hu, W.; Yu, R. Study on the strength mechanism of the wooden round-end mortise-and-tenon joint using the digital image correlation method. Holzforschung 2024, 78, 519–530. [Google Scholar] [CrossRef]
  23. Hu, W.; Fu, W.; Zhao, Y. Optimal Design of the Traditional Chinese Wood Furniture Joint Based on Experimental and Numerical Methods. Wood Res. 2024, 69, 50–59. [Google Scholar] [CrossRef]
  24. Zhou, S.; Li, Z.; Li, K.; Jia, Y.; Wang, C.; Zhuang, X. Microcapsule-enabled self-healing concrete: A bibliometric analysis. Front. Struct. Civ. Eng. 2023, 17, 1611–1629. [Google Scholar] [CrossRef]
  25. Jin, C.M.; Sinawang, G.; Osaki, M.; Zheng, Y.T.; Yamaguchi, H.; Harada, A.; Takashima, Y. Self-healing thermoplastic pol-yurethane linked via host-guest interactions. Polymers 2020, 12, 1393. [Google Scholar] [CrossRef]
  26. Liu, Y.; Hu, W.; Kasal, A.; Erdil, Y.Z. The State of the Art of Biomechanics Applied in Ergonomic Furniture Design. Appl. Sci. 2023, 13, 12120. [Google Scholar] [CrossRef]
  27. Zhou, J.; Xu, W. Optimizing the interface compatibility of transparent wood for green phase-change thermal storage. Wood Sci. Technol. 2025, 59, 45. [Google Scholar] [CrossRef]
  28. Xu, X.; Zhang, M.; Yue, X.; Xiong, X. Design of furniture mortise-and-tenon joints: A review of mechanical properties and design recommendations. Wood Mater. Sci. Eng. 2025, 1–15. [Google Scholar] [CrossRef]
  29. Wang, C.; Li, J.; Wang, T.; Chu, Q.; Wang, X. Fused deposition 3D printing of bonsai tree guiding mold based on acrylonitrile-butadiene-styrene copolymer. BioResources 2024, 19, 5839–5846. [Google Scholar] [CrossRef]
  30. Ma, Y.; Liu, J.; Zhang, Y.; Ge, Y.; Wu, R.; Song, X.; Zhang, P.; Wu, J. Mechanical behavior and self-healing mechanism of polyurea-based double-walled microcapsule/epoxy composite films. Prog. Org. Coatings 2021, 157, 106283. [Google Scholar] [CrossRef]
  31. Lim, Y.-J.; Song, Y.-K.; Kim, D.-M.; Chung, C.-M. Preparation of Isophorone Diisocyanate-loaded Microcapsules and Their Application to Self-healing Protective Coating. Polym. Korea 2015, 39, 56–63. [Google Scholar] [CrossRef]
  32. Liu, W.; Zou, S.; Pan, J.; Zhang, Z.; Chen, J.; Liu, B.; Yue, Z. Carbon nanotubes/carbon black reinforced epoxy resin microcapsule-based cement composites with combined self-healing and self-sensing capacities. J. Build. Eng. 2025, 103, 112171. [Google Scholar] [CrossRef]
  33. Feng, Y.Y.; Cui, Y.X.; Zhang, M.J.; Li, M.L.; Li, H.Y. Preparation of tung oil-loaded PU/PANI microcapsules and synergetic anti-corrosion properties of self-healing epoxy coatings. Macromol. Mater. Eng. 2021, 306, 2000581. [Google Scholar] [CrossRef]
  34. Wang, C.; Li, J.Y.; Zhang, C.Y. Effect of Corrected Extrusion Flow Rate on Wall Thickness Error of MEAM Thin-walled Model. Mater. Plast. 2025, 62, 78–85. [Google Scholar] [CrossRef]
  35. Zhang, J.; Yang, Y.; Chen, Y.; Chen, X.; Li, A.; Wang, J.; Shen, D.; Zheng, S. A review of new generation of dental restorative resin composites with antibacterial, remineralizing and self-healing capabilities. Nanoscale Res. Lett. 2024, 19, 189. [Google Scholar] [CrossRef] [PubMed]
  36. Wang, C.; Li, J.; Wang, T.; Wang, X.; Chu, Q. Effect of Optimised Infill Parameters on the Tensile Properties of MEX Co-polyester Models. Mater. Plast. 2024, 61, 129–136. [Google Scholar] [CrossRef]
  37. Wang, C.; Li, J.; Wang, T.; Wang, X. Additive manufacturing of furniture corner guards based on thermoplastic polyurethane filament. BioResources 2025, 20, 5398–5406. [Google Scholar] [CrossRef]
  38. Zhang, L.; Wu, K.; Sun, G.; Liu, R.; Luo, J. Investigation of particle size effect on the performance of micro/nano capsules and composite coatings. Colloids Surfaces A Physicochem. Eng. Asp. 2023, 675, 132020. [Google Scholar] [CrossRef]
  39. Chang, Y.; Yan, X. Preparation and Self-Repairing Properties of MF-Coated Shellac Water-Based Microcapsules. Coatings 2020, 10, 778. [Google Scholar] [CrossRef]
  40. Liu, Q.; Gao, D.; Xu, W. Effect of Paint Process on the Performance of Modified Poplar Wood Antique. Coatings 2021, 11, 1174. [Google Scholar] [CrossRef]
  41. Liu, Q.; Gao, D.; Xu, W. Influence of the Bottom Color Modification and Material Color Modification Process on the Performance of Modified Poplar. Coatings 2021, 11, 660. [Google Scholar] [CrossRef]
  42. Xu, W.; Fang, X.; Han, J.; Wu, Z.; Zhang, J. Effect of Coating Thickness on Sound Absorption Property of Four Wood Species Commonly Used for Piano Soundboards. Wood Fiber Sci. 2020, 52, 28–43. [Google Scholar] [CrossRef]
  43. Liu, Q.; Gao, D.; Xu, W. Effect of Sanding Processes on the Surface Properties of Modified Poplar Coated by Primer Compared with Mahogany. Coatings 2020, 10, 856. [Google Scholar] [CrossRef]
  44. Mi, T.; Mao, J.; Cai, Y.; Luo, S.; Wang, X.; Xiao, M.; Zhu, H.; Yang, K.; Ren, J. Application of Raman spectroscopy for detecting the repairing behaviour of microcapsules in self-healing cementitious system. Constr. Build. Mater. 2023, 387, 131637. [Google Scholar] [CrossRef]
  45. Cots, A.; Camacho, N.M.; Palma, S.D.; Alustiza, F.; Pedraza, L.; Bonino, F.; Carreño, J.; Bracamonte, C.F.; Acevedo, D.; Bozzo, A.; et al. Chitosan-alginate microcapsules: A strategy for improving stability and antibacterial potential of bovine Lactoferrin. Int. J. Biol. Macromol. 2025, 307, 141870. [Google Scholar] [CrossRef]
  46. Yan, X.X.; Tao, Y.; Chang, Y.J. Effect of Shellac Waterborne Coating Microcapsules on the Optical, Mechanical and Self-Healing Properties of Waterborne Primer on Tilia europaea L. Wood. Coatings 2021, 11, 785. [Google Scholar] [CrossRef]
  47. Zhang, H.; Zhou, L.; Shehzad, H.; Farooqi, Z.H.; Sharif, A.; Ahmed, E.; Habiba, U.; Qaisar, F.; Fatima, N.-E.; Begum, R.; et al. Innovative free radical induced synthesis of WO3-doped diethyl malonate grafted chitosan encapsulated with phosphorylated alginate matrix for UO22+ adsorption: Parameters optimisation through response surface methodology. Sep. Purif. Technol. 2024, 353, 128455. [Google Scholar] [CrossRef]
  48. Baiocco, D.; Preece, J.A.; Zhang, Z. Encapsulation of hexylsalicylate in an animal-free chitosan-gum Arabic shell by complex coacervation. Colloids Surfaces A Physicochem. Eng. Asp. 2021, 625, 126861. [Google Scholar] [CrossRef]
  49. Qi, L.F.; Xu, Z.R.; Jiang, X.; Hu, C.H.; Zou, X.F. Preparation and antibacterial activity of chitosan nanoparticles. Carbohydr. Res. 2004, 339, 2693–2700. [Google Scholar] [CrossRef]
  50. Ngan, L.T.K.; Wang, S.-L.; Hiep, Đ.M.; Luong, P.M.; Vui, N.T.; Đinh, T.M.; Dzung, N.A. Preparation of chitosan nanoparticles by spray drying, and their antibacterial activity. Res. Chem. Intermed. 2014, 40, 2165–2175. [Google Scholar] [CrossRef]
  51. Liu, J.; Chen, F.; Zhang, Q.; Xing, X.; Cui, G. Study on Preparation and Performance of Acid pH-Responsive Intelligent Self-Healing Coating. Polymers 2024, 16, 2473. [Google Scholar] [CrossRef]
  52. Lv, L.T.; Wang, Y.T.; Dai, J.; Yang, Z.Y.; Yang, Q.L. The study on preparation, stability and anti-allergic efficacy of phy-cocyanin microcapsules. Food Res. Int. 2025, 201, 115530. [Google Scholar] [CrossRef] [PubMed]
  53. Wang, J.; Zhou, Q.; Li, Z.; Han, Y.; Song, Y.; Yang, S.; Song, X.; Qi, T.; Möhwald, H.; Shchukin, D.; et al. Adaptive Polymeric Coatings with Self-Reporting and Self-Healing Dual Functions from Porous Core–Shell Nanostructures. Macromol. Mater. Eng. 2018, 303, 1700616. [Google Scholar] [CrossRef]
  54. Li, H.; Cui, Y.; Li, Z.; Zhu, Y.; Wang, H. Fabrication of microcapsules containing dual-functional tung oil and properties suitable for self-healing and self-lubricating coatings. Prog. Org. Coatings 2018, 115, 164–171. [Google Scholar] [CrossRef]
  55. Ji, R.; Wu, J.; Zhang, J.; Wang, T.; Zhang, X.; Shao, L.; Chen, D.; Wang, J. Extending Viability of Bifidobacterium longum in Chitosan-Coated Alginate Microcapsules Using Emulsification and Internal Gelation Encapsulation Technology. Front. Microbiol. 2019, 10, 1389. [Google Scholar] [CrossRef]
  56. Varankovich, N.; Martinez, M.F.; Nickerson, M.T.; Korber, D.R. Survival of probiotics in pea protein-alginate microcapsules with or without chitosan coating during storage and in a simulated gastrointestinal environment. Food Sci. Biotechnol. 2017, 26, 189–194. [Google Scholar] [CrossRef]
  57. GB/T 4893.6-2013; Physical and Chemical Property Test of Furniture Surface Paint Film Part 6 Gloss Determination Method. Standardization Administration of the People’s Republic of China: Beijing, China, 2013.
  58. Paolini, N.A.; Neto, A.G.C.; Pellanda, A.C.; Jorge, A.R.d.C.; Soares, B.d.B.; Floriano, J.B.; Berton, M.A.C.; P, P.V.; Thomas, S.; Li, Z. Evaluation of Corrosion Protection of Self-Healing Coatings Containing Tung and Copaiba Oil Microcapsules. Int. J. Polym. Sci. 2021, 2021, 6650499. [Google Scholar] [CrossRef]
  59. Kim, M.J.; Park, H.-S.; Kim, J.-W.; Lee, E.-Y.; Rhee, M.; You, Y.-H.; Khang, G.; Park, C.-G.; Yoon, K.-H. Suppression of Fibrotic Reactions of Chitosan-Alginate Microcapsules Containing Porcine Islets by Dexamethasone Surface Coating. Endocrinol. Metab. 2021, 36, 146–156. [Google Scholar] [CrossRef]
  60. Li, P.H.; Lu, Z.; Ma, K.X.; Zou, G.F.; Chang, L.; Guo, W.C.; Tian, K.S.; Li, X.A.; Wang, H.Y. UV-triggered self-healing SiO2/PDA hybrid microcapsules with both enhanced UV-shielding ability and improved compatibility for epoxy resin coating. Prog. Org. Coat. 2022, 163, 106636. [Google Scholar] [CrossRef]
  61. Cong, Y.; Chen, K.; Zhou, S.; Wu, L. Synthesis of pH and UV dual-responsive microcapsules with high loading capacity and their application in self-healing hydrophobic coatings. J. Mater. Chem. A 2015, 3, 19093–19099. [Google Scholar] [CrossRef]
Figure 1. SEM images of microcapsules: (A) 10, (B) 11, (C) 12, (D) 13, (E) 14, (F) 15, (G) 16.
Coatings 15 00867 g001
Figure 2. Histogram of particle size distribution of microcapsules: (A) 10, (B) 11, (C) 12, (D) 13, (E) 14, (F) 15, (G) 16.
Coatings 15 00867 g002
Figure 3. Infrared spectra of microcapsules and their raw materials.
Coatings 15 00867 g003
Figure 4. SEM images of coating morphology: (A) blank UV topcoat, (B) UV topcoat with 5% sample 12 microcapsules, (C) UV topcoat with 5% sample 15 microcapsules.
Coatings 15 00867 g004
Figure 5. Infrared spectra of coatings.
Coatings 15 00867 g005
Figure 6. Scratch width before repairing: topcoats with sample (A) 10, (B) 11, (C) 12, (D) 13, (E) 14, (F) 15, and (G) 16 microcapsules, and (H) with no microcapsules.
Coatings 15 00867 g006
Figure 7. Scratch width after repairing: topcoats with sample (A) 10, (B) 11, (C) 12, (D) 13, (E) 14, (F) 15, and (G) 16 microcapsules, and (H) with no microcapsules.
Coatings 15 00867 g007
Figure 8. The effect of the emulsifier ratio on the self-healing rate of coatings with microcapsules.
Coatings 15 00867 g008
Figure 9. Stress–strain curve of coatings.
Coatings 15 00867 g009
Figure 10. Transmittance rates of coatings.
Coatings 15 00867 g010
Table 1. List of materials used in test.
NameMolecular FormulaCAS No.Manufacturer
Chitosan(C6H11NO4)n9012-76-4Sinopharm Chemical Reagent Co., Ltd., Beijing, China
Gum Arabic PowderC12H369000-01-5Tianjin Zhonglian Chemical Reagent Co., Ltd., Tianjin, China
Acetic Acid (CH3COOH)C2H4O264-19-7Sinopharm Chemical Reagent Co., Ltd. Beijing, China
Tung OilC65H100O14-Shanghai Shenmeng Home Furnishing Co., Ltd., Shanghai, China
Tannic AcidC76H52O461401-55-4Tianjin Zhonglian Chemical Reagent Co., Ltd., Tianjin, China
Polyoxyethylene Sorbitan MonooleateC24H44O69005-65-6Tianjin Beichen Fangzheng Reagent Co., Ltd., Tianjin, China
Sodium Dodecylbenzene Sulfonate CH3(CH2)11C6H4SO3Na25155-30-0Tianjin Zhiyuan Chemical Reagent Co., Ltd., Tianjin, China
Sodium Tripolyphosphate (SDPP)Na5P3O107758-29-4Sinopharm Chemical Reagent Co., Ltd., Beijing, China
Table 2. List of equipment used in experiment.
NameModel NumberManufacturer
Collector-type constant-temperature heating magnetic stirrerDF-101ZShanghai Yixin Scientific Instrument Co., Ltd., Shanghai, China
Ultrasonic emulsifying disperserBILONG-500Shanghai Biron Instrument Co., Ltd., Shanghai, China
Small spray-dryerJA-PWGZ100Shenyang Jing’ao Instrument Technology Co., Ltd., Shenyang, China
Circulating-water vacuum pumpsSHZ-DShanghai Sematic Instrument Co., Ltd., Shanghai, China
Air-drying ovenDHG-9240AShanghai Aojin Instrument Manufacturing Co., Ltd., Shanghai, China
UV-curing machine620#Huzhou Tongxu Machinery Equipment Co., Ltd., Huzhou, China
Optical microscopeAX-10Carl Zeiss Co., Ltd., Baden-Württemberg, Germany
Fourier infrared spectrometerVERTEX 80VBruker Technology Co., Ltd., Hamburg, Germany
Scanning electron microscopeQUANTA-200Thermo Fisher Scientific Co., Ltd., Waltham, MA, USA
Roughness testerJ8-4CShanghai Tai Ming Optical Instrument Co., Ltd., Shanghai, China
Gloss meterHG268Shenzhen SUNSHI Technology Co., Ltd., Shenzhen, China
SpectrocolorimeterCR7Shenzhen SUNSHI Technology Co., Ltd., Shenzhen, China
Universal mechanical testing machineAGS-XShimadzu Manufacturing, Kyoto, Japan
Ultraviolet spectrophotometerU-3900Hitachi Instrument Co., Ltd., Suzhou, China
Table 3. Orthogonal test design.
LevelFactor A
Core-to-Wall Ratio
Factor B
Emulsifier Compounding Ratio
(T-80:SDBS)
Factor C
Concentration of Crosslinker STPP (%)
Factor D
Spray-Drying Temperature (°C)
11.0:1.00.5:9.52125
22.0:1.02.0:8.03130
33.0:1.03.5:6.54135
Table 4. Orthogonal microcapsule samples.
SamplesCore-to-Wall RatioEmulsifier Compounding Ratio
(T-80:SDBS)
Concentration of Crosslinking Agent STPP
(%)
Spray-Drying Temperature (°C)
11.0:1.00.5:9.52125
21.0:1.02.0:8.03130
31.0:1.03.5:6.54135
42.0:1.00.5:9.53135
52.0:1.02.0:8.04125
62.0:1.03.5:6.52130
73.0:1.00.5:9.54130
83.0:1.02.0:8.02135
93.0:1.03.5:6.53125
Table 5. Schedule of test material dosage.
Type of TestSamplesChitosan (g)1% Acetic Acid
(g)
Tung Oil
(g)
T-80
(g)
SDBS
(g)
Pure Water for Emulsification
(g)
STPP
(g)
Pure Water for STPP
(g)
Orthogonal test10.80079.2000.8000.1192.26176.8200.2009.800
20.80079.2000.8000.4761.90476.8200.3009.700
30.80079.2000.8000.8331.54776.8200.4009.600
40.80079.2001.6000.1172.23376.0500.3009.700
50.80079.2001.6000.4701.88076.0500.4009.600
60.80079.2001.6000.8231.52876.0500.2009.800
70.80079.2002.4000.1162.21475.2700.4009.600
80.80079.2002.4000.4661.86475.2700.2009.800
90.80079.2002.4000.8161.51675.2700.3009.700
One-way test100.80079.2001.6000.4701.88076.0500.4009.600
110.80079.2001.6000.5871.76376.0500.4009.600
120.80079.2001.6000.7051.64576.0500.4009.600
130.80079.2001.6000.8231.52876.0500.4009.600
140.80079.2001.6000.9401.41076.0500.4009.600
150.80079.2001.6001.0581.29276.0500.4009.600
160.80079.2001.6001.1751.17576.0500.4009.600
Table 6. Details of coating materials.
SamplesMicroencapsulated Mass (g)UV Topcoat Mass (g)
100.050.95
110.050.95
120.050.95
130.050.95
140.050.95
150.050.95
160.050.95
Table 7. Analysis of microcapsule coverage rate in orthogonal tests.
SamplesFactor A
Core-to-Wall Ratio
Factor B
Emulsifier Compounding Ratio
(T-80:SDBS)
Factor C
STPP Concentration
(%)
Factor D
Spray-Drying Temperature (°C)
Coating Rate
(%)
11.0:1.00.5:9.5212542.00
21.0:1.02.0:8.0313050.00
31.0:1.03.5:6.5413552.00
42.0:1.00.5:9.5313550.00
52.0:1.02.0:8.0412568.00
62.0:1.03.5:6.5213062.00
73.0:1.00.5:9.5413048.00
83.0:1.02.0:8.0213558.00
93.0:1.03.5:6.5312568.00
Mean value 148.0046.6754.0059.33
Average value 260.0058.6756.0053.33
Average value 358.0060.6756.0053.33
range12.0014.002.006.00
Factor priority levelB > A > D > C
Optimal preparation programA2 B3 C3 D1
Table 8. Analysis of variance table for encapsulation rates.
ConsiderationsSquare Sum (e.g., Equation of Squares)dfMean SquareFp
Factor A Core-to-wall ratio496.0002248.00011.1600.004 **
Factor B Emulsifier compounding ratio688.0002344.00015.4800.001 **
Factor C Crosslinker concentration16.00028.0000.3600.707
Factor D Drying Temperature144.000272.0003.2400.087
Inaccuracies200.000922.222
Note: * p < 0.05, ** p < 0.01.
Table 9. Analysis of microcapsule yield rate in orthogonal tests.
SamplesFactor A
Core-to-Wall Ratio
Factor B
Emulsifier Compounding Ratio
(T-80:SDBS)
Factor C
Concentration of Crosslinker STPP
(%)
Factor D
Spray-Drying Temperature (°C)
Yield
(%)
11.0:1.00.5:9.5212537.32
21.0:1.02.0:8.0313032.48
31.0:1.03.5:6.5413541.94
42.0:1.00.5:9.5313532.87
52.0:1.02.0:8.0412550.68
62.0:1.03.5:6.5213037.98
73.0:1.00.5:9.5413027.49
83.0:1.02.0:8.0213535.08
93.0:1.03.5:6.5312525.09
k137.2532.5636.7937.70
k240.5139.4130.1532.65
k329.2235.0040.0436.63
range11.296.859.895.05
Factor priority levelA > C > B > D
Optimal preparation programA2 B2 C3 D1
Table 10. Analysis of variance table for yield rate.
ConsiderationsSquare Sum (e.g., Equation of Squares)dfMean SquareFp
Factor A: Core-to-wall ratio405.0822202.54118.3230.001 **
Factor B: Emulsifier compounding ratio144.772272.3866.5480.018 *
Factor C: Crosslinker STPP concentration305.0192152.50913.7970.002 **
Factor D: Drying temperature84.894242.4473.8400.062
inaccuracies99.486911.054
Note: * p < 0.05, ** p < 0.01.
Table 11. Yield and coverage rate of single-factor tests.
SamplesT-80-to-SDBS RatioHLB Value of EmulsifiersYield (%)Coating Rate (%)
102.0:8.011.51040.3949.50
112.5:7.511.72840.9760.00
123.0:7.011.94744.0865.00
133.5:6.512.17040.7755.00
144.0:6.012.38342.9168.50
154.5:5.512.60135.7369.25
165.0:5.012.81934.9563.50
Table 12. Self-healing rate of each sample in scratch test.
SamplesT-80-to-SDBS RatioScratch Width Before Repair
(μm)
Scratch Width After Repair
(μm)
Healing Rate
(%)
UV topcoats without added microcapsules-15.4415.44-
MC-UV102.0:8.014.1113.325.60
MC-UV112.5:7.512.9611.5510.88
MC-UV123.0:7.013.7612.727.56
MC-UV133.5:6.59.168.437.97
MC-UV144.0:6.011.138.3225.25
MC-UV154.5:5.513.4710.4422.49
MC-UV165.0:5.017.9115.612.90
Table 13. Mechanical properties of coatings with different microcapsules.
SamplesRoughness (μm)Elongation at Break (%)
UV topcoats without added microcapsules0.314.43
MC-UV100.888.89
MC-UV110.769.31
MC-UV120.585.40
MC-UV130.545.32
MC-UV140.665.17
MC-UV150.546.92
MC-UV160.746.78
Table 14. Transmittance of coatings with different microcapsules.
SamplesVisible Light Transmittance (%)
With no microcapsules87.90
With sample 10 microcapsules79.56
With sample 11 microcapsules82.74
With sample 12 microcapsules86.31
With sample 13 microcapsules82.87
With sample 14 microcapsules83.81
With sample 15 microcapsules82.50
With sample 16 microcapsules82.88
Table 15. Surface glossiness of coatings with different microcapsules.
SamplesGlossiness (GU)Loss of Light (%)
Angle of Incidence of Light Source: 20°Angle of Incidence of Light Source: 60°Angle of Incidence of Light Source: 85°
No microcapsules12.0049.3056.40-
Sample 10 microcapsules7.8032.9025.2033.27
Sample 11 microcapsules7.2030.0020.2039.15
Sample 12 microcapsules4.9029.7021.2039.76
Sample 13 microcapsules7.7032.0033.2035.09
Sample 14 microcapsules8.2034.5039.5030.02
Sample 15 microcapsules5.3031.8028.0035.50
Sample 16 microcapsules5.4030.7027.6037.73
Table 16. Chromaticity and color difference values of coatings.
SamplesColorimetric ValueColor Difference Value
ΔE
Brightness Value LRed and Green Value
a
Yellow and Blue Value
b
No microcapsules76.93−2.245.08-
Sample 10 microcapsules74.10−1.626.253.12
Sample 11 microcapsules73.32−2.175.653.66
Sample 12 microcapsules75.37−2.005.541.64
Sample 13 microcapsules74.76−2.035.702.27
Sample 14 microcapsules74.82−2.215.382.14
Sample 15 microcapsules74.90−2.045.772.16
Sample 16 microcapsules73.43−2.175.803.58
Disclaimer/Publisher’s Note: The statements, opinions and data contained in all publications are solely those of the individual author(s) and contributor(s) and not of MDPI and/or the editor(s). MDPI and/or the editor(s) disclaim responsibility for any injury to people or property resulting from any ideas, methods, instructions or products referred to in the content.

