Abstract
The aim of the study was to determine the relationship between selected features of wood and the surface properties after sanding operations. Woods presenting different anatomical structures, i.e., ring-porous hardwood (European oak) and diffuse-porous hardwood (Norway maple), were used in the study. The wood surfaces were finished by sanding with aluminum oxide sandpapers of different grits: P60, P120, P180, and P240. It was shown that among the analyzed factors (wood species, anatomical section, measurement direction, and sandpaper grit size) and the interactions between them, the direction of measurement had the greatest influence (47%) on the Ra parameter values for oak wood. The sandpaper grit determined 22% of the Ra parameter variability. The measurement direction and the grit size of the sandpaper were identified as the most influential factors affecting the Rsm parameter values. Comparable patterns were observed in the case of Norway maple wood. Due to its diffuse-porous structure, the roughness of maple wood was less affected by the sandpaper grit compared to that of oak wood. Wood species had the greatest influence, increased from 41% to 71% when examining the contact angle at phase boundary wood-water after 3 s and 30 s. Sandpaper grit showed the greatest impact on the contact angles at the wood–diiodomethane phase boundary. This impact was practically at the same level after testing the contact angles after 3 s (27%) and after 30 s (28%). Wood species determined the color parameters, being responsible for 93% of the L* parameter, 50% of parameter a*, and 78% of parameter b*. The influence of sandpaper grit on the a* and b* parameter values was at a low level, i.e., 4%. SEM micrographs revealed the diverse structural characteristics of the wood following the sanding process.
1. Introduction
One of the fundamental processes in the production of wood products is the mechanical treatment of their surfaces. This is the material preparation for applying various types of coatings (glues and protective or refining coatings). A basic method of mechanical processing of wood surfaces is sanding. To improve the surface quality and the related efficiency of a planned coating, it is very important to establish the optimal set of sanding parameters, which depend on several factors, e.g., the type of wood, its moisture content, and its intended use [1,2,3,4,5,6,7,8]. Wood sanding primarily affects the structural shape of the surface formed after tool–wood contact, which determines the surface roughness parameters [9]. Although increasing surface roughness is desirable in some applications, for example, to enhance adhesion through mechanical interlocking, sanding is most commonly performed to reduce surface irregularities and achieve a smoother finish that facilitates a uniform coating and better surface performance [10]. According to Garau [11], wood roughness is often taken as the principal quality indicator of the sanding process. Surface roughness significantly affects other manufacturing processes, such as glue bonding, surface finishing, and product durability [12], as well as the aesthetic value of products in terms of touch and appearance [13]. In most cases, wood surface elements for various applications are sanded with sandpaper of various grit sizes on belt sanders. A wide range of abrasive materials that differ in composition, shape, and particle size are used in sandpaper. There are four types of abrasives commonly used in the woodworking industry: aluminum oxide (alium, alox); silicon carbide (Sic); zirconium dioxide (Zirc); ceramic grain [14]. The choice of abrasive material significantly influences the smoothness of the sanded wood surface. Finer grits are used for surface finishing, while larger grits are used for shaping and material removal [15]. As expected, tests on oak (Quercus sp.), beech (Fagus sp.), and pine (Pinus sp.) confirmed that wood sanded with 180-grit sandpaper showed lower surface roughness parameters compared to surfaces sanded with 60-grit sandpaper. However, the degree of roughness reduction varied depending on the wood species [16]. Similar results were reported by Kilic et al. [17] for beech and poplar wood. Good surface preparation is usually understood as a process that results in increased smoothness, meaning lower surface roughness values. However, in some cases, an excessive reduction in roughness could be disadvantageous for bonding due to the reduced surface available for adhesion [18]. One of the other important properties of wood when finishing its surface with different coatings is its wettability, as this determines how the wood surface reacts to a liquid [19]. According to Petrić and Oven [20], without taking into account wettability tests, it is impossible to fully understand and accurately interpret processes of adhesion of adhesives to wood, surface finishes, aging, and hydrophobization of wood surfaces. The relationship between surface roughness and wettability has been studied for a long time. In 1805, Young developed a method for measuring the contact angle, which laid the foundation for investigating surface properties. Since then, the understanding of how surface roughness influences wettability has been further developed through subsequent research. One of the first authors to study the liquid–solid interface was Wenzel [21]. According to Wenzel’s theory, rough surfaces tend to increase wettability, meaning that the rougher the surface of a material, the more wettable it is [22].
The preparation of a wood surface depends on the synergy between the finishing processes and the chemical composition of the surface [23], as well as the structure and physical properties of the wood [16,24,25,26]. This indicates that one of the key factors influencing the quality of the finished surface is the wood type. Wood is a highly heterogeneous material in terms of its chemical composition, structure, and physical properties. These differences can be significant even for wood from trees of the same species but from different environments. The research results on the relationship between the quality of a sanded surface and the size of its pores are ambiguous. Chun-Won et al. [27] showed that for fifteen different wood types, the surface roughness increased with the diameter of the pores in the wood. Other studies have shown that the relationship between roughness and the size of anatomical elements is not as simple. For example, for oak and beech wood, the relationship between roughness and the diameter of anatomical elements was small when using 60-grit sandpaper, but much higher when using 180-grit sandpaper [16]. Jankowska’s [28] tests showed that the roughness of tested wood species demonstrated variation, depending on the wood section and the measurement direction. Radial sections showed higher roughness than tangential sections due to interlocked fibers in tested wood species. The determining element for the roughness measured across the fibers was the diameter of the vessels. The author obtained equally ambiguous results for the correlation of wood hardness and surface roughness. Most studies show an apparent effect of wood hardness on the final roughness of the finished surface because the roughness increases with density loss [16,29,30,31]. However, research on ten different species of exotic wood did not show a significant impact of density and related wood hardness on surface roughness [28].
The presented studies show that it is challenging to consider wood’s structure and physical properties in the interpretation of surface roughness. Although the problems of the quality of finished wood surfaces are often the subject of research, there are still no answers to several questions. The essential parameters of wooden products are surface roughness, wettability, and color. The influence of a wood surface’s mechanical treatment on its color is an issue that has not yet been well researched. Undoubtedly, sanding changes the surface properties that are important for color perception. Studies on various wood types have shown that sanding significantly changes the wettability angle of wood [32], which may cause changes in the interaction of light and water and thus affect wood color. Furthermore, smoothing a wood surface by sanding can cause differences in the refraction of light rays and therefore change its structural color [33,34,35]. Studies on the effect of the nanometric roughness of wood surfaces on color and gloss have shown that increasing roughness increases the amount of scattered light, which weakens color saturation and changes the perception of color, especially in darker areas [36]. In general, experiments with surfaces with controlled roughness show that greater roughness lowers color saturation and increases the so-called perceived brightness, i.e., the subjective impression of the intensity of light reflected from the surface that reaches the observer’s eye [35]. The results of the research conducted so far do not allow for a precise determination of the influence of surface sanding on the change in the color of sanded wood. Studies on the effect of surface sanding on the color of Marupa (Simarouba amara Aubl.) wood have shown that regardless of the size of the sandpaper grits (280 or 320), the wood’s color does not change significantly [37]. Bekhta et al. [38] in their research on pre-treatment of silver birch (Betula verrucosa Ehrh.) and black alder (Alnus glutinosa Gaertn) wood found that although sanding does not significantly affect wood color change, it may increase the extent of its discoloration after aging.
This study investigated the influence of sandpaper granulation on the three features of wood surfaces. The research was carried out on ring-porous wood, namely, European oak (Quercus robur L.) wood, and diffuse-porous Norway maple (Acer platanoides L.) wood. The obtained results presented in this article may contribute to defining in the future the unambiguous influence of wood structure on the selection of the surface finishing conditions of wooden products.
2. Materials and Methods
2.1. Wood Preparation
European oak (Quercus robur L.) heartwood and Norway maple (Acer platanoides L.) wood were used for the study. To investigate the surface properties of wood, samples with dimensions of 150 mm (parallel to the fibers) × 50 mm × 10 mm were prepared. Two types of samples were analyzed, i.e., wood samples with wide planes (50 mm perpendicular to the fibers) representing radial or tangential sections. After cutting, the wood samples were kept in a normal climate (temperature: 20 °C ± 2 °C, relative humidity: 65% ± 5%). The sample surfaces were finished by sanding with aluminum oxide sandpaper of the following granulations: P60, P120, P180, and P240. The wood moisture content determined in accordance with ISO 13061-1:2014 [39] requirements was 8%–10%. Wood density was determined by the stereometric method in accordance with the requirements of ISO 13061-2:2014 [40]. The density of the oak and maple wood was 695 (± 68) kg × m−3 and 639 (± 48) kg × m−3, respectively.
2.2. Microscopic Measurements
For the structural analysis of wood, samples with dimensions of 10 mm (radial) × 10 mm (tangential) × 15 mm (longitudinal) were prepared. Samples were soaked (macerated) in a mixture of water, 96% ethyl alcohol, and glycerin in the proportion of 1:1:1 (v/v/v). The process of soaking the samples in the prepared mixture took three weeks. After this time, the samples were cut with a sledge microtome (Reichert, Vienna, Austria) to a thickness of 15–30 μm. Preparations were stained with 5% safranin solution in 96% ethyl alcohol. The Olympus BX-41 microscope (Olympus Corporation, Tokyo, Japan) equipped with a digital camera and coupled with specialized Cell B analytical software was used for the microscopic analysis. The diameters in the radial and tangential directions of vessels, fibers, and axial parenchyma in the oak and maple wood were measured in transverse section images. A total of 30 measurements were taken for each diameter of structural elements.
2.3. SEM Evaluation
The surfaces of the oak and maple wood were observed using a scanning electron microscope (SEM), the Phenom XL (Phenom World, Eindhoven, The Netherlands). Prior to imaging, the samples were coated with a 5 nm layer of gold using an auto-sputter coater (Leica EM ACE200; Leica Microsysteme GmbH, Vienna, Austria) to improve surface conductivity. Microstructural images were taken at a magnification of 200× and recorded using Phenom ProSuite Software (version 5.4.7). The SEM was operated at an accelerating voltage of 10 kV and under a pressure of 60 Pa.
2.4. Roughness Parameter Determination
The roughness tests were conducted in accordance with the requirements of ISO 21920-2:2021 [41]. The following parameters were determined: Ra (arithmetical mean deviation of the assessed profile), Rz (maximum height of the assessed profile), and Rsm (mean width of the profile elements). Measurements were taken parallel and perpendicular to the fibers, 12 times in each direction for each variant of sanded wood. The roughness parameters were measured with an accuracy of 0.001 μm. The surface roughness was determined using the Surftest SJ-210 Portable Surface Roughness Tester manufactured by Mitutoyo Corporation (Kawasaki, Japan). Surface roughness line profiles of wood were generated based on displacement data.
2.5. Wettability Measurements
Contact angles of the oak and maple wood were determined with reference liquids in a goniometer, the Phoenix 300 of the Surface Electro Optics company (Suwon City, South Korea). Measurements were performed in the longitudinal direction of the fibers because wetting is more important fiberwise [10]. The measurements were carried out based on the sessile drop method, and the volume of the drop was 3 µL. Water and diiodomethane as reference liquids were used for the study. The surface tension components of the reference liquids are shown in Table 1. The contact angle was determined using an image analysis system (Image XP, Surface Electro Optics, version 5.8; Suwon City, South Korea). The contour of the droplet on the surface was extracted from high-resolution images, and the contact angles on the left and right sides were determined using a trigonometric method. The arithmetic mean of these two contact angles was then calculated and reported. The contact angle was determined after 3 s and 30 s after the application of a liquid drop on the surface of the wood. The surface free energy of the oak and maple wood was determined using the Owens–Wendt method [42]. This approach was based on contact angle measurements with two reference liquids: distilled water (polar) and diiodomethane (nonpolar), with known surface tension parameters shown in Table 1. The total surface free energy (SFE) was calculated as the sum of its polar and dispersive components, determined from the measured contact angles and the known parameters of the test liquids. Average contact angle values from six independent measurements per liquid were used in the calculations to ensure reliability. The analysis was performed using the Image XP software (Surface Electro Optics, version 5.8; Suwon City, South Korea), which includes a built-in calculator for surface energy estimation. The software automatically solves Owens–Wendt equations and provides values for both polar and dispersive components, as well as total surface free energy.

Table 1.
Surface tension components of the reference liquids [43].
2.6. Wood Color Determination
The following color parameters were determined: lightness (L*), the chromatic coordinate on the red–green axis (a*), and the chromatic coordinate on the yellow–blue axis (b*). The color parameters were determined using a SPECTROMASTER 565-D spectrophotometer obtained from ERICHSEN GmbH & Co. KG (Hemer, North Rhine-Westphalia, Germany). Measurements were made using an illuminant D65 (average daylight). Measurements were taken for the radial and tangential sections, 12 times for each variant of sanded wood.
2.7. Statistical Analysis
Statistical analyses were performed using STATISTICA version 13.3 software (TIBCO Software Inc., Palo Alto, CA, USA). The statistical analysis of the results was based on the t-test or ANOVA (Fischer’s F-test), with a significance level (p) of 0.05.
3. Results and Discussion
3.1. Anatomical Characteristics of Wood
The results on the anatomical characteristics of the European oak and Norway maple wood are presented in Table 2. In general, it can be stated that in the radial direction, the oak earlywood vessel (VEW) diameter was about six times larger than the diameter of the maple wood vessels. On the other hand, the oak latewood vessel (VLW) diameter was 35% smaller than the diameter of maple wood. In the tangential direction the oak earlywood vessel diameter was about five times larger than the diameter of maple wood vessels, and the oak latewood vessel diameter was twice as small as the diameter of maple wood. The indicated relationships are consistent with the literature data [44] and may constitute a basis for further analyses regarding their influence on wood roughness and wettability [16,18]. Smaller differences were observed in axial parenchyma and fibers. In the radial direction the oak axial parenchyma diameter was about 40% larger than the diameter of the maple wood axial parenchyma. There were no statistically significant differences between axial parenchyma diameter in the tangential direction for oak or maple. In oak wood, the fibers were oriented in the radial direction, reaching a larger dimension than in the tangential direction. On the other hand, in maple wood the fibers were oriented in the tangential direction, reaching larger dimensions than in the radial direction.

Table 2.
Diameters of anatomical characteristics of European oak and Norway maple wood; ±(SD).
3.2. Wood Roughness
Typical end-grain SEM micrographs of the European oak (symbol O in the legend) and Norway maple (symbol M in the legend) wood after sanding are presented in Figure 1 and Figure 2, respectively. The symbols R and T in the legend descriptions denote radial and tangential sections, respectively. The SEM micrographs show the varied structure of the wood after the sanding process. In oak wood, the vessels are exposed (Figure 1d,e) or have a preserved wall (Figure 1a,h).
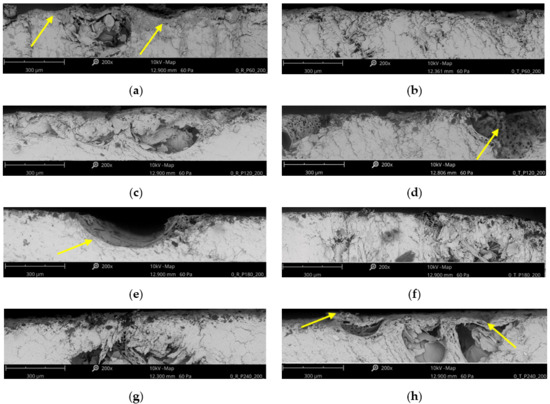
Figure 1.
Typical end-grain SEM micrographs of European oak wood after sanding with sandpaper: (a) P60 on radial section, (b) P60 on tangential section, (c) P120 on radial section, (d) P120 on tangential section, (e) P180 on radial section, (f) P180 on tangential section, (g) P240 on radial section, (h) P240 on tangential section (yellow arrows indicate elements of the anatomical structure of wood).
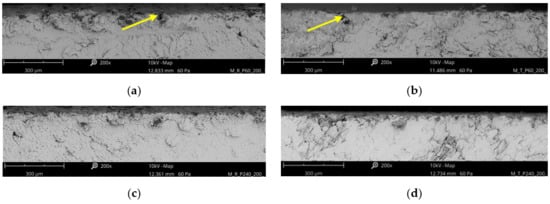
Figure 2.
Typical end-grain SEM micrographs of Norway maple wood after sanding with sandpaper: (a) P60 on radial section, (b) P60 on tangential section, (c) P240 on radial section, (d) P240 on tangential section (yellow arrows indicate elements of the anatomical structure of wood).
During sanding, randomly located elements of the anatomical structure of wood are cut at different angles and therefore, even with excellent cutting quality, without deformation, elements of anatomical structure depressions remain on the surface, causing a certain roughness, which is not an effect of the processing and is referred to as structural or anatomical roughness. Increased surface roughness can also be caused by another element of structural roughness, namely, by the random position of cuts in relation to the zone of earlywood and latewood [3,5]. Maple wood has a more closed surface structure than European oak wood, which the SEM micrographs revealed (Figure 2).
Surface roughness line profiles of the European oak wood after sanding are presented in Figure 3. It was stated that among the analyzed factors the direction of measurement and sandpaper grit shaped the roughness profiles to the greatest extent. Similar relationships applied to the roughness profiles of the Norway maple wood (Figure 4). Due to the diffuse-porous structure of maple wood, the roughness profiles showed less variation depending on the sandpaper grit used than the oak roughness profiles.
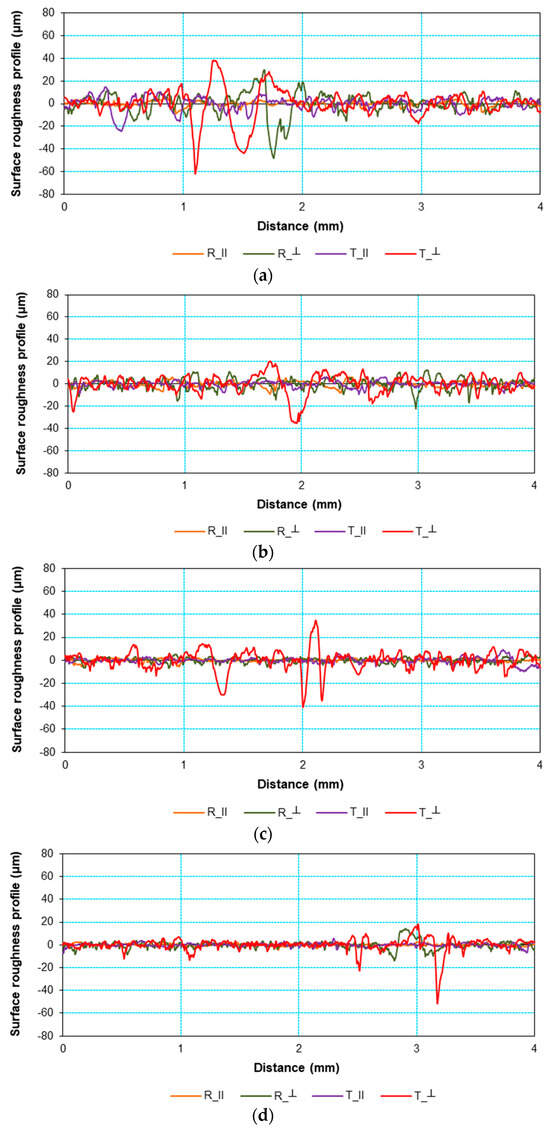
Figure 3.
Surface roughness line profiles of European oak wood after sanding with sandpaper: (a) P60, (b) P120, (c) P180, (d) P240.
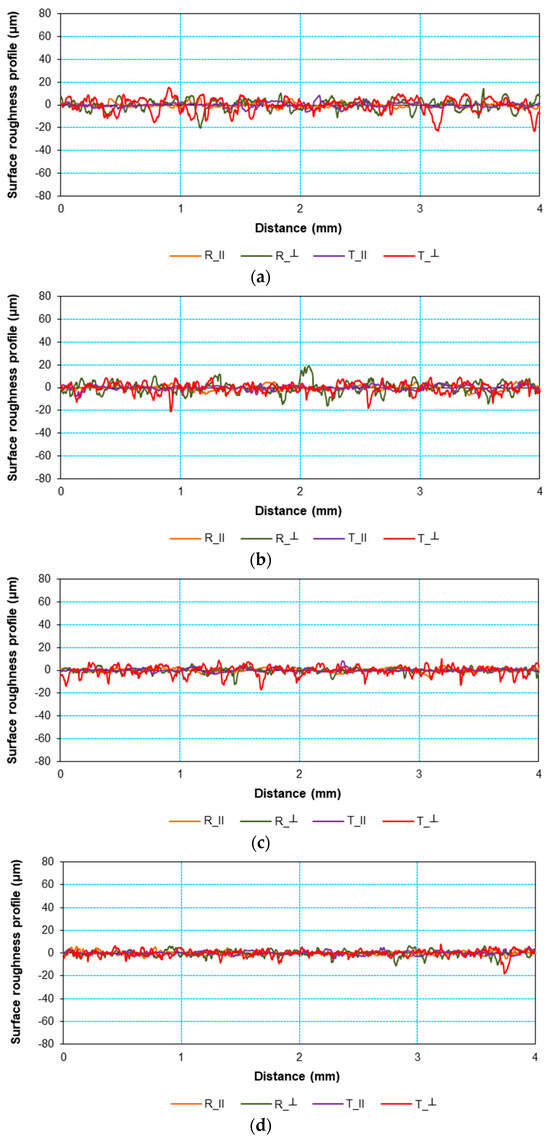
Figure 4.
Surface roughness line profiles of Norway maple wood after sanding with sandpaper: (a) P60, (b) P120, (c) P180, (d) P240.
The numerical characteristics of the roughness profiles are expressed by the measured parameters Ra, Rz, and Rsm (Figure 5, Figure 6 and Figure 7). The influence of the wood structure is visible through the values of the roughness parameters. For oak wood, the Ra, Rz, and Rsm values were different depending on the anatomical section, measurement direction, and sandpaper grit. On the other hand, lower dimensional variation in structural elements resulted in lower variation in maple wood roughness. These observations are consistent with the literature data indicating that the high surface roughness of a material can be caused by the influence of its anatomical structure and above all by the influence of the method of surface finishing by sanding [10,16,27].
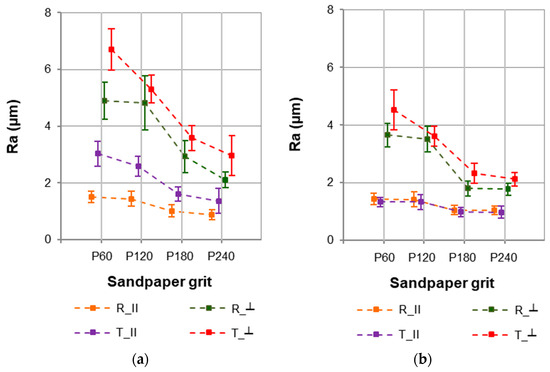
Figure 5.
Ra parameter values for (a) European oak and (b) Norway maple wood.
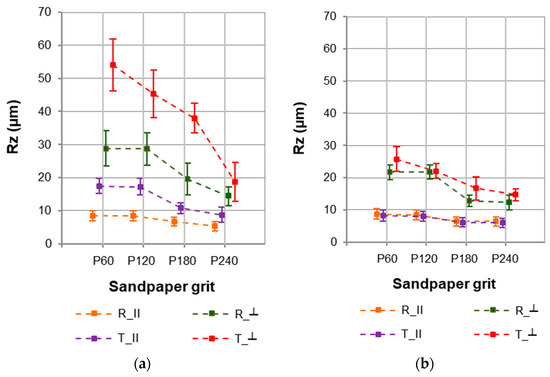
Figure 6.
Rz parameter values for (a) European oak and (b) Norway maple wood.
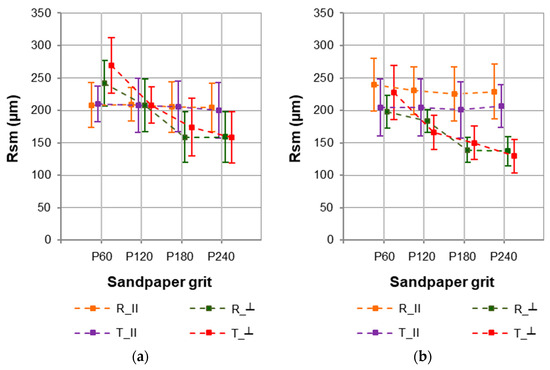
Figure 7.
Rsm parameter values for (a) European oak and (b) Norway maple wood.
The oak wood was characterized by higher Ra values than the maple wood. This did not apply to Ra on the radial section parallel to the fibers. For oak wood, higher Ra values were recorded for the tangential section than for the radial section (Figure 5a). Furthermore, Ra was higher for measurements taken perpendicular to the fibers than those taken parallel to the fibers. The obtained results do not confirm the observations made by Sulaiman et al. [45] for rubber wood also sanded with aluminum oxide (grit sizes: 120, 150, and 180), showing that roughness is higher when measured parallel to the grain compared to perpendicular to the grain. A similar trend was noted by Adamčík et al. [8] for beech wood (Fagus sylvatica L.).
For maple wood (Figure 5b), no significant differences in the Ra parameter were found depending on the tested section (radial or tangential). However, for a given section, higher Ra values were noted perpendicular to the fibers than parallel to the fibers. In general, it can be concluded that the higher the sandpaper grit size, the lower the Ra values were (Figure 5a,b). It should be noted that a significant decrease in the Ra parameter was noted after sanding oak and maple wood with P180 sandpaper. Moreover, for maple wood, no significant differences were found in the Ra parameter values after sanding with P240 paper compared to sanding with P180 sandpaper.
The Rz parameter, defined as the maximum height of the assessed profile, was characterized by higher values (Figure 6) depending on the analyzed variable (wood species, anatomical section, measurement direction, and sandpaper grit size) than the Ra parameter (Figure 5). For oak wood, average Rz values in the range of 5.287–54.108 µm were recorded, while for maple wood Rz values were in the range of 5.944–25.707 µm. It should be noted that for maple wood the observations regarding Rz were analogous to those regarding the Ra parameter. However, for oak wood, the Rz parameter showed greater variation in the measurements conducted perpendicular to the fibers depending on the anatomical section and sandpaper grit (Figure 6a).
The values of the Rsm parameter, which represents the mean spacing of profile irregularities, were determined for European oak (Figure 7a) and Norway maple wood (Figure 7b). This parameter provides insight into the spatial characteristics of the surface texture following the sanding process. The analysis revealed noticeable differences between the two wood species, reflecting their distinct anatomical structures and responses to abrasive treatment. Noticeable differences occurred solely perpendicular to the grain for both the investigated radial and tangential cross-sections.
Statistical analyses (Table 3) clearly showed that among the analyzed factors (variables) and interactions between them, the direction of measurement and sandpaper grit had the greatest influence on the Ra parameter values. The measurement direction showed an influence of 47%, and sandpaper grit showed an influence of 22%. These two factors accounted for 69% of the Ra variability. Wood species and anatomical section accounted for only 8% and 3% of the Ra parameter value variability. Similar relationships were found in relation to the degree of influence of the analyzed factors on the roughness expressed by the Rz parameter. The measurement direction showed an influence of 43%, and sandpaper grit showed an influence of 13%. Wood species and anatomical section accounted for only 10% and 7% of the Rz parameter value variability. It is worth noting that the indicated interactions were to a small extent “responsible” for the values of individual parameters characterizing roughness. In addition, other factors that were not included in the studies and could be responsible for the variability in roughness parameters constituted a small percentage, i.e., 7%. The measurement direction and sandpaper grit had the greatest influence on the Rsm parameter values. The measurement direction showed an influence of 10%, and sandpaper grit showed an influence of 14%. The high error value (56%) suggests that there were other factors not covered by the study, such as the length of the structural elements, which may have affected the Rsm values.

Table 3.
Factors influencing (FI) the roughness parameters of European oak and Norway maple wood (Fischer’s F-test; p ≤ 0.05).
3.3. Wood Wettability
The contact angles at the wood–water phase boundary showed significant variation depending on wood species, anatomical section, and sandpaper grit (Figure 8). For oak wood, the lowest contact angle (68° after 3 s, 56° after 30 s) was noted after sanding with P60 sandpaper (Figure 8a).
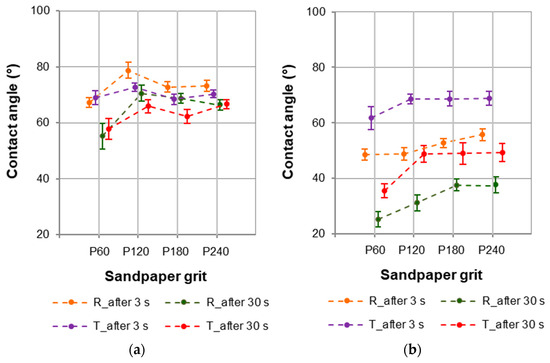
Figure 8.
Contact angles at wood–water phase boundaries for (a) European oak and (b) Norway maple wood.
It is significant that the lowest wettability, defined by the highest contact angles (79° and 73°, respectively, for radial and tangential section after 3 s, and 71° and 66°, respectively, for radial and tangential section after 30 s), was a characteristic of oak wood sanded with P120 sandpaper. After sanding with P180 and P240 sandpaper, the contact angle of oak wood was at a similar level within the analyzed section (in the range of 62–72°). The contact angle for oak wood surfaces sanded with P60 and P240 sandpaper did not show any differences depending on the tested anatomical section (radial or tangential). However, the contact angle was different for the tested sections after sanding the oak wood surface with P120 and P180 sandpaper. This concerned the tests after 3 s and 30 s from the application of a drop of water to the wood surface.
The wettability of maple wood varied significantly depending on the section examined (Figure 8b). The lowest wettability of maple wood was a characteristic of the tangential section. The higher wettability on the radial section could have resulted from the “availability” of thin-walled parenchyma cells forming the wood rays. Maple wood is characterized by a significant share of this type of anatomical characteristic [44], the structure of which is particularly visible in the radial section. For maple wood, the lowest contact angle was noted after sanding with P60 sandpaper. After sanding the maple with P120, P180, and P240, no significant differences were found in the wetting angle values on the tangential section. However, on the radial section, these differences were not found after sanding with P180 and P240 paper.
The dynamics of the contact angle variation with a nonpolar liquid (diiodomethane) were most likely the result of different anatomical structures and chemical compositions (contents of nonstructural compounds) and different surface structures, and thus different roughness values, for individual wood species [46,47,48]. The differences in the contact angle values were much greater when the tested wood surfaces were wetted with water (Figure 8) rather than diiodomethane (Figure 9). In the case of a nonpolar liquid, the contact angles changed to a lesser extent. The initial values of the contact angles of the tested wood species with diiodomethane ranged from about 25° to 30°. The largest changes in contact angle were noted for the maple wood surface after sanding with P240, for which the contact angle with diiodomethane, 30 s after applying the drop, was only about 26° (a change of almost 20%). In the case of the other variants, no significant effect of surface treatment with sandpaper of different grain sizes on the change in the value of the contact angle with diiodomethane at 3 and 30 s was noted.
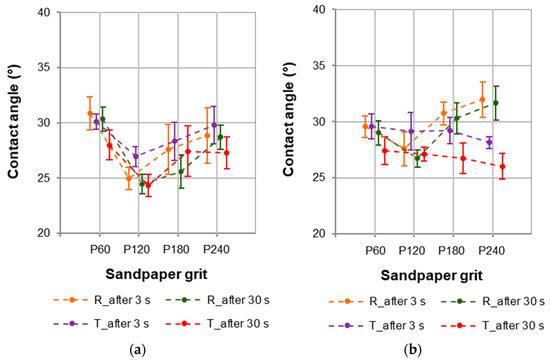
Figure 9.
Contact angles at wood–diiodomethane phase boundaries for (a) European oak and (b) Norway maple wood.
The statistical evaluation of the influence of factors on the contact angles at the wood–water phase boundary (Table 4) showed that wood species had the greatest impact. It is significant that this influence increased from 41% to 71% when examining the contact angle after 3 s and 30 s. When the percentage impact of factors on the contact angles at the wood–diiodomethane phase boundary were analyzed (Table 5), it is worth noting that sandpaper grit showed the greatest impact. This impact was practically at the same level after testing the contact angles after 3 s (27%) and after 30 s (28%). The influence of wood species on the analyzed parameter was small, i.e., 7% in the case of the wetting angle test after 3 s and 6% in the case of the wetting angle test after 30 s. It is significant that the influence of anatomical section was visible after 30 s (impact at the level of 12%) and not after 3 s.

Table 4.
Statistical evaluation of the factors influencing the contact angle at the wood–water phase boundaries of European oak and Norway maple wood (based on ANOVA, Fischer’s F-test, p ≤ 0.05).

Table 5.
Statistical evaluation of the factors influencing the contact angle at the wood–diiodomethane phase boundaries of European oak and Norway maple wood (based on ANOVA, Fischer’s F-test, p ≤ 0.05).
The surface free energy varied depending on the wood species and anatomical section (Table 6). No significant differences in the surface free energy values were found depending on the sandpaper grit. This applied to both oak and maple wood. Surface free energy for oak wood was in the range of 48.186–53.790 mJ × m−2, while for maple wood it was in the range of 46.165–50.425 mJ × m−2. The dispersive component was the dominant component of the surface free energy. This is a typical feature characteristic of the polymers of which the wood is composed [49,50]. According to Li et al. [51], the high value of the dispersive component is the result of the high interaction ability of the dispersive parts of available carbon–oxygen and carbon–carbon bonds within the wood. On the other hand, the polar component refers to the interaction between hydroxyl groups of wood and functional groups of adhesives by the formation of hydrogen bonds.

Table 6.
Surface free energy of European oak and Norway maple wood after sanding.
3.4. Wood Color
It should be noted that a smooth material surface allows for a more uniform color of the finishing coating, while a material surface with a higher level of roughness often causes a different decorative effect by increasing light scattering, potentially reducing the brightness and gloss of colors [52,53].
The conducted research showed that sanding the surface of European oak and Norway maple wood with P60–P240 sandpapers changes the texture of the wood but does not significantly affect the differentiation of the color parameters, i.e., L* (Figure 10a), a* (Figure 10b), and b* (Figure 10c). According to Abrahão [54], the uniformity of the color of wood is very important because it significantly affects the appearance of the final product. Depending on the given anatomical section of wood, the processed surfaces of these sections are characterized by variety [55]. Moreover, as Masuda [56] reports, processed surfaces of different types of wood contain many micromirrors arranged parallel to the grain. The gloss of these micromirrors gives a more aesthetic, natural, and beautiful texture than in the case of plastics or metal.
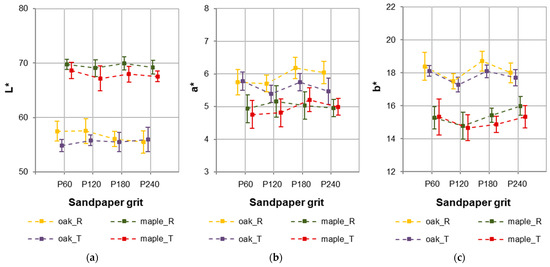
Figure 10.
Color parameters: (a) L*, (b) a*, and (c) b* for European oak and Norway maple wood.
Based on the statistical evaluation of the factors influencing the color parameters of oak and maple wood, it can be clearly stated that the wood species determined the color parameters (Table 7). This factor was responsible for 93% of the parameter L* variability, 50% of parameter a* variability, and 78% of parameter b* variability. The influence of sandpaper grit on the a* and b* parameter values was demonstrated. This factor was responsible for 4% of the variability in both the a* and b* parameters. Differences in the L* color parameter values between species resulted from the presence of extractive compounds, i.e., differences in the chemical composition of wood [45]. Comparing the L* values for oak sanded with P60 and P240 sandpaper, the parameters changed by 3% and 2%, respectively, for the radial and tangential sections, and these differences were statistically insignificant (p ≤ 0.05). When comparing the L* values for maple wood for the P60 and P240 granulations, the parameters changed by 0.7% and 2% for the radial and tangential sections, respectively. It was shown that there were no significant differences in the color parameter values between the radial and tangential sections for the tested wood species, which is of great importance from the utility point of view.

Table 7.
Statistical evaluation of the factors influencing the color parameters of European oak and Norway maple wood (based on ANOVA, Fischer’s F-test, p ≤ 0.05).
4. Conclusions
The present study investigated the influence of sanding with different grit sizes of aluminum oxide sandpaper on selected surface properties of European oak and Norway maple wood. The following conclusions can be drawn:
- ▪
- Surface roughness was most significantly affected by the measurement direction and sandpaper grit size, which together accounted for nearly 70% of Ra variability. A higher sandpaper grit (finer grains) led to lower roughness values, although roughness was also influenced by the wood species, which reflects the underlying anatomical structure of the wood.
- ▪
- Wettability (contact angle with water) was mainly dependent on wood species, followed by anatomical section and grit size. A significant interaction between species and anatomical section was observed, particularly during the initial wetting phase (after 3 s).
- ▪
- Contact angles with diiodomethane, a nonpolar liquid, were primarily influenced by sandpaper grit size, with only minor contributions from wood species and anatomical orientation.
- ▪
- Surface free energy was found to be independent of sandpaper grit size but varied with wood species and anatomical section. This suggests that sanding has a limited effect on this property compared to intrinsic wood characteristics.
- ▪
- Wood color was predominantly influenced by species, especially the L* parameter (lightness), with a negligible effect from sanding grit. The observed variability in color due to sanding was minimal and likely within the margin of measurement error.
Author Contributions
Conceptualization, A.L. and A.P.; methodology, A.L., K.L., K.R., and P.B.; software, A.L.; validation, A.L.; formal analysis, A.L., K.L., and P.B.; investigation, A.L.; resources, A.L., A.P., K.R., and K.L.; data curation, A.L., A.P., and K.L.; writing—original draft preparation, A.L., A.P., and T.K.; writing—review and editing, K.L. and P.B.; visualization, A.L.; supervision, A.L., K.L., and P.B.; project administration, A.L. and P.B.; funding acquisition, P.B. All authors have read and agreed to the published version of the manuscript.
Funding
This research received no external funding.
Institutional Review Board Statement
Not applicable.
Informed Consent Statement
Not applicable.
Data Availability Statement
The original contributions presented in the study are included in the article; further inquiries can be directed to the authors.
Conflicts of Interest
The authors declare no conflicts of interest.
References
- De Maura, L.F.; Hernández, R.E. Evaluation of varnish coating performance for two surfacing methods on sugar maple wood. Wood Fiber Sci. 2005, 37, 355–366. [Google Scholar]
- De Maura, L.F.; Hernández, R.E. Effects of abrasive mineral, grit size and feed speed on the quality of sanded surfaces of sugar maple wood. Wood Sci. Technol. 2006, 40, 517–530. [Google Scholar] [CrossRef]
- Aguilera, A.; Zamora, R. Surface roughness in sapwood and heartwood of blackwood (Acacia melanoxylon R. Br.) machined in 90-0 direction. Eur. J. Wood Wood Prod. 2009, 67, 297–301. [Google Scholar] [CrossRef]
- Cool, J.; Hernández, R.E. Improving the sanding process of black spruce wood for surface quality and water-based coating adhesion. For. Prod. J. 2011, 61, 372–380. [Google Scholar] [CrossRef]
- Tan, P.L.; Sharif, S.; Sudin, I. Roughness models for sanded wood surfaces. Wood Sci. Technol. 2012, 46, 129–142. [Google Scholar] [CrossRef]
- Luo, B.; Liu, H.; Xu, M.; Xing, F. Analysis of sanding parameters, sanding force, normal force, power consumption, and surface roughness in sanding wood-based panels. Bioresources 2014, 9, 7494–7503. [Google Scholar] [CrossRef]
- Salca, E.A.; Krystofiak, T.; Lis, B. Evaluation of Selected Properties of Alder Wood as Functions of Sanding and Coating. Coatings 2017, 7, 176. [Google Scholar] [CrossRef]
- Adamčík, L.; Kminiak, R.; Schmidtová, J. Measurement of the roughness of the sanded surface of beech wood with the profile measurement software of the keyence vhx-7000 microscope. Acta Fac. Xylologiae Zvolen 2023, 65, 73–86. [Google Scholar]
- Bembenek, M. Researches on influence of wood sanding direction on wood gluing. J. Indian Acad. Wood Sci. 2022, 19, 103–109. [Google Scholar] [CrossRef]
- Ugulino, B.; Hernández, R.E. Analysis of sanding parameters on surface properties and coating performance of red oak wood. Wood Mater. Sci. Eng. 2018, 13, 64–72. [Google Scholar] [CrossRef]
- Garau, L. An objective method to measure and evaluate the quality of sanded wood surfaces. In Cost Action E 53: The Future of Quality Control for Wood and Wood Products; Ridley-Ellis, D.J., Moore, J.R., Eds.; Napier University: Edinburgh, UK, 2010; pp. 1–9. [Google Scholar]
- Richter, K.; Feist, W.C.; Knaebe, M.T. The effect of surface roughness on the performance of finishes. Part 1: Roughness characterization and stain performance. For. Prod. J. 1995, 45, 91–96. [Google Scholar]
- Sandak, J.; Negri, M. Wood surface roughness—What is it. In Proceedings of the 17th International Wood Machining Seminar, Rosenheim, Germany, 26–28 September 2005. [Google Scholar]
- Available online: https://www.wood-finishes-direct.com (accessed on 19 March 2025).
- Borkowski, J.A. Uses of Abrasives and Abrasive Tools, 1st ed.; Borkowski, J.A., Szymański, A.M., Eds.; Ellis Horwood Series in Mechanical Engineering; Prentice Hall: Hoboken, NJ, USA, 1992; p. 288. ISBN 978-0-13-932518-2. [Google Scholar]
- Laina, R.; Sans-Lobera, A.; Villasante, A.; Lopez-Espi, P.; Martinez-Rojas, J.A. Effect of the anatomical structure, wood properties and machining conditions on surface roughness of wood. Maderas Cienc. Tecnol. 2017, 19, 203–212. [Google Scholar] [CrossRef][Green Version]
- Kilic, M.; Hiziroglu, S.; Burdurlu, E. Effect of machining on surface roughness of wood. Build. Environ. 2006, 41, 1074–1078. [Google Scholar] [CrossRef]
- De Moura, L.F.; Cool, J.; Hernández, R.E. Anatomical evaluation of wood surfaces produced by oblique cutting and face milling. IAWA J. 2010, 31, 77–88. [Google Scholar] [CrossRef]
- da Silva Siebra, M.B.; de Lima Fernandes, N.C.; Ribeiro, P.G.; Lobão, M.S. Molhabilidade de duas madeiras amazônicas tratadas com produtos de acabamento. Sci. Nat. 2020, 2, 68–71. [Google Scholar]
- Petrić, M.; Oven, P. Determination of Wettability of Wood and its Significance in Wood Science and Technology A Cristal Review. Rev. Adhes. Adhes. 2015, 3, 121–187. [Google Scholar] [CrossRef]
- Sinderski, L.G.Z. Ângulo de Contato e Rugosidade de Madeiras, uma breve revisão. Braz. J. Wood Sci. 2020, 11, 1. [Google Scholar] [CrossRef]
- Wenzel, R.N. Resistance of solid surfaces to wetting by water. Ind. Eng. Chem. 1936, 28, 988–994. [Google Scholar] [CrossRef]
- Cordeiro, L.A.; De Miranda, B.; Carneiro, M.E.; Missio, A.L.; Klock, U.; De Cademartori, P.H.G. The effect of sanding on the wettability and surface quality of imbuia, red oak and pine wood veneers. Maderas. Cienc. Tecnol. 2023, 25, 1–10. [Google Scholar] [CrossRef]
- Garou, L.; Manseld-Williams, H.; Irle, M. The influence of wood anatomy on evaluating the roughness of sanded solid wood. J. Inst. Wood Sci. 2005, 17, 65–74. [Google Scholar]
- Magoss, E. General regularities of wood surface roughness. Acta Silv. Lignaria Hung. 2008, 4, 81–93. [Google Scholar] [CrossRef]
- Aguilera, A.; Muñoz, H. Rugosidad superficial y potencia de corte en elcepillado de acacia melanoxylon y sequoia sempervirens. Maderas. Cienc. Tecnol. 2011, 13, 19–28. [Google Scholar] [CrossRef]
- Chun-Won, K.; Kazuharu, H.; Eunsuk, J.; Haradhan, K. Relationship between wood anatomical features and surface roughness characteristics. Wood Res. 2023, 68, 455–464. [Google Scholar] [CrossRef]
- Jankowska, A. Understanding of surface roughness of wood based on analysis its structure and density. Ann. Wars. Univ. Life Sci.—SGGW For. Wood Technol. 2020, 111, 27–31. [Google Scholar] [CrossRef]
- Hiziroglu, S.; Anwar, U.M.K.; Hamdan, H.; Paridah, M.T. Evaluation of surface quality of some Malaysian species as function of outdoor exposure. J. Mater. Process. Technol. 2008, 199, 156–162. [Google Scholar] [CrossRef]
- Amorim, M.R.S.; Ribeiro, P.G.; Martins, S.A.; Del Menezzi, C.H.S.; De Souza, M.R. Surface wettability and roughness of 11 Amazonian tropical hardwoods. Floresta Ambiente 2013, 20, 99–109. [Google Scholar] [CrossRef]
- Alia-Syahirah, Y.; Paridah, M.T.; Hamdan, H.; Anwar, U.M.K.; Nordhalia, A.S.; Lee, S.H. Effects of anatomical characteristics and wood density on surface roughness and their relation to surface wettability of hardwood. J. Trop. For. Sci. 2019, 31, 269–277. [Google Scholar] [CrossRef]
- Reis, K.d.J.; Lima, M.R.N.; Santos, J.A.; Santos, L.S.R.; Vieira, I.L.S.M.; Junior, C.A.A.; Andrade, A.C.; de Almeida Andrade, A.C. Surface quality of massaranduba wood after sanding with different grit sizes. Res. Soc. Dev. 2025, 14, e6214348468. [Google Scholar] [CrossRef]
- Firoozmand, M. The Impact of Sanding Grit Size on Color Consistency of Different Wood Species Used in Canadian Furniture Manufacturing—A Visual Inspection; WOOD 493. A Report Submitted in Partial Fulfillment of the Requirements for the Degree of Bachelor of Science in Wood Products Processing; The Faculty of Forestry, University of British Columbia: Vancouver, BC, Canada, 2013; Available online: http://hdl.handle.net/2429/45491 (accessed on 18 May 2025).
- Saarinen, K.; Muinonen, K. Light scattering by wood fibers. Appl. Opt. 2001, 40, 5064–5077. [Google Scholar] [CrossRef]
- Isherwood, Z.J.; Huynh-Thu, Q.; Arnison, M.; Monaghan, D.; Toscani, M.; Perry, S.; Honson, V.; Kim, J. Surface properties and the perception of color. J. Vis. 2021, 21, 7. [Google Scholar] [CrossRef]
- Hauptmann, M.; Müller, U.; Obersriebnig, M.; Gindl-Altmutter, W.; Beck, A.; Hansmann, C. The optical appearance of wood related to nanoscale surface roughness. BioResources 2013, 8, 4038–4045. [Google Scholar] [CrossRef]
- De Paula, M.; Mesquita, R.; Costa, M.; Gonçalez, J.; Ananias, R.; Janin, G. Effect of applying finishing products and sanding on the surface of marupa wood. Maderas Cienc. Tecnol. 2020, 22, 45–54. [Google Scholar] [CrossRef]
- Bekhta, P.; Krystofiak, T.; Lis, B.; Bekhta, N. The Impact of Sanding and Thermal Compression of Wood, Varnish Type and Artificial Aging in Indoor Conditions on the Varnished Surface Color. Forests 2022, 13, 300. [Google Scholar] [CrossRef]
- ISO 13061-1; Physical and Mechanical Properties of Wood—Test Methods for Small Clear Wood Specimens—Part 1: Determination of Moisture Content for Physical and Mechanical Tests. International Organization for Standardization: Geneva, Switzerland, 2014.
- ISO 13061-2; Physical and Mechanical Properties of Wood—Test Methods for Small Clear Wood Specimens—Part 2: Determination of Density for Physical and Mechanical Tests. International Organization for Standardization: Geneva, Switzerland, 2014.
- ISO 21920-2; Geometrical Product Specifications (GPS)—Surface Texture: ProfilePart 2: Terms, Definitions and Surface Texture Parameters. International Organization for Standardization: Geneva, Switzerland, 2021.
- Owens, D.K.; Wendt, R.C. Estimation of the surface free energy of polymers. J. Appl. Polym. Sci. 1969, 13, 1741–1747. [Google Scholar] [CrossRef]
- Gindl, M.; Sinn, G.; Gindl, W.; Reiterer, A.; Tschegg, S. A comparison of different methods to calculate the surface free energy of wood using contact angle measurements. Colloids Surf. Physicochem. Eng. Asp. 2001, 181, 279–287. [Google Scholar] [CrossRef]
- Wagenführ, R. Holzatlas, 6th ed.; Neu Bearbeitete und Erweiteste Auflage; Fachbuchverlag: Leipzig, Germany, 2007. [Google Scholar]
- Sulaiman, O.; Hashim, R.; Subari, K.; Liang, C.K. Effect of sanding on surface roughness of rubberwood. J. Mater. Process. Technol. 2009, 209, 3949–3955. [Google Scholar] [CrossRef]
- Laskowska, A.; Sobczak, J.W. Surface chemical composition and roughness as factors affecting the wettability of thermo-mechanically modified oak (Quercus robur L.). Holzforschung 2018, 72, 993–1000. [Google Scholar] [CrossRef]
- Liptákova, E.; Kúdela, J. Analysis of the wood–wetting process. Holzforschung 1994, 48, 139–144. [Google Scholar] [CrossRef]
- Liptákova, E.; Kúdela, J.; Bastl, Z.; Spirovová, I. Influence of mechanical surface treatment of wood on the wetting process. Holzforschung 1995, 49, 369–375. [Google Scholar] [CrossRef]
- Mohan, T.; Kargl, R.; Doliška, A.; Vesel, A.; Köstler, S.; Ribitsch, V.; Stana-Kleinschek, K. Wettability and surface composition of partly and fully regenerated cellulose thin films from trimethylsilyl cellulose. J. Colloid Interface Sci. 2011, 358, 604–610. [Google Scholar] [CrossRef]
- Shen, Q.; Nylund, J.; Rosenholm, J.B. Estimation of the surface energy and acid-base properties of wood by means of wetting method. Holzforschung 1998, 52, 521–529. [Google Scholar] [CrossRef]
- Li, W.; Wang, C.; Zhang, Y.; Jia, C.; Gao, C.; Jin, J. The Influence of Hot Compression on the Surface Characteristics of Poplar Veneer. BioResources 2014, 9, 2808–2823. [Google Scholar] [CrossRef][Green Version]
- Ho, Y.; Maloney, L.T.; Landy, M.S. The effect of viewpoint on perceived visual roughness. J. Vis. 2007, 7, 1. [Google Scholar] [CrossRef] [PubMed]
- Wan, T.; Stylios, G. Effects of coating process on the surface roughness of coated fabrics. J. Text. Inst. 2017, 108, 712–719. [Google Scholar] [CrossRef]
- Abrahão, C.P. Estimation for Some Properties of the Wood of Eucalyptus urophylla by Spectrometry. Ph.D. Thesis, Federal University of Viçosa, Viçosa, Brazil, 2005; p. 182. [Google Scholar]
- Kucera, L.; Katuscak, S. Das Phenomen Holzfarbe. In Proceedings of the Holz-Farbe-Gestaltung, 24 Fortsbildungkurse der Schweizerishen Arbeits-gemeinschaft für Holzforschung (SAH) in Weinfelden, Zürich, Switzerland, 4–5 November 1992; pp. 43–52. [Google Scholar]
- Masuda, M. Why human loves wood grain figure? In Extraction of vision-physical characteristics deeply related to impression. In Proceedings of the ICWSF Conference, Ljubljana, Slovenia, 5–7 September 2001; pp. 11–23. [Google Scholar]
Disclaimer/Publisher’s Note: The statements, opinions and data contained in all publications are solely those of the individual author(s) and contributor(s) and not of MDPI and/or the editor(s). MDPI and/or the editor(s) disclaim responsibility for any injury to people or property resulting from any ideas, methods, instructions or products referred to in the content. |
© 2025 by the authors. Licensee MDPI, Basel, Switzerland. This article is an open access article distributed under the terms and conditions of the Creative Commons Attribution (CC BY) license (https://creativecommons.org/licenses/by/4.0/).