Article

Electric and Thermal Performance Evaluation of a Serpentine-Pipe PVT Solar Collector

1
School of Mechanical and Electrical Engineering, Guangdong University of Science and Technology, Dongguan 523083, China
2
School of Energy Science and Engineering, Central South University, Changsha 410083, China
3
Department of Electrical and Computer Engineering, University of Macau, Macau 999078, China
*
Author to whom correspondence should be addressed.
Coatings 2025, 15(10), 1202; https://doi.org/10.3390/coatings15101202
Submission received: 17 September 2025 / Revised: 9 October 2025 / Accepted: 10 October 2025 / Published: 12 October 2025
(This article belongs to the Special Issue Thin Layers for Applications in Photovoltaic Solar Cells)

Abstract

The promotion and application of a solar photovoltaic thermal (PVT) collector is increasingly favored. In this paper, a solar PVT collector with a serpentine pipe has been investigated by using the double iteration strategy. The simulation results are in good agreement with the experimental data. The effects of ambient temperature, solar irradiance, distance between pipes, pipe diameter and mass flow rate on the thermal efficiency and photoelectric conversion efficiency (PCE) are discussed. Specifically, the results show that with an increase in the ambient temperature, the thermal efficiency of the collectors increases and the PCE decreases. By contrast, as the inlet water temperature decreases, the heat dissipation capacity is enhanced, which in turn both improves its thermal efficiency and PCE. Furthermore, the reduction in the distance between pipes also helps to improve thermal efficiency. However, when the distance between pipes is reduced to 0.1 m, the reduction in the thermal efficiency is not significant. It is worth noting that there exists an optimal solution to the influence of the pipe diameter on the thermal performance of the collector. This implies that the large pipe diameter will reduce the thermal efficiency to some extent. In addition, as the mass flow rate increases, the thermal efficiency is improved, and the plate temperature and outlet water temperature decrease simultaneously, with a greater decrease in outlet water temperature.

1. Introduction

With the increasing demand for energy and the decreasing reserves of fossil fuels, renewable energy sources such as solar energy, wind energy, geothermal energy, and biomass have gained increasing applications and research attention [1,2]. In this regard, energy-related challenges and environmental issues have become the most important crises in human society. Consequently, the vigorous development of renewable energy has become a global hotspot in recent years [3,4,5]. Among them, solar energy is widely recognized as the most important and sustainable renewable energy source [6,7,8,9].
The existing literature has reported that fully utilizing 1% of the solar energy irradiating the Earth’s surface, with a reasonable conversion efficiency, could address the global energy supply shortage [10,11]. Motivated by this, solar photovoltaic power generation technologies are widely adopted as the most convenient, economical, and sustainable way to utilize solar energy [12,13]. In recent years, the photoelectric conversion efficiency (PCE) of the mass production crystalline silicon solar cells has exceeded 28% [14,15]. Moreover, photovoltaic (PV) modules, the core components of PV power generation systems, have been increasingly enlarged in size and enhanced in power generation capacity. Concurrently, the cost of PV power plants has been continuously decreasing, while the proportion of distributed generation has been steadily rising. These advancements collectively endow PV power plants with greater advantages [16,17,18].
However, solar irradiation causes an increase in the temperature of crystalline silicon PV modules. Under prolonged intense radiation, the temperatures of PV modules can even exceed 80 °C. Specifically, for every 1 °C increase in the temperature of crystalline silicon solar cells, their PCE decreases by 0.4% [19]. Consequently, the PV power output is not at its maximum when solar irradiance is at its peak. This phenomenon occurs primarily because the PCE of PV modules can decrease by approximately 30% due to elevated temperatures. Therefore, the research on PVT solar collectors has become a primary approach to mitigate the adverse effects of temperature rise in solar modules. On one hand, it can reduce the temperature and enhance the power generation of PV cells, while on the other hand, it can fully utilize the collected radiant thermal energy to drive thermal load systems for work performance. Making full use of solar energy in different wavelength bands, thereby improving the comprehensive performance of PVT systems, has become an important approach to solar energy utilization. Consequently, photovoltaic and photothermal integration technologies will have broad prospects [20,21].
To tackle this problem, the PVT collector is developed to convert solar energy into both electrical and thermal energy, which was originally proposed by Wolf [22] in 1976. In general, the PVT collector generates electricity and heat at the same time, which is equivalent to saving roof area and reducing construction costs. It is well known that the PV cell’s PCE is reduced with increasing module temperature, and the PVT component that has additional cooling solar cells can take away the heat and collect it to supply domestic hot water. These studies and optimization methods have been carried out by many research groups. Specifically, a well-known model is the one-dimensional mathematical model of flat water-cooled PVT collectors, namely the modified H-W model, based on the classical Hottle–Whillier (H-W) model of solar collectors [23]. This modified H-W model is still applied frequently in many studies [24,25]. Moreover, a dynamic model of sheet and pipe PVT collector is also presented to evaluate the generation of electrical energy along with the provision of domestic hot water from the thermal energy output [26,27].
With the development of computer science and heat and mass transfer theory, a variety of simulation software is utilized for the simulation of PVT collectors [24,25,26,27]. As presented in [24], a design of PVT systems to feed the domestic heat water requirements of multi-housing buildings is explained in an experiment and TRNSYS. In [25], a novel building-integrated photovoltaic thermal (BIPVT) system is studied by computational fluid dynamics (CFD) techniques. In addition, Nahar et al. [27] propose a 3D COMSOL (v5.6.) simulation solution for studying the influence of inlet flow velocity on PVT performance. In references [24,26,28,29], they also perform one-dimensional simulation with the H-W model. However, the H-W model is only applicable to the sheet and parallel tube type PVT component, resulting in an inaccuracy on the serpentine-pipe-type PVT components.
To fill the aforementioned research gaps, we propose a new modified H-W model of a serpentine pipe. The main contributions of this study are as follows:
(1)
A mathematical modeling method for serpentine-pipe photovoltaic-thermal (PVT) modules is established. Based on the modified H-W model, a heat transfer factor function is proposed.
(2)
A new double iterative strategy is proposed, which enables gradual convergent calculation of glass cover temperature and mean panel temperature. The simulation results are highly consistent with the published experimental data, effectively improving the reliability and accuracy of thermal efficiency and PCE simulation for serpentine-pipe-PVT modules.
(3)
The effects of key parameters including ambient temperature, inlet water temperature, solar irradiance, pipe spacing, mass flow rate on PVT module thermal efficiency and PCE are systematically investigated.

2. Mathematical Model

A geometric schematic of the water-cooled flat-plate PVT collector is illustrated in Figure 1. The glass cover serves to minimize forced convection heat transfer between the PV laminate and the ambient air. Beneath the back plate, an absorber layer—typically made of aluminum or copper—is bonded using adhesive to extract excess heat from the PV laminate. The serpentine pipe is generally welded or adhered to the rear surface of the absorber. Water circulating through the pipe removes the accumulated heat for practical use, while the bottom of the module is insulated with thermal insulation material to reduce downward heat loss.
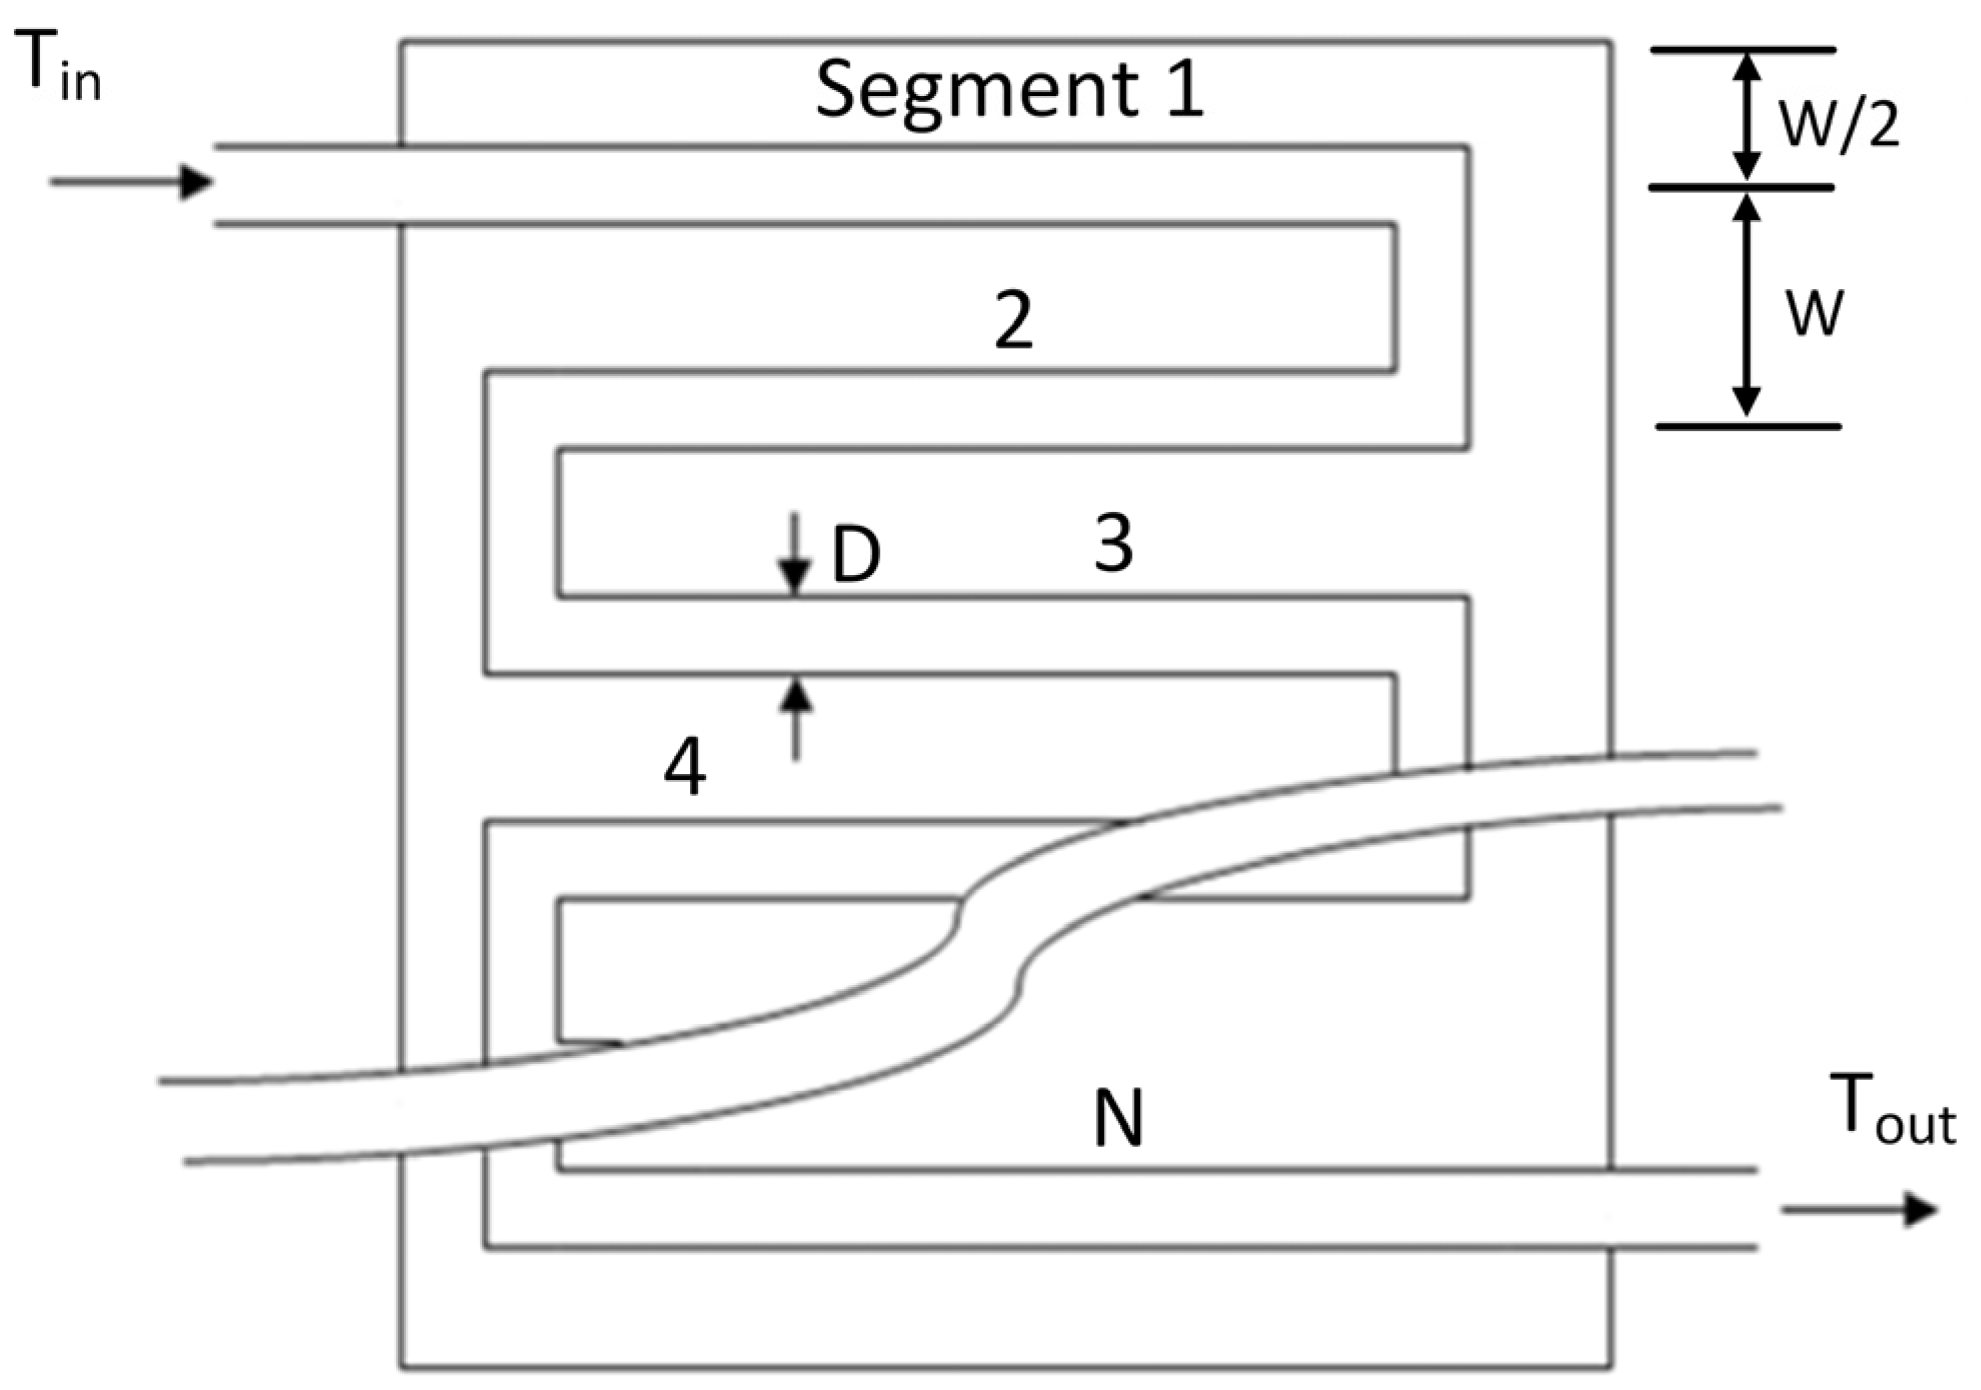
The serpentine absorber configuration offers several advantages. It eliminates the need for additional header manifolds and corresponding welding, thereby reducing potential leakage points. The secondary flow induced at the pipe bends enhances heat transfer, leading to improved thermal efficiency. Moreover, the structure is simple to manufacture, making it suitable for large-scale production. A detailed view of the serpentine pipe layout is provided in Figure 2.
To facilitate the development of the mathematical model while preserving the essential physical characteristics, the following simplifying assumptions are adopted: (1) steady-state conditions are maintained: the mass flow rate, fluid inlet temperature, collector temperatures, solar irradiance, and ambient temperature remain constant. (2) The temperature difference across the thickness of the glass cover is neglected. (3) The temperature gradient through the tube wall thickness and the thermal effect of the hydraulic entrance region are disregarded. (4) The pipe and sheet are in good contact which means C bond = . (5) The effects of dust accumulation, dirt, and shading on the collector are considered negligible.

2.1. Key Parameters of Serpentine-Tube-PVT Components

To some extent, PVT modules can also be seen as solar collectors. PV laminate is equivalent to the heat absorption plate of the general collector. The results of the computer experiments will be compared with the serpentine-pipe-PVT collector experiment performed by de Vries [30]. The detailed physical parameters are shown in Table 1. The key to the problem is to solve the heat removal factor F R and the overall loss factor U L , and finally the calculation of the useful energy Q u and thermal efficiency η are given by the following equations:
Q u = A c F R [ ( τ α ) n G U L ( T i n T a ) ]
η t = Q u A c G
The effect of the PV panel temperature on the PCE [31,32,33] has been investigated. The PCE is characterized as follows [32]:
η e l = η e l , r e f [ 1 β ( T p m T r e f ) ]
where η e l , r e f is the reference cell efficiency at the reference operating temperature, T r e f , and β is the temperature coefficient.

2.1.1. Heat Remove Factor F R

Abdel-Khalik [34] analytically solved the case of a single bend, and Zhang and Lavan [35] obtained solutions for three and four bends. For a single bend, Zhang and Lavan show that the solution for F R is given by Equation (4) in terms of three dimensionless parameters F 1 , F 2 , and F 3 .
F R = F 1 F 3 F 5 [ 2 F 4 F 6 exp ( 1 F 2 2 F 3 ) + F 5 1 ]
The parameter F 1 through F 6 is given by
F 1 = κ U L W κ R ( 1 + γ ) 2 1 γ κ R [ κ R ( 1 + γ ) 1 ] 2 ( κ R ) 2
F 2 = 1 κ R ( 1 + γ ) 2 1 γ κ R
F 3 = m ˙ C p F 1 U L A c
F 4 = ( 1 F 2 2 F 2 2 ) 1 / 2
F 5 = 1 F 2 + F 4 1
F 6 = 1 1 F 2 + F 4
κ = ( k δ U L ) 1 / 2 sinh [ ( W D ) ( U L / k δ ) 1 / 2 ]
γ = 2 cosh [ ( W D ) ( U L k δ ) 1 / 2 ] D U L κ
R = 1 C b o n d + 1 π D i h f i
where h f i is given by following equations [32]:
N u f = h f i D i k
N u f = 4.364 ; Re 2300
N u f = ( f / 8 ) ( Re 1000 ) Pr 1 + 12.7 f / 8 ( Pr 2 / 3 1 ) ; Re = 2300 ~ 10 6
f = ( 1.82 lg Re 1.64 ) 2
Obviously, the parameters F 4 , F 5 , and F 6 are functions of F 2 only. For a sheet and parallel tube PVT collector, Florschuetz et al. [23] have conducted extensive studies to understand these dependencies.
For the serpentine-pipe-type PVT collector, we designed and constructed a new modified H-W model: (1) heat transport takes place via the absorber to the tube but also via the PV laminate, especially through the photovoltaic cells. This can be considered by including cell thickness and conductivity in Equations (11) and (12), which means replacing all values of with the value of k p v δ p v + k a b s δ a b s . There is an extra heat resistance between the PV laminate and the absorber plate. This results in an extra term 1 w h c a in Equation (13).

2.1.2. Overall Loss Coefficient U L

U L = U t + U b + U e
The collector overall loss coefficient UL is the sum of the top, bottom, and edge loss coefficients. Here, the U L , U b , and U e are constant. And the U t is a function, which is related to the following factors:
(1)
Convection heat transfer between top cover and ambient air. Based on the references [36,37], the formula is as follows:
h w = 1.15 ( 3 v + 2.8 )
(2)
Radiation heat transfer between top cover and sky.
h r c a = ε g σ ( T g 2 + T s 2 ) ( T g + T s )
The T s is determined by the following equation [32]:
T s = 0.0552 T a 1.5
(3)
Convection heat transfer between top cover and PV laminate.
The empirical formula of h p g is summarized as follows by Hollands [38]:
N u = 1 + 1.44 [ 1 1708 ( sin 1.8 θ ) 1.6 R a cos θ ] [ 1 1708 R a cos θ ] + + [ ( R a cos θ 5830 ) 1 / 3 1 ] +
h c p g = N u k a i r L
The function indicates that it becomes zero if the quantity between the brackets is negative.
(4)
Radiation heat transfer between the top cover and PV laminate.
h r p c = σ ( T p 2 + T g 2 ) [ T p + T g 1 ε p + 1 ε g 1 ]
Above all,
U t = [ 1 h c p g + h r p g + 1 h w + h r g a ] 1

2.2. Iteration Method

In this paper, a new double iterative strategy is proposed. Firstly, we assume the value of T p m and T g to obtain the physical properties. Then, the value of U t is calculated based on Equation (25). Finally, according to the following equation, a new temperature T g n e w is obtained for the glass cover.
T g n e w = T p m U t [ T p m T a h c p g + h r p g ]
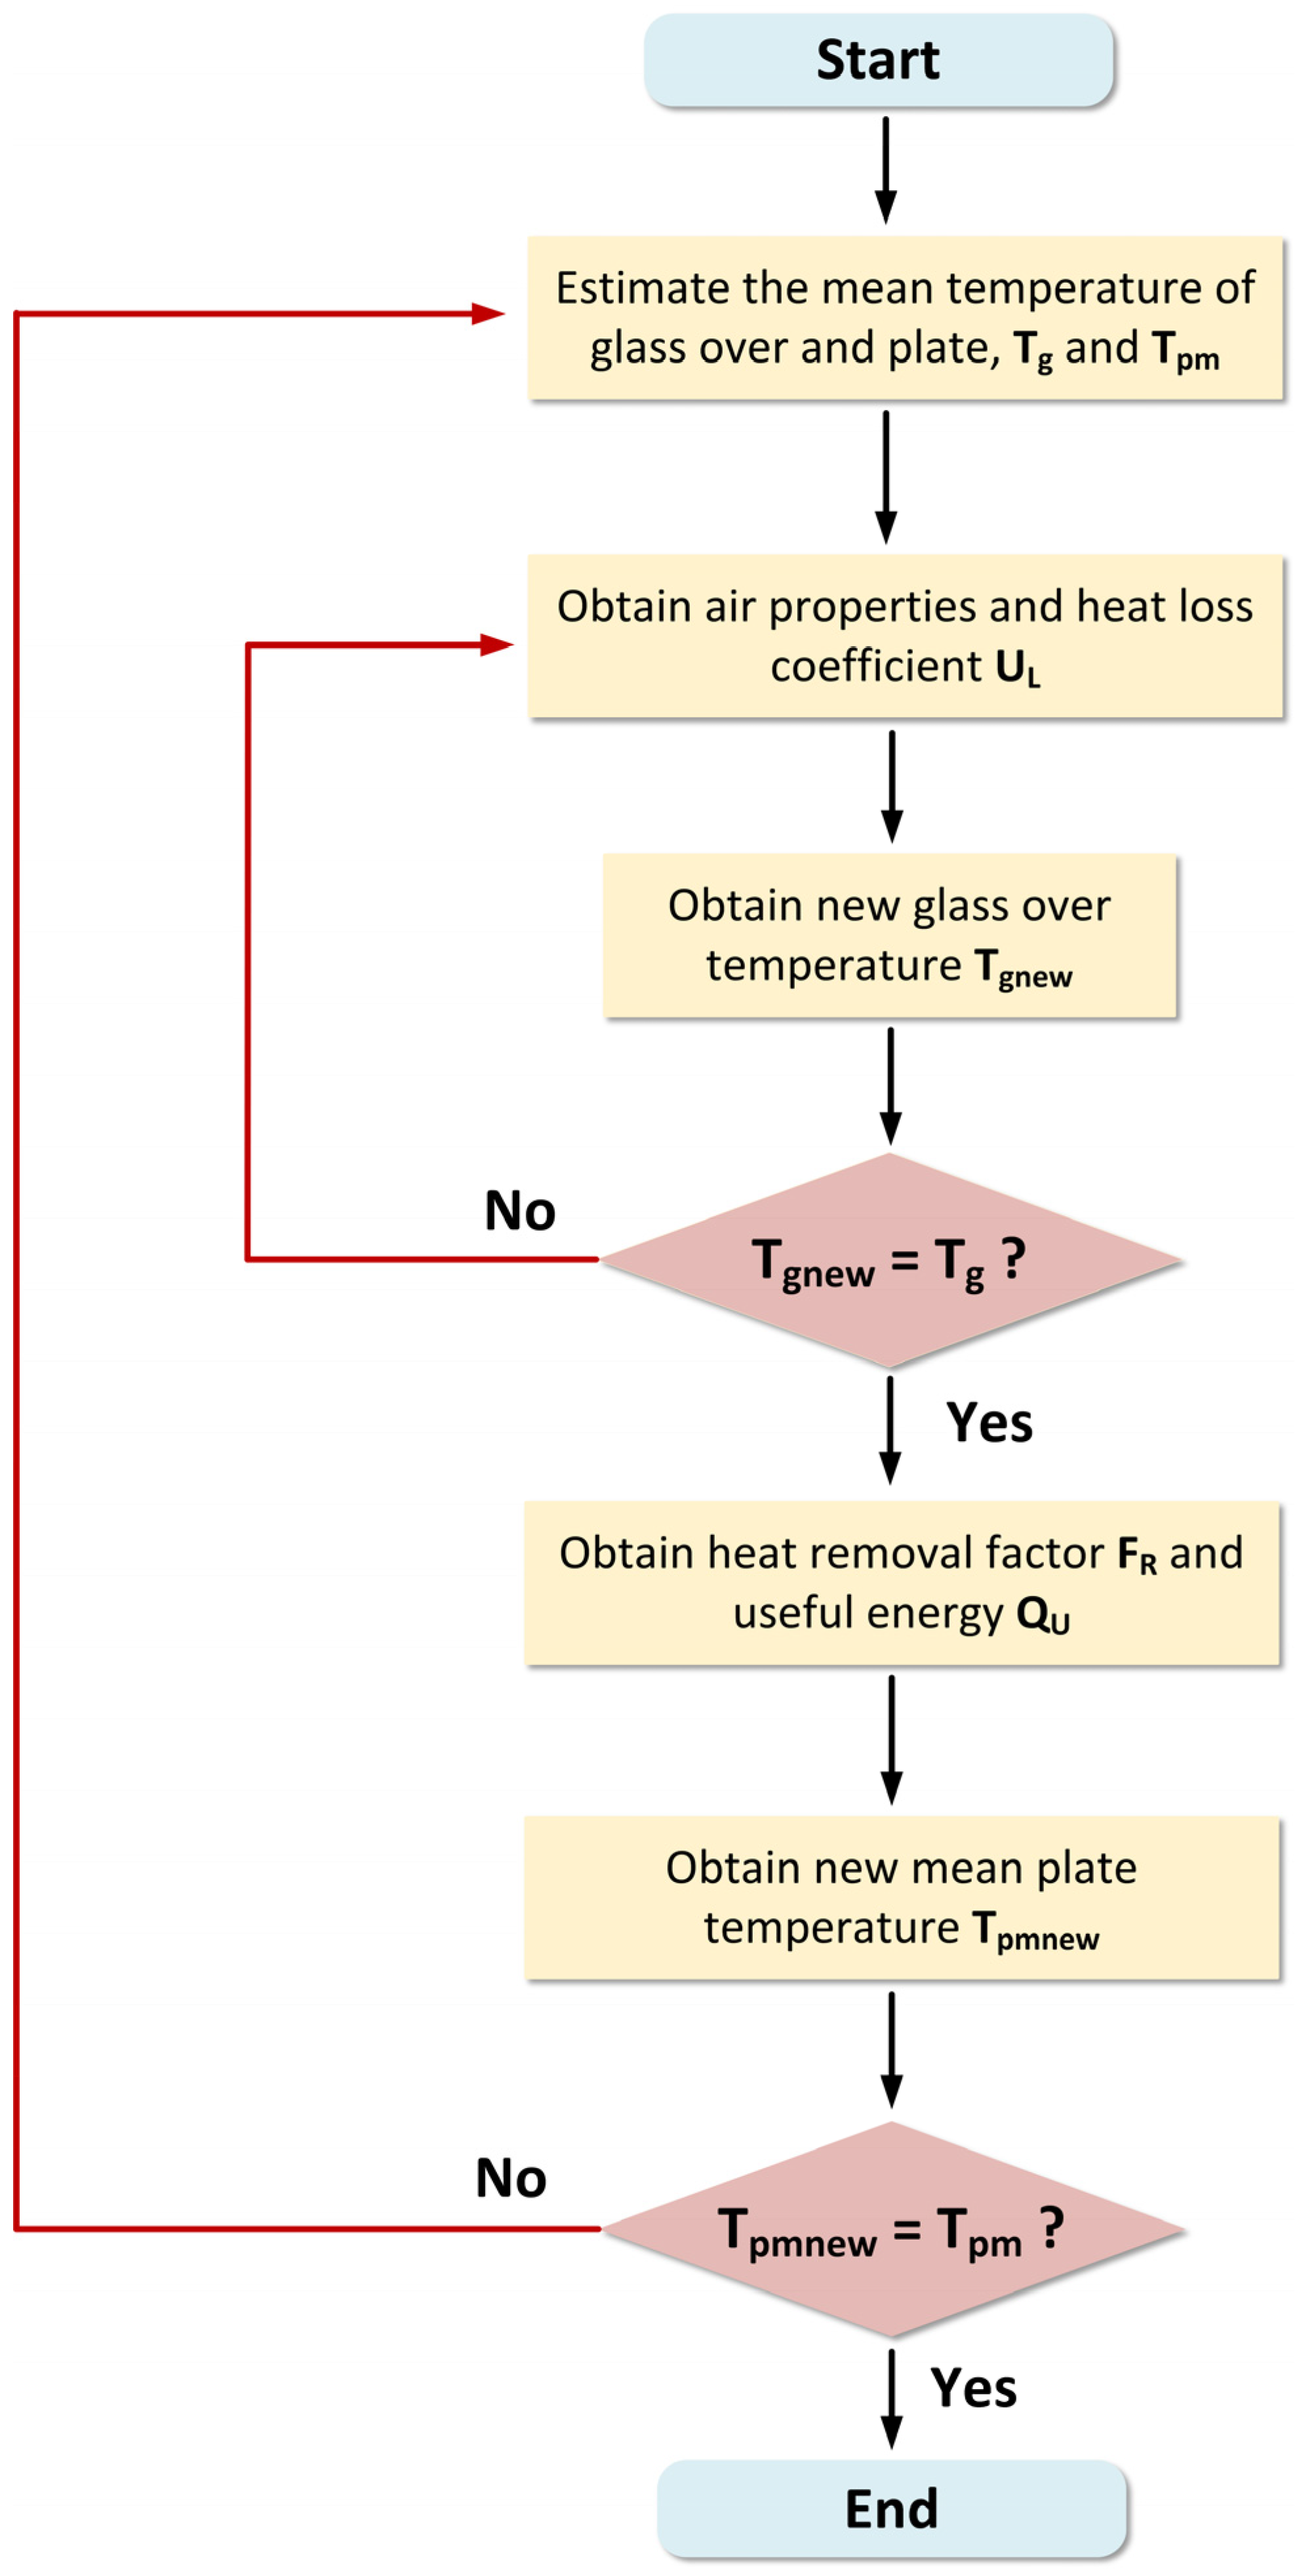
This process is iteratively repeated until the temperature of the glass cover exhibits no significant variation between consecutive iterations, and this convergence state is defined as the first iteration. Based on the above values, Q u can be finally obtained by Equation (27). Subsequently, a new mean plate temperature is determined by Equation (28). The updated mean plate temperature is then substituted back into the iterative process, and the iteration is continued until the mean plate temperature stabilizes, which corresponds to the second iteration. Figure 3 graphically presents the simulation analysis process.
Q u = m ˙ C p T d i f f
T p m n e w = T i n + T d i f f 2 + Q u A c h c a

3. Results and Discussion

3.1. Verification

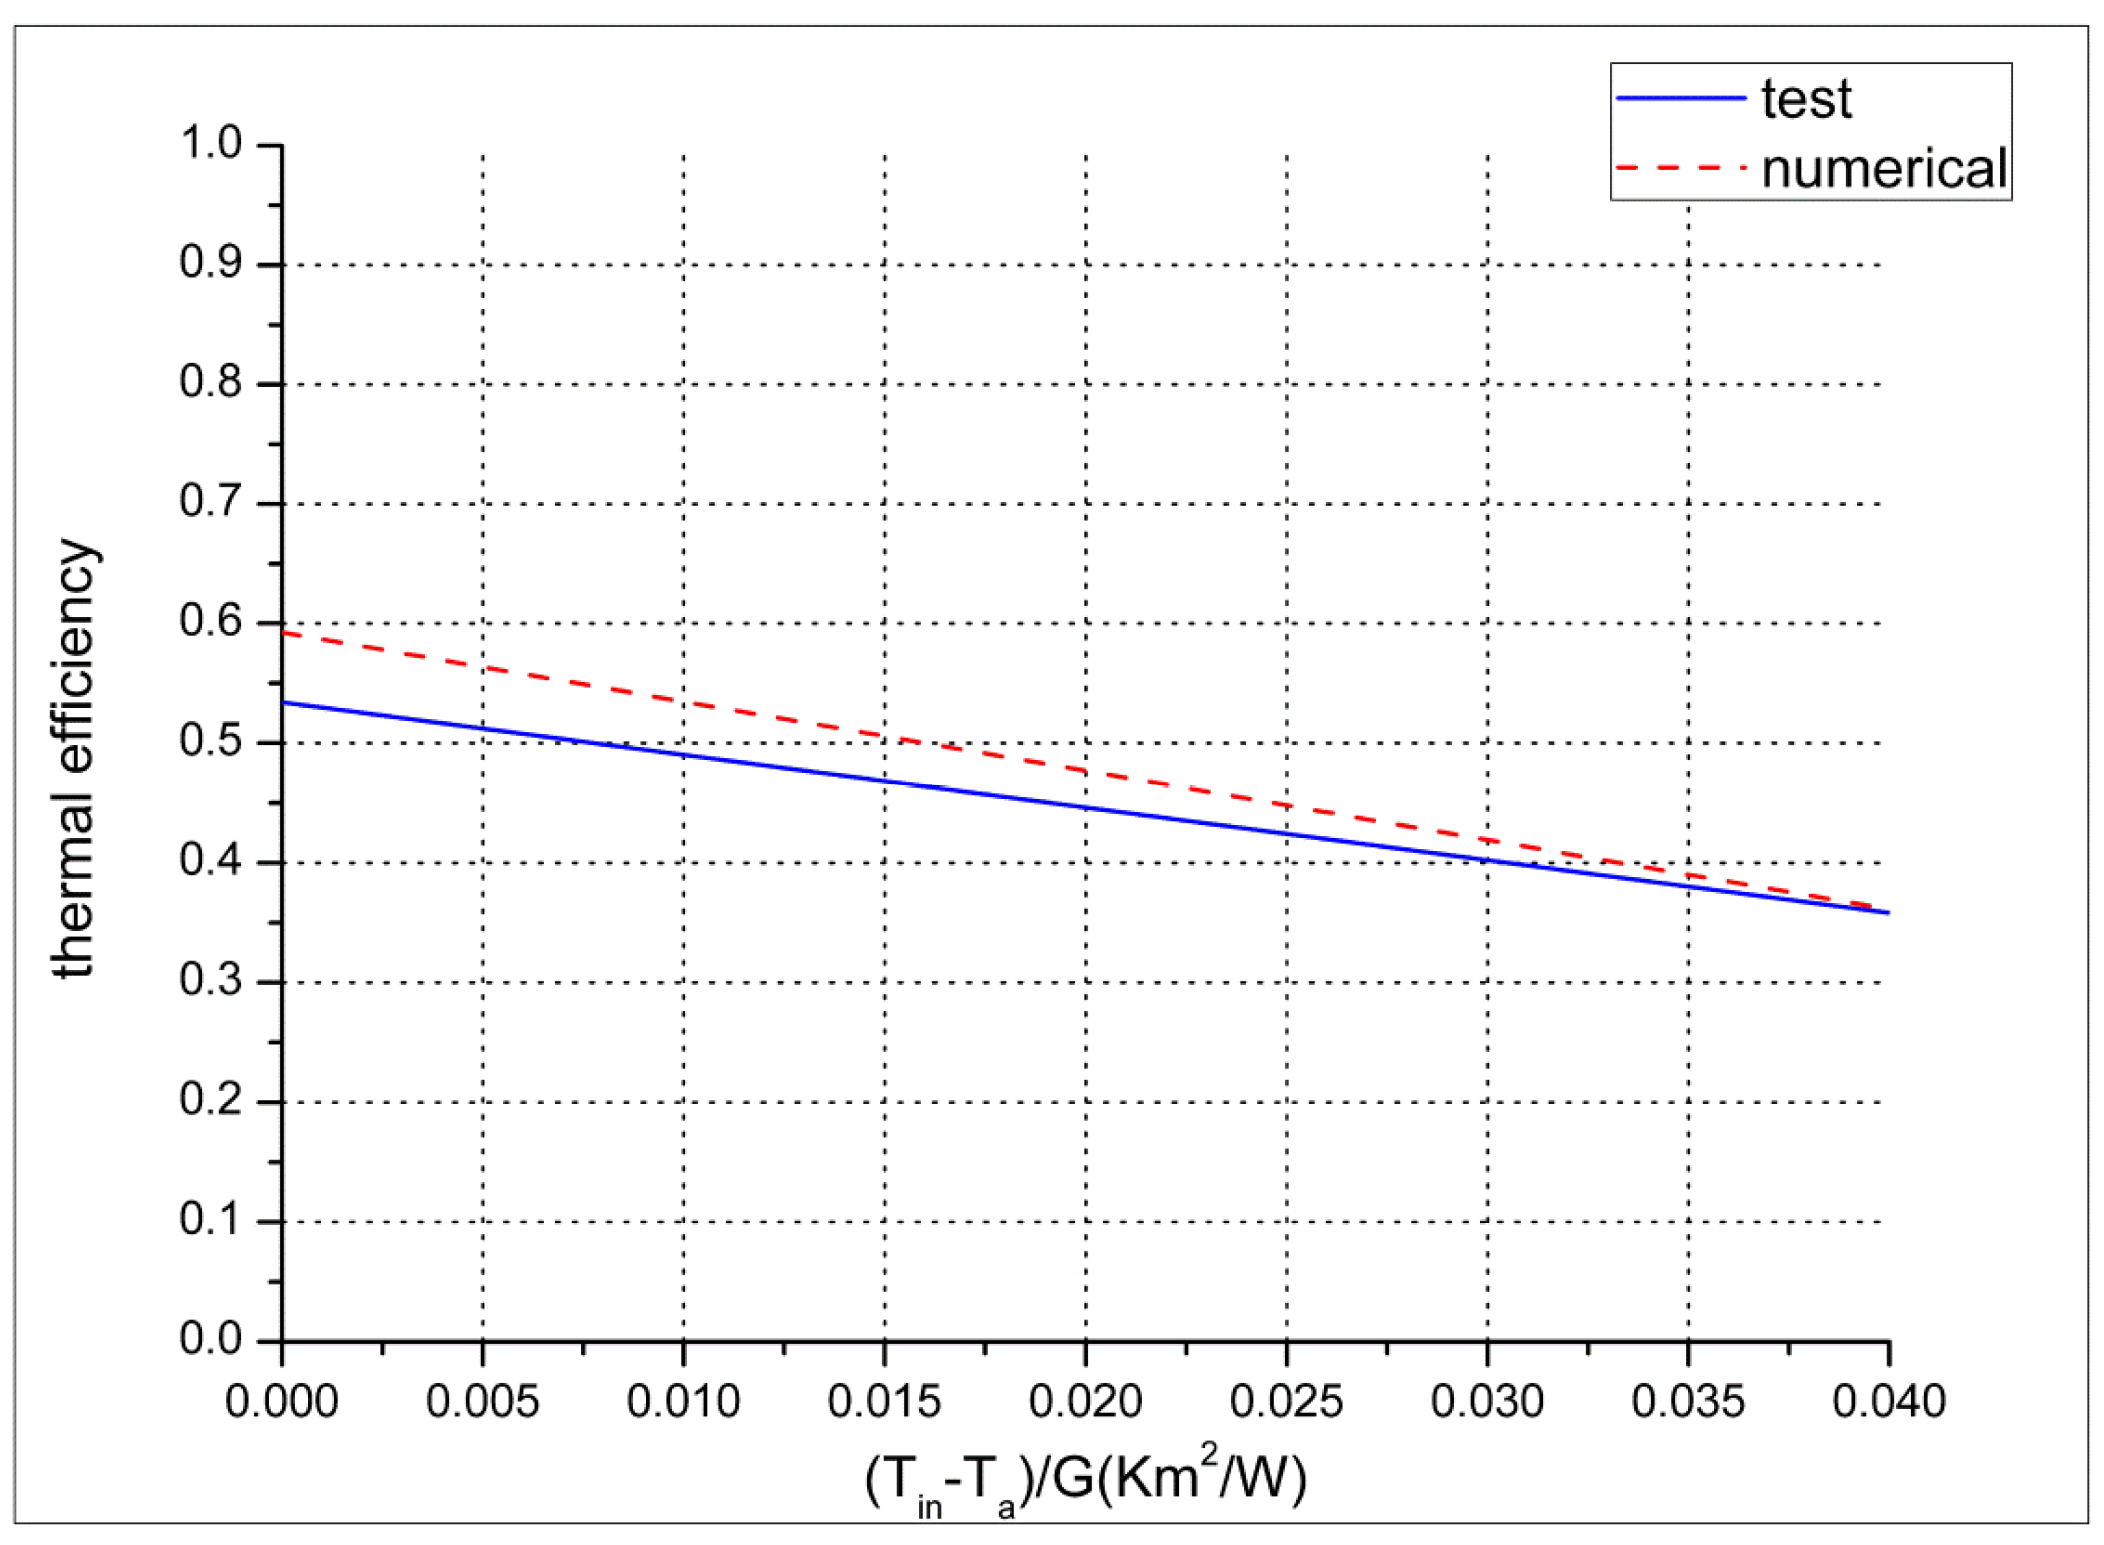
The thermal efficiency of the proposed model is compared with the experimental data of a water-cooled sheet and serpentine-pipe-type PVT collector conducted by de Vries [30]. As depicted in Figure 4, the simulation results demonstrate good agreement with the experimental measurements. The model captures the general trend of thermal efficiency well, despite a systematic yet minor overestimation compared to the experimental data. This discrepancy arises for two main reasons: (1) not all losses in actual circumstances can be accounted for in the modeling, leading to larger results than the experimental data; (2) the measured thermal efficiency of the test has an 8% inaccuracy relative [30].

3.2. Discussion

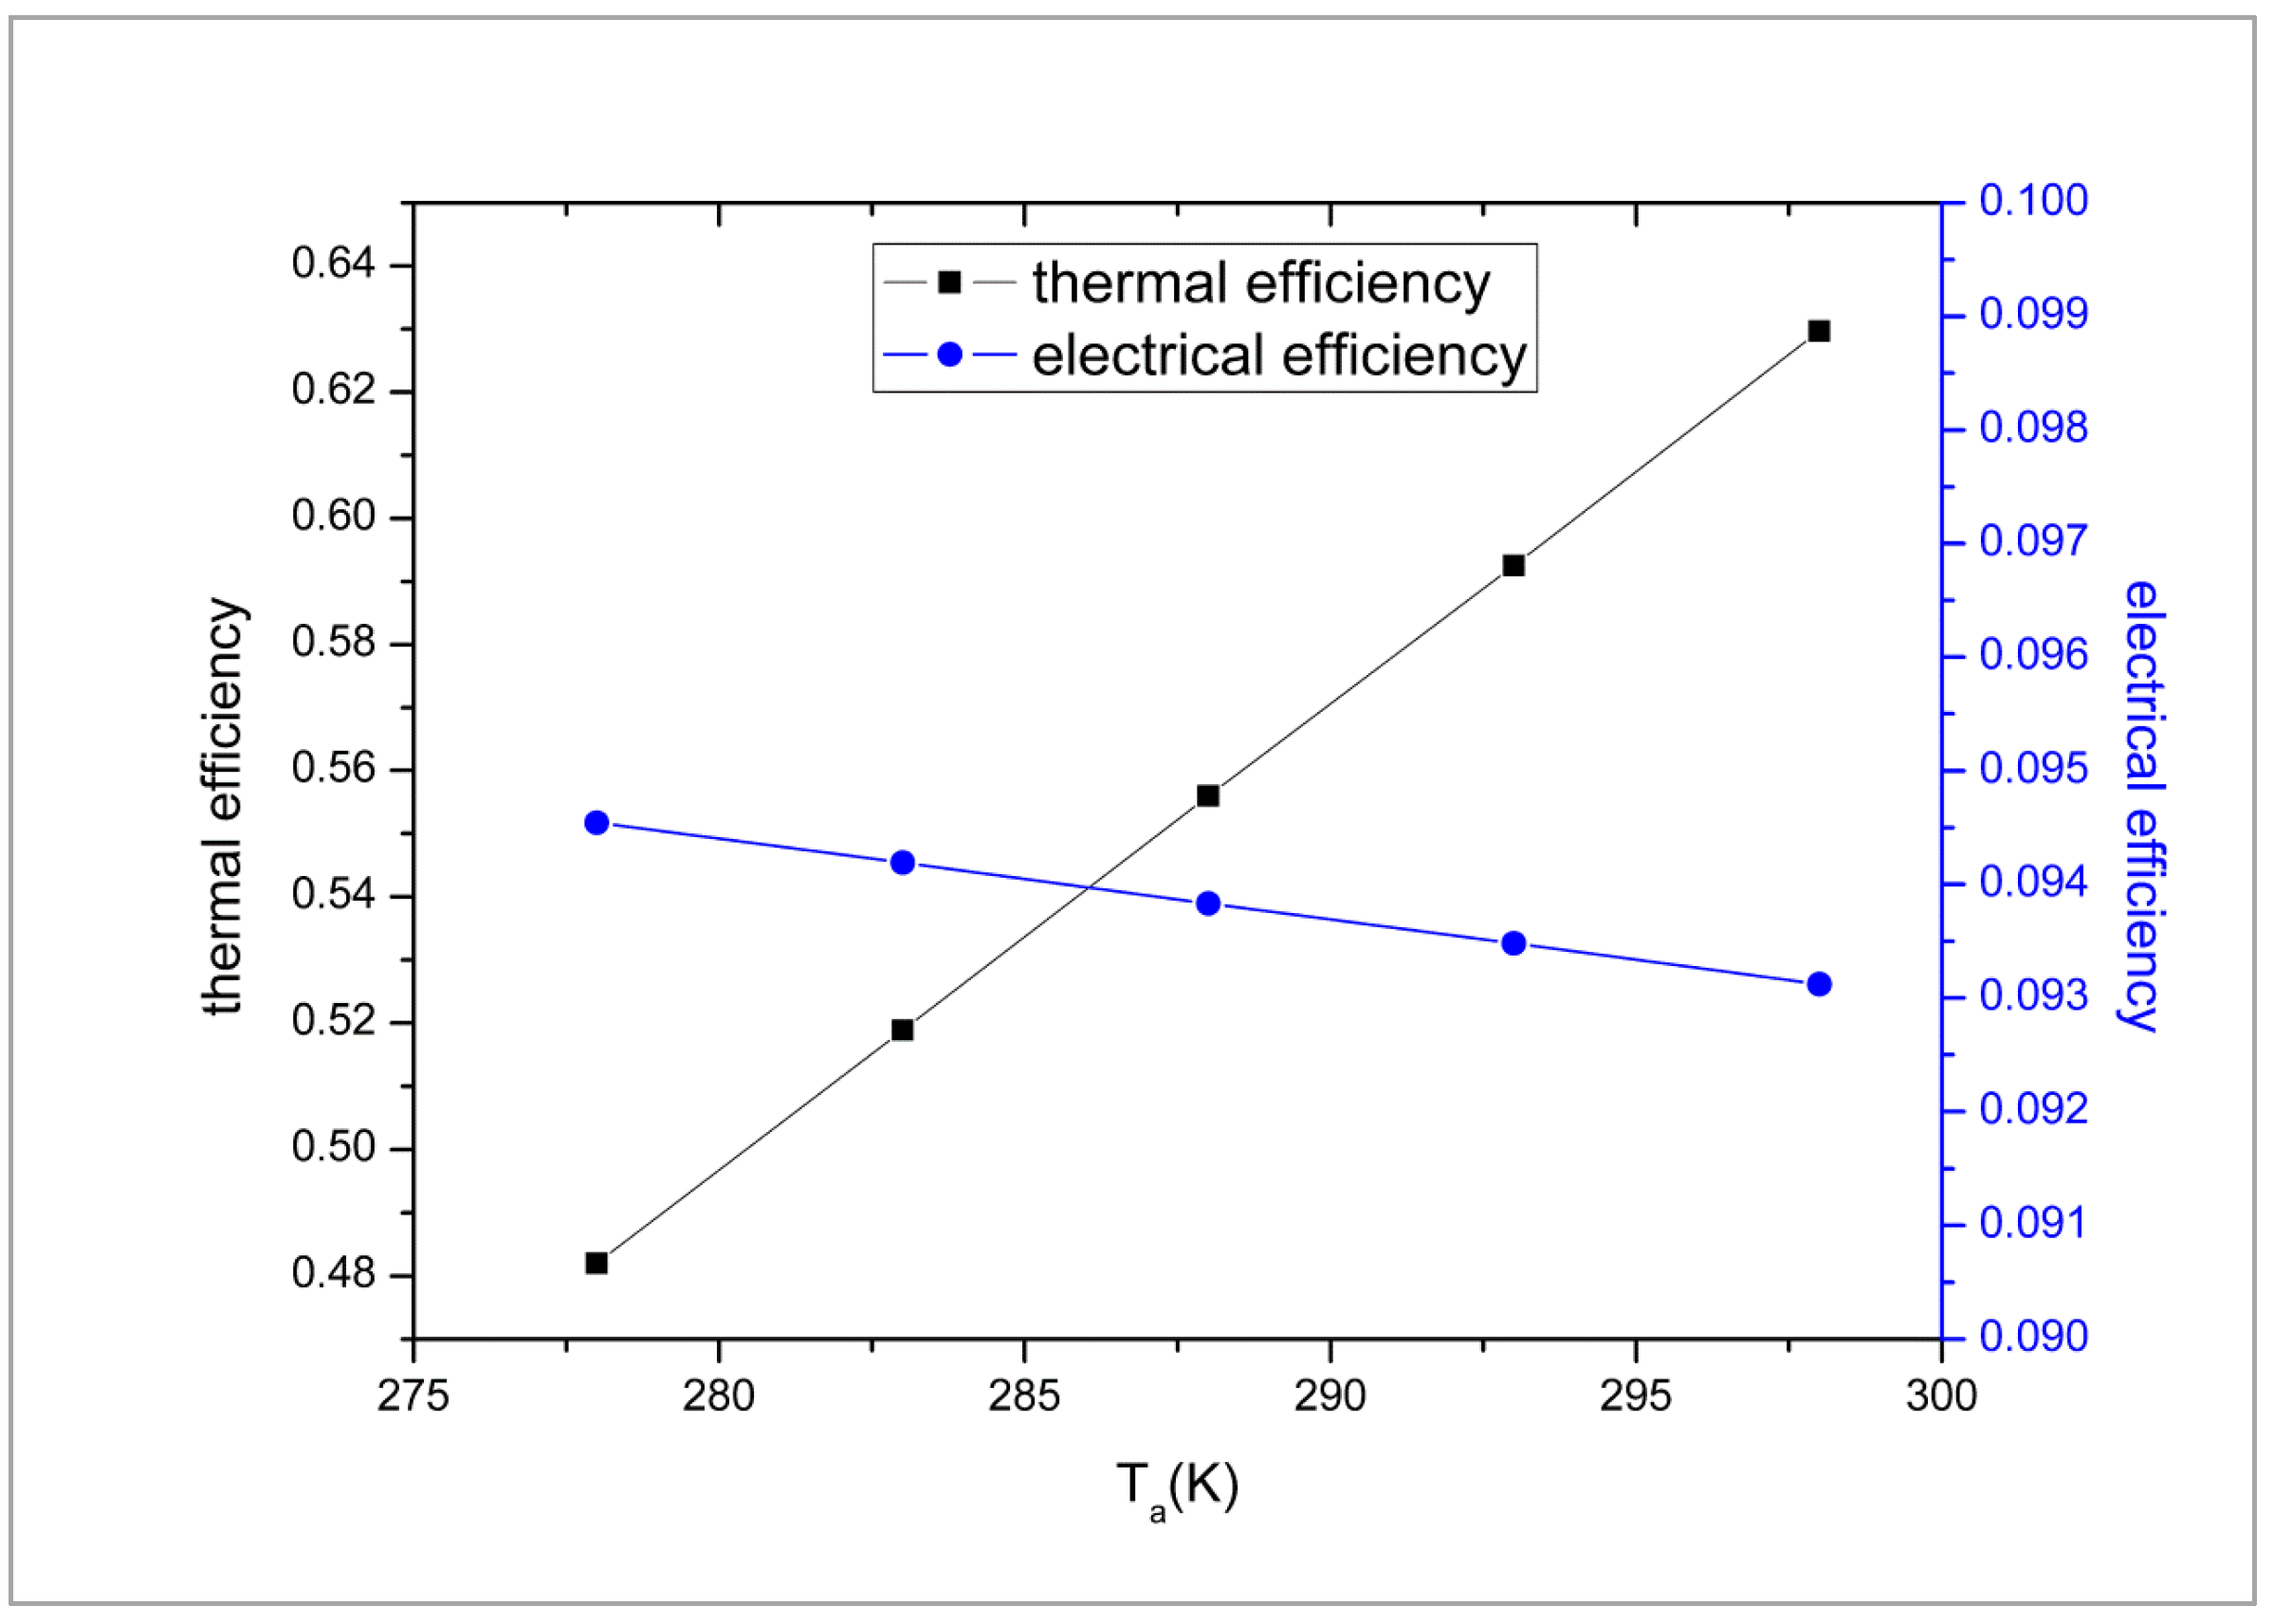
Figure 5 shows the variation in thermal efficiency and PCE with the ambient temperature. Thermal efficiency increases with an increase in ambient temperature. When the ambient temperature increases by 20 K, the thermal efficiency increases by 15%, while the PCE decreases due to the increase in the plate temperature.
Figure 6 reports the variation in thermal efficiency and PCE with the inlet water temperature. The increase in inlet temperature, the thermal efficiency and PCE decrease in different degrees. While the inlet temperature increases by 15 K, the thermal efficiency and PCE are reduced by 11% and 0.6%, respectively. In actual production activities, the working fluid inlet temperature should be kept as low as possible.
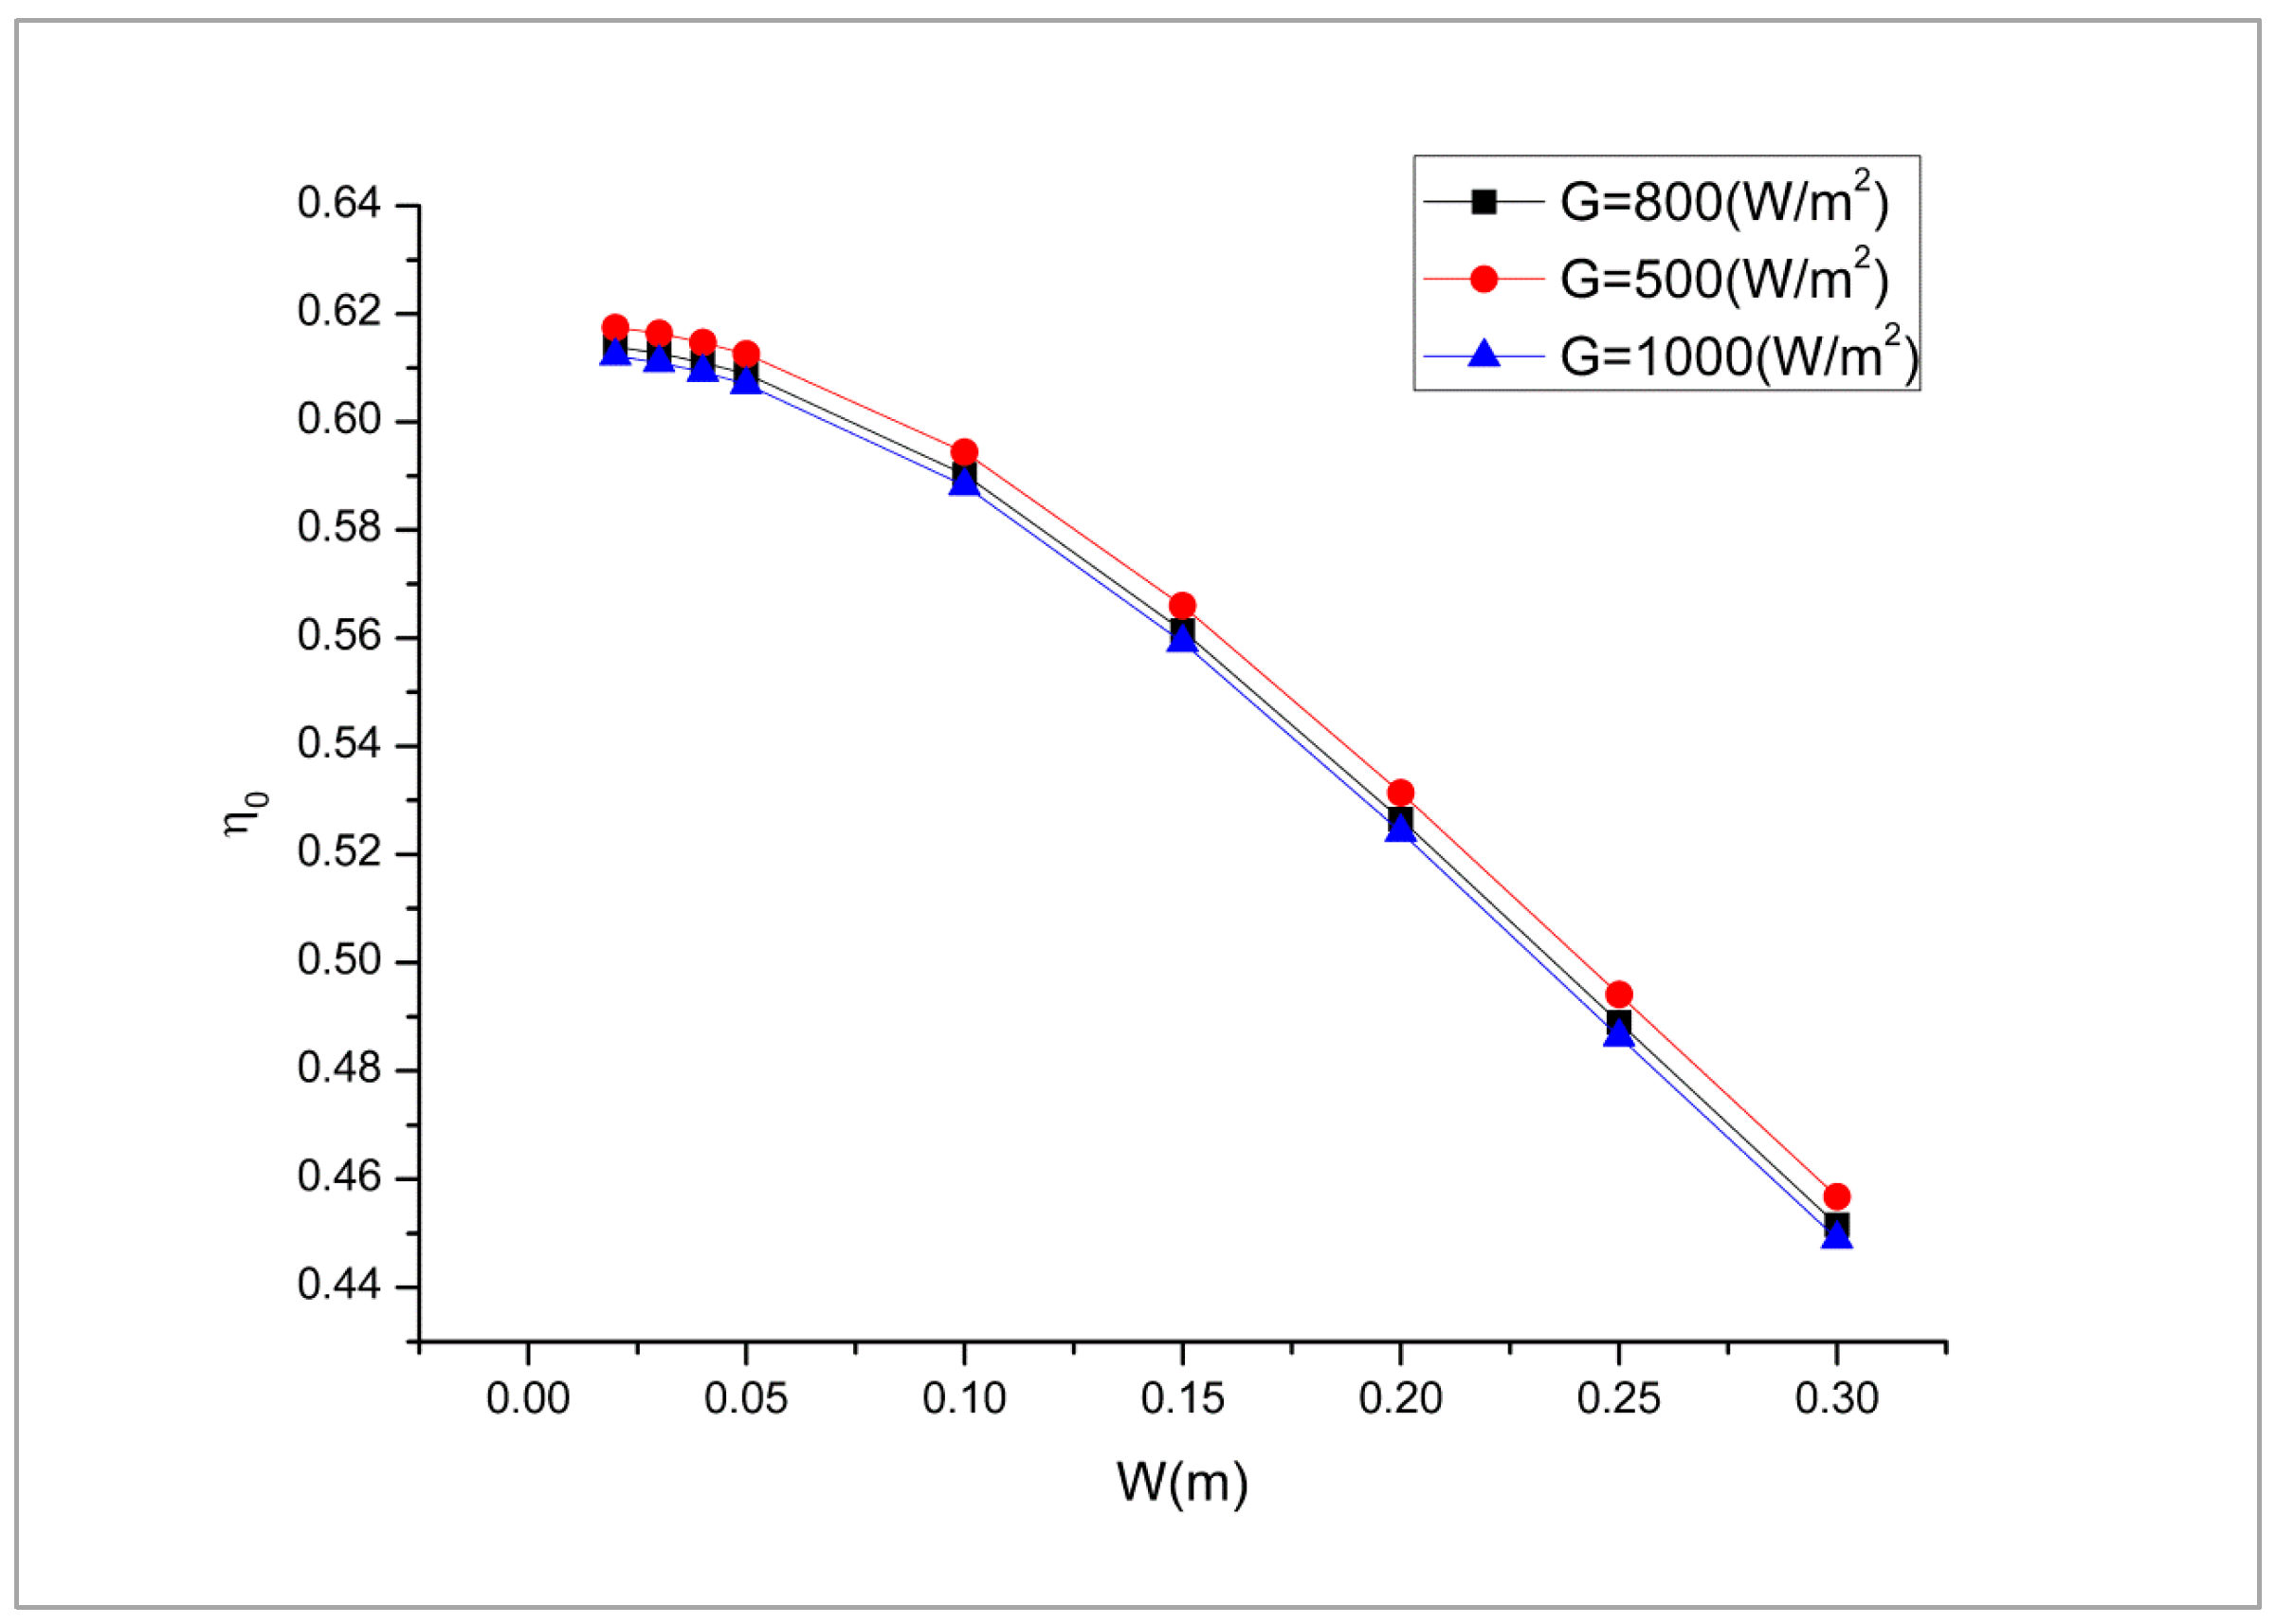
Figure 7 illustrates the variation in zero-reduced temperature efficiency with tube spacing in different solar irradiance conditions. Thermal efficiency has a slight decrease as solar irradiance increases. Additionally, the smaller the tube spacing, the higher the thermal efficiency. When the tube spacing changes from 0.3 m to 0.1 m, thermal efficiency increases by 15%. However, further reducing the tube spacing has a negligible effect on efficiency. From the viewpoint of actual production, this adjustment also increases manufacturing difficulty and pipe consumption. It should be noted that this conclusion is consistent with that reported for traditional solar collectors.
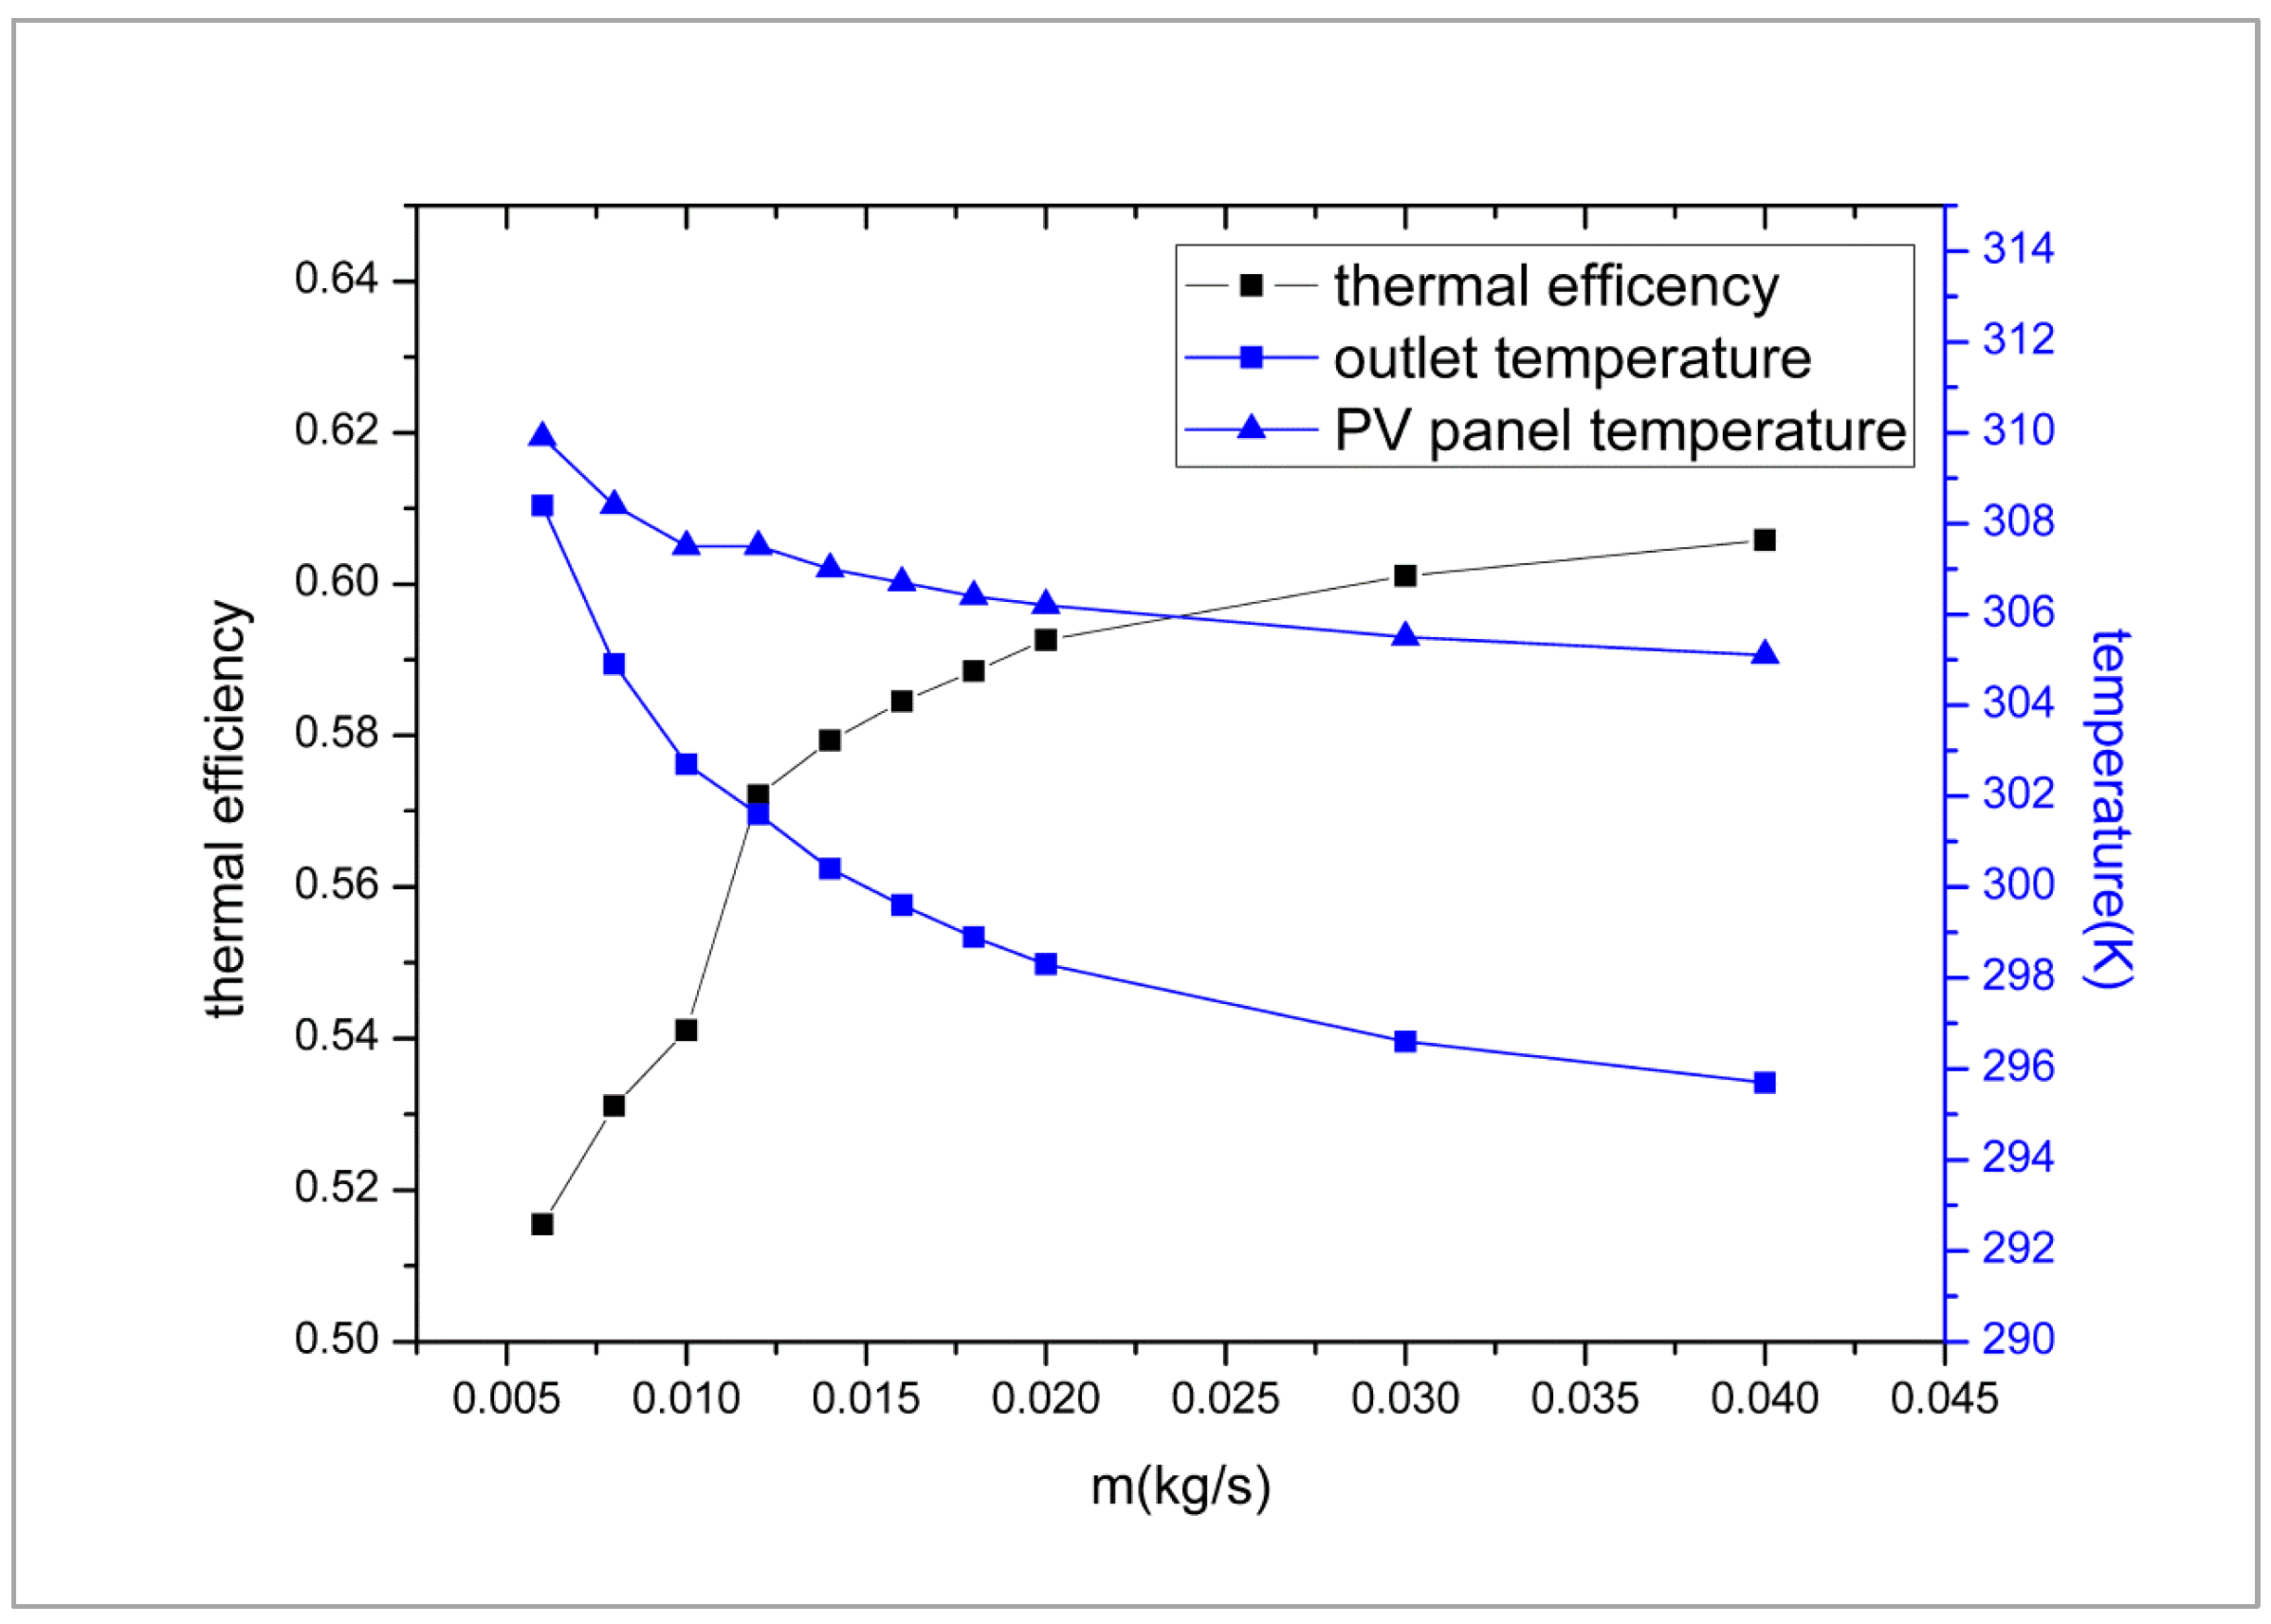
Different studies have different illustrations over convection heat transfer coefficient in the pipes. For instance, references [28,29] directly give its value of 300 W/(m2·K) without any explanation. In contrast, references [39,40] do not give the value or detailed method. In fact, for the same tube diameter, the different mass flow corresponds to different tube heat transfer coefficients. Figure 8 depicted the effect of different mass flow rates on outlet temperature, PV panel temperature and thermal efficiency according to Equations (14)–(17). According to the structure of PVT in this paper, the transition point from laminar to turbulence is around 0.012 kg/s. As shown in Figure 8, the mass flow rate increases from 0.006 kg/s to 0.05 kg/s, the thermal efficiency is increased by 9%, the PV panel temperature is reduced by 4.8 K and the outlet temperature is reduced by 12.7 K. Low mass flow rate will lead to the large temperature gradient of the entire collector and thus affect the PCE; a high mass flow rate will greatly increase the energy consumption of the pump. Therefore, careful selection of a reasonable mass flow rate is critical for practical PVT system operations.
The derivations, analyses, and conclusions presented in this work are based on idealized conditions and steady-state assumptions (as specified in Section 2). In practice, however, PVT systems operate in dynamic atmospheric environments and are subject to time-varying solar irradiance, dust accumulation, partial shading, and localized hot spot effects and so on. These factors may significantly impact system performance and necessitate active mitigation strategies. For instance, periodic cleaning of the collector surface is essential to maintain optical efficiency, as dust deposition is a critical factor adversely affecting the photovoltaic performance of PVT modules [41,42]. Furthermore, the PV electrical output requires operation near the maximum power point (MPP). Fluctuating irradiance conditions impose stricter requirements on the maximum power point tracking (MPPT) controller, where only a fast-response MPPT system can ensure optimal energy harvesting. In large-scale PVT arrays, localized heating may lead to pronounced performance degradation and potential hot spots. To address these problems, additional electronic monitoring components are often integrated to detect anomalies and enable prompt intervention. In summary, the performance and operational stability of practical PVT systems can be negatively influenced by the aforementioned uncertain external factors. It is therefore crucial to incorporate robust design measures and continuously accumulate field experience to mitigate these effects.

4. Conclusions

In this paper, the modeling of the serpentine-pipe-PVT module is established. Based on the modified H-W model, the function of the heat transfer factor is proposed. The new double iterative strategy enabled the achievement of valid simulation results, which show good agreement with previously published experimental data. The effects of ambient temperature, inlet temperature, solar irradiance, pipe spacing and mass flow rate on thermal efficiency and PCE are specifically investigated.
From the simulation results, it could be found that when the ambient temperature increases by 20 K, the thermal efficiency rises by 15% while the PCE decreases by 0.1%; in contrast, a 15 K increase in inlet water temperature leads to an 11% reduction in thermal efficiency and a 0.6% decrease in PCE, respectively. Additionally, thermal efficiency decreases slightly as solar irradiance increases. When the pipe spacing is reduced from 0.3 m to 0.1 m, the thermal efficiency increases by 15%. On this basis, it is suggested to choose a pipe spacing to be 0.1 m to reduce the processing difficulty, save material, and improve the thermal efficiency. Moreover, when the mass flow rate increases from 0.006 kg/s to 0.05 kg/s, the thermal efficiency increases by 9%, the mean panel temperature decreases by 4.8 K, and the outlet temperature decreases by 12.7 K. Therefore, in practical production, an appropriate mass flow rate should be determined to minimize the module temperature gradient and reduce the energy consumption of the circulation system.

Author Contributions

Conceptualization, J.Z. (Jicheng Zhou); methodology, J.Z. (Jicheng Zhou), M.L. and H.K.; software, H.K.; validation, M.L.; formal analysis, H.K.; investigation, J.Z. (Jicheng Zhou); resources, J.Z. (Jicheng Zhou); data curation, J.Z. (Jianyong Zhan); writing—original draft preparation, M.L. and H.K.; writing—review and editing, J.Z. (Jicheng Zhou) and J.Z. (Jianyong Zhan); supervision, J.Z. (Jicheng Zhou); project administration, J.Z. (Jicheng Zhou); funding acquisition, J.Z. (Jicheng Zhou) All authors have read and agreed to the published version of the manuscript.

Funding

This work was supported by the Dongguan Science and Technology of Social Development Program (Grant no. 20231800940252) and the Natural Science Project of Guangdong University of Science and Technology (Grant no. GKY-2024KYZDK-4).

Institutional Review Board Statement

Not applicable.

Informed Consent Statement

Not applicable.

Data Availability Statement

Some or all data, models, or code that support the findings of this study are available from the corresponding author upon reasonable request.

Conflicts of Interest

The authors declare no conflicts of interest.

Abbreviations

The symbols and their meanings used in the manuscript are shown below:
Nomenclature
Asurface area (m2)
Cconductance (W·m−1·K−1)
Ddiameter (m)
Gsolar irradiation (W·m−2)
Hheat transfer coefficient (W·m−2·K−1)
Kthermal conductivity (W·m−1·K−1)
Ldistance between glass and plate (mm)
NuNusselt number
RaRayleigh number
Uheat-loss coefficient (W·m−2·K−1)
vwind speed (m·s−1)
Wtube space (m)
σthe Stefan–Boltzmann constant
ηefficiency
τtransmittance
Subscripts
Aambient
Absabsorber
Bback
Bondbond between absorbers and tubes
Ccollector
Cacell and adhesive
Gglass cover
Eedge
Greek
αabsorption factor
βsolar cell temperature coefficient (K−1)
δthickness (mm)
εemissivity
θtilt angle (degree)
ρdensity (kg·m−1)
Ininlet
Pplate
Refreference
Ssky
Rgaradiation between glass cover and ambient space
Cpgconvection between plate and glass cover
Rpgradiation between plate and glass cover

References

  1. Wei, L.T. A Simulation Study on Performance of Photovoltaic Thermal Water (PVTW) Collector Under Different Loading of Mass Flow Rate Using ANSYS Fluent. Int. J. Nanoelectr. Mater. 2021, 14, 467–478. [Google Scholar]
  2. Abdin, Z.U.; Rachid, A.; Korkut, T.B. Design and analysis of an innovative photovoltaic-thermal collector with embedded tank. Sol. Energy 2022, 245, 290–298. [Google Scholar] [CrossRef]
  3. Hassan, Q.; Viktor, P.; Al-Musawi, T.J.; Ali, B.M.; Algburi, S.; Alzoubi, H.M.; Al-Jiboory, A.K.; Sameen, A.Z.; Salman, H.M.; Jaszczur, M. The renewable energy role in the global energy Transformations. Renew. Energy Focus 2024, 48, 100545. [Google Scholar] [CrossRef]
  4. Deshmukh, M.K.G.; Sameeroddin, M.; Abdul, D.; Sattar, M.A. Renewable energy in the 21st century: A review. Mater. Today Proc. 2023, 80, 1756–1759. [Google Scholar] [CrossRef]
  5. Hashemizadeh, A.; Ju, Y.; Abadi, F.Z.B. Policy design for renewable energy development based on government support: A system dynamics model. Appl. Energy 2024, 376, 124331. [Google Scholar] [CrossRef]
  6. Ledmaoui, Y.; El Maghraoui, A.; El Aroussi, M.; Saadane, R.; Chebak, A.; Chehri, A. Forecasting solar energy production: A comparative study of machine learning algorithms. Energy Rep. 2023, 10, 1004–1012. [Google Scholar] [CrossRef]
  7. Zheng, J.; Du, J.; Wang, B.; Klemeš, J.J.; Liao, Q.; Liang, Y. A hybrid framework for forecasting power generation of multiple renewable energy sources. Renew. Sustain. Energy Rev. 2023, 172, 113046. [Google Scholar] [CrossRef]
  8. Stergaard, P.A.; Duic, N.; Noorollahi, Y.; Kalogirou, S. Renewable energy for sustainable development. J. Renew. Energy 2022, 199, 1145–1152. [Google Scholar] [CrossRef]
  9. Sueyoshi, T.; Mo, F.; Wang, D.D. Sustainable development of countries all over the world and the impact of renewable energy. J. Renew. Energy 2022, 184, 320–331. [Google Scholar] [CrossRef]
  10. Singh, R.; Paniyil, P.; Zhang, Z. Transformative role of power electronics: In solving climate emergency. IEEE Power Electron. Mag. 2022, 9, 39–47. [Google Scholar] [CrossRef]
  11. Kiehbadroudinezhad, M.; Merabet, A.; Rajabipour, A.; Cada, M.; Kiehbadroudinezhad, S.; Khanali, M.; Hosseinzadeh-Bandbafha, H. Optimization of wind/solar energy microgrid by division algorithm considering human health and environmental impacts for power-water cogeneration. Energy Convers. Manag. 2022, 252, 115064. [Google Scholar] [CrossRef]
  12. Ren, F.R.; Tian, Z.; Liu, J.; Shen, Y.T. Analysis of CO2 emission reduction contribution and efficiency of China’s solar photovoltaic industry: Based on Input-output perspective. Energy 2020, 199, 117493. [Google Scholar] [CrossRef]
  13. Gao, Y.; Chen, B.; Wu, D.; Dai, Z.; Wang, C.; Zhang, X. Comparative study of various solar power generation systems integrated with nanofluid-flat heat pipe. Appl. Energy 2022, 327, 120052. [Google Scholar] [CrossRef]
  14. Liu, J.; He, Y.; Ding, L.; Zhang, H.; Li, Q.; Jia, L.; Yu, J.; Lau, T.W.; Li, M.; Qin, Y.; et al. Perovskite/silicon tandem solar cells with bilayer interface passivation. Nature 2024, 635, 596–603. [Google Scholar] [CrossRef]
  15. Wu, H.; Ye, F.; Yang, M.; Luo, F.; Tang, X.; Tang, Q.; Qiu, H.; Huang, Z.; Wang, G.; Sun, Z.; et al. Silicon heterojunction back-contact solar cells by laser patterning. Nature 2024, 635, 604–609. [Google Scholar] [CrossRef]
  16. Saeidi, R.; Noorollahi, Y.; Aghaz, J.; Chang, S. FUZZY-TOPSIS method for defining optimal parameters and finding suitable sites for PV power plants. Energy 2023, 282, 128556. [Google Scholar] [CrossRef]
  17. Rahdan, P.; Zeyen, E.; Gallego-Castillo, C.; Victoria, M. Distributed photovoltaics provides key benefits for a highly renewable European energy system. Appl. Energy 2024, 360, 122721. [Google Scholar] [CrossRef]
  18. Sheikholeslami, M.; Khalili, Z. Solar photovoltaic-thermal system with novel design of tube containing eco-friendly nanofluid. Renew. Energy 2024, 222, 119862. [Google Scholar] [CrossRef]
  19. Zhou, J. Principles of Photovoltaic Cells, 1st ed.; Chemical Industry Press: Beijing, China, 2021. [Google Scholar]
  20. Martins, G.; Mendoza, O.S.H.; Amjad, M.; Bandarra Filho, E.P. Analysis of the generation potential of hybrid solar power plants. Front. Energy Res. 2023, 11, 1017943. [Google Scholar] [CrossRef]
  21. Elfeky, K.E.; Wang, Q. Techno-environ-economic assessment of photovoltaic and CSP with storage systems in China and Egypt under various climatic conditions. J. Renew. Energy 2023, 215, 118930. [Google Scholar] [CrossRef]
  22. Wolf, M. Performance analyses of combined heating and photovoltaic power systems for residences. Energy Convers. 1976, 16, 79–90. [Google Scholar] [CrossRef]
  23. Florschuetz, L.W. Extension of the Hottel-Whillier model to the analysis of combined photovoltaic/thermal flat plate collectors. J. Sol. Energy 1979, 22, 361–366. [Google Scholar] [CrossRef]
  24. Chauhan, A.; Tyagi, V.V.; Anand, S. Minimum entropy generation and its validation against Hottel Whillier model for PVT and FPC collectors. J. Sol. Energy 2019, 188, 143–157. [Google Scholar] [CrossRef]
  25. Guarracino, I.; Mellor, A.; Ekins-Daukes, N.J.; Markides, C.N. Dynamic coupled thermal-and-electrical modelling of sheet-and-tube hybrid photovoltaic/thermal (PVT) collectors. Appl. Therm. Eng. 2016, 101, 778–795. [Google Scholar] [CrossRef]
  26. Ma, T.; Li, M.; Kazemian, A. Photovoltaic thermal module and solar thermal collector connected in series to produce electricity and high-grade heat simultaneously. Appl. Energy 2020, 261, 114380. [Google Scholar] [CrossRef]
  27. Nahar, A.; Hasanuzzaman, M.; Rahim, N.A. Numerical and experimental investigation on the performance of a photovoltaic thermal collector with parallel plate flow channel under different operating conditions in Malaysia. J. Sol. Energy 2017, 144, 517–528. [Google Scholar] [CrossRef]
  28. Zarei, A.; Liravi, M.; Rabiee, M.B.; Ghodrat, M. A Novel, eco-friendly combined solar cooling and heating system, powered by hybrid Photovoltaic thermal (PVT) collector for domestic application. Energy Convers. Manag. 2020, 222, 113198. [Google Scholar] [CrossRef]
  29. Abdul-Ganiyu, S.; Quansah, D.A.; Ramde, E.W.; Seidu, R.; Adaramola, M.S. Study effect of flow rate on flat-plate water-based photovoltaic-thermal (PVT) system performance by analytical technique. J. Clean. Prod. 2021, 321, 128985. [Google Scholar] [CrossRef]
  30. De Vries, D.W. Design of a Photovoltaic/Thermal Combi-Panel. Ph.D. Thesis, Technische Universiteit Eindhoven, Eindhoven, The Netherlands, 1998. [Google Scholar]
  31. Zhou, J.; Yi, Q.; Wang, Y.; Ye, Z. Temperature distribution of photovoltaic module based on finite element simulation. J. Sol. Energy 2015, 111, 97–103. [Google Scholar] [CrossRef]
  32. Zhou, J.C.; Zhang, Z.; Liu, H.J.; Yi, Q. Temperature distribution and back sheet role of polycrystalline silicon photovoltaic modules. Appl. Therm. Eng. 2017, 111, 1296–1303. [Google Scholar] [CrossRef]
  33. Armstrong, S.; Hurley, W.G. A thermal model for photovoltaic panels under varying atmospheric conditions. Appl. Therm. Eng. 2010, 30, 1488–1495. [Google Scholar] [CrossRef]
  34. Abdel-Khalik, S.I. Heat removal factor for a flat-plate solar collector with a serpentine tube. J. Sol. Energy 1976, 18, 59–64. [Google Scholar] [CrossRef]
  35. Zhang, M.F.; Lavan, Z. Thermal performance of a serpentine absorber plate. J. Sol. Energy 1985, 34, 175–177. [Google Scholar] [CrossRef]
  36. Watmuff, J.H.; Charters, W.W.S.; Proctor, D. Solar and Wind Induced External Coefficients-Solar Collectors. Comples 1977, 56. [Google Scholar]
  37. Mitchell, J.W. Heat transfer from spheres and other animal forms. Biophys. J. 1976, 16, 561–569. [Google Scholar] [CrossRef] [PubMed]
  38. Hollands, K.G.T. Directional selectivity, emittance, and absorptance properties of vee corrugated specular surfaces. J. Sol. Energy 1963, 7, 108–116. [Google Scholar] [CrossRef]
  39. Antonanzas, J.; Del Amo, A.; Martinez-Gracia, A.; Bayod-Rujula, A.A.; Antonanzas-Torres, F. Towards the optimization of convective losses in photovoltaic–thermal panels. J. Sol. Energy 2015, 116, 323–336. [Google Scholar] [CrossRef]
  40. Herrando, M.; Ramos, A.; Zabalza, I.; Markides, C.N. A comprehensive assessment of alternative absorber-exchanger designs for hybrid PVT-water collectors. Appl. Energy 2019, 235, 1583–1602. [Google Scholar] [CrossRef]
  41. Zhou, J.; Yu, L.; Ayipaiyili, Y.; Hao, L.; Jiang, B. Comparative Analysis of Edge Soiling Resilience: Full-Cell vs. Half-Cell Photovoltaic Modules in Different Mounting Orientations. J. Eng. 2023, 2023, 5572523. [Google Scholar] [CrossRef]
  42. Hanifi, H.; Khan, M.Z.; Jaeckel, B.; Hagendorf, C.; Schneider, J.; Abdallah, A.; Ilse, K. Optimum PV module interconnection layout and mounting orientation to reduce inhomogeneous soiling losses in desert environments. Sol. Energy 2020, 203, 267–274. [Google Scholar] [CrossRef]
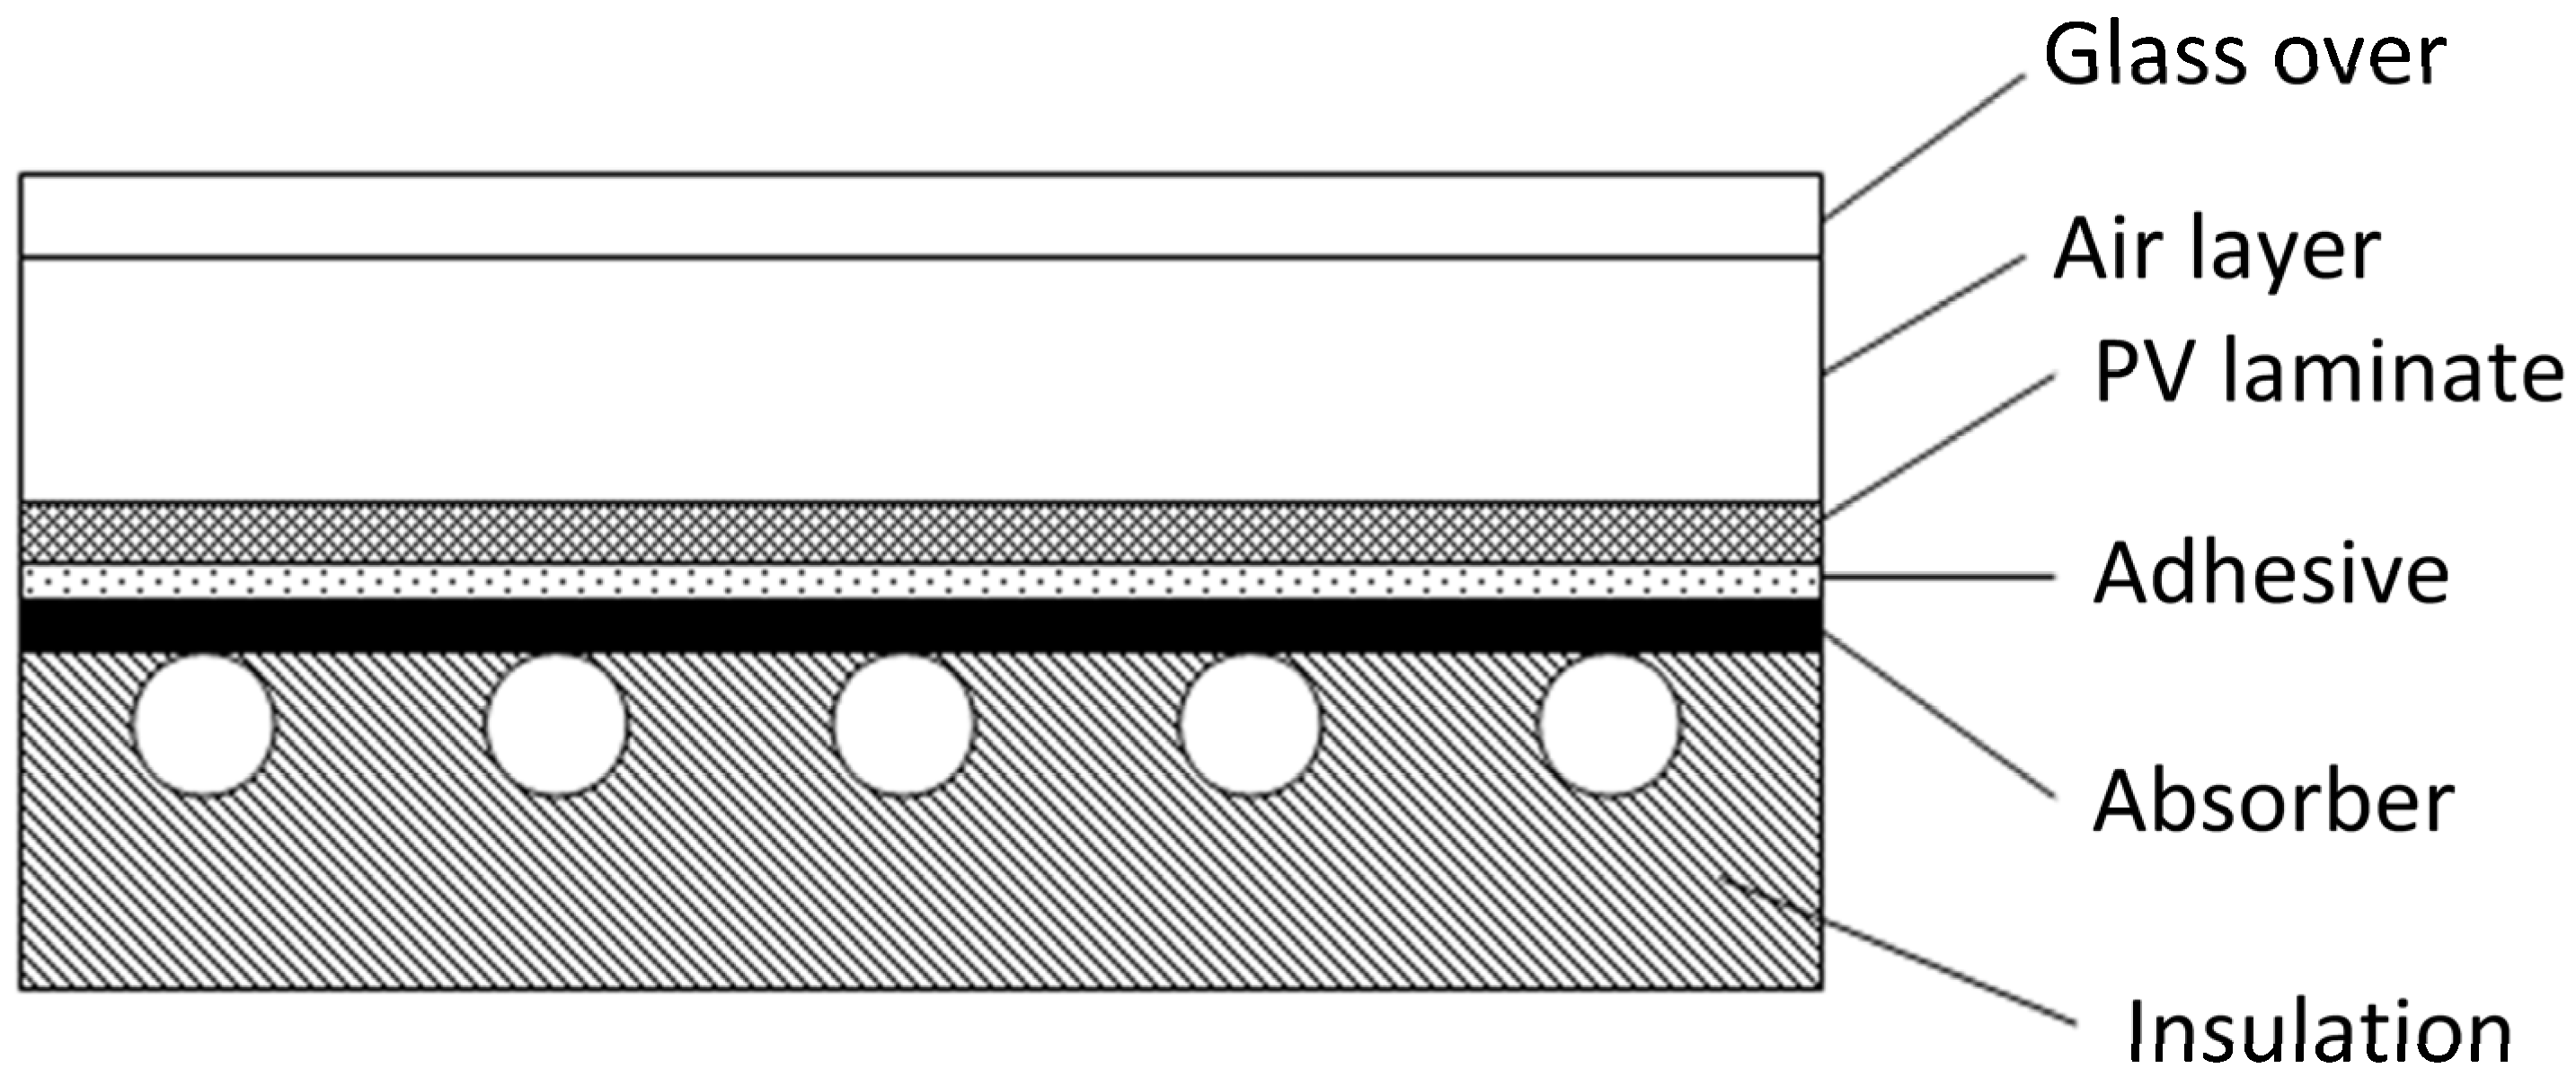
Figure 1. Geometric model diagram of PVT module.
Coatings 15 01202 g001
Figure 2. Configuration of serpentine pipe.
Coatings 15 01202 g002
Figure 3. Flow chart used in the simulation model.
Coatings 15 01202 g003
Figure 4. The thermal efficiency comparison between our modeling and the experimental results [30].
Coatings 15 01202 g004
Figure 5. The variation in thermal efficiency and PCE changing with the ambient temperature.
Coatings 15 01202 g005
Figure 6. The trend of thermal efficiency and PCE changing with the inlet water temperature.
Coatings 15 01202 g006
Figure 7. The trend of zero reduced temperature efficiency changing with the pipe spacing.
Coatings 15 01202 g007
Figure 8. The trend of thermal efficiency, outlet temperature and PV panel temperature with the mass flow rate.
Coatings 15 01202 g008
Table 1. Design parameters used in the PVT collector system.
SymbolValueSymbolValue
ϵ p 0.9 h c a 45 W/(m2·K)
ϵ g 0.9 D 0.01 m
θ 45° D i 0.008 m
β 0.0045 η e l , r e f 0.097
L 20 mm W 0.095 m
U e 1.5 W/(m2·K) A c 0.944 m2
U b 1 W/(m2·K) m ˙ 0.02   k g / s
v 1 m/s G 800 W/m2
k a b s 390 W / ( m K ) ( τ α ) n 0.74
δ a b s 0.2 mm T a 293 K
k p v 84 W / ( m K ) T i n 293 K
δ p v 0.35 mm T r e f 298 K
Disclaimer/Publisher’s Note: The statements, opinions and data contained in all publications are solely those of the individual author(s) and contributor(s) and not of MDPI and/or the editor(s). MDPI and/or the editor(s) disclaim responsibility for any injury to people or property resulting from any ideas, methods, instructions or products referred to in the content.