Abstract
The aim of this study was to produce a coating for protective glass glued to touch displays with high antibacterial effectiveness. This paper presents the structural, mechanical, optical, and antibacterial properties of a TiO2:Ag–Pt coating prepared by dual reactive DC and RF magnetron sputtering. Characterization techniques used include XRD, TEM with EDS, SEM, AFM, nanoindentation for hardness and Young’s modulus, wettability tests, and optical property analysis. The coating exhibited columnar crystals with a width of 30–50 nm. Crystals of anatase, rutile, silver, and platinum with a size of up to 3 nm were identified. The coating deposited on glass had a concentration of 5.0 ± 0.2% at. Ag and 4.4 ± 0.1% at. Pt. The value of the optical band gap energy, corresponding to the direct transition, was 3.36 eV, while Urbach’s energy was in the order of 500 meV. The hydrophilic coating had a roughness RMS = 1.8 ± 0.2 nm, hardness HV = 6.8 ± 0.5 GPa, and Young’s modulus E = 116 ± 8 GPa. A unique combination of the phase composition of the TiO2:Ag–Pt coating, metallic Ag and Pt nanoparticles in a ceramic matrix of anatase and rutile crystallites resulted a >90% reduction of Staphylococcus aureus bacteria. This antibacterial effect was attributed to the activation of the doped semiconductor under visible light via plasmon resonance of the Ag and Pt nanoparticles, as well as a light-independent antibacterial action due to Ag+ ion release. In contrast, commercial antibacterial coatings typically achieve only around 60% bacterial reduction.
1. Introduction
As a popular photocatalyst, titanium dioxide (TiO2) is widely used due to its availability, easy manufacturing and handling, non-toxicity, high thermal and chemical stability, low-cost, high refractive index, and, of course, high photocatalytic efficiency [1,2]. Photocatalytic TiO2 is utilized across various industries. Its properties make it suitable for use in water treatment [3], antibacterial coatings or so called self-cleaning surfaces, and antifogging materials [1,4]. The number of publications dedicated to TiO2-based photocatalysts increases annually [2]. TiO2 photocatalysts can be obtained using different methods, such as chemical vapor deposition (CVD), pulsed laser deposition (PLD), atomic layer deposition (ALD), electron beam evaporation, liquid-phase deposition, sol-gel processes, and magnetron sputtering (MS) [5,6]. However, many methods of thin film deposition do not provide equilibrium conditions of growth. This is the case with magnetron reactive sputtering [7]. However, magnetron sputtering can be used to obtain a homogenous, high-density, nanometer-thick, hard coating with good adhesion to a substrate [8]. Moreover, the radio frequency (RF) magnetron sputtering method offers significant advantages in terms of controlling the structure and composition of the TiO2 films, as well as in its adaptability to varying deposition conditions [5]. Reactive magnetron sputtering, as one of the PVD methods, enables the fabrication of nanocomposites composed of metallic silver (Ag) nanoparticles with sizes of several nanometers embedded within a ceramic TiO2 matrix. Such structures provide increased antibacterial properties [9]. One effective approach to improving the photocatalyst performance is the incorporation of noble metals such as Pt, Au, Ag, and Pd, which enhance the charge separation efficiency [10]. The addition of a noble metal to a photocatalytic semiconductor can change its surface properties [4]. The doping of TiO2 with plasmonic noble metals overcomes various limitations associated with the use of bare TiO2, e.g., it lowers the band gap energy and allows the absorption of photons to occur at lower energy, i.e., toward the visible region in the electromagnetic spectrum, primarily due to the localized surface plasmon effect (LSPR). It also increases the lifetime of electron and hole pairs, which increases the photocatalytic efficiency of noble metal doped TiO2 [11,12]. In addition to enhancing the photocatalytic activity, such dopants can also inhibit undesirable crystallite growth and phase transformations [6]. Among the most commonly used metals to improve the photocatalytic performance of TiO2 in the visible light range are Pt and Ag. Metallic Pt nanoparticles act as electron trap centers, helping to prevent electron-hole pair recombination. Pt can also influence the crystal structure of TiO2, leading to a partial phase transformation from anatase to rutile, which can beneficially affect the photocatalytic properties of the coatings. The photocatalytic properties of titanium dioxide doped with Pt and Ag prepared by the sol-gel process have been widely discussed in the literature. A. Zielińska-Jurek et al. [13] analyzed the inhibition of microorganism growth and photocatalytic activity under visible light irradiation for phenol degradation on Ag-Pt/TiO2 photocatalysts. They showed that the photoactivity of Pt/TiO2 and Ag-Pt/TiO2 powders depends mainly on the Pt nanoparticle size; the smaller the size, the higher the efficiency of phenol degradation. DRS, XRD, TEM, and BET measurements confirmed that the most active photocatalyst under visible light (Ag-Pt/TiO2) contains fine Pt NPs (approx. 3 nm) and small Ag nanoparticles (approx. 6 nm) deposited on a self-synthesized TiO2 surface. Ag nanoparticles with size below 5 nm are recommended for the inhibition of pathogenic microorganism growth [13]. Jialu Wu. et al. [14] examined the catalytic activity and stability of PtAg/TiO2-rutile for the electrooxidation of methanol. Pt–Ag nanoparticles with an atomic ratio of 1:1 were prepared by the chemical co-reduction of precursors of Pt and Ag. Physical characterizations revealed that the Pt–Ag nanoparticles were evenly dispersed on the TiO2. Pt,Ag/TiO2-rutile showed significantly higher catalytic activity and stability than Pt,Ag/C, Pt/TiO2, and Pt/C for methanol oxidation in both alkaline and acidic solutions, indicating that rutile TiO2 is superior to carbon black as a support, and that Pt–Ag is superior to Pt in terms of catalytic activity. Also, M. Qamar [15] confirmed that the photocatalytic efficiency of TiO2 nanoparticles in the degradation of acridine orange could be significantly improved by depositing the optimal amount of Pt and Ag metals. Panigrahi Puspamitra et al. [16] analyzed the electronic and optical properties of Pt–Ag-doped TiO2, with different concentrations. The calculated reflectivity, energy loss function, and extinction coefficient demonstrated the enhanced optical properties of doped TiO2 compared to its pristine form. These results underline the merits of tailoring the optical properties of Pt–Ag-doped TiO2 for improved photocatalytic performance in the visible light region [16]. The above-mentioned works confirm that TiO2 doped with Ag and Pt has higher photocatalytic activity than TiO2 doped with only one of the metals. The size of the crystallites are also important for the optical and antibacterial properties of TiO2. There are numerous works on TiO2 coatings doped with Ag [4,17,18,19,20] or Pt [5,6,21]. We can also find works on TiO2 coatings doped with Ag and Pt [13,14,15,16], but none describes a preparation via the magnetron sputtering process. This is due to the difficulty of embedding Ag and Pt nanoparticles in the TiO2 matrix in the magnetron sputtering process.
Ag nanoparticles dispersed on the TiO2 surface can significantly increase the photocatalytic and antimicrobial activity. Pt is one of the most active metals for photocatalytic enhancement under UV irradiation, producing the highest Schottky barrier among all metals and facilitating electron capture, thereby hindering the recombination between electrons and holes [13,15]. Due to its high photocatalytic and antibacterial activity, it was decided that the coating components should be TiO2, Ag, and Pt.
Based on the above literature analysis, a TiO2:Ag–Pt coating with very high fragmentation and excellent antibacterial effectiveness was successfully fabricated using magnetron sputtering. The crystal structure, hardness, Young’s modulus, surface geometric structure, wettability, and antimicrobial activity of TiO2:Ag–Pt coatings produced via the magnetron sputtering process were determined and compared with those of TiO2:Ag coatings produced by the same method [9,22]. The produced antibacterial TiO2:Ag–Pt coating could be applied to protective glass glued to touch displays, such as those used in smartphones and smartwatches, as well as mirrors, glass panels in shower cabins (e.g., in hospital settings), and even surgical instruments [19].
2. Materials and Methods
In cooperation with A. Dziedzic from the University of Rzeszow and D. Augustowski and P. Kwasnicki from ML System S.A. Poland, the coating of TiO2 doped with Ag and Pt was designed and prepared via a reactive magnetron sputtering process. The Minispectros thin-film deposition system (Kurt J. Lesker, East Sussex, UK), by ML System, was used to produce the TiO2:Ag–Pt coating. The process chamber was equipped with two independent magnetrons operating in DC and RF modes. Original targets designed and manufactured by A. Dziedzic were used to produce the TiO2:Ag–Pt coating. The TiO2:Ag–Pt coating was deposited on a Si crystal and glass substrate. The sputtering source was two Ti targets manufactured by Kurt J. Lesker with a diameter of 3″, a thickness of 0.250″, and 99.995% purity. Titanium targets were sputtered simultaneously. To produce the coatings, six symmetrically arranged holes (diameter 2 mm) were drilled in the Ti target, and Pt or Ag pins were placed inside. The first titanium target with six Pt pins (purity of 99.9%) was sputtered using a DC power supply. The second titanium target with six Ag pins (2 mm diameter, purity of 99.9%) was sputtered using an RF power supply. The sputtering process was executed in a mixture of Ar/O2 gases, with Ar having a purity of 99.9999%, and O2 a purity of 99.999%. The O2/Ar gases glow ratio was 0.3 (30%). Soda-lime glass plates (25 × 25 × 1 mm) and a Si crystal were used as the substrate. The substrates were cleaned in an ultrasonic cleaner in acetone and DI water and then dried with nitrogen. The sputtering process was carried out at a pressure of approximately 3.75 mTorr. The Ti target with Pt was sputtered using a power of 21.2 W/in2, and that with Ag using a power of 26.5 W/in2. Both the glass and Si substrates were heated to 300 °C during deposition coating in a vacuum chamber. The sputter process was carried out for 240 min. The TiO2:Ag1.7, TiO2:Ag2.0, and TiO2:Ag2.5 coatings deposited on glass were prepared by sputtering one Ti target with six Ag pins. Applying a magnetron power of 7.1 W/in2, 10.7 W/in2, and 14.3 W/in2, Ag concentration in the coatings of 1.7% at., 2.0% at., and 2.5% at. were obtained, respectively.
The crystal structures of the coatings were analyzed by X-ray diffractometry (XRD) using a Bruker D8 Advance diffractometer (CuKα, λ = 0.154056 nm). To solve the resulting diffractograms, a base of ICCD PDF standards was used: anatase (00-021-1272), rutile (01-072-7374), Pt with a cubic crystal structure and face-centered lattice (01-087-0647), and Ag with a cubic crystal structure and face-centered lattice (00-004-0783). Angle and spot intensity matching were analyzed using the EVA software (ver. 5.2, PDF 2.1, Bruker Corporation, Billerica, MA, USA).
The structure was analyzed using a transmission electron microscope Tecnai Osiris, 200 kV (FEI Company, Eindhoven, The Netherlands). STEM HAADF (Z-contrast) imaging, HRTEM with FFT, and SAED diffraction images. Maps of the EDS chemical composition of elements were used to identify the crystallites from which the coating was composed. Lamella for TEM investigation was prepared using a focused ion beam microscope Quanta 3D 200i (FEI Company, Eindhoven, The Netherlands).
The surface and chemical composition of the coating were analyzed using a SEM microscope (FEI Quanta 3D 200i) with an EDS microanalyzer.
Surface morphology was probed by AFM (CSM) in contact mode. The roughness analysis consisted of identifying the root mean square (RMS) parameter.
Measurements of Young’s modulus and hardness were carried out using the nanoindentation method on a CSM stand, according to the ISO 14577 1:2015 09 standard [23]. The Young’s modulus of the tested coating was calculated based on the method of Oliver and Pharr [24]. The force acting on the indenter was 0.5 mN, the operating time was 15 s, and the rate of force increase was 1.0 mN/min. The maximum value of the loading force was selected so that the maximum impression depth was less than 10% of the coating thickness.
The sample transmission spectrum was determined at room temperature using a Cary 5000 spectrophotometer, Agilent Technologies, Santa Clara, CA, USA, Cary Win, software ver. 4.20 (468).
The water wetting angle of the coating was tested using a Nikon C-PS stereoscopic microscope with the camera from the MA-200 microscope (Nikon Corporation, Tokyo, Japan) and Nikon NIS Elements, software ver. 24.11.2013.
In the antibacterial tests, the coatings were activated with visible light, because in such conditions, the coatings would be used most of the time. For the antimicrobial assay, Gram-positive strain Staphylococcus aureus (ATCC 25923) was used. Nutrient broth and agar (BTL, Poland) or phosphate buffered saline (Sigma Aldrich, St. Louis, MI, USA, and Burlington, VT, USA) were used for bacteria culturing and serial dilutions, respectively. All assays were carried out in a laminar flow hood (BioTectum, Bielsko-Biala, Poland). The bacteria, having been incubated overnight in aerobic conditions at 37 °C with shaking, were diluted to give an initial concentration about 1 × 10⁴ cells/mL and poured onto the sterile coatings. During the incubations, samples of the coatings were irradiated with two 10 W LED lamps (3000 and 6000 K) which emitted visible light (400–700 nm) with an integral output of 0.5 mW/cm2, resembling the light distribution of solar irradiation. After 2 and 4 h of incubation at a temperature 35 °C, the living bacteria were extracted from the sample surfaces using 5 mL SCDLP broth and ten-fold serial dilutions spread on the nutrient agar plates and incubated overnight at 37 °C. The results were determined by counting the colony forming unions (CFU). The percentage of growth reduction (%R) was calculation according to Formula (1):
%R = ((CFU control − CFU sample)/CFU control) × 100%
To analyze the bacterial morphologies, scanning electron microscopy (SEM) visualization was performed. The overnight growth of the S. aureus cell culture at 108 CFU/mL was spread onto a surface and incubated for 4 h. After this, the samples were centrifuged and fixed with 2.5% glutaraldehyde for 2 h at room temperature. After fixation, the cell pellet was soaked in 0.1 M cacodylate sodium (pH 7) to remove excess fixative. The samples were then dehydrated by successive soakings in 25, 50, 75, and 95% ethanol for 10 min each. A thin layer of gold was then sputtered onto the samples, which were imaged using an SEM microscope.
Microbiological tests were carried out for the following coatings: TiO2:Ag–Pt on Si, TiO2:Ag–Pt on glass, and TiO2:Ag on glass and antibacterial coatings for touch screens, purchased commercially.
2.1. XRD Analysis of the Structure
In order to determine the crystalline structure of the coating, XRD tests were carried out. Figure 1 shows the XRD patterns of the TiO2:Ag–Pt coating produced on a Si crystal and soda-lime glass via a reactive magnetron sputtering process. Analysis of the obtained diffractograms of the TiO2:Ag–Pt coating revealed the amorphous structure of the coating. No peaks from anatase, rutile, Pt, or Ag crystallites were identified in the diffractograms. Only small reflections coming from the substrate (Si crystal) are visible. However, our analysis using TEM methods, as shown in Section 2.2, confirmed that the coating, besides having an amorphous structure, consisted of crystallites of anatase, rutile, Pt, and Ag. Nanoparticles with sizes below 2–3 nm may not produce reflections in XRD patterns. The literature confirms that small crystal clusters are not detectable by XRD due to the lack of long-range order [25].
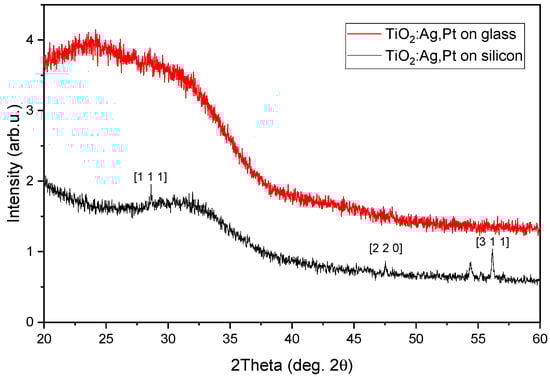
Figure 1.
XRD patterns of TiO2:Ag–Pt coating deposited on Si crystal (black curve) and glass (red curve). The marked reflections on the black curve are from Si crystal.
2.2. TEM Analysis of the Structure
In order to determine the thickness, structure, and phase composition of the TiO2:Ag–Pt coating, TEM tests were carried out. Figure 2 shows an HAADF STEM image of a cross-section of the TiO2:Ag–Pt coating. Thanks to the HAADF detector, we set the image contrast depending on atomic number Z of the elements, i.e., the higher the value of Z, the brighter the area. At the top of the image in Figure 2a, a Pt coating deposited in the process of preparing the thinned lamella using the FIB technique is visible. The structure of the coating comprised columnar crystals with a width of 30 to 50 nm, characteristic of production via the magnetron sputtering process. The columnar crystals crystallized in a direction perpendicular to the substrate and consisted of crystallites with different orientations, as revealed by HRTEM images (Figure 6). The coating deposited on Si had a thickness of 400 nm, and on glass 600 nm.
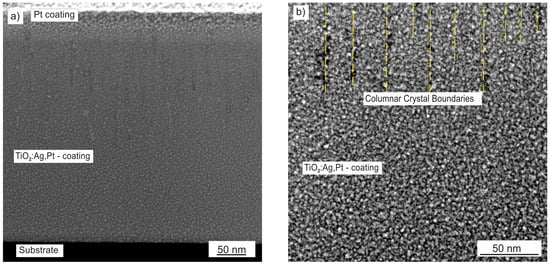
Figure 2.
HAADF STEM image (Z-contrast) of TiO2:Ag–Pt coating, (a) cross-sectional view of the Pt protective coating, TiO2:Ag–Pt coating and the substrate, (b) columnar structure of the coating.
For the parameters adopted in this work, a coating with fine fragmentation was produced. The HAADF STEM image in Figure 3 shows Pt metallic nanoparticles (the brightest areas) and Ag nanoparticles (slightly darker areas) with sizes d < 3 nm. In the enlarged image in Figure 3, we observe that the nanoparticles formed aggregates with sizes up to 5 nm. A similar size of Ag–Pt crystallites was obtained by A. Zielińska-Jurek et al. [13] in Ag-Pt/TiO2 photocatalysts produced by the sol-gel method (Pt approx. 3 nm and Ag approx. 6 nm). Also, M. Qamar [15] using the sol-gel method and photo-deposition, obtained Ag and Pt nanoparticles on a TiO2 surface with sizes of 2–4 nm and 3–20 nm, respectively. Adochite R.C. et al. [21] obtained Ag particles with a size of approx. 5 nm in a TiO2 matrix immediately after deposition. In the works mentioned above, Ag and Pt nanoparticles of significantly different sizes were obtained. In our study, the produced TiO2:Ag–Pt coating consisted of crystallites in a rather narrow size range, i.e., up to 3 nm. The large number of small-sized Ag and Pt particles generated a large surface area of nanoparticle boundaries, which translated into increased antibacterial properties [13]. The presence of metallic Ag–Pt nanoparticles in the ceramic matrix caused the formation of plasmon resonance, which increased the photocatalytic efficiency; the smaller the nanoparticles, the higher the photocatalytic efficiency [26,27,28].
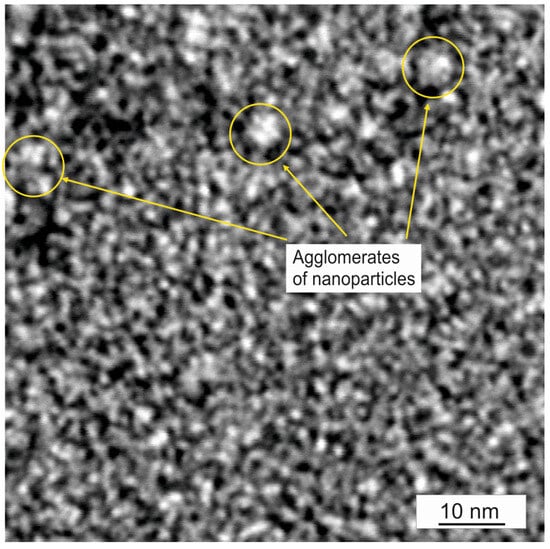
Figure 3.
HAADF STEM image of TiO2:Ag–Pt coating.
The diffraction pattern of the TiO2:Ag–Pt coating (Figure 4) shows reflections from rutile R(110), R(200), Pt(200), and Pt(111). A wide ring from the amorphous structure is also visible.
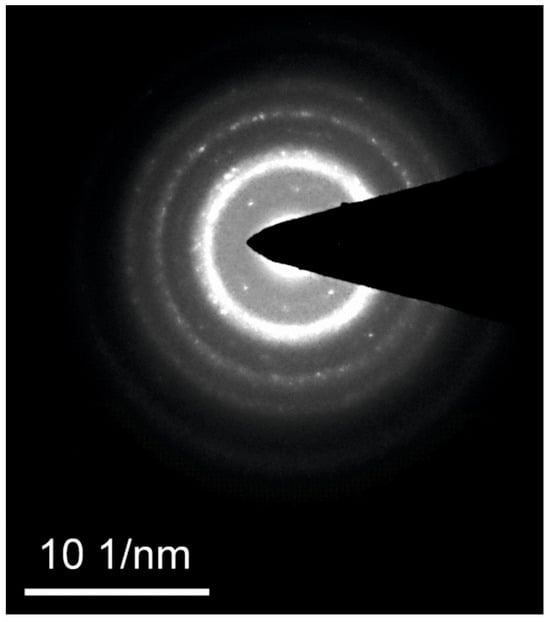
Figure 4.
SAED diffraction pattern of the TiO2:Ag–Pt coating.
Figure 5 shows the element distribution maps of a cross-section of the TiO2:Ag–Pt coating. The maps reveal a homogeneous distribution of Ti and O forming the ceramic matrix and agglomerates of Ag and Pt metal nanoparticles.
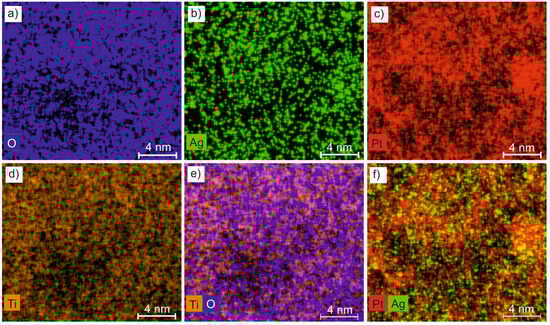
Figure 5.
Maps of the chemical composition of the TiO2:Ag–Pt coating, (a) O, (b) Ag, (c) Pt, (d) Ti, (e) Ti-O, (f) Pt-Ag distribution.
In order to identify the crystallites that formed the TiO2:Ag–Pt coating and determine their sizes, HRTEM imaging was performed (Figure 6). HRTEM images revealed the crystalline structure of the coating. Fourier transform was performed on the areas marked with a red square. Then, the distances between the atomic planes were calculated (Figure 6). Based on the determined distances, crystallites were identified. Crystallites of anatase A(101), A(103), rutile R(101), R(200), R(111), (R(210), Ag(111), Ag(200) and Pt(111), and Pt(200) were identified in the TiO2:Ag–Pt coating deposited on Si. However, in the TiO2:Ag–Pt coating deposited on glass, crystallites of anatase A(101), A(103), A(112), rutile R(101), R(200), Ag(111), and Pt(111) were observed. The crystallite size did not exceed 3 nm. HRTEM images mainly show agglomerates of the same and different crystallites.
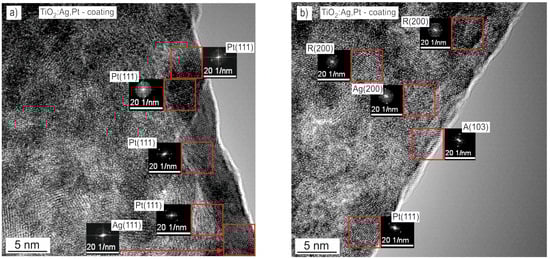
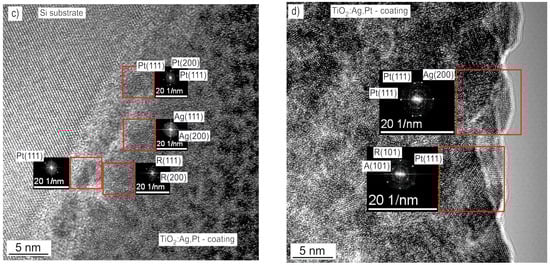
Figure 6.
HRTEM images with FFT on the cross-section of the TiO2:Ag–Pt coating.
XRD diffractograms, HAADF STEM, HRTEM images, SAED patterns, and chemical composition maps confirmed that a nanocomposite coating had been obtained as a result of reactive sputtering. It was a nanocomposite with a ceramic crystalline and partially amorphous TiO2 matrix and metallic crystalline Pt and Ag nanoparticles. The crystallite size did not exceed 3 nm. An analysis of the literature [13,15,21] shows that this is a very large fragmentation of the structure.
2.3. SEM with EDS Analysis
In order to determine the surface topography and chemical composition of the TiO2:Ag–Pt coating, tests were performed using a SEM microscope equipped with a composition microanalyzer. The results revealed the presence of Pt and Ag particles on the surface of the TiO2:Ag–Pt coating, with sizes reaching up to 150 nm (Figure 7). Ag particles of similar size on the surface of coatings were observed by S. Calderon Velasco et al. [17]. Metal particles on the coating surface were formed not only as a result of agglomeration but also through the phenomenon of coalescence, as well as through the dissolution of smaller particles and the formation of larger particles [17]. It should be noted that during the production of the TiO2:Ag–Pt coating in the vacuum chamber, the substrates were heated to a temperature of 300 °C. Without heating the coating, no anatase was obtained, only rutile. Anatase is more desirable due to its greater degree of surface hydroxylation [19]. An analysis of the chemical composition allowed us to conclude that the TiO2:Ag–Pt coating on the glass contained 5.0 ± 0.2% at. Ag and 4.4 ± 0.1% at. Pt. The coating prepared on Si had a higher concentration of metallic elements, i.e., 9.1 ± 0.2% at. Ag and 5.7 ± 0.2% at. Pt.
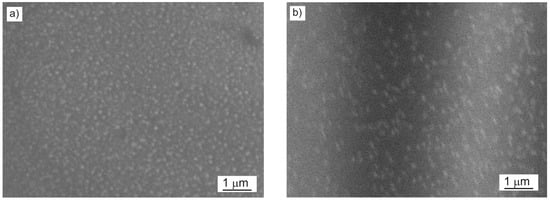
Figure 7.
SEM surface image of the TiO2:Ag–Pt coating on Si crystal (a) and glass (b).
2.4. Analysis of the Geometric Structure of the Coating Surface
To assess the quality of the TiO2:Ag–Pt coating, the geometric structure and RMS roughness were examined using atomic force microscopy (AFM). Figure 8 and Figure 9 show 2D and 3D maps and profiles of the surface of the TiO2:Ag–Pt coating on Si crystal and glass. The surface topography of the TiO2:Ag–Pt coating on Si and glass yielded similar AFM maps of the surface, as well as TEM images, confirming that the TiO2:Ag–Pt coating consisted of columnar crystals with a diameter of 30–50 nm. AFM images showed grains of this size. Columnar crystals, as they grow, increase slightly in diameter [17]; hence, we can observe a slightly larger crystal diameter in the AFM maps than in the TEM images. The RMS surface roughness for the TiO2:Ag–Pt coating deposited on Si was RMS = 2.6 ± 0.3 nm and on glass RMS = 1.8 ± 0.2 nm.
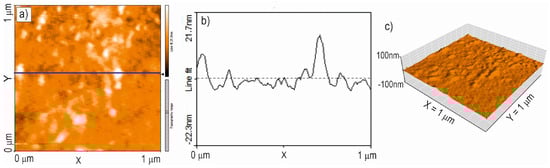
Figure 8.
2D (a), 3D (c) map and profile (b) of the surface of the TiO2:Ag–Pt coating on Si, RMS = 2.6 ± 0.3 nm (AFM).
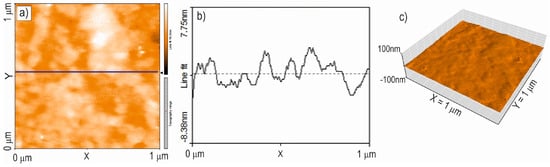
Figure 9.
2D (a), 3D (c) map and profile (b) of the surface of the TiO2:Ag–Pt coating on glass, RMS = 1.8 ± 0.2 nm (AFM).
2.5. Mechanical Properties Tests
In order to determine the durability, the hardness and Young’s modulus of the TiO2:Ag–Pt coating were tested. An analysis of the measurement results showed that the hardness of the coating deposited on Si was HV = 6.5 ± 0.5 GPa and on glass HV = 6.8 ± 0.5 GPa. A slight difference in coating hardness may have resulted from differences in the Ag and Pt concentrations in the coatings, depending on the substrate. The Young’s modulus of the coating on Si was E = 124 ± 6 GPa and on glass E = 116 ± 8 GPa. The higher value of the Young’s modulus for the coating deposited on Si may have resulted from the larger Young’s modulus for Si E = 120 ± 6 GPa. The measured Young’s modulus for the glass was E = 70 ± 5 GPa. Figure 10a,b show the indenter load curve as a function of the indentation depth for a Si substrate and a TiO2:Ag–Pt coating deposited on Si and for a glass substrate and a TiO2:Ag–Pt coating deposited on glass. A noticeable difference in the increase of the indenter load was observed between the glass and Si substrates, which could be attributed to the distinct properties of these materials.
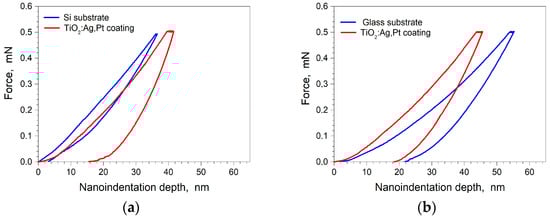
Figure 10.
Indenter loads as a function of the indentation depth for the TiO2:Ag–Pt coating and the substrate: (a) Si, (b) glass.
2.6. Wettability Tests
The following coatings were tested: TiO2Ag–Pt on glass, TiO2:Ag–Pt on Si, TiO2:Ag1.7 on glass, TiO2:Ag2.0 on glass, and TiO2:Ag2.5 on glass. Water contact angle tests showed that the TiO2:Ag–Pt coating was characterized by hydrophilic properties. After being sprinkled with water, the TiO2:Ag–Pt coating had a contact angle of 77.2 ± 7.3° (Figure 11). After 3, 6, 9, 12, and 15 min, the angle decreased to 64.2 ± 6.7°, 49.6 ± 2.9°, 40.1 ± 3.1°, 25.6 ± 3.2°, and 13.5 ± 3.4°, respectively. For comparison, the authors also analyzed the wettability of TiO2:Ag coatings. The tests showed that TiO2:Ag coatings had a contact angle smaller than the TiO2:Ag–Pt coatings. It was observed that with an increase in the concentration Ag in the TiO2:Ag coating from 1.7 to 2.5% at., the contact angle increased. The TiO2:Ag coating with a Ag concentration of 1.7, 2.0 and 2.5% at. had a contact angle of 38.0 ± 6.0°, 42.4 ± 5.8°, and 55.9 ± 3.0°, respectively. After 15 min, the contact angle decreased for all TiO2:Ag coatings. By increasing the Ag concentration from 2.1 to 2.9% at., the contact angle also increased, as confirmed by A. Jagodzińska [29]. Mosquera [18] also confirmed that with an increase in Ag content from 0.08 to 0.28% at., the contact angle increased with TiO2:Ag coatings. This means that the coatings were less hydrophilic [18]. However, Fanming Meng et al. [4] claimed that the hydrophilic properties of a foil increased with an increase in Ag concentration up to 5% vol. Ag and then decreased [4]; this means that the water wetting angle of the films decreased as the Ag concentration increased to 5% vol. Ag and then increased. The TiO2:Ag–Pt coating contained more Ag 9.1 ± 0.2% at. and also contained Pt 5.7 ± 0.2% at. Sometimes, a higher contact angle can be explained by a higher roughness of the coating, but in this case, the TiO2:Ag coatings had an RMS roughness of 3.6–5.3 nm, while the TiO2:Ag–Pt coating had an RMS roughness of 1.8–2.6 nm. However, the presence of Pt in the coating may have changed the wetting mechanism. Undoped titanium dioxide is characterized by photoinduced superhydrophilicity of the surface. As such, it is used in the production of self-cleaning and anti-fog glass and self-cleaning coatings [30].
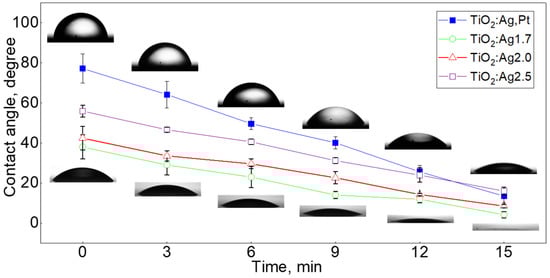
Figure 11.
Water wetting angle of TiO2:Ag–Pt and TiO2:Ag coatings on glass; at the top of the photo, water drops on the TiO2:Ag–Pt coating and at the bottom on the TiO2:Ag1.7 coating (1.7% at. Ag).
Doping a semiconductor with metals alters its surface properties, modifies the ratio of carrier concentrations at the surface, and affects the composition of the hydroxyl-hydrated layer. These changes consequently influence the initial hydrophilic state of the surface and its photoinduced transformation [31].
2.7. Optical Properties of Coatings
The transmission spectrum of the TiO2:Ag–Pt layer on a glass substrate, measured in the range of 200–800 nm, is shown in Figure 12.
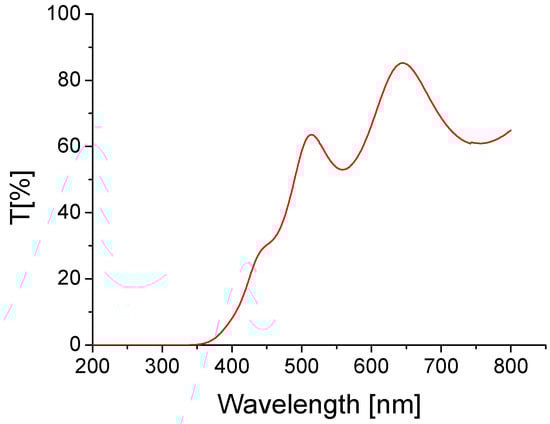
Figure 12.
Transmission spectra of the TiO2:Ag–Pt layer on glass substrate.
In the short wavelength range, i.e., below 350 nm, the layer was impermeable. Then, an increase in layer transmission with wavelength was observed, with interference minima and maxima testifying to the high homogeneity of the layer thickness [32]. In the range of 500–800 nm, the average transmission value was 66.4%, so slightly smaller than that of the layers of TiO2 on a glass substrate (with similar thickness), as described in the literature [33].
Based on the transmission of the layer, its absorption coefficient was determined in accordance with Formula (2):
where d is layer thickness (in cm) and T is transmission.
In the area of transparency, the layer of the absorption coefficient value did not exceed several thousand cm−1, while around the fundamental absorption edge, a value of 3 × 105 cm−1 was reached, which shows compliance with literature data for TiO2 films [34].
In order to determine the value of the optical band gap energy, the Tauc model was used, using the relationship [35,36] (3):
where A is constant, Eg is the optical band gap energy, and m = 2 for direct and 0.5 for indirect transitions.
In the literature, there is no consensus about the type of transitions for TiO2, with researchers reporting both the occurrence of direct [35] and indirect [36] transition.
In our case, the model of direct transition (m = 2) turned out to be better. The spectrum of absorption in the Tauc coordinates (for the case direct transition) for the tested layer is shown in Figure 13.
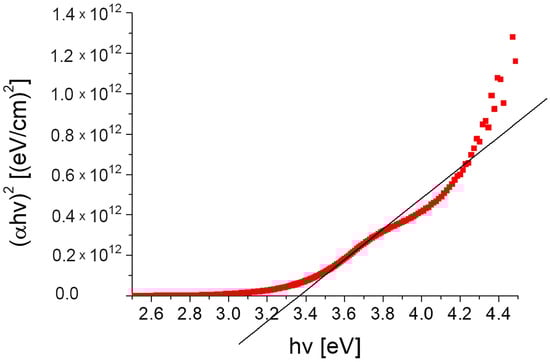
Figure 13.
Absorption spectra of the TiO2:Ag–Pt layer on glass substrate in Tauc coordinates.
The value of the obtained optical band gap energy corresponding to the direct transitions was 3.36 eV. According to the literature, for thin layers of TiO2, Eg is in a wide range of 3.0–3.8 eV [37,38,39,40,41,42], depending on TiO2 phase. For the anatase (~3.2 eV) phase, it was greater than rutile (~3.0 eV), and for the amorphous phase greater than for crystalline.
The Urbach tail, which occurs for disordered, poorly crystalline and amorphous materials, is an exponent part of absorption appearing in the area of the fundamental absorption edge. It is described by the dependence [43] (4):
where EU is the Urbach energy, hv is the photon energy, α0 is a constant, and α is absorption.
Figure 14 shows the dependence of ln(α) on the energy of falling photons.
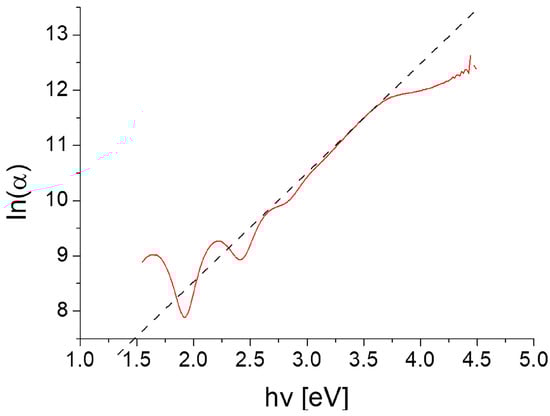
Figure 14.
Urbach tail of the TiO2:Ag–Pt layer on glass substrate.
The determined EU value was 508 meV, i.e., within the value range for TiO2 reported in the literature (254–806 meV [44,45]). It should be noted that the increase in the concentration of oxygen defects in the layer led to the greater EU value [45]).
2.8. Antibacterial Testing of Coatings
The prepared TiO2:Ag–Pt coatings on Si and glass were subjected to microbiological tests. For comparison, a commercial antibacterial coating on protective glass for touch screens and a TiO2:Ag coating on glass were analyzed. After 2 h of incubation of bacteria on the surface of the tested plates, the tests showed a bacterial reduction of 20.0%, 30.0%, 86.7%, and 97.7% for the commercial coating, TiO2:Ag, TiO2:Ag–Pt on Si, and TiO2:Ag–Pt on glass, respectively (Figure 15a). After 4 h of incubation, bacterial reduction was 59.1%, 55.4%, 94.5%, and 90.3% for the commercial coating, TiO2:Ag, TiO2:Ag–Pt on Si, and TiO2:Ag–Pt on glass, respectively. The TiO2:Ag–Pt coating on glass was characterized by the highest reduction of S. aureus bacteria, i.e., above 90%, regardless of the incubation time. The TiO2:Ag coating on glass was characterized by a similar maximum bacteria reduction to that of TiO2:Ag,N coatings [9], which confirms the correctness of the research methodology used. The commercial coating was characterized by a level of bacteria reduction similar to the TiO2:Ag coating. Figure 15b shows exemplary dishes with colonies of S. aureus bacteria from glass control plates (left) and from the TiO2:Ag–Pt coating on Si (right). Several bacterial colonies from the TiO2:Ag–Pt coating and several hundred colonies from the control plate are visible. The more than 90% reduction of S. aureus bacteria on the TiO2:Ag–Pt coating on glass was caused by the unique phase composition, metallic Ag–Pt nanoparticles in the ceramic matrix of anatase and rutile crystallites, and a small volume fraction of amorphous structure. The crystallites size did not exceed 3 nm. This combination of phase composition ensured over 90% reduction of bacteria thanks to the activation of the coating with an electromagnetic wave in the visible range and additional strengthening thanks to the phenomenon of plasmon resonance of Pt and Ag nanoparticles. The increase in photocatalytic efficiency via plasmon resonance of Ag–Pt nanoparticles was confirmed by M. Endo-Kimura et al. [46]. Those authors also proved that plasmonic photocatalysts are effective agents against various microorganisms. Moreover, regardless of light, the coating released Ag+ ions [17,19], also killing bacteria.
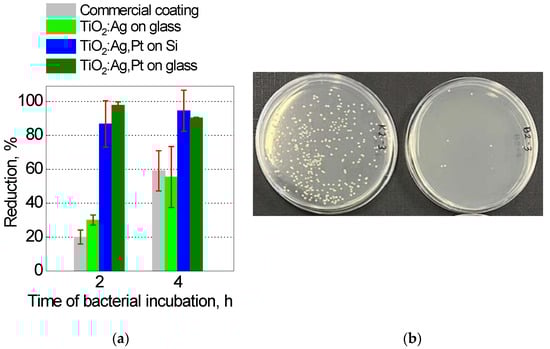
Figure 15.
Reduction of S. aureus bacteria on coatings (a) and example dishes with bacterial colonies (b) from the control plate (left) and from the TiO2:Ag–Pt/Si coating (right).
The bacterial morphologies of representative samples taken after incubation with every plate were examined by SEM (Figure 16). It can be seen that the bacteria in the control group or those exposed to commercial glass had smooth surfaces and maintained the integrity of membrane; the cells were spherically shaped. In contrast, after contact with the modified plate (TiO2:Ag–Pt on glass and TiO2:Ag–Pt on Si), cells exhibited profound morphological deformations. The cell damage and shrunken appearance indicated a loss of structural integrity. Leakage of the cytoplasmic components can be also observed. Peng-Fei Cai et al. reported on a photocatalytic TiO2:Ag thin film and its sterilization potential against S. aureus and E. coli. The antibacterial efficiency was around 98% according to their examination of the morphological changes of the treated bacteria cells [47].
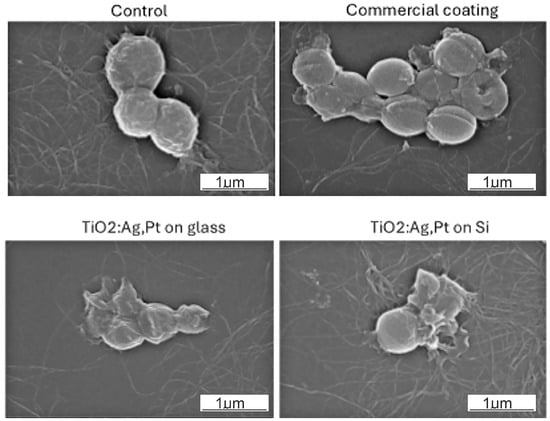
Figure 16.
SEM images of S. aureus cells exposed to the different surfaces.
3. Conclusions
A TiO2 coating doped with Ag and Pt was successfully produced by reactive magnetron sputtering. The TiO2:Ag–Pt coating had a columnar structure (column width—30–50 nm) and consisted of a ceramic crystalline and amorphous matrix of rutile and anatase and metallic crystalline Pt and Ag nanoparticles. The crystallite size did not exceed 3 nm. Nanoparticles with diameters up to 150 nm were identified on the coating surface. The TiO2:Ag–Pt coating deposited on glass had a concentration of 5.0 ± 0.2% at. Ag and 4.4 ± 0.1% at. Pt. The hydrophilic coating had a roughness RMS = 1.8 ± 0.2 nm, hardness HV = 6.8 ± 0.5 GPa, and Young’s modulus E = 116 ± 8 GPa. The contact angle for the TiO2:Ag–Pt coating was 77.2 ± 7.3°, decreasing over time to 13.5 ± 3.4° (after 15 min). The TiO2:Ag–Pt coating had a contact angle larger than those of the TiO2:Ag coatings. Optical studies of the TiO2:Ag–Pt layer on a glass substrate showed that the optical properties (e.g., absorption coefficient, Eg, EU) were close to those given in literature for TiO2 layers. The prepared TiO2:Ag–Pt coating showed a high, i.e., over 90%, reduction of S. aureus bacteria, while TiO2:Ag and commercial coatings achieved a 60% reduction of bacteria. The TiO2:Ag–Pt coating deposited on glass and on Si had comparable wetting angles and were characterized by a similar reduction of bacteria, i.e., within the limits of measurement uncertainty. The observed properties make the TiO2:Ag–Pt coating suitable for use on protective glass glued to touch displays.
Author Contributions
A.D.: Supervision, Conceptualization, Methodology, Writing—original draft, review & editing, Visualization, Formal analysis, Validation, Data analysis, Prepared the coating, TEM with EDS Investigation, preparation of FIB lamella, D.A.: Prepared the coating, P.K.: Prepared the coating, S.A.: Hardness, Younga Module, AFM Investigation, editing, W.B.: review & editing, A.Ż.: Microbiological Investigation, P.S.: SEM z EDS Investigation, Wettability Investigation, B.C.: XRD Investigation, P.P.: Optical Investigation, J.D.: TEM Investigation, M.K.-L.: Microbiological Investigation, D.P.: SEM Investigation. All authors have read and agreed to the published version of the manuscript.
Funding
This research received no external funding.
Institutional Review Board Statement
Not applicable.
Informed Consent Statement
Not applicable.
Data Availability Statement
The data will be made available upon request to the corresponding author’s address.
Acknowledgments
Many thanks to the biotechnology student and employee of the Department of Microbiology, Eng. Oliwia Trzaskos, for her help with bacterial cultures.
Conflicts of Interest
The authors declare no conflicts of interest.
References
- Hájková, P.; Matoušek, J.; Antoš, P. Aging of the photocatalytic TiO2 thin films modified by Ag and Pt. Appl. Catal. B Environ. 2014, 160–161, 51–56. [Google Scholar] [CrossRef]
- Ismael, M. A review and recent advances in solar-to-hydrogen energy conversion based on photocatalytic water splitting over doped-TiO2 nanoparticles. Sol. Energy 2020, 211, 522–546. [Google Scholar] [CrossRef]
- Shi, Y.; Zhang, J.; Lu, Z.; Shi, H.; Ye, J.; Zhao, C.; Li, Q.; Ding, F.; Zhang, B.; Li, C. Inactivation effect and kinetic analysis of multi-band ultraviolet LED combined with Ag/N modified magnetic TiO2 on microorganisms in ballast water. J. Water Process. Eng. 2024, 58, 104751. [Google Scholar] [CrossRef]
- Meng, F.; Lu, F. Pure and silver (2.5–40 vol%) modified TiO2 thin films deposited by radio frequency magnetron sputtering at room temperature: Surface topography, energy gap and photo-induced hydrophilicity. J. Alloys Compd. 2010, 501, 154–158. [Google Scholar] [CrossRef]
- Ma, C.; Dong, W.; Fang, L.; Zheng, F.; Shen, M.; Wang, Z. Synthesis of TiO2/Pt/TiO2 multilayer films via radio frequency magnetron sputtering and their enhanced photocatalytic activity. Thin Solid Films 2012, 520, 5727–5732. [Google Scholar] [CrossRef]
- Xu, W.; Dong, S.; Wang, D.; Ren, G. Investigation of microstructure evolution in Pt-doped TiO2 thin films deposited by rf magnetron sputtering. Phys. B Condens. Matter 2008, 403, 2698–2701. [Google Scholar] [CrossRef]
- Płacheta, K.; Kot, A.; Banas-Gac, J.; Zając, M.; Sikora, M.; Radecka, M.; Zakrzewska, K. Evolution of surface properties of titanium oxide thin films. Appl. Surf. Sci. 2023, 608, 155046. [Google Scholar] [CrossRef]
- Singh, P.; Gupta, G. Recent developments in thin film deposition using the magnetron sputtering technique. In Advances in Materials Science Research 56; Nova Science Publishers: Hauppauge, NY, USA, 2022; pp. 197–2425. ISBN 979-8-88697-331-0. [Google Scholar]
- Dziedzic, A.; Bochnowski, W.; Adamiak, S.; Szyller, Ł.; Cebulski, J.; Virt, I.; Kus-Liśkiewicz, M.; Marzec, M.; Potera, P.; Żaczek, A.; et al. Structure and antibacterial properties of Ag and N doped titanium dioxide coatings containing Ti2.85O4N phase, prepared by magnetron sputtering and annealing. Surf. Coat. Technol. 2020, 393, 125844. [Google Scholar] [CrossRef]
- Zielińska-Jurek, A.; Zaleska, A. Ag/Pt-modified TiO2 nanoparticles for toluene photooxidation in the gas phase. Catal. Today 2014, 230, 104–111. [Google Scholar] [CrossRef]
- Vanlalhmingmawia, C.; Lee, S.M.; Tiwari, D. Plasmonic noble metal doped titanium dioxide nanocomposites: Newer and exciting materials in the remediation of water contaminated with micropollutants. J. Water Process. Eng. 2023, 51, 103360. [Google Scholar] [CrossRef]
- Žerjav, G.; Say, Z.; Zavašnik, J.; Finšgar, M.; Langhammer, C.; Pintar, A. Photo, thermal and photothermal activity of TiO2 supported Pt catalysts for plasmon-driven environmental applications. J. Environ. Chem. Eng. 2023, 11, 110209. [Google Scholar] [CrossRef]
- Zielińska-Jurek, A.; Wei, Z.; Wysocka, I.; Szweda, P.; Kowalska, E. The effect of nanoparticles size on photocatalytic and antimicrobial properties of Ag-Pt/TiO2 photocatalysts. Appl. Surf. Sci. 2015, 353, 317–325. [Google Scholar] [CrossRef]
- Wu, J.; Xu, M.; Lei, S.; Jin, C. High electrocatalytic activity and stability of PtAg supported on rutile TiO2 for methanol oxidation. Int. J. Hydrogen Energy 2020, 45, 12815–12821. [Google Scholar] [CrossRef]
- Qamar, M. Photodegradation of acridine orange catalyzed by nanostructured titanium dioxide modified with platinum and silver metals. Desalination 2010, 254, 108–113. [Google Scholar] [CrossRef]
- Dorothy, A.A.; Subramaniam, N.G.; Panigrahi, P. Tuning electronic and optical properties of TiO2 with Pt/Ag doping to a prospective photocatalyst: A first principles DFT study. Mater. Res. Express 2019, 6, 045913. [Google Scholar] [CrossRef]
- Calderon Velasco, S.; Cavaleiro, A.; Carvalho, S. Functional properties of ceramic-Ag nanocomposite coatings produced by magnetron sputtering. Prog. Mater. Sci. 2016, 84, 158–191. [Google Scholar] [CrossRef]
- Mosquera, A.A.; Albella, J.M.; Navarro, V.; Bhattacharyya, D.; Endrino, J.L. Effect of silver on the phase transition and wettability of titanium oxide films. Sci. Rep. 2016, 6, 32171. [Google Scholar] [CrossRef]
- Jamuna-Thevi, K.; Bakar, S.; Ibrahim, S.; Shahab, N.; Toff, M. Quantification of silver ion release, in vitro cytotoxicity and antibacterial properties of nanostuctured Ag doped TiO2 coatings on stainless steel deposited by RF magnetron sputtering. Vacuum 2011, 86, 235–241. [Google Scholar] [CrossRef]
- Adochite, R.; Munteanu, D.; Torrell, M.; Cunha, L.; Alves, E.; Barradas, N.; Cavaleiro, A.; Riviere, J.; Le Bourhis, E.; Eyidi, D.; et al. The influence of annealing treatments on the properties of Ag:TiO2, nanocomposite films prepared by magnetron sputtering. Appl. Surf. Sci. 2012, 258, 4028–4034. [Google Scholar] [CrossRef]
- Shahid, M.; Zhan, Y.; Sagadeven, S.; Akermi, M.; Ahmad, W.; Hatamvand, M.; Oh, W.-C. Platinum doped titanium dioxide nanocomposite an efficient platform as anode material for methanol oxidation. J. Mater. Res. Technol. 2021, 15, 6551–6561. [Google Scholar] [CrossRef]
- Dziedzic, A.; Bochnowski, W.; Szyller, Ł.; Adamiak, S.; Wisz, G.; Cebulski, J. Method of Preparation of a Silver and Nitrogen Modified Titanium Dioxide Coating and a Coating Obtained Thereby. Pat.240989, Patent Office of Poland 2018. Available online: https://worldwide.espacenet.com/patent/search?q=ap%3DPL426051%2A (accessed on 19 April 2022).
- ISO 14577-1:2015; Metallic Materials—Instrumented Indentation Test for Hardness and Materials Parameters, Part 1: Test method; International Organization for Standardization. 2015. Available online: https://www.iso.org/standard/56626.html (accessed on 14 December 2015).
- Oliver, W.C.; Pharr, G.M. An improved technique for determining hardness and elastic modulus using load and displacement sensing indentation experiments. J. Mater. Res. 1992, 7, 1564–1583. [Google Scholar] [CrossRef]
- Yang, G.; Namin, L.M.; Deskins, N.A.; Teng, X. Influence of ∗OH adsorbates on the potentiodynamics of the CO2 generation during the electro-oxidation of ethanol. J. Catal. 2017, 353, 335–348. [Google Scholar] [CrossRef]
- Graham, C.; Mezzadrelli, A.; Senaratne, W.; Pal, S.; Thelen, D.; Hepburn, L.; Mazumder, P.; Pruneri, V. Towards transparent and durable copper-containing antimicrobial surfaces. Commun. Mater. 2024, 5, 39. [Google Scholar] [CrossRef]
- Xiong, Z.; Lei, Z.; Chen, X.; Gong, B.; Zhao, Y.; Zhang, J.; Zheng, C.; Wu, J.C. CO2 photocatalytic reduction over Pt deposited TiO2 nanocrystals with coexposed {101} and {001} facets: Effect of deposition method and Pt precursors. Catal. Commun. 2017, 96, 1–5. [Google Scholar] [CrossRef]
- Cozzoli, P.D.; Fanizza, E.; Comparelli, R.; Curri, M.L.; Agostiano, A.; Laub, D. Role of Metal Nanoparticles in TiO2/Ag Nanocomposite-Based Microheterogeneous Photocatalysis. J. Phys. Chem. B 2004, 108, 9623–9630. [Google Scholar] [CrossRef]
- Jagodzińska, A. Determination of the Contact Angle of Titanium Dioxide-Based Coatings Produced in the Magnetron Sputtering Process. Bachelor’s Thesis, University of Rzeszow, Rzeszow, Poland, 2023. [Google Scholar]
- Navabpour, P.; Ostovarpour, S.; Hampshire, J.; Kelly, P.; Verran, J.; Cooke, K. The effect of process parameters on the structure, photocatalytic and selfcleaning properties of TiO2 and Ag-TiO2 coatings deposited using reactive magnetron sputtering. Thin Solid Films 2014, 571, 75–83. [Google Scholar] [CrossRef]
- Rudakova, A.V.; Bulanin, K.M.; Mikheleva, A.Y.; Emeline, A.V. Wettability of anatase TiO2 surface: Effect of niobium doping. Surfaces Interfaces 2024, 52, 104921. [Google Scholar] [CrossRef]
- Punitha, K.; Sivakumar, R.; Sanjeeviraja, C.; Sathe, V.; Ganesan, V. Physical properties of electron beam evaporated CdTe and CdTe:Cu thin films. J. Appl. Phys. 2014, 116, 213502. [Google Scholar] [CrossRef]
- Chen, W.-F.; Koshy, P.; Sorrell, C.C. Effects of film topology and contamination as a function of thickness on the photo-induced hydrophilicity of transparent TiO2 thin films deposited on glass substrates by spin coating. J. Mater. Sci. 2016, 51, 2465–2480. [Google Scholar] [CrossRef]
- Abdullah, M.T.; Dagher, H.F.; Abd, A.N. Study on the optical and structure properties of TiO2 for different thickness prepared by spray pyrolysis. J. Phys. Conf. Ser. 1999, 1999, 012131. [Google Scholar] [CrossRef]
- Tasisa, Y.E.; Sarma, T.K.; Krishnaraj, R.; Sarma, S. Band gap engineering of titanium dioxide (TiO2) nanoparticles prepared via green route and its visible light driven for environmental remediation. Results Chem. 2024, 11, 101850. [Google Scholar] [CrossRef]
- Fonseca-Cervantes, O.R.; Pérez-Larios, A.; Arellano, V.H.R.; Sulbaran-Rangel, B.; González, C.A.G. Effects in Band Gap for Photocatalysis in TiO2 Support by Adding Gold and Ruthenium. Processes 2020, 8, 1032. [Google Scholar] [CrossRef]
- Reyes-coronado, D.; Rodríguez-Gattorno, G.; Espinosa-Pesqueira, M.E.; Cab, C.; De Coss, R.; Oskam, G. Phase-pure TiO2 nanoparticles: Anatase, brookite and rutile. Nanotechnology 2008, 19, 145605. [Google Scholar] [CrossRef]
- Alotaibi, A.M.; Sathasivam, S.; Williamson, B.A.D.; Kafizas, A.; Sotelo-Vazquez, C.; Taylor, A.; Scanlon, D.O.; Parkin, I.P. Chemical Vapor Deposition of Photocatalytically Active Pure Brookite TiO2 Thin films. Chem. Mater. 2018, 30, 1353–1361. [Google Scholar] [CrossRef]
- Chimupala, Y.; Hyett, G.; Simpson, R.; Mitchell, R.; Douthwaite, R.; Milne, S.J.; Brydson, R.D. Synthesis and characterization of mixed phase anatase TiO2 and sodium-doped TiO2 (B) thin films by low pressure chemical vapour deposition (LPCVD). RSC Adv. 2014, 4, 48507–48515. [Google Scholar] [CrossRef]
- Lin, H.; Li, L.; Zhao, M.; Huang, X.; Chen, X.; Li, G.; Yu, R. Synthesis of High-Quality Brookite TiO2 Single-Crystalline Nanosheets with Specific Facets Exposed: Tuning Catalysts from Inert to Highly Reactive. J. Am. Chem. Soc. 2012, 134, 8328–8331. [Google Scholar] [CrossRef] [PubMed]
- Kim, D.-H.; Kim, W.-S.; Kim, S.; Hong, S.-H. Brookite TiO2 Thin Film Epitaxially Grown on (110) YSZ Substrate by Atomic Layer Deposition. ACS Appl. Mater. Interfaces 2014, 6, 11817–11822. [Google Scholar] [CrossRef] [PubMed]
- Shinen, M.H.; A A AlSaati, S.; Razooqi, F.Z. Preparation of high transmittance TiO2 thin films by sol-gel technique as antireflection coating IOP. Conf. Ser. J. Phys. Conf. Ser. 2018, 1032, 012018. [Google Scholar] [CrossRef]
- Wisz, G.; Virt, I.; Sagan, P.; Potera, P.; Yavorskyi, R. Structural, Optical and electrical properties of zinc oxide layers produced by pulsed laser deposition method. Nanoscale Res. Lett. 2017, 12, 253. [Google Scholar] [CrossRef]
- El Fanaoui, A.; Taleb, A.; El Hamri, E.; Boulkaddat, L.; Kirou, H.; Atourki, L.; Ihlal, A.; Bouabid, K. Effect of heat treatment on TiO2 thin films properties. J. Mater. Environ. Sci. 2016, 7, 907–914. [Google Scholar]
- El-Moula, A.A.; Raaif, M.; El-Hossary, F. Optical properties of nanocrystalline/amorphous TiO2 thin film deposited by RF plasma magnetron sputtering. Acta Phys. Pol. A 2020, 137, 1068–1074. [Google Scholar] [CrossRef]
- Endo-Kimura, M.; Kowalska, E. Plasmonic Photocatalysts for Microbiological Applications. Catalysts 2020, 10, 824. [Google Scholar] [CrossRef]
- Cai, P.-F.; Li, J.; Wu, X.-B.; Li, Z.-Y.; Shen, J.; Nie, J.-J.; Cui, Z.-D.; Chen, D.-F.; Liang, Y.-Q.; Zhu, S.-L.; et al. ALD-induced TiO2/Ag nanofilm for rapid surface photodynamic ion sterilization. Rare Met. 2022, 41, 4138–4148. [Google Scholar] [CrossRef] [PubMed]
Disclaimer/Publisher’s Note: The statements, opinions and data contained in all publications are solely those of the individual author(s) and contributor(s) and not of MDPI and/or the editor(s). MDPI and/or the editor(s) disclaim responsibility for any injury to people or property resulting from any ideas, methods, instructions or products referred to in the content. |
© 2025 by the authors. Licensee MDPI, Basel, Switzerland. This article is an open access article distributed under the terms and conditions of the Creative Commons Attribution (CC BY) license (https://creativecommons.org/licenses/by/4.0/).