Article

The Effect of Curing Temperature and Thickness of Polybutyl Methacrylate Siloxane Coatings on the Corrosion Protection of Structural Steel S355

1
Department of Physical and Organic Chemistry, Jožef Stefan Institute, Jamova Cesta 39, SI-1000 Ljubljana, Slovenia
2
Jožef Stefan International Postgraduate School, Jožef Stefan Institute, Jamova Cesta 39, SI-1000 Ljubljana, Slovenia
3
Laboratory for Environmental and Life Sciences, University of Nova Gorica, Vipavska Cesta 13, SI-5000 Nova Gorica, Slovenia
*
Author to whom correspondence should be addressed.
Coatings 2023, 13(4), 675; https://doi.org/10.3390/coatings13040675
Submission received: 3 February 2023 / Revised: 14 March 2023 / Accepted: 17 March 2023 / Published: 26 March 2023

Abstract

:
This study aimed to determine the effects of coating thickness and curing temperature on the properties of a polybutyl methacrylate-siloxane coating deposited on structural steel S355. First, the thermal properties of the sol as a function of temperature were investigated using thermogravimetric analysis coupled with mass spectrometry and differential scanning calorimetry. After coating deposition on structural steel S355 using a dip-coating process, the coating composition and porosity were evaluated using Fourier transform infrared spectroscopy and photothermal beam deflection spectroscopy. In the second part, coating thickness, topography, and corrosion properties were studied as functions of withdrawal rate during deposition. The corrosion properties of variously prepared coatings were evaluated using electrochemical impedance measurements in 3.5 wt.% NaCl and salt spray testing according to the ASTM B117 standard. An elevated curing temperature (at 150 °C) of the polybutyl methacrylate siloxane sol-gel coating impairs greater crosslinking and lower porosity, while the optimal thickness of 4 μm is achieved with the appropriate withdrawal rate to obtain a homogeneous, defect-free surface. Under these optimal conditions, the protection of structural steel against corrosion in a chloride environment lasting for more than 6 months can be achieved.

1. Introduction

Corrosion is a major issue, causing severe damage to integral structural metals and their alloys used in vehicles, machines, transportation, and other appliances [1,2]. To prevent or mitigate corrosion events, metal surfaces have to be additionally protected. One of the possible options is the deposition of organic protective coatings, which act as a barrier between the environment and the underlying metal [3,4,5].
Organic coatings based on hybrid sol-gel synthesis are becoming alternatives to commercially available organic coatings in various fields [6,7,8]. Their benefits can be attributed to a relatively simple synthesis under mild conditions and the use of environmentally acceptable reagents (precursors) [9] with a wide variety of functional groups [5,8]. Those functional groups allow the synthesis of a high diversity of coatings for various applications, such as corrosion protection [10,11,12,13], anti-fouling [14], self-cleaning [15,16], anti-icing [16], and self-healing [17]. Furthermore, obtained coatings have high homogeneity and transparency, excellent adhesion, corrosion performance, and durability, which are essential properties for commercial use [18,19].
Hybrid sol-gel coatings combine the organic and inorganic components with a strong covalent bond X–C (X = Si, Zr), which serves as a link between the polymer and alkoxide part [20,21,22,23,24,25]. One of the most commonly used organic precursors in the field of hybrid sol-gel coating is 3-(trimethoxysilyl) propyl methacrylate, usually abbreviated as MAPTMS, which plays the role of a cross-linker between inorganic (alkoxide) and organic (polymer network) parts. MAPTMS is a modified silicon alkoxide ((MeO)3Si–C) with a methacrylate functional group. The acrylate group is essential for networking by the copolymerisation process with other double bonds and allows the synthesis of large, homogeneous, and controlled gels. In previous studies, the polymerisations using methyl methacrylate (MMA) as a monomer and tetraethyl orthosilicate (TEOS) as inorganic precursors produced polymethyl methacrylate (PMMA) coatings with excellent protection properties in corrosion applications [10,11,12,13,26,27,28,29,30]. The contents of MAPTMS, MMA, and TEOS have been optimised by changing the molar ratio within the precursors [10,29]. Literature data also report on the possibilities of using additives to improve adhesion [11,26,27,31], rigidity, and mechanical resistance [26]. The synthesis mechanism of the final coating was studied [28]. In previous studies, siloxane-acrylate coatings containing acrylate monomers with different chain lengths were tested to attain their corrosion properties [32,33]. It turned out that ethyl- and butyl-methacrylates assured better corrosion protection of the structural steel than a shorter methyl monomer [33]. In contrast, the coatings with longer alkyl chains (hexyl, octyl, and dodecyl) showed poor corrosion resistance due to lower heterocondensation and a more significant nonpolar effect that resulted in non-homogeneous mixing, which could not produce a dense and protective coating structure [30,32,33,34]. Butyl methacrylate monomer offered excellent corrosion performance and anti-fouling properties [32,33].
The curing temperature has an important impact on the final characteristics of the coating. Usually, for the most commercially available coatings, such as epoxy resins, the curing is completed at ambient temperature in the presence of a curing agent [35]. The coatings based on acrylate demand higher curing temperatures to initiate polymerisationbetween monomers. In contrast, an epoxide group requires less energy for ring opening and forming radicals [36]. Therefore, in most studies for PMMA-siloxane, higher curing temperatures were used to complete the polymerisation of double bonds, i.e., between 150 °C [37], 160 °C [10,12,13,26,38,39,40], and 180 °C [30,32,33]. This study investigated the influence of the curing temperature on the coating properties, such as corrosion resistance and porosity, from room temperature to 180 °C. Additionally, the currently unknown thermal properties of innovative polybutyl methacrylate siloxane (PBMA-siloxane) coatings as a function of curing temperature were analysed. Only a few similar studies [10,13,39,41,42,43] were reported on polymethyl methacrylate siloxane coatings and described the thermal stability and the optimal drying temperature. In a previous study using methyl metacrylate monomer, the curing was completed at 235 °C [39].
The coating thickness is an essential parameter for assuring barrier protection against corrosion. There are several ways to affect the coating thickness in hybrid sol-gel synthesis. Less solvent would make the final sol more viscous; thus, the amount of detained sol would be larger, resulting in a thicker coating. Another way is to apply the coating by multiple immersions, producing a coating with several layers [10,12,27,28]. The third option is to control the withdrawal rate of the sample from the sol during dip-coating deposition. In most of the reported articles on acrylate-based hybrid sol-gels, a constant withdrawal rate of 14 cm/min was used to coat substrates [10,12,13,26,28,30,31,32,33,37]; only in one study was 30 cm/min used [43]. No correlation between withdrawal rate and thickness was established in the literature for polybutyl methacrylate-siloxane, and this study intended to experimentally postulate this relationship.
This work investigates the parameters affecting the preparation of polybutyl methacrylate siloxane sol-gel coating on structural steel and aims to seek the optimal combination to produce the coating with the best performance against corrosion. The following methods were used to characterise the sol and coatings prepared using different withdrawal rates (i.e., thicknesses) and curing temperatures: thermal analysis, Fourier-transform infrared spectroscopy (FTIR), and photothermal beam deflection spectrometry (PTBDS). Electrochemical impedance spectroscopy (EIS) and salt spray testing were used to investigate the corrosion performance properties of the coatings.

2. Materials and Methods

2.1. Coating Preparation

2.1.1. Chemicals and Materials

The substrate was structural steel of grade S355 J2 + N (KovinTrade, Celje, Slovenia), where J2 denotes impact testing of the steel at −20 °C and N stands for normalised rolled steel. The samples were cut into a rectangular shape of 2.5 cm × 4 cm. The S355 is a high manganese, low-carbon alloy. The chemical composition of the substrate provided by the supplier technical sheet, given in weight percentages (wt.) is C = 0.17, Mn = 1.47, Si = 0.015, S = 0.025, P = 0.011 and Fe rest.
Samples were ground using SiC emery papers (Struers, Ballerup, Denmark) of 80, 120, 240, 500, 1200, and 2400-grit to obtain a mirror-like surface appearance. Then the samples were rinsed with distilled water and dried with a stream of nitrogen before the deposition of sol.
The following chemicals were used for the synthesis of the sols:
3-(trimethoxysilyl)propyl methacrylate) (MAPTMS, 98.0%, Sigma-Aldrich, St. Louis, MO, USA), tetraethyl orthosilicate (TEOS, 99.0%, Sigma-Aldrich, St. Louis, Missouri USA), benzoyl peroxide (BPO, 97.0%, Merck, Darmstadt, Germany), butyl methacrylate (BMA, 99.0%, Alfa Aesar, Kandel, Germany), ethanol (EtOH, absolute, Merck, Darmstadt, Germany), tetrahydrofuran (THF, 99.9%, Sigma Aldrich, St. Louis, MO, USA) and nitric acid (HNO3, 70%, Sigma-Aldrich, St. Louis, MO, USA).
The corrosive medium for electrochemical measurements was 3.5 wt.% NaCl (pH = 5.7), prepared from analytically pure NaCl (98%, Merck, Darmstadt, Germany), and Milli-Q Direct water with a resistivity of 18.2 MΩ·cm at 25 °C (Millipore, Billerica, MA, USA).

2.1.2. Synthesis of Sols

The synthesis of sols proceeded by mixing two separately prepared solutions, as described [32,33]. The first sol (sol 1) was prepared from chemicals in the following molar ratio MAPTMS:BMA:H2O:BPO:EtOH = 1:8:10.5:0.08:5 in THF as solvent. For the polymerisation of sol 1, the reaction mixture was heated under reflux (70 °C) for 4 h. The sol 2 was prepared from TEOS, EtOH and acidified water (pH = 1) containing nitric acid. The second sol was then mixed with the first sol (sol 1 + sol 2) and stirred for 1 h to give the final polybutyl methacrylate siloxane-(PBMA-siloxane) sol used for deposition. The molar ratio of the components in the final sol was MAPTMS:TEOS = 1:2. The synthesis procedure was always the same; the only parameters that changed were the curing temperature and withdrawal rate, as described below in the text.

2.1.3. Coating Deposition and Curing

After synthesis, sols were deposited by a dip-coater (Bungard, RDC15) onto the steel substrate, prepared as described in Section 2.1.1. If not stated otherwise, after deposition, the samples were cured in an oven with a heating rate of 2.5 °C/min up to 180 °C and cured for an additional hour at that final temperature. The effect on curing temperature was studied at different final temperatures, i.e., 25 (room temperature), 90, 120, 150, and 180 °C.
The effect of different withdrawal rates on coating thickness and morphology was studied in the range between 1.2 mm/s (7 cm min−1) and 48.3 mm/s (290 cm min−1). If not stated otherwise, the coatings were prepared at a withdrawal rate of 2.3 mm/s, obtaining a thickness of ~3.3 μm.

2.2. Characterisation of Sols and Coatings

2.2.1. Thermal Analysis

Coupled thermogravimetric differential scanning calorimetry (TG/DSC) and mass spectrometry measurements (TG/MS) were performed for PBMA-siloxane on a Mettler Toledo TGA/DSC1 instrument connected to a Pfeiffer Vacuum ThermoStar mass spectrometer. About ~4.5 mg of the sol was placed into a 150 µL platinum crucible and heated at 10 °C min−1 from 25 to 700 °C. During the measurement, the furnace was purged with air at a flow rate of 50 mL min−1. In parallel, the empty crucible served as a reference, and the blank curve was subtracted. Evolved gases were introduced into the mass spectrometer via the 75-cm long heated capillary. The obtained signals in mass spectra were further evaluated following the most intensive and characteristic mass of each component given in mass base data [44].
The high-pressure differential scanning calorimetry (HP DSC) analysis was performed under a static air atmosphere. Measurements were conducted on a Mettler Toledo DSC 827 instrument in 40 μL standard aluminium pans in a static air atmosphere. The temperature ranged from 30 to 250 °C; the heating rate was 10 °C min−1, and the initial pressure for HP DSC was 50 bars. An empty pan served as a reference. The weight of the dry sample was 2.35 mg.

2.2.2. Chemical Composition

Fourier-transform infrared (FTIR) spectra of the sol (as a reference) and coatings cured at selected temperatures (25, 90, 120, 150, and 180 °C) were recorded using a PerkinElmer Spectrum 100 instrument with the attenuated total reflection (ATR) sampling accessory. Coated substrates were applied on aluminium alloy 7075, which is less rigid than steel and thus a more appropriate material as a substrate for the sensor top plate of the instrument with an adjusted gauge force. The spectra were recorded from 4000 to 600 cm−1 with a resolution of 4 cm−1, averaging four scans. Spectra are presented as transmittance (in %). The results are presented from 1800 to 600 cm−1, within which the band of most interest for PBMA-siloxane-appear.

2.2.3. 3-D Topography and Coating Thickness

3-D topography was determined at the surface (0.5 mm × 0.5 mm) of coated substrates using a Bruker DektakXT profilometer. The recording resolution was 0.167 μm/per point. The arithmetical mean height (Sa) was determined using the TalyMap Gold 6.2 software.
This parameter expands the profile (line roughness) parameter into three dimensions. It is generally used to evaluate the surface roughness of 3D profiles according to Equation (1) [45].
S a = 1 l x 1 l y 0 l x 0 l y | z | d x d y
The value presented is the average of three repeatable measurements. The same instrument was used to determine coating thickness. A scratch through the coating was made using a diamond blade tip through the middle of the coated sample. Along with the delaminated coating, a 3D map was made to scan the area and determine the step. Since the substrate is smooth, we can claim that the area below the layer is the substrate, which accurately represents the coating thickness as the step height [30,32,33]. The procedure was repeated at least five times at different selected areas.

2.2.4. Coating Porosity

The coating porosities were determined using a home-built photothermal beam deflection (PTBD) spectrometer [46,47]. The measurement is based on inducing a solid-state excitation laser beam (532 nm, 30 mW, BWI-532-10-E/66966) modulated by an electro-optic amplitude modulator (New Focus, Model 4102-M), temperature oscillations (TOs) in the air over the examined coating. The TOs are further probed by a gas laser beam (He-Ne laser, 632.8 nm, 3 mW, Uniphase, Model 1103P) that causes its intensity changes (ICs), which are determined by a quadrant photodiode (RBM–R. Braumann GmbH, Model C30846E) connected to a lock-in amplifier (Stanford Research Instruments, Model SR830 DSP) [46,47]. The ICs of the probe beam carry information about the opened and total porosities, which are determined by using the least-squares multi-parameter fitting procedure of the theoretical dependences describing the PBDS signal to the experimental data [46,47,48]. The total porosity is the sum of the opened (OP) and closed (CP) porosities in the coating structure. The opened porosity is defined as the volume of free channels not containing the coating’s material but filled with air, whereas the total porosity is the sum of free channel volume and free voids that are closed spaces within the coating materials filled with air. In other words, in the case of CP, the pores are not interconnected but isolated (part of the coating skeleton), whereas the pores in OP extend through the coating material from its top surface to its bottom, enabling the air to flow through the coating material.
The material’s opened and closed porosity are found by using a method of least-squares fitting procedure of the theoretical dependencies described in the literature [49] to the experimental data.
The experimental data were collected as amplitude and phase dependences on the modulation frequency of the excitation beam. During the fitting, the total and opened porosity, as well as thermal diffusivity and conductivity of the bulk material, were given trial values to get the best fit. The opened porosity determines the heat conduction in the material, whereas the closed porosity is related to the heat exchange with the surroundings. Both these processes define the values of the sample’s thermal diffusivity and conductivity and can be expressed by the relations Equations (2)–(5) [50]:
κ s = κ m 4 9 p 10 + 4 9 p 10 2 + 1 p 5 1 p 0 + p 50 c p ρ p p 0 + c 0 ρ 0 ( 1 p ) ( 1 p 0 + p ) 1
k s = k m 4 9 p 10 + 4 9 p 10 2 + 1 p 5
κ s = k s / c p ρ p
κ m = k m / c 0 ρ 0
where p0 is the total porosity, p is the opened porosity, and (p0p) is the closed porosity, κm, km, c0, and ρ0 are the thermal diffusivity, thermal conductivity, specific heat and density of bulk material, respectively, while cp and ρp are the specific heat and density of pores, respectively.

2.2.5. Electrochemical Measurements

Electrochemical impedance spectroscopy (EIS) measurements were performed at room temperature in a three-electrode corrosion cell (volume 250 mL). The working electrode was a bare and coated steel substrate with a 1.0 cm2 surface exposed to the corrosive medium. A carbon rod served as a counter electrode, and the reference electrode was saturated Ag/AgCl, (E = 0.197 V vs. standard hydrogen electrode).
Measurements were carried out with a multi potentiostat/galvanostat Autolab PGSTAT M204 (Metrohm Autolab, Nova software 2.1.3, Utrecht, The Netherlands) in the frequency range from 100 kHz to 5 mHz at a sinusoidal voltage amplitude of 10 mV (rms). EIS spectra were collected during the immersion of the coated steel sample in 3.5 wt.% NaCl under open-circuit conditions each week until they showed the first sign of degradation (a drop in impedance magnitude at low frequencies). For each coated sample, measurements were performed in at least triplicate. A representative measurement was chosen and presented in plots.

2.2.6. Salt-Spray Test

A 170 L salt spray chamber (model ASCOTT) was used for corrosion testing according to the standard ASTM B117-07A [51]. The spray solution was 5 wt.% NaCl. The total test duration was 3 weeks (504 h). The corrosive solution collected in the chamber during the test had a pH between 6.5 and 7.2. The test was carried out at 35 °C. Before testing, the samples were cross-scribed using a sharp diamond blade. The sample edges were protected with waterproof tape to prevent retention of the corrosive medium. The samples were placed in a holder, meaning that the surface was tilted at an angle of 30°. After each time point, the samples were taken out, rinsed with distilled water, and dried in a stream of nitrogen.

2.2.7. Thickness Evaluation Graph

Calculations were performed by plotting using Python 3.7 and its libraries, such as numpy, matplotlib.pyplot and scipy.optimize (Figure S1). To better visualise the scattered experimental data, many test functions were used to achieve a fitted curve with a minimum error and little to no correlations between the fitting parameters. One such successful test function was Eqaution (6).
l o g 10 | Z | 5   m H z = a 1 exp d 1 b t 2 d
where |Z|5 mHz is the measured impedance in units Ω cm2, t is the immersion time in days, and d is the coating thickness of the sample. Furthermore, parameters a and b were not arbitrarily determined but fitted with the experimental data. The Levenberg-Marquardt [52] method was used to determine the parameters as a = 9.6 and b = 0.0015 with a minimal root mean squared error of 1.30 Ω cm2, and the covariance matrix was also calculated (Figure S1).

3. Results and Discussion

3.1. The Effect of Curing Temperature on Structure and Corrosion Resistance

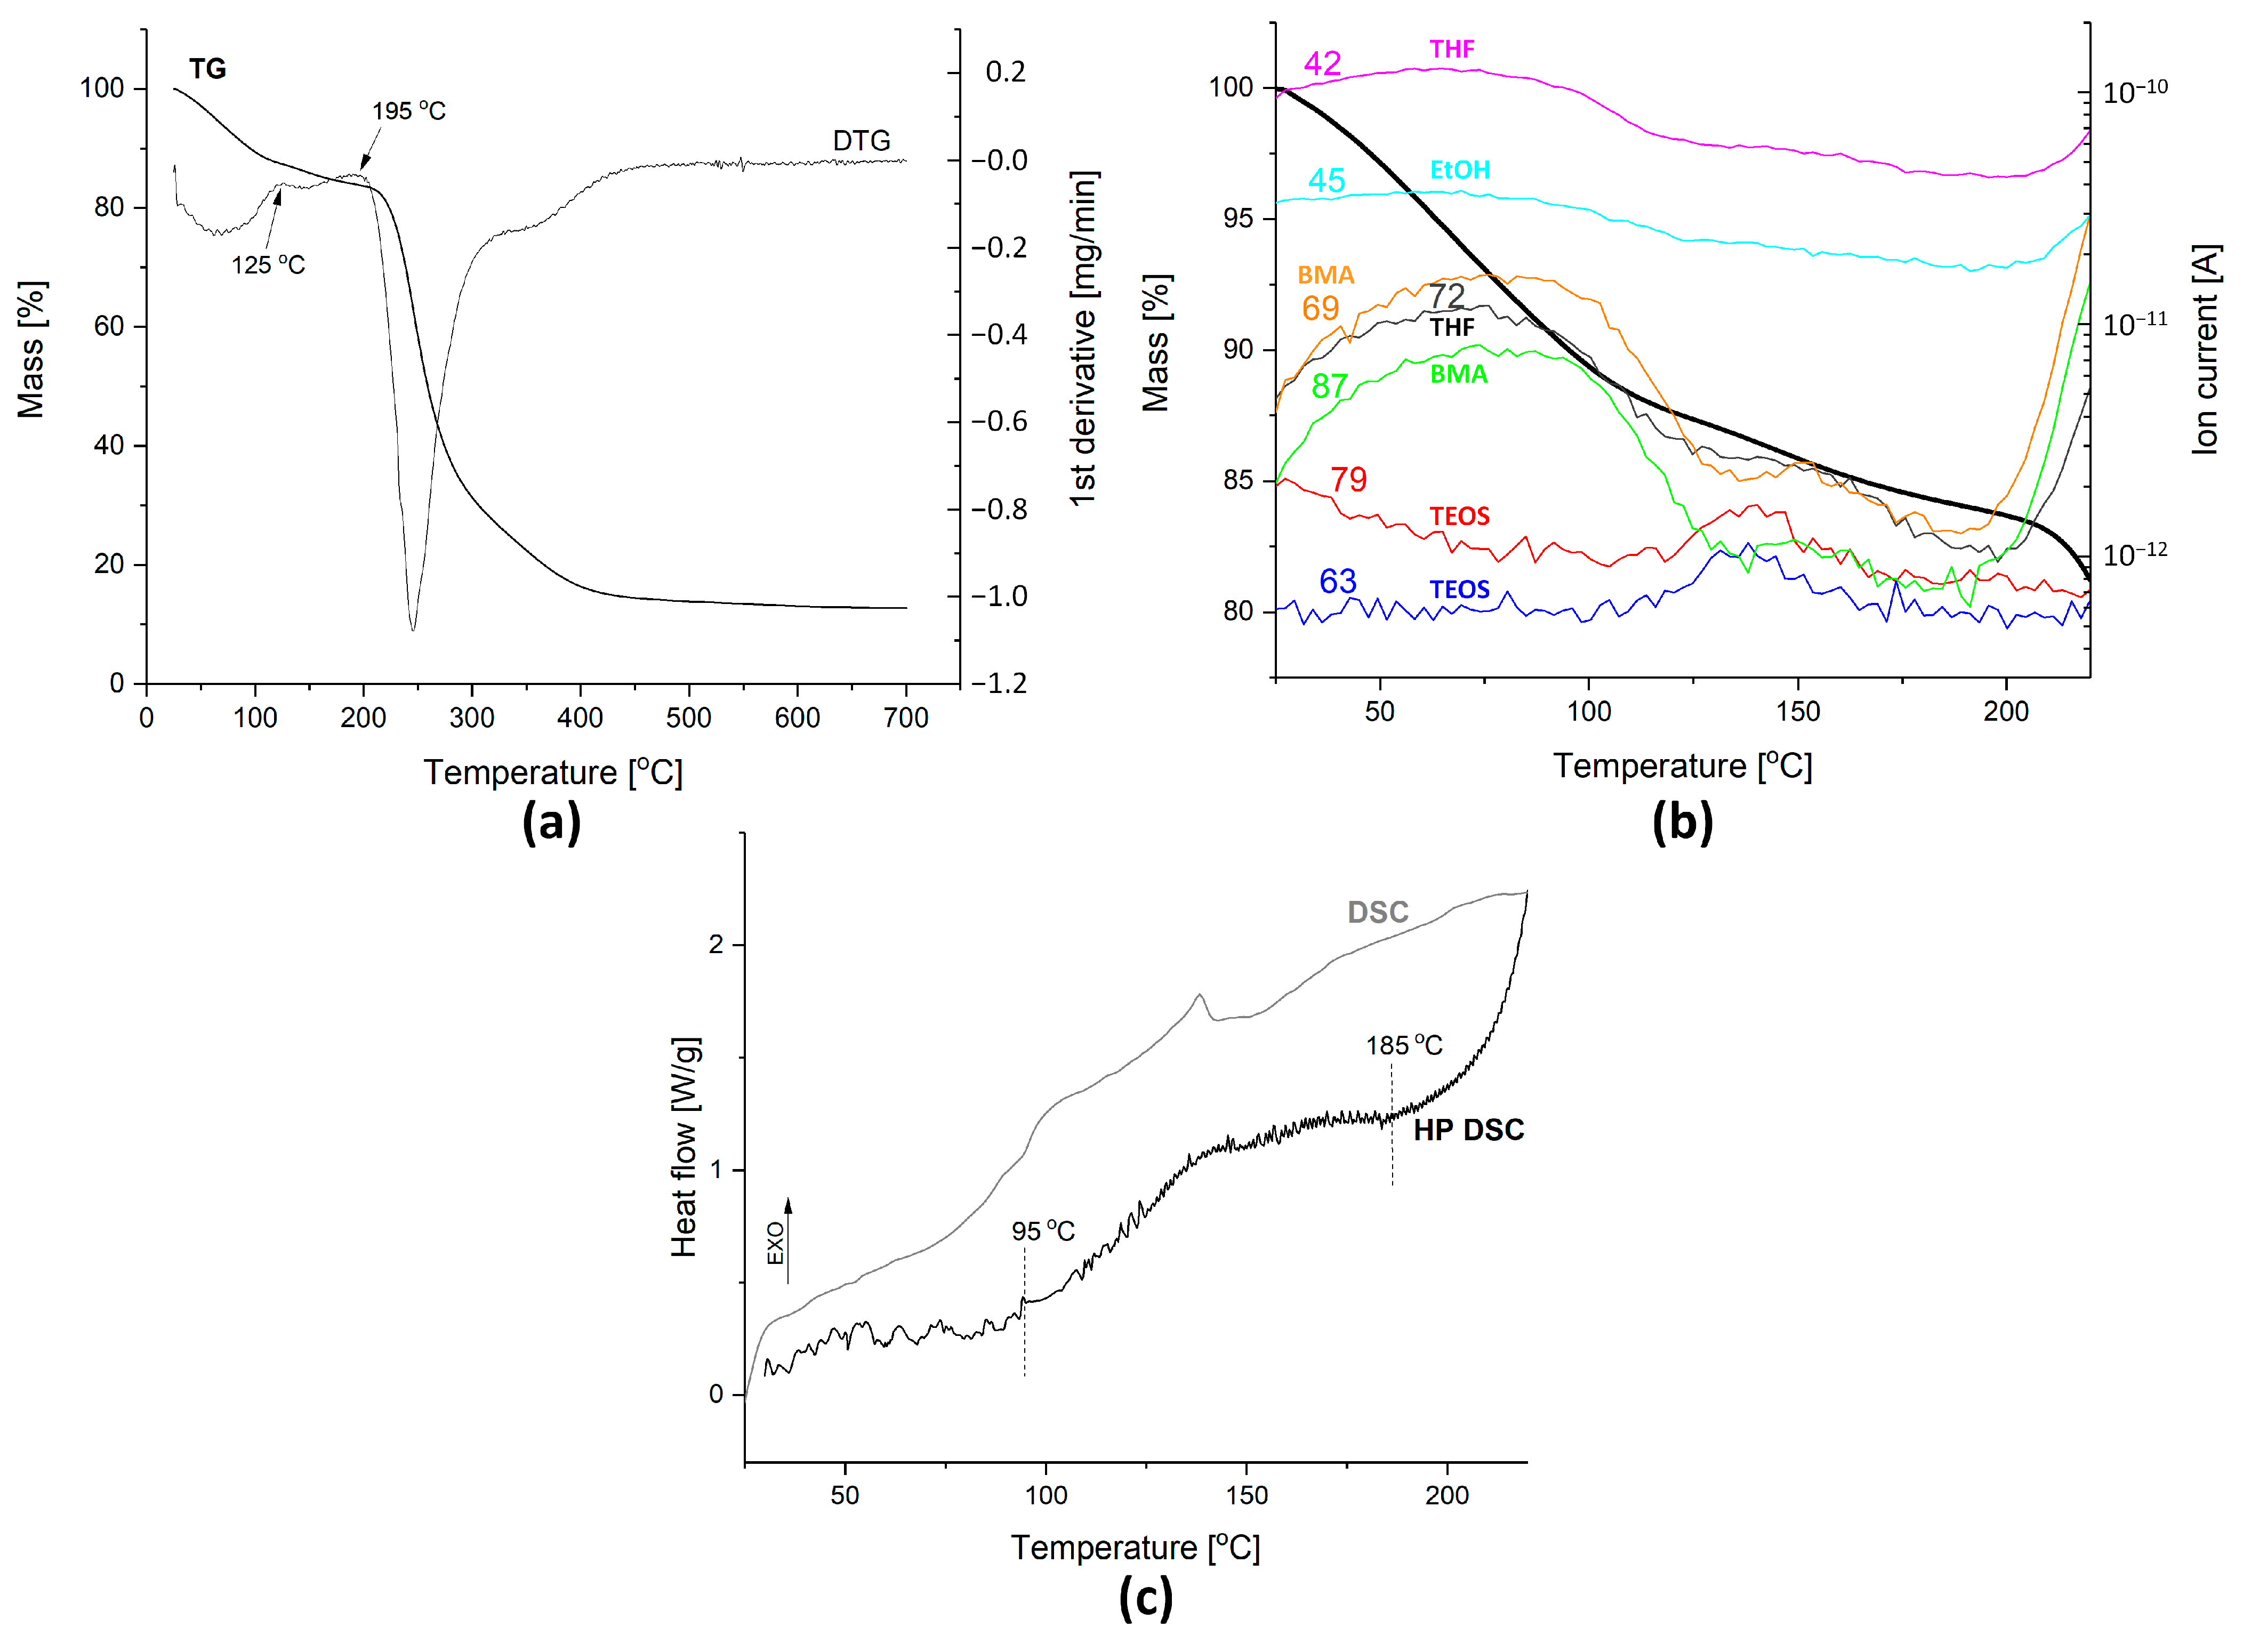
3.1.1. Thermal Analysis

The curing process and thermal stability of the PBMA-siloxane-solution were studied using simultaneous thermogravimetric differential scanning calorimetry and coupled mass spectrometry (TG/DSC and TG/MS) thermoanalytical methods (Figure 1). The experiment was performed starting from room temperature and increasing to 700 °C under airflow to follow mass changes during the process and obtain a final thermal decomposition of all organic components (reaching the constant mass). Sol-gel coatings are suitable for applications below 200 °C; therefore, the presented results mainly focus on the processes in this temperature range.
During the heating of the sample, successive steps of mass loss at different temperature ranges were noticed on the TG curve (Figure 1a). More precisely, the thermogravimetric curve reflects four steps: (i) the solvent and residual reagents evolution up to 125 °C, (ii) copolymerisation between acrylate groups of BMA and MAPTMS and condensation (dehydration) between silanol (Si–OH) groups forming covalent bonds of the siloxane-network (Si–O–Si) from 125 to 195 °C, (iii) thermal decomposition of the organic part (monomer and head-tail segments) of the sol above 200 °C, and (iv) formation of inorganic silica (SiO2) above 320 °C.
The DTG curve (Figure 1a) details the separate temperature steps. The first event starts at ambient temperatures, and the minimum in the DTG is related to the maximal evaporation rate of liquids used in the preparation (THF, ethanol, and H2O), side products of hydrolysis (ethanol from TEOS and methanol from MAPTMS), and condensation reaction (H2O). The evaporation was additionally confirmed with characteristic MS spectra (Figure 1b). The most intense signals detected with a mass spectrometer arise from the main chemical precursors used to synthesise PBMA-siloxane are unreacted BMA (69 and 87 m/z), and solvent THF (42 and 72 m/z) [44] (Figure 1b). The characteristic signal for ethanol is 45 m/z. In contrast, the signal for water was low due to its high background in the mass spectrometer. The weight loss up to this point was 12.6%.
The second step ranged from 125 to 195 °C. A slight decrease in the DTG curve is observed due to the formation of a more stable covalent bond associated with eliminating the hydroxyl groups (dehydration), which leads to the formation of a Si−O−Si structure. This part is essential for understanding the curing temperature needed to form a denser, more crosslinked siloxane coating. This process was completed at 195 °C. The weight loss in the second step was 3.5%. A small part of the signal intensity (at 63 and 79 m/z) can be related to the evaporation of the initial TEOS due to its low boiling point (168 °C). The evaporation of the THF solvent and the BMA precursor trapped in the siloxane matrix was noticed. The signals for the fragments of TEOS were again noticed in the MS spectra, with the maximum at 140 °C. In addition, the results show clearly that the addition of BMA instead of MMA in the siloxane affects the curing process (the curing was completed at 195 °C using BMA instead of 235 °C using MMA [10,39]).
The third step is related to the decomposition of the organic part of the siloxane sol above 200 °C. With the addition of BMA instead of MMA, all depolymerisation events were shifted to lower temperatures [39].
The last step starts at 320 °C, is completed near 480 °C, and is related to the formation of SiO2 from partially condensed silanol (SiOx(OH)y) species. In the whole testing range, the mass loss was 87.2%.
The temperature range of the polycondensation reaction was determined by more precise high-pressure DSC (HP DSC). This method gives more detailed information about the exothermic effects during curing reactions of siloxane sol, which are usually hidden in other calorimetric methods due to the endothermic evaporation of gaseous species. In Figure 1c, a visible exothermic peak appears on a DSC curve in the temperature range between 95 and 185 °C. The temperature, which determines the optimal curing temperature, is much easier to determine from HP DSC. The well-defined broad peak with a maximum positioned at 145 °C reflects the optimal PBMA siloxane curing temperature. The temperature region of the exothermic signal in the HP DSC curve corresponds well with the second step of the TG/DTG and MS curves, where condensation reactions occur. Again, the optimal curing temperature differs from other PMMA-siloxane coatings (usually at 166 °C) [39] due to differences in MMA or BMA monomers in the sol, which affect the copolymerisation and condensation reactions.

3.1.2. Chemical Composition and Bonding

The effect of the curing temperature at selected temperatures (25, 90, 120, 150, and 180 °C) on the coating composition was additionally evaluated using FTIR. As a reference, the spectrum of the as-prepared sol was added to the graph (Figure 2a).
The spectra for the coatings cured at selected temperatures showed the same band positions for coatings between 1800 and 600 cm−1. However, there were some differences in the band intensity of characteristic bands for PMBA-siloxane bands and the acrylate group changing as a function of temperatures (Figure 2a). The most pronounced changes are observed for the intensities of bands at 940 and 1060 cm−1, which refer to the condensation of siloxane bonds. In the range between 1000 and 800 cm−1, which is characteristic for Si–O bonds, the intensity of the bands for coatings cured at 25 °C was much higher than for those cured at higher temperatures. The opposite trend was observed for bands between 1100 and 1000 cm−1, where coatings cured at higher temperatures have higher band intensities. Bands in this range are characteristic of Si–O–Si bonds; curing at higher temperatures tends to improve polycondensation, and consequently, the proportion of unreacted Si–O in the coatings is lower than at lower temperatures [22,23,53].
With the increase in curing temperature, the intensities of the band at 1060 cm−1 increased, and the bands at 945 and 844 cm−1 decreased, confirming a greater degree of polycondensation. Other band intensities in the spectra, such as the band for Si–C at 750 cm−1, remain constant for coatings despite curing at various temperatures. These results reflect that the composition of coatings did not change with increasing curing temperature.
The insert of the region of C=C double bonds at 1636 cm−1 (Figure 2b) indicates that the band intensity was reduced as a function of curing temperature. The coating at 25 °C did not undergo polymerisation, confirming that the copolymerisation in the presence of BPO has to be thermally activated. The benzoyl peroxide BPO can be fully activated at around 100 °C [54,55,56]. In this study, propagation of the prepared radicals and copolymerisation of acrylate groups were already partly achieved during synthesis (at 70 °C). The main difference in the degree of copolymerisation, i.e., in the band intensity of C=C, was noticed after curing at 90 °C. Similar behaviour was also noticed in the carbonyl bond (C=O, 1724 cm−1) (Figure 2c), where the band’s intensity increased due to a decrease in the number of interactions with the remaining C=C bond (C=C…C=O) [39]. Curing at higher temperatures (above 90 °C) did not significantly affect the copolymerisation because the C=C band intensities remained similar, and the rest can be related to unsaturated chain terminations.

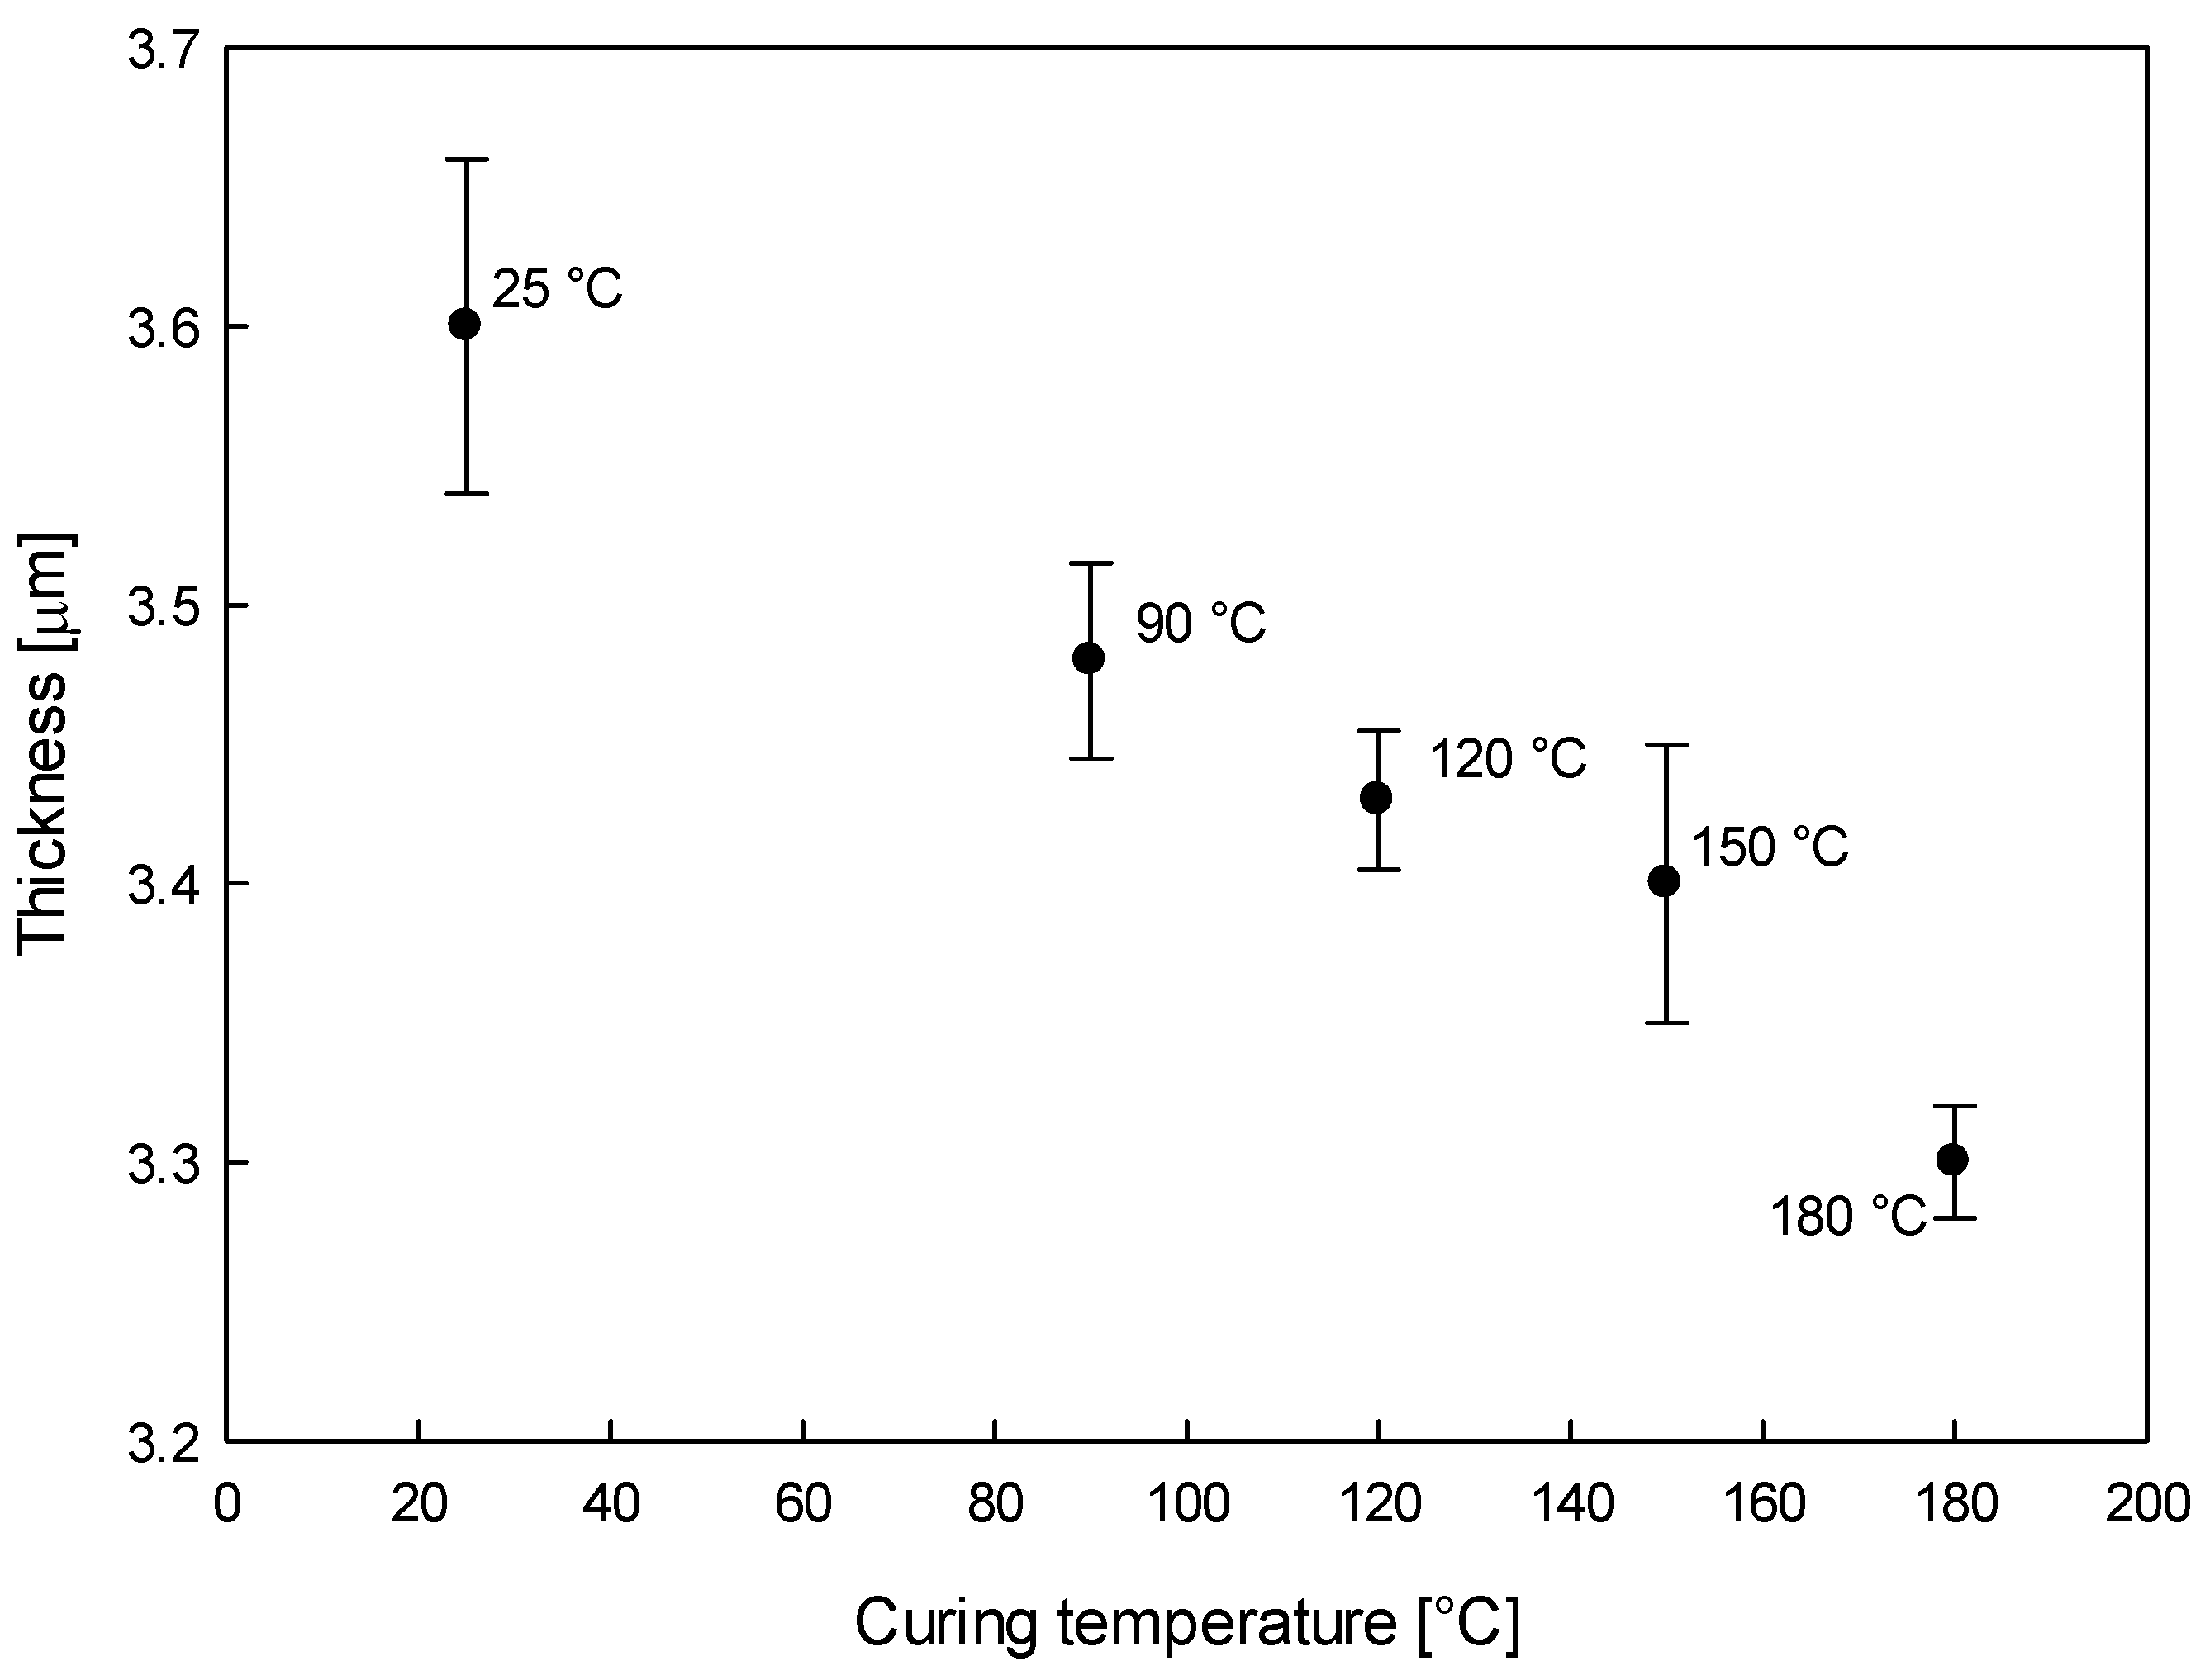
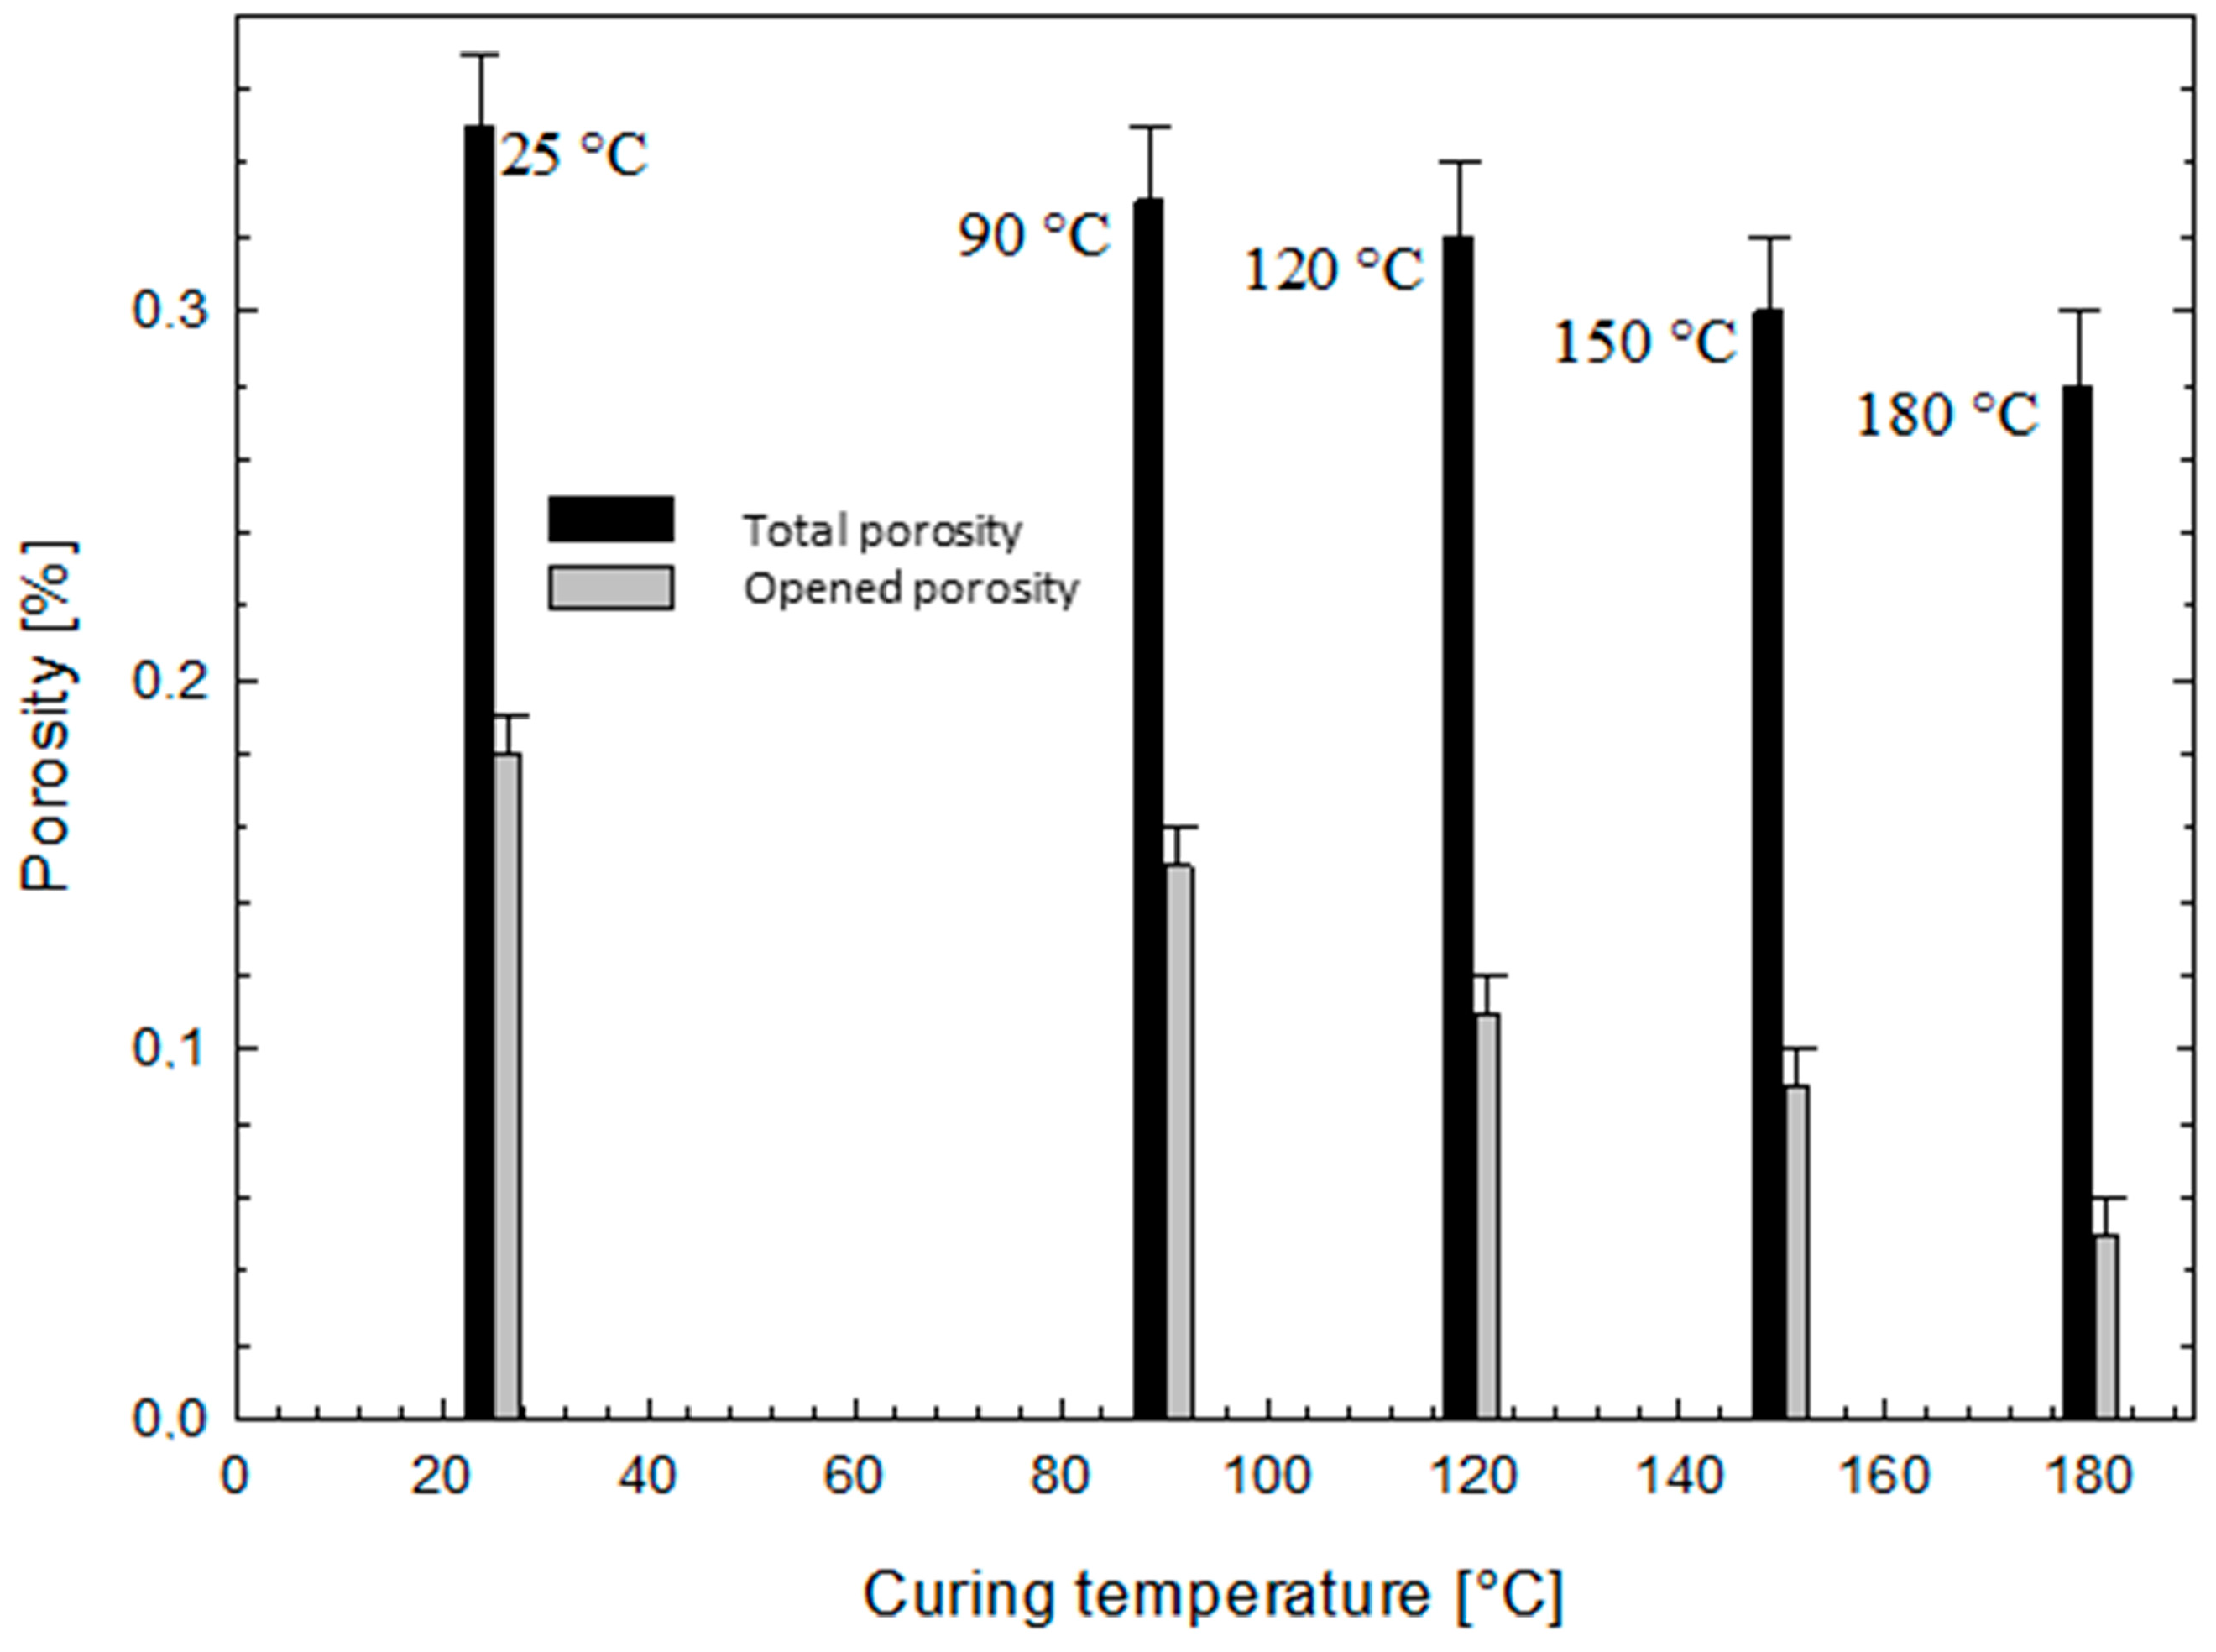
3.1.3. Coating Thickness and Porosity

Figure 3 presents the effect of different curing temperatures on coating thickness. All samples were prepared with the same composition and applied at the same withdrawal rate of 2.3 mm/s. The coatings thicknesses were in the range of 3.3–3.6 µm. The thickness of the coating cured at 25 °C was 9% thicker than at 180 °C, which could be the consequence of more intense solvent evaporation leading to the shrinking of the coating at higher temperatures (Figure 3).
Figure 4 shows the results obtained for opened and total porosity. The lowest total porosity of the final coating was obtained at the highest curing temperature (180 °C). The total porosity is defined as the sum of opened and closed porosities in the coating structure (free channels volume (opened porosity) or both free voids and channels volume (total porosity) divided by the total volume of the coating), as explained in the Experimental Section 2.2.4 Coating porosity The total porosity almost linearly increases with lower curing temperatures. Applying the sol to a surface followed by curing at elevated temperatures results in a more intensive shrinking and, consequently, a more compact structure [57,58]. Coatings cured at lower temperatures are thicker (Figure 3) but more porous (Figure 4) than those cured at elevated temperatures.

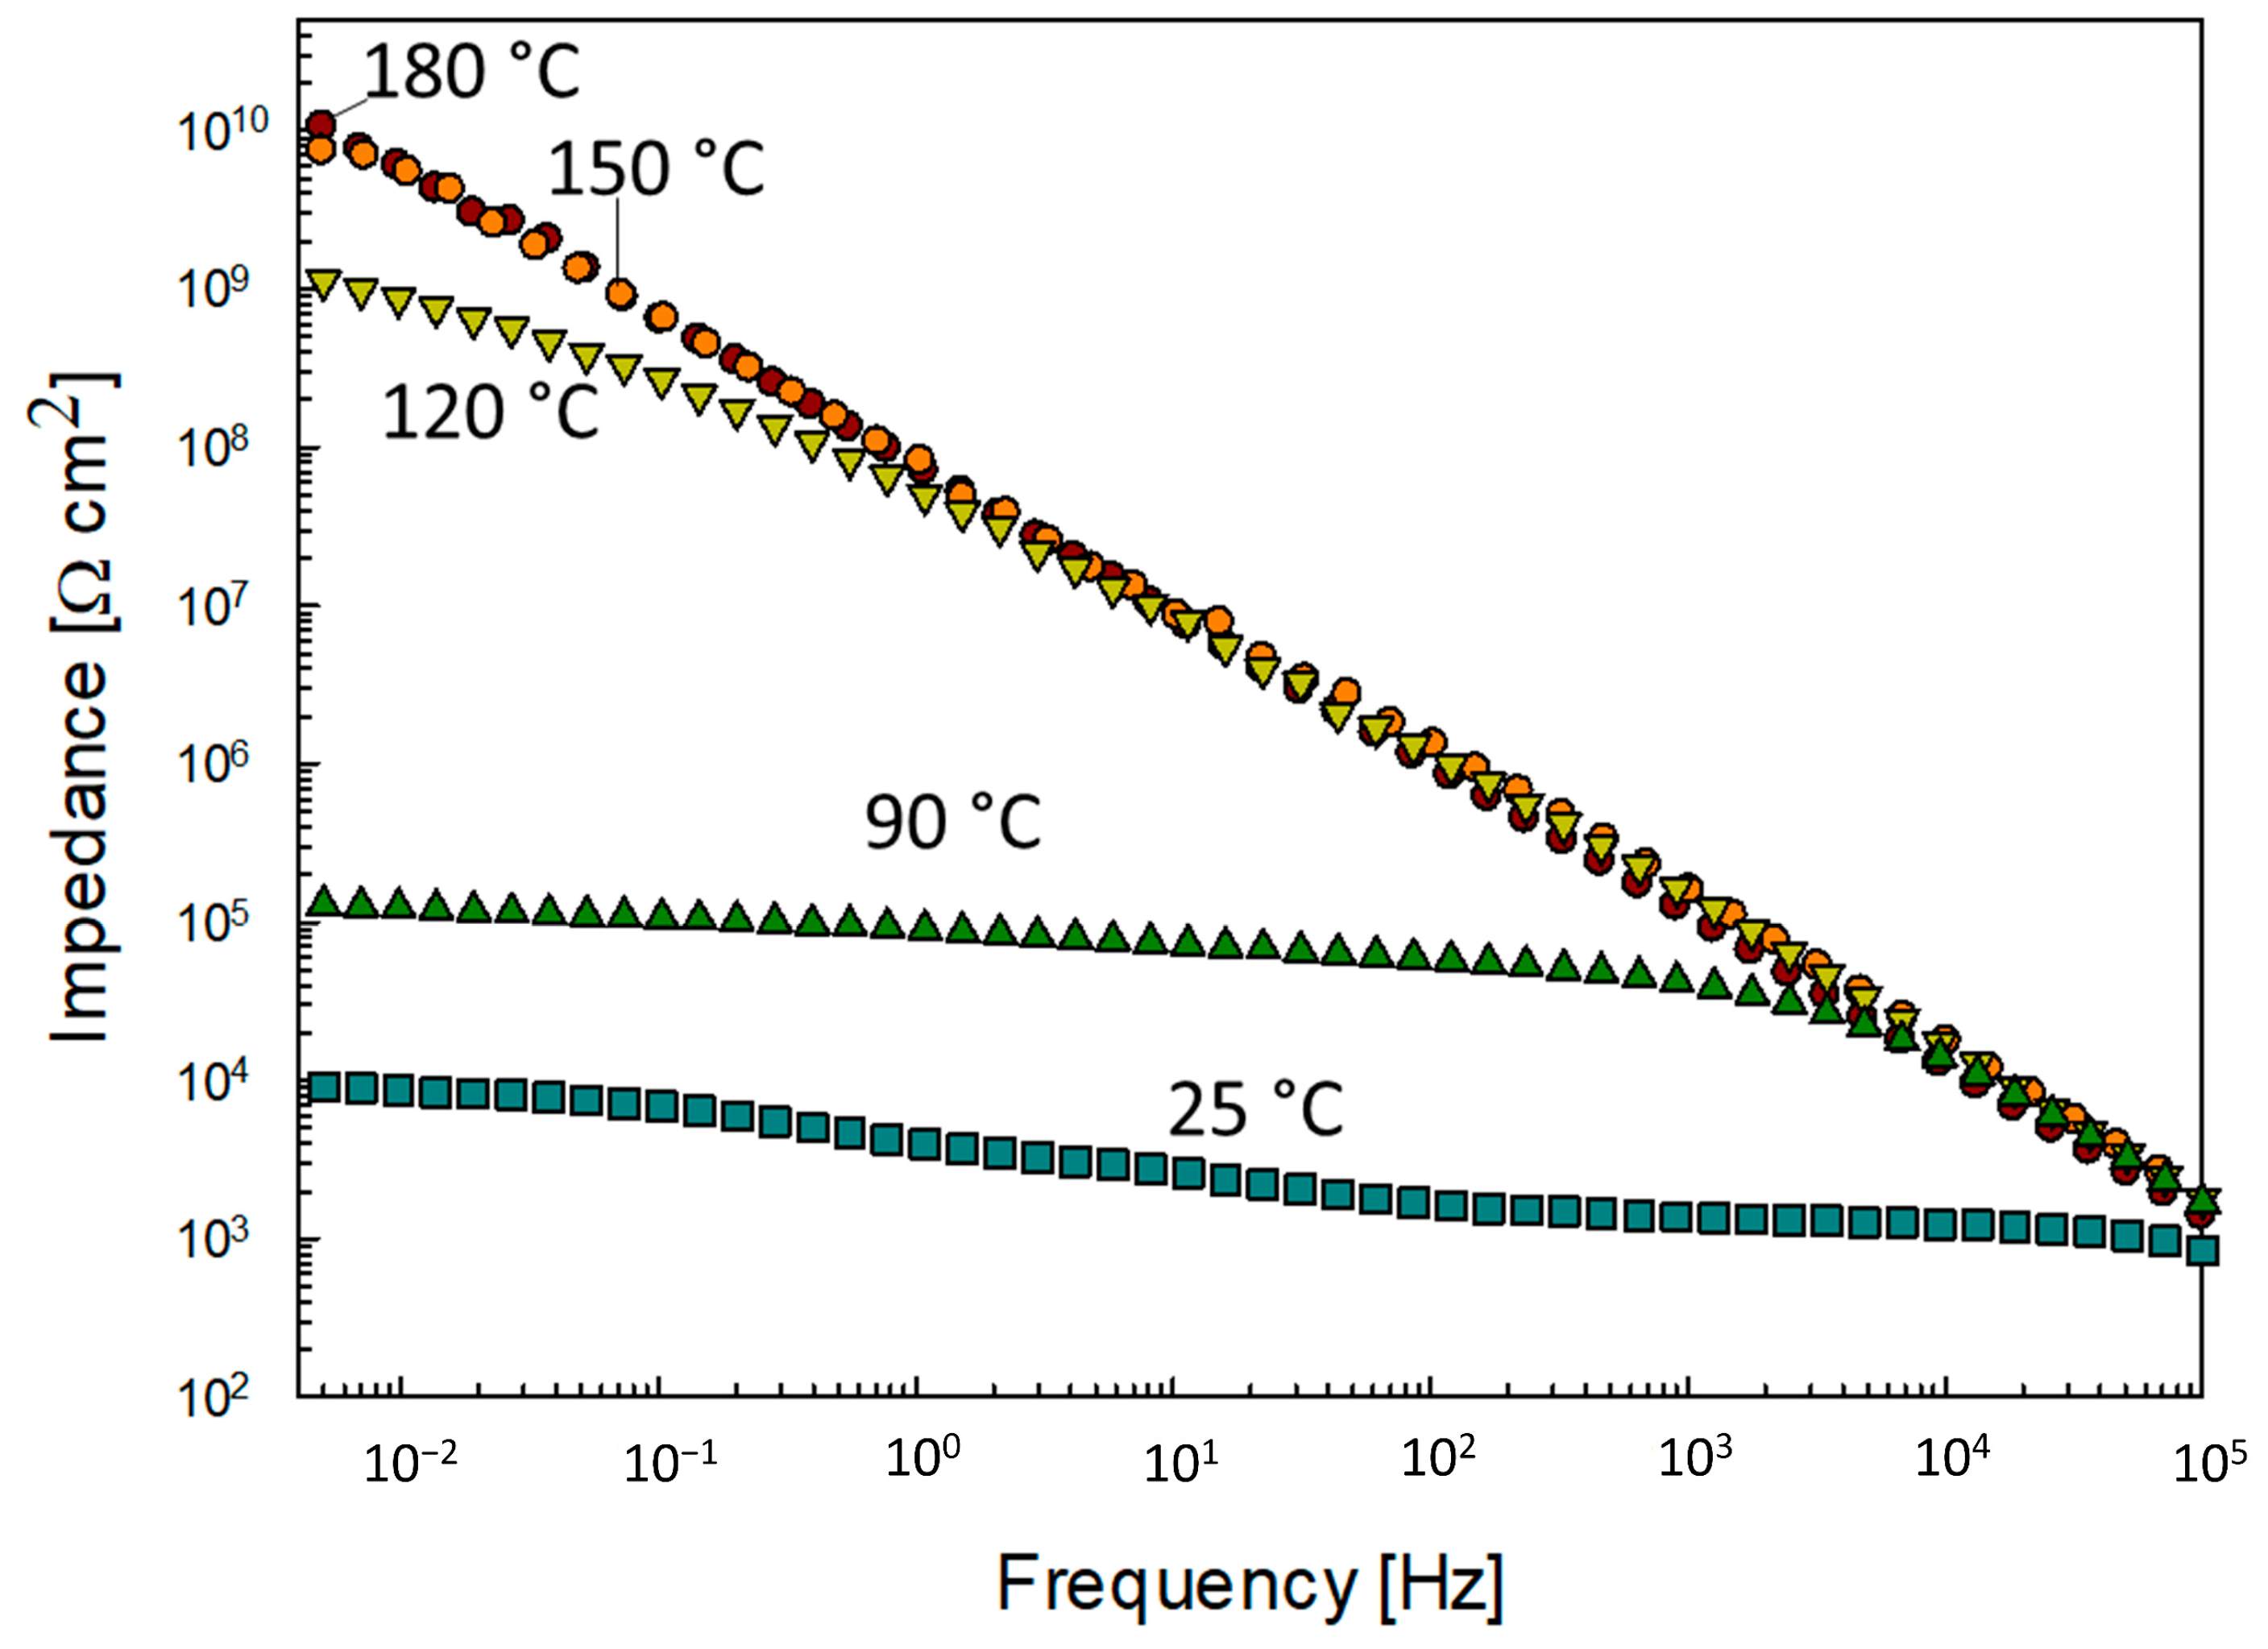
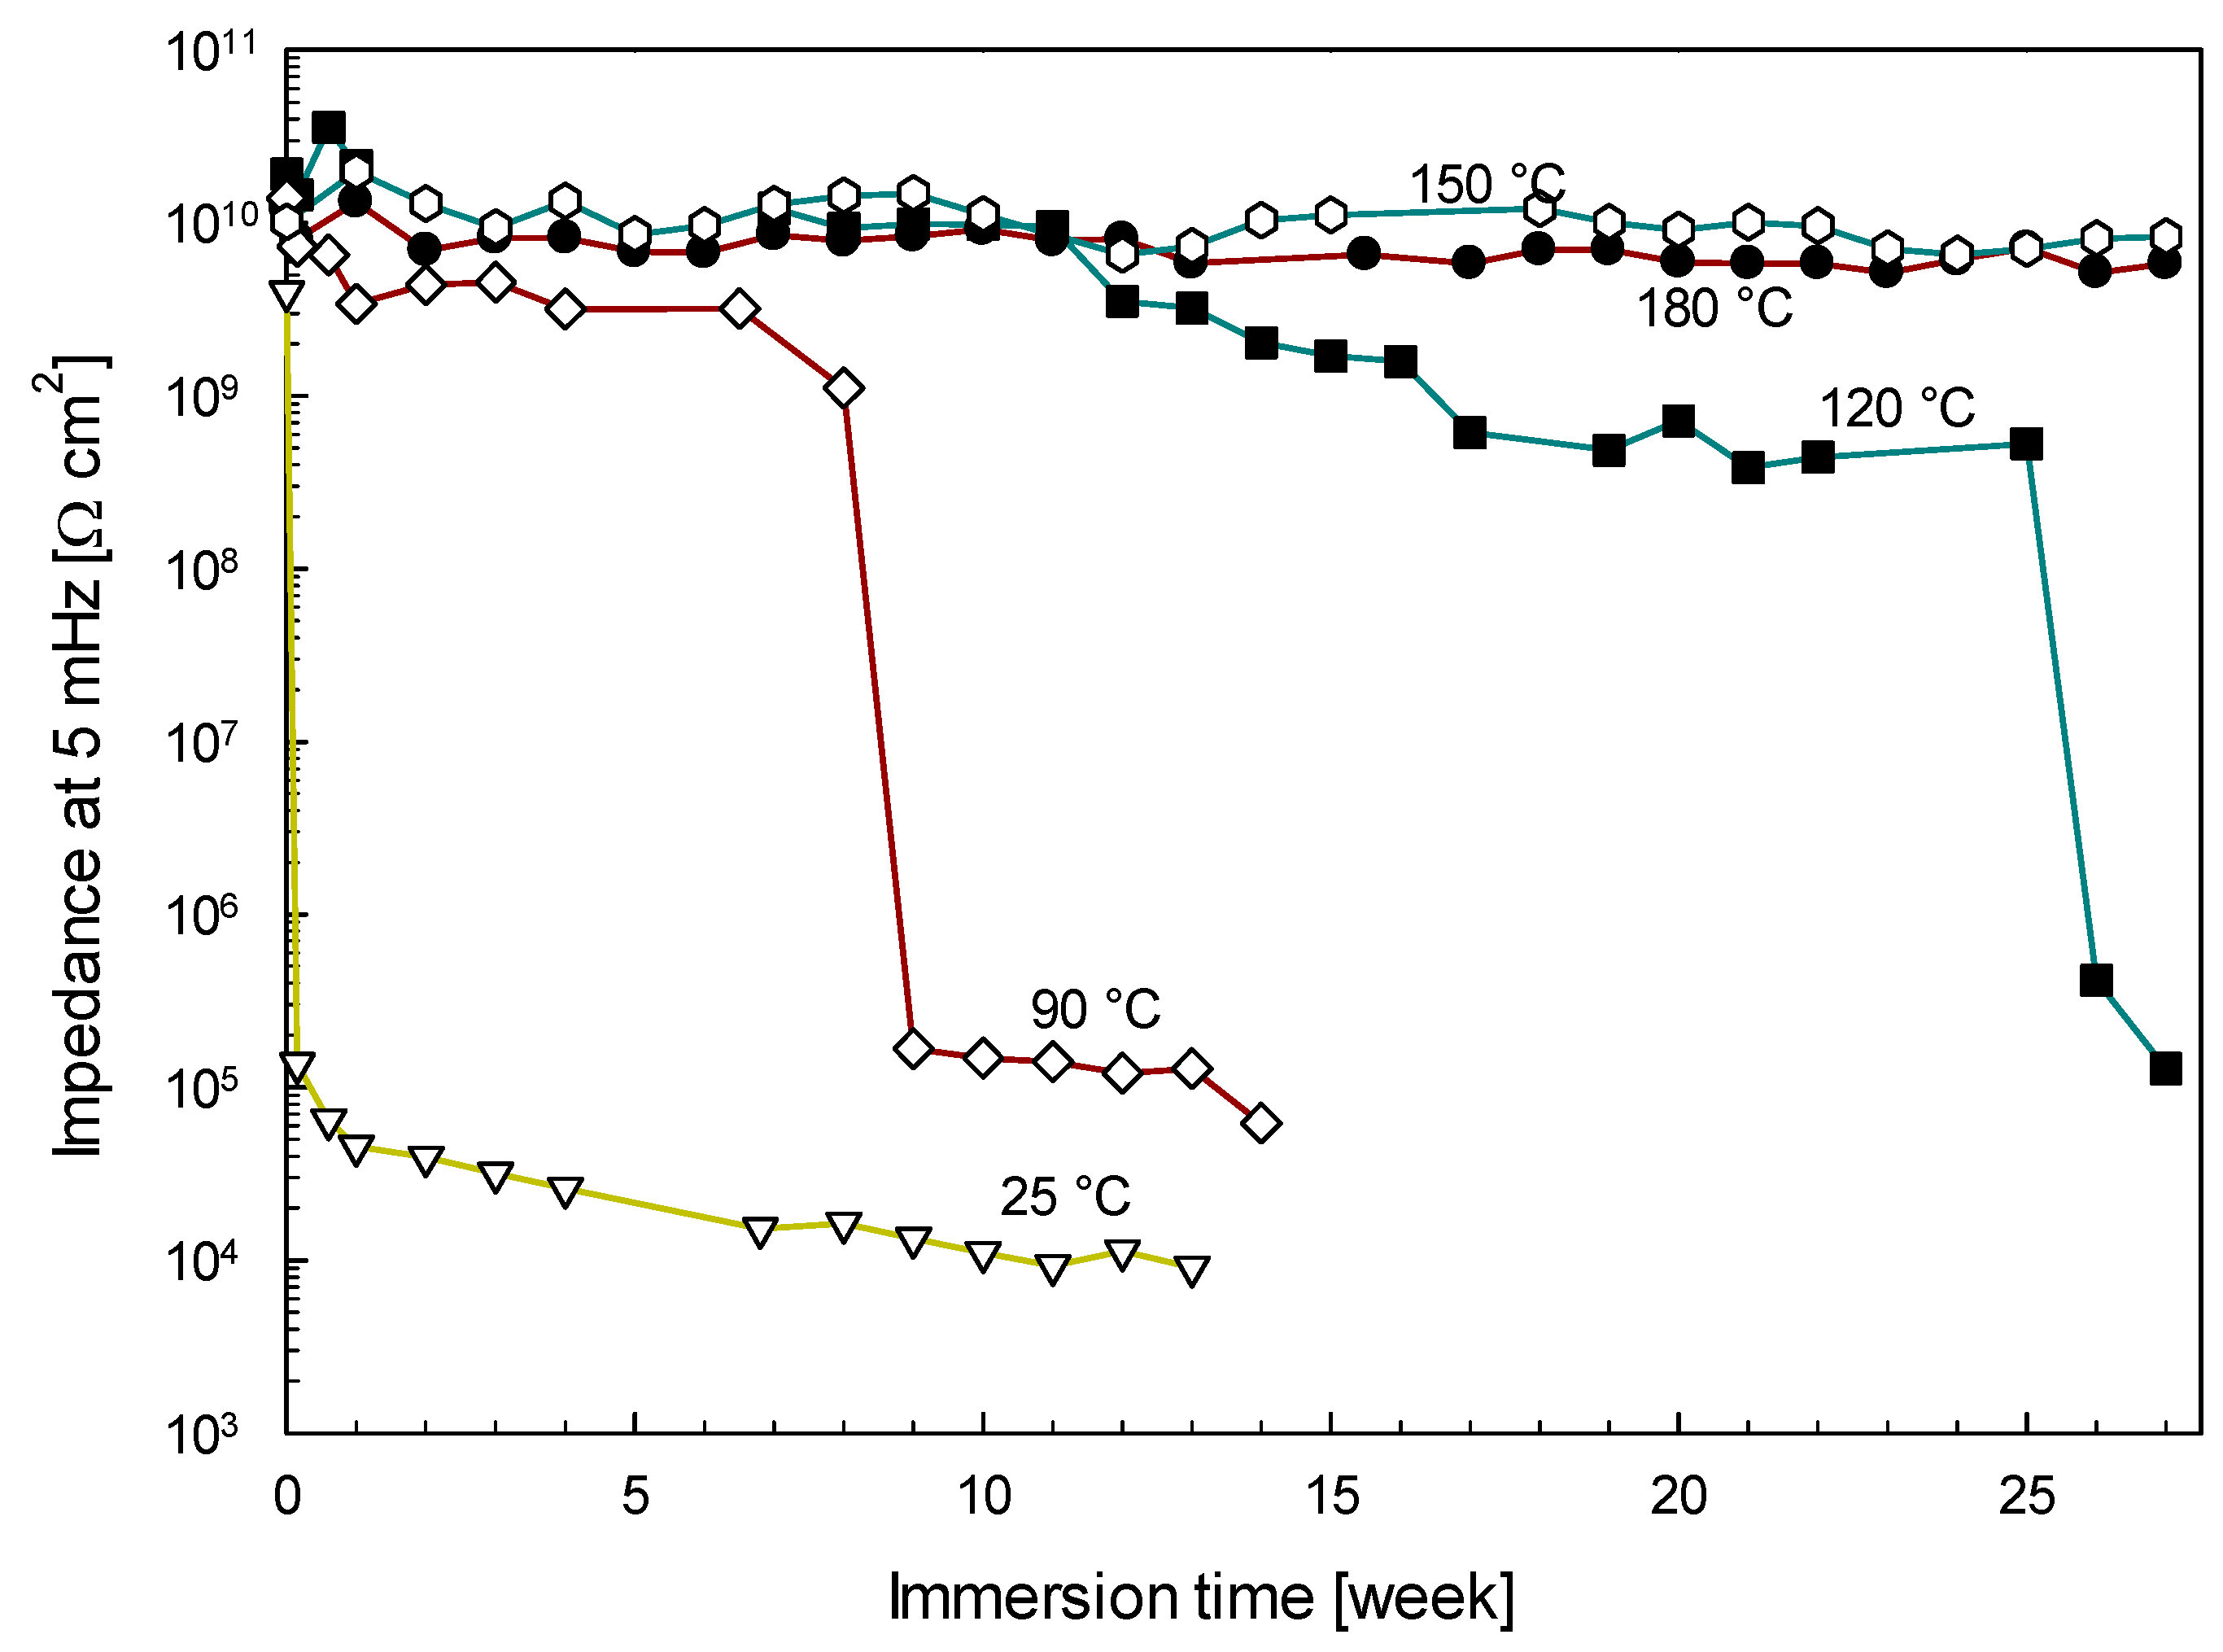
3.1.4. The Effect of Curing Temperature on the Corrosion Resistance

Previous studies [32,33] showed that PBMA-siloxane exhibited better corrosion protection than PMMA-siloxane when cured at 180 °C. We investigated in this study whether the change in curing temperature would affect the corrosion properties of PBMA-siloxane. After curing at various temperatures, coatings deposited on structural steel were immersed in 3.5 wt.% NaCl, and the EIS measurements were carried out. Spectra recorded for each curing temperature measured at different immersion periods are presented in Figure S2. The representative spectra for the coatings cured at different temperatures and measured after 13 weeks are presented in Figure 5. As a quantitative measure of coating corrosion resistance, the impedance magnitude at 5 mHz was taken (|Z|5 mHz). Namely, the impedance at low frequency reflects the corrosion process at the interface metal/coating [30,32,33,39].
The decrease in curing temperature by 30 °C (from 180 to 150 °C) did not induce any significant change in corrosion protection performance (expressed as |Z|5 mHz) (Figure 6). The first negative sign of insufficiently high curing temperature was observed at 120 °C, where the coating followed the same properties as at high temperatures for 3 months, and then the |Z|5 mHz started to decrease slowly. Curing at 90 °C gave even worse results, with the coating being protective for only 2 months before it started to corrode. The worst result was obtained with the coating dried at 25 °C, and this sample started to corrode after 1 day of immersion. The presented results prove that a higher curing temperature is an essential final step for optimal corrosion protection. This is aligned with the results on total porosity, which almost linearly increased with lower curing temperatures (Figure 4). A similar observation for lower corrosion resistance was already reported in our previous study, where coatings with longer alkyl chains on methacrylate had larger porosity, resulting in lower corrosion protection performance [32].
Images of steel samples coated with PBMA-siloxane coatings cured at different temperatures are presented after exposure to laboratory corrosion testing in a salt spray chamber in Figure 7. The figure does not include a bare steel substrate since it corroded after only one hour in a salt chamber environment. Coated samples were scribed to induce artificial defects for faster deterioration under harsh conditions of high chloride concentration and elevated temperature. The test lasted up to 3 weeks. After a few hours of exposure, all samples showed the first signs of corrosion on defects, where the unprotected steel was exposed to an aggressive environment. Corrosion began to spread outward in these parts, initially uniformly for all samples. After 0.5 weeks, the first significant changes appeared among the coatings. The corrosion spread faster for the sample dried at 25 °C than for other samples. After 1.5 weeks, the difference became even more apparent. The first signs of more significant corrosion damage were noted for the coating cured at 90 °C. With more prolonged exposure to an aggressive environment (2 weeks), differences in coatings cured at lower temperatures became more pronounced, accompanied by coating delamination. At the end of the experiment (3 weeks), the sample that had dried at 25 °C had corroded entirely. Signs of heavy corrosion damage were also visible for the sample cured at 90 °C and slightly less for the sample cured at 120 °C. The samples cured at 150 and 180 °C showed the best corrosion protection, proving that the curing temperature is crucial for achieving durable corrosion protection.

3.2. The Effect of Withdrawal Rate on Coating Properties

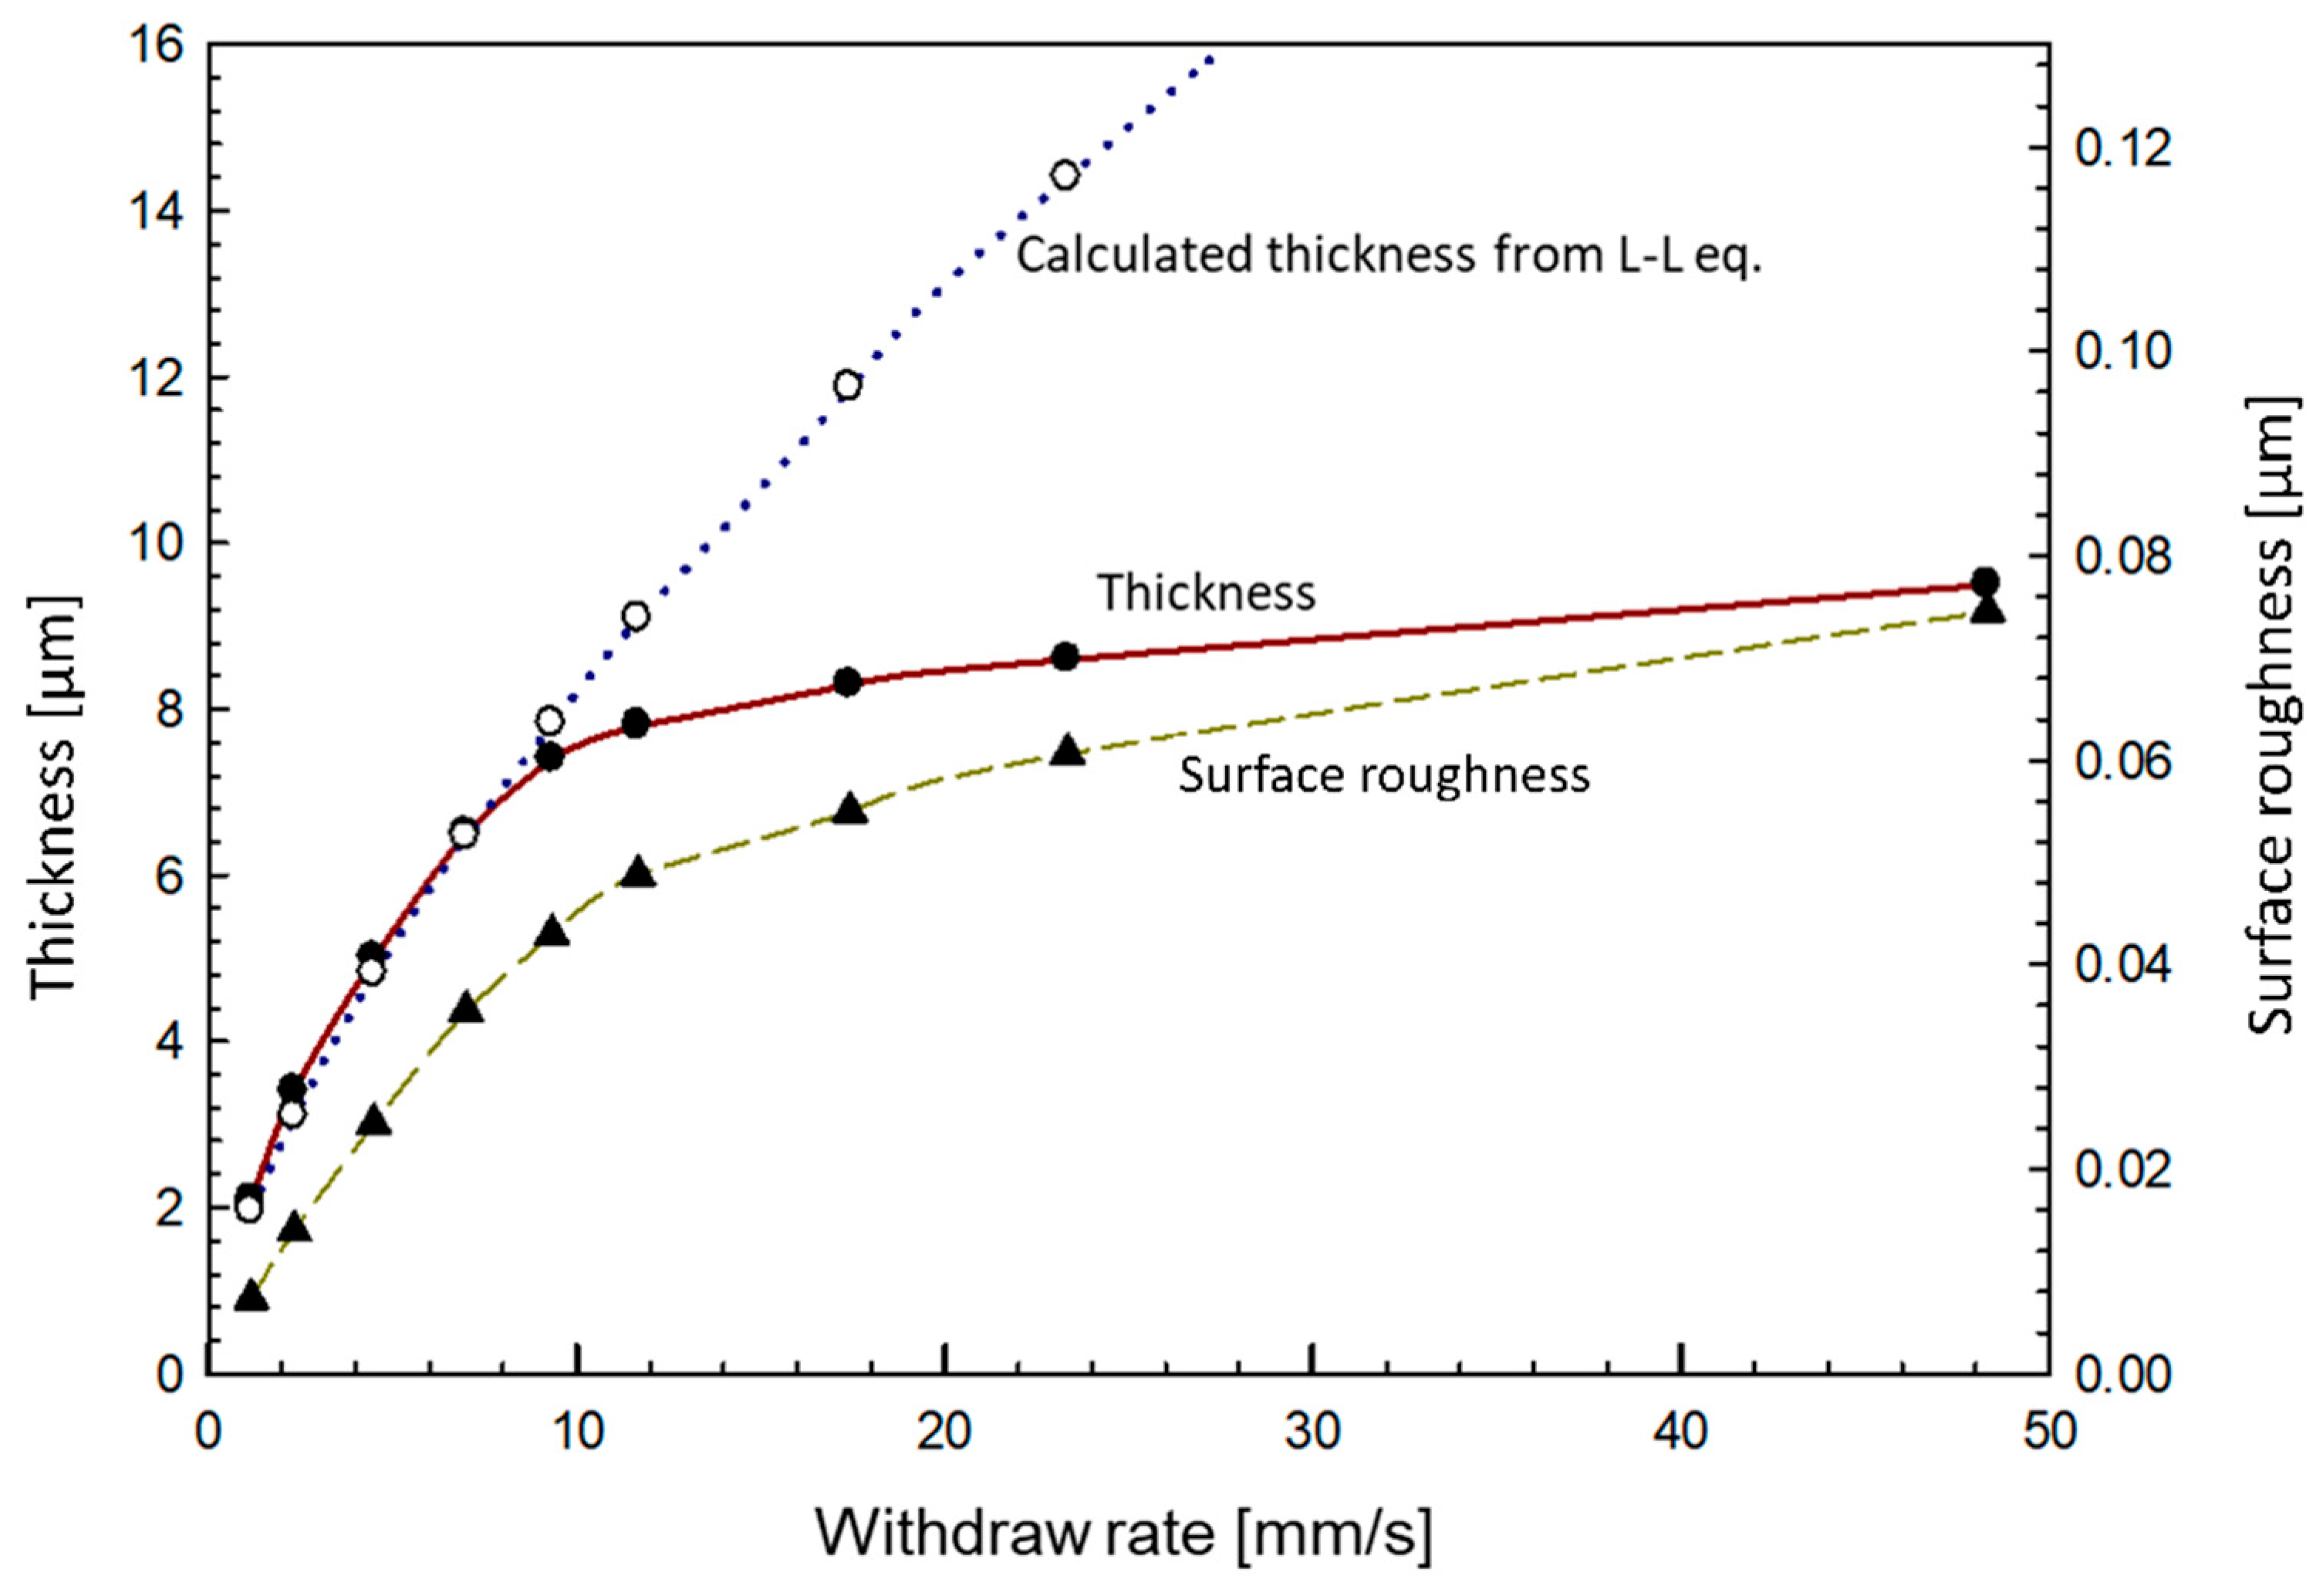
3.2.1. Coating Thickness and Topography

Here, the effect of the withdrawal rate on the thickness and topography of the coatings was studied. In previous studies [10,12,27,28], the withdrawal rate for acrylate-based sol-gel was 14 cm/min (2.3 mm/s). Figure 8 presents the withdrawal rate of PBMA-siloxane sol in the range from 1 to 50 mm/s.
The thickness increased linearly with the withdrawal rate up to 8 mm/s (gaining 0.9 µm for every 1 mm/s, from 2.3 to 7.4 μm). This linear behaviour results from a balance between the time scales of gravitational drainage and the evaporation of the solvent [59]. At a certain point, a limiting withdrawal rate is reached when the influence of gravity becomes comparable to that of evaporation. In addition, this relationship may be limited due to the physical properties of the coating material and surface properties (e.g., surface tension and density/viscosity of the sol). These can be seen when thickness has stabilised (gaining 0.039 µm for every 1 mm/s).
The further increase in withdrawal rate did not significantly change thickness. The change in the slope was attributed to the fact that the sol viscosity and draining regimes had no further impact on thickness [60,61,62]. Under those conditions, the deposited sol is too thick for gravity viscous drag to be in the ratio by the adhesion [63], resulting in a thicker coating as more material accumulates on the substrate.
The arithmetical mean height (Sa) of the coating, in the size area of 500 μm × 500 μm, was used to express the surface roughness. Sa followed the trend with the thickness, increasing from Sa = 0.007 µm at a low withdrawal rate (1.17 mm/s) to a 10 times rougher surface Sa = 0.064 µm, with a withdrawal rate of 48.3 mm/s (Figure 8). The increase in surface roughness was related to the change in topography (Figure 9) from very smooth at a low withdrawal rate ≤2.3 mm/s to the appearance of first domains at 4.5 mm/s. This is because the coating material is more likely to form irregularities and defects when pulled away from the substrate. These irregularities can create peaks and valleys on the coating surface, resulting in a rougher texture. Those domains became more pronounced and transformed from round-shaped domains into rectangular ones at higher withdrawal rates due to a thicker coating, the formation of thickenings at a higher withdrawal speed, and shrinkage of the coating during drying. At the centre of round-shape domains, the roughness remained low (e.g., blue coloured in Figure 9i), but the average surface roughness of the whole measured area increased due to a topography change.
For a better explanation of the effect of withdrawal rate on the coating thickness, the growth was modelled according to the Landau-Levich model (L-L model), Equation (7), which is typically used for rates in the range of 1–10 mm/s and with low liquid viscosity (sol-gel) [64,65].
h 0 = c ( η U 0 ) 2 3 γ L V 1 6 ( ρ g ) 1 2
h0 is the thickness, c is the constant [0.94], γ is the surface tension [N/m], ρ is the density [kg/m3], η is the liquid viscosity [Pa s], U0 is the withdrawal rate [m/s], and g is the gravitational earth constant [9.81 m/s]. The L-L model is valid in the draining region with withdrawal rates higher than 1 mm/s, where the effect of surface tension is considered. In Figure 8, the dotted blue line presents a rough approximation of the value of the L-L model with approximate values taken for sol (γ = 0.0025 N/m, ρ = 930 kg/m3, η = 0.001 Pa s). The model nicely follows the experimental thickness data up to a withdrawal rate of 8 mm/s. After 8 mm/s, however, the L-L model is still increasing in concave form, and at higher withdrawal rates, the model does not follow the experimental data. This deviation may be related to the solution being too thick for the viscous flow to be counterbalanced by the adhesion [60].

3.2.2. The Effect of Coating Thickness on the Corrosion Performance

Coating thickness is one of the essential parameters for the optimal protection of a barrier coating against a harsh environment. A thicker coating enables better resistance against corrosion due to the longer diffusion path of corrosion species to the substrate [5]. On the other hand, the optimal thickness of protective coatings has to be obtained since a much thicker coating does not necessarily imply better protection [66,67]. Namely, thick coatings can cause defects, failures, and cracking caused by stress or shrinking with the coating’s drying. Thicker coatings can also have an economic impact since more paint is needed to obtain the desired thickness, increasing the object’s weight [68]. On the other hand, if the coating is not sufficiently thick, pitting corrosion may occur [69].
The Bode spectra of the magnitude of impedance (|Z|) vs. frequency (f) recorded for coatings of different thicknesses as a function of immersion time up to four weeks are given in Figure S3. Figure 10 presents the corrosion performance of PBMA-siloxane coatings of different thicknesses from 1 to 8 µm over three weeks of immersion in 3.5 wt.% NaCl. The graph is constructed based on the data presented in Figure S3 and taking |Z|5 mHz as the parameter of corrosion performance as a function of coating thickness and immersion time. The impedance value on the first day slowly decreased for 3 decades from 1 GΩ cm2 to 1 MΩ cm2 for a 1 µm thick coating, whereas for a 4 µm thick coating, the value remained at the GΩ cm2 range. With longer exposure to the chloride environment, the rate of coating failure for 1 µm was more pronounced, and after four weeks, it was corroded, i.e., |Z|5 mHz dropped to 104 Ω cm2. A 1 μm thick coating would not be suitable for corrosion protection applications. According to the results, the minimum thickness for the coating based on BMA has to be at least 4 µm to assure long-term protection. At any thickness smaller than 4 µm, the coating would eventually fail. The coatings thicker than 4 µm retained high corrosion resistance at longer immersion times (Figure 10). This is aligned with our previous study showing that a coating with a thickness of ≈6–7 µm remained unchanged for more than 18 months in 5 wt.% NaCl [32].

4. Conclusions

Hybrid sol-gel polybutyl methacrylate PBMA-siloxane was optimised by curing and determining the minimum thickness for optimal corrosion protection. The optimisation was carried out in the direction of lower curing temperature compared with the currently known literature data. It turned out that a lower curing temperature slows the process of polycondensation (formation of siloxane bonds) and, consequently, the polymerisation process. At the same time, there is less coating shrinkage at lower temperatures, which in turn causes greater total porosity. All these properties consequently affect the corrosion properties, with the coatings curing at a lower temperature and exhibiting poorer corrosion protection. According to the results of thermal analysis by differential scanning calorimetry and corrosion properties analysis by electrochemical impedance spectroscopy and salt spray chamber, 150 °C is the optimal curing temperature of the PBMA-siloxane coating. Analysis of FTIR spectra also confirmed that the chemical changes of the coating due to copolymerisation and polycondensation are mostly complete after curing at 150 °C.
In addition to the curing effect, the optimal coating thickness that still provides durable protection for several weeks is 4 µm. The thickness of the coating can be controlled by different withdrawal rates.
The studied coating presents a promising approach to corrosion protection of structural steel for applications where only a few micrometres of thick coating is required.

Supplementary Materials

The following supporting information can be downloaded at: https://www.mdpi.com/article/10.3390/coatings13040675/s1, Figure S1: The covariance matrix for fitted parameters a and b.; Figure S2: Bode plots of impedance magnitude of PBMA-siloxane coatings, cured at different temperatures and measured after immersion in 3.5 wt.% NaCl for up to 27 weeks. Figure S3: Bode plots of impedance magnitude of PBMA-siloxane coatings, deposited at different thicknesses and measured after immersion in 3.5 wt.% NaCl for up to 4 weeks.

Author Contributions

Conceptualization, I.M., P.R. and D.H.; methodology, D.H., D.K., P.R. and D.H.; validation, D.K., I.M., P.R. and D.H.; sample preparation, G.M. and D.H.; writing—review and editing, I.M., P.R. and D.H.; supervision, I.M. and P.R. All authors have read and agreed to the published version of the manuscript.

Funding

The authors acknowledge Slovenian Research Agency (ARRS) for core funding (grants No. P2-0393 and No. P1-0134).

Institutional Review Board Statement

Not applicable.

Informed Consent Statement

Not applicable.

Data Availability Statement

The data are available upon reasonable request from the corresponding author.

Acknowledgments

The Centre of Excellence for Integrated Approaches in Chemistry and Biology of Proteins (CIPKeBiP) is acknowledged for the use of the ReactIR™ 45 FTIR instrument and accompanying equipment. The Centre of Excellence NAMASTE is acknowledged for using the ATR FTIR instrument. The authors acknowledge Romana Cerc Korošec, Faculty of Chemistry and Chemical Technology, University of Ljubljana, Slovenia, for performing thermal analyses and valuable discussions. The authors also acknowledge Hana Budasheva and Mladen Franko from the University of Nova Gorica, Laboratory for Environmental and Life Sciences, Nova Gorica, Slovenia, for valuable help in porosity measurements.

Conflicts of Interest

The authors declare no conflict of interest.

References

  1. Davis, J.R. (Ed.) Corrosion: Understanding the Basics; ASM International: Materials Park, OH, USA, 2000; ISBN 978-0-87170-641-6. [Google Scholar]
  2. Revie, R.W. Wiley InterScience (Online service). In Uhlig’s Corrosion Handbook; Wiley: Hoboken, NJ, USA, 2011; ISBN 978-0-470-87286-4. [Google Scholar]
  3. Milošev, I. Contemporary Modes of Corrosion Protection and Functionalization of Materials. Acta Chim. Slov. 2019, 66, 511–533. [Google Scholar] [CrossRef] [PubMed]
  4. Nazeer, A.; Madkour, M. Potential Use of Smart Coatings for Corrosion Protection of Metals and Alloys: A Review. J. Mol. Liq. 2018, 253, 11–22. [Google Scholar] [CrossRef]
  5. Zheng, S.; Li, J. Inorganic–Organic Sol Gel Hybrid Coatings for Corrosion Protection of Metals. J. Sol-Gel Sci. Technol. 2010, 54, 174–187. [Google Scholar] [CrossRef]
  6. Figueira, R.B.; Silva, C.J.R.; Pereira, E.V. Organic–Inorganic Hybrid Sol–Gel Coatings for Metal Corrosion Protection: A Review of Recent Progress. J. Coat. Technol. Res. 2015, 12, 1–35. [Google Scholar] [CrossRef]
  7. Figueira, R.B. Hybrid Sol–Gel Coatings for Corrosion Mitigation: A Critical Review. Polymers 2020, 12, 689. [Google Scholar] [CrossRef] [Green Version]
  8. Montemor, M.F. Functional and Smart Coatings for Corrosion Protection: A Review of Recent Advances. Surf. Coat. Technol. 2014, 258, 17–37. [Google Scholar] [CrossRef]
  9. Brinker, J.; Scherer, G. Sol-Gel Science: The Physics and Chemistry of Sol-Gel Processing, 1st ed.; Academic Press: Boston, MA, USA, 1990; ISBN 978-0-12-134970-7. [Google Scholar]
  10. Hammer, P.; dos Santos, F.C.; Cerrutti, B.M.; Pulcinelli, S.H.; Santilli, C.V. Highly Corrosion Resistant Siloxane-Polymethyl Methacrylate Hybrid Coatings. J. Sol-Gel Sci. Technol. 2012, 63, 266–274. [Google Scholar] [CrossRef]
  11. Hammer, P.; Schiavetto, M.G.; dos Santos, F.C.; Benedetti, A.V.; Pulcinelli, S.H.; Santilli, C.V. Improvement of the Corrosion Resistance of Polysiloxane Hybrid Coatings by Cerium Doping. J. Non-Cryst. Solids 2010, 356, 2606–2612. [Google Scholar] [CrossRef]
  12. dos Santos, F.C.; Harb, S.V.; Menu, M.-J.; Turq, V.; Pulcinelli, S.H.; Santilli, C.V.; Hammer, P. On the Structure of High Performance Anticorrosive PMMA–Siloxane–Silica Hybrid Coatings. RSC Adv. 2015, 5, 106754–106763. [Google Scholar] [CrossRef] [Green Version]
  13. Sarmento, V.H.V.; Schiavetto, M.G.; Hammer, P.; Benedetti, A.V.; Fugivara, C.S.; Suegama, P.H.; Pulcinelli, S.H.; Santilli, C.V. Corrosion Protection of Stainless Steel by Polysiloxane Hybrid Coatings Prepared Using the Sol–Gel Process. Surf. Coat. Technol. 2010, 204, 2689–2701. [Google Scholar] [CrossRef]
  14. Detty, M.R.; Ciriminna, R.; Bright, F.V.; Pagliaro, M. Environmentally Benign Sol–Gel Antifouling and Foul-Releasing Coatings. Acc. Chem. Res. 2014, 47, 678–687. [Google Scholar] [CrossRef] [PubMed]
  15. Kumar, D.; Wu, X.; Fu, Q.; Ho, J.W.C.; Kanhere, P.D.; Li, L.; Chen, Z. Development of Durable Self-Cleaning Coatings Using Organic–Inorganic Hybrid Sol–Gel Method. Appl. Surf. Sci. 2015, 344, 205–212. [Google Scholar] [CrossRef]
  16. Latthe, S.S.; Sutar, R.S.; Kodag, V.S.; Bhosale, A.K.; Kumar, A.M.; Kumar Sadasivuni, K.; Xing, R.; Liu, S. Self—Cleaning Superhydrophobic Coatings: Potential Industrial Applications. Prog. Org. Coat. 2019, 128, 52–58. [Google Scholar] [CrossRef]
  17. Trentin, A.; Harb, S.V.; Uvida, M.C.; Pulcinelli, S.H.; Santilli, C.V.; Marcoen, K.; Pletincx, S.; Terryn, H.; Hauffman, T.; Hammer, P. Dual Role of Lithium on the Structure and Self-Healing Ability of PMMA-Silica Coatings on AA7075 Alloy. ACS Appl. Mater. Interfaces 2019, 11, 40629–40641. [Google Scholar] [CrossRef]
  18. Minami, T. Advanced Sol–Gel Coatings for Practical Applications. J. Sol-Gel Sci. Technol. 2013, 65, 4–11. [Google Scholar] [CrossRef]
  19. Pathak, S.S.; Khanna, A.S. Sol–Gel Nanocoatings for Corrosion Protection. In Corrosion Protection and Control Using Nanomaterials; Elsevier: Cambridge, UK, 2012; pp. 304–329. ISBN 978-1-84569-949-9. [Google Scholar]
  20. Schubert, U.; Huesing, N.; Lorenz, A. Hybrid Inorganic-Organic Materials by Sol-Gel Processing of Organofunctional Metal Alkoxides. Chem. Mater. 1995, 7, 2010–2027. [Google Scholar] [CrossRef]
  21. Zha, J.; Roggendorf, H. Sol–Gel Science, the Physics and Chemistry of Sol–Gel Processing; Academic Press: Boston, MA, USA, 1991; Volume 3, ISBN 0-12-134970-5. [Google Scholar]
  22. Rodič, P.; Iskra, J.; Milošev, I. Study of a Sol–Gel Process in the Preparation of Hybrid Coatings for Corrosion Protection Using FTIR and 1H NMR Methods. J. Non-Cryst. Solids 2014, 396, 25–35. [Google Scholar] [CrossRef]
  23. Rodič, P.; Iskra, J.; Milošev, I. A Hybrid Organic–Inorganic Sol–Gel Coating for Protecting Aluminium Alloy 7075-T6 against Corrosion in Harrison’s Solution. J. Sol-Gel Sci. Technol. 2014, 70, 90–103. [Google Scholar] [CrossRef]
  24. Rodič, P.; Zanna, S.; Milošev, I.; Marcus, P. Degradation of Sol-Gel Acrylic Coatings Based on Si and Zr Investigated Using Electrochemical Impedance, Infrared and X-Ray Photoelectron Spectroscopies. Front. Mater. 2021, 8, 756447. [Google Scholar] [CrossRef]
  25. Rodič, P.; Milošev, I.; Lekka, M.; Andreatta, F.; Fedrizzi, L. Corrosion Behaviour and Chemical Stability of Transparent Hybrid Sol-Gel Coatings Deposited on Aluminium in Acidic and Alkaline Solutions. Prog. Org. Coat. 2018, 124, 286–295. [Google Scholar] [CrossRef]
  26. Harb, S.V.; Pulcinelli, S.H.; Santilli, C.V.; Knowles, K.M.; Hammer, P. A Comparative Study on Graphene Oxide and Carbon Nanotube Reinforcement of PMMA-Siloxane-Silica Anticorrosive Coatings. ACS Appl. Mater. Interfaces 2016, 8, 16339–16350. [Google Scholar] [CrossRef] [Green Version]
  27. Harb, S.V.; dos Santos, F.C.; Caetano, B.L.; Pulcinelli, S.H.; Santilli, C.V.; Hammer, P. Structural Properties of Cerium Doped Siloxane–PMMA Hybrid Coatings with High Anticorrosive Performance. RSC Adv. 2015, 5, 15414–15424. [Google Scholar] [CrossRef]
  28. Trentin, A.; de L. Gasparini, A.; Faria, F.A.; Harb, S.V.; dos Santos, F.C.; Pulcinelli, S.H.; Santilli, C.V.; Hammer, P. Barrier Properties of High Performance PMMA-Silica Anticorrosion Coatings. Prog. Org. Coat. 2020, 138, 105398. [Google Scholar] [CrossRef]
  29. Sakai, R.T.; da Cruz, M.; de Melo, H.G.; Benedetti, A.V.; Santilli, C.V.; Suegama, P.H. Electrochemical Study of TEOS, TEOS/MPTS, MPTS/MMA and TEOS/MPTS/MMA Films on Tin Coated Steel in 3.5% NaCl Solution. Prog. Org. Coat. 2012, 74, 288–301. [Google Scholar] [CrossRef]
  30. Hamulić, D.; Rodič, P.; Poberžnik, M.; Jereb, M.; Kovač, J.; Milošev, I. The Effect of the Methyl and Ethyl Group of the Acrylate Precursor in Hybrid Silane Coatings Used for Corrosion Protection of Aluminium Alloy 7075-T6. Coatings 2020, 10, 172. [Google Scholar] [CrossRef] [Green Version]
  31. Suegama, P.H.; Sarmento, V.H.V.; Montemor, M.F.; Benedetti, A.V.; de Melo, H.G.; Aoki, I.V.; Santilli, C.V. Effect of Cerium (IV) Ions on the Anticorrosion Properties of Siloxane-Poly(Methyl Methacrylate) Based Film Applied on Tin Coated Steel. Electrochim. Acta 2010, 55, 5100–5109. [Google Scholar] [CrossRef]
  32. Milošev, I.; Hamulić, D.; Rodič, P.; Carrière, C.; Zanna, S.; Budasheva, H.; Korte, D.; Franko, M.; Mercier, D.; Seyeux, A.; et al. Siloxane Polyacrylic Sol-Gel Coatings with Alkyl and Perfluoroalkyl Chains: Synthesis, Composition, Thermal Properties and Long-Term Corrosion Protection. Appl. Surf. Sci. 2022, 574, 151578. [Google Scholar] [CrossRef]
  33. Hamulić, D.; Rodič, P.; Milošev, I. The Influence of Length of Alkyl Chain on the Chemical Structure and Corrosion Resistance of Silica-Polyacrylic Hybrid Coatings on Structural Steel. Prog. Org. Coat. 2021, 150, 105982. [Google Scholar] [CrossRef]
  34. Hamulić, D.; Putna-Nimane, I.; Liepina-Leimane, I.; Dimante-Deimantovica, I.; Rodič, P.; Milošev, I. Field Testing and Ecotoxicity of Acrylate-Based Sol–Gel Coatings in Fresh and Seawater. J. Coat. Technol. Res. 2022, 1–55. [Google Scholar] [CrossRef]
  35. Xu, Y.; Dayo, A.Q.; Wang, J.; Wang, A.; Lv, D.; Zegaoui, A.; Derradji, M.; Liu, W. Mechanical and Thermal Properties of a Room Temperature Curing Epoxy Resin and Related Hemp Fibers Reinforced Composites Using a Novel In-Situ Generated Curing Agent. Mater. Chem. Phys. 2018, 203, 293–301. [Google Scholar] [CrossRef]
  36. Parker, R.E.; Isaacs, N.S. Mechanisms Of Epoxide Reactions. Chem. Rev. 1959, 59, 737–799. [Google Scholar] [CrossRef]
  37. Hammer, P.; dos Santos, F.C.; Cerrutti, B.M.; Pulcinelli, S.H.; Santilli, C.V. Carbon Nanotube-Reinforced Siloxane-PMMA Hybrid Coatings with High Corrosion Resistance. Prog. Org. Coat. 2013, 76, 601–608. [Google Scholar] [CrossRef]
  38. Trentin, A.; Harb, S.V.; Uvida, M.C.; Marcoen, K.; Pulcinelli, S.H.; Santilli, C.V.; Terryn, H.; Hauffman, T.; Hammer, P. Effect of Ce(III) and Ce(IV) Ions on the Structure and Active Protection of PMMA-Silica Coatings on AA7075 Alloy. Corros. Sci. 2021, 189, 109581. [Google Scholar] [CrossRef]
  39. Rodič, P.; Korošec, R.C.; Kapun, B.; Mertelj, A.; Milošev, I. Acrylate-Based Hybrid Sol-Gel Coating for Corrosion Protection of AA7075-T6 in Aircraft Applications: The Effect of Copolymerization Time. Polymers 2020, 12, 948. [Google Scholar] [CrossRef] [Green Version]
  40. Rodič, P.; Lekka, M.; Andreatta, F.; Fedrizzi, L.; Milošev, I. The Effect of Copolymerisation on the Performance of Acrylate-Based Hybrid Sol-Gel Coating for Corrosion Protection of AA2024-T3. Prog. Org. Coat. 2020, 147, 105701. [Google Scholar] [CrossRef]
  41. Criado, M.; Sobrados, I.; Sanz, J. Polymerization of Hybrid Organic–Inorganic Materials from Several Silicon Compounds Followed by TGA/DTA, FTIR and NMR Techniques. Prog. Org. Coat. 2014, 77, 880–891. [Google Scholar] [CrossRef]
  42. dos Santos, F.C.; Pulcinelli, S.H.; Santilli, C.V.; Hammer, P. Protective PMMA-Silica Coatings for Aluminum Alloys: Nanostructural Control of Elevated Thermal Stability and Anticorrosive Performance. Prog. Org. Coat. 2021, 152, 106129. [Google Scholar] [CrossRef]
  43. Harb, S.V.; Trentin, A.; Uvida, M.C.; Magnani, M.; Pulcinelli, S.H.; Santilli, C.V.; Hammer, P. A Comparative Study on PMMA-TiO2 and PMMA-ZrO2 Protective Coatings. Prog. Org. Coat. 2020, 140, 105477. [Google Scholar] [CrossRef]
  44. Available online: Https://Webbook.Nist.Gov/Chemistry/Form-Ser (accessed on 3 February 2023).
  45. Leach, R. Chapter 8—Surface Topography Characterisation. In Fundamental Principles of Engineering Nanometrology, 2nd ed.; Leach, R., Ed.; Micro and Nano Technologies; William Andrew Publishing: Oxford, UK, 2014; pp. 241–294. ISBN 978-1-4557-7753-2. [Google Scholar]
  46. Korte, D.; Franko, M. Application of Complex Geometrical Optics to Determination of Thermal, Transport, and Optical Parameters of Thin Films by the Photothermal Beam Deflection Technique. J. Opt. Soc. Am. A 2015, 32, 61. [Google Scholar] [CrossRef]
  47. Pawlak, M.; Pal, S.; Ludwig, A.; Wieck, A.D. On the Infrared Absorption Coefficient Measurement of Thick Heavily Zn Doped GaAs Using Spectrally Resolved Modulated Photothermal Infrared Radiometry. J. Appl. Phys. 2017, 122, 135109. [Google Scholar] [CrossRef]
  48. Chrobak, Ł.; Korte, D.; Budasheva, H.; Maliński, M.; Rodič, P.; Milošev, I.; Janta-Lipińska, S. Investigations of the Thermal Parameters of Hybrid Sol–Gel Coatings Using Nondestructive Photothermal Techniques. Energies 2022, 15, 4122. [Google Scholar] [CrossRef]
  49. Cabrera, H.; Korte, D.; Budasheva, H.; Abbasgholi, N.; Asbaghi, B.; Bellucci, S. Through-Plane and In-Plane Thermal Diffusivity Determination of Graphene Nanoplatelets by Photothermal Beam Deflection Spectrometry. Materials 2021, 14, 7273. [Google Scholar] [CrossRef]
  50. Cernuschi, F.; Bianchi, P.; Leoni, M.; Scardi, P. Thermal Diffusivity/Microstructure Relationship in Y-PSZ Thermal Barrier Coatings. J. Therm. Spray Technol. 1999, 8, 102–109. [Google Scholar] [CrossRef]
  51. ASTM B117-19; Standard Practice for Operating Salt Spray (Fog) Apparatus. ASTM: West Conshohocken, PA, USA, 2019. Available online: https://www.astm.org/b0117-19.html (accessed on 3 February 2023).
  52. Levenberg, K. A Method for the Solution of Certain Non-Linear Problems in Least Squares. Q. Appl. Math. 1944, 2, 164–168. [Google Scholar] [CrossRef] [Green Version]
  53. Rubio, F.; Rubio, J.; Oteo, J.L. A FT-IR Study of the Hydrolysis of Tetraethylorthosilicate (TEOS). Spectrosc. Lett. 1998, 31, 199–219. [Google Scholar] [CrossRef]
  54. Liu, S.-H.; Hou, H.-Y.; Shu, C.-M. Thermal Hazard Evaluation of the Autocatalytic Reaction of Benzoyl Peroxide Using DSC and TAM III. Thermochim. Acta 2015, 605, 68–76. [Google Scholar] [CrossRef]
  55. Sideridou, I.D.; Achilias, D.S.; Karava, O. Reactivity of Benzoyl Peroxide/Amine System as an Initiator for the Free Radical Polymerization of Dental and Orthopaedic Dimethacrylate Monomers: Effect of the Amine and Monomer Chemical Structure. Macromolecules 2006, 39, 2072–2080. [Google Scholar] [CrossRef]
  56. Sun, D.-X.; Miao, X.; Xie, C.-X.; Gu, J.; Li, R. Study on Thermal Properties and Kinetics of Benzoyl Peroxide by ARC and C80 Methods. J. Therm. Anal. Calorim. 2012, 107, 943–948. [Google Scholar] [CrossRef]
  57. Verganelakis, V.; Nicolaou, P.D.; Trapalis, C.; Kordas, G. Evaluation of the Critical Processing Parameters of Ormosil Coatings on the Increase of the Strength of Glass. J. Non-Cryst. Solids 2000, 265, 265–275. [Google Scholar] [CrossRef]
  58. Brinker, C.J.; Scherer, G.W.; Roth, E.P. Sol → Gel → Glass: II. Physical and Structural Evolution during Constant Heating Rate Experiments. J. Non-Cryst. Solids 1985, 72, 345–368. [Google Scholar] [CrossRef]
  59. Rebrov, E.V.; Schouten, J.C. Limiting Withdrawal Rate and Maximum Film Thickness during Dip-Coating of Titania Sols onto a Si Substrate. Chem. Eng. Process. Process Intensif. 2011, 50, 1063–1068. [Google Scholar] [CrossRef]
  60. Faustini, M.; Louis, B.; Albouy, P.A.; Kuemmel, M.; Grosso, D. Preparation of Sol−Gel Films by Dip-Coating in Extreme Conditions. J. Phys. Chem. C 2010, 114, 7637–7645. [Google Scholar] [CrossRef]
  61. Matur, U.C.; Akyol, S.; Baydoğan, N.; Cimenoglu, H. The Optical Properties of CIGS Thin Films Derived by Sol-Gel Dip Coating Process at Different Withdrawal Speed. Procedia—Soc. Behav. Sci. 2015, 195, 1762–1767. [Google Scholar] [CrossRef] [Green Version]
  62. Bile, J.; Bolzinger, M.-A.; Valour, J.-P.; Fessi, H.; Chevalier, Y. Antimicrobial Films Containing Microparticles for the Enhancement of Long-Term Sustained Release. Drug Dev. Ind. Pharm. 2016, 42, 818–824. [Google Scholar] [CrossRef] [PubMed]
  63. Brinker, C.J. Dip Coating. In Chemical Solution Deposition of Functional Oxide Thin Films; Schneller, T., Waser, R., Kosec, M., Payne, D., Eds.; Springer Vienna: Vienna, Austria, 2013; pp. 233–261. ISBN 978-3-211-99310-1. [Google Scholar]
  64. Landau, L.; Levich, B. Dragging of a Liquid by a Moving Plate. Acta Physicochim. URSS 1988, 17, 141–153. [Google Scholar] [CrossRef]
  65. Schneller, T.; Waser, R.; Kosec, M.; Payne, D. Chemical Solution Deposition of Functional Oxide Thin Films; Springer Science & Business Media: Vienna, Austria, 2014; ISBN 978-3-211-99311-8. [Google Scholar]
  66. Castro, Y.; Ferrari, B.; Moreno, R.; Durán, A. Corrosion Behaviour of Silica Hybrid Coatings Produced from Basic Catalysed Particulate Sols by Dipping and EPD. Surf. Coat. Technol. 2005, 191, 228–235. [Google Scholar] [CrossRef]
  67. Ono, S.; Tsuge, H.; Nishi, Y.; Hirano, S. Improvement of Corrosion Resistance of Metals by an Environmentally Friendly Silica Coating Method. J. Sol-Gel Sci. Technol. 2004, 29, 147–153. [Google Scholar] [CrossRef]
  68. Birnbaum, L.S. Preservation Coatings for Ships in Service. Bur. Ships J. 1957, 6. [Google Scholar]
  69. Knudsen, O.Ø.; Forsgren, A.; Forsgren, A. Corrosion Control through Organic Coatings; CRC Press: Boca Raton, FL, USA, 2017; ISBN 978-1-315-15318-6. [Google Scholar]
Figure 1. (a) TG and DTG curves of the sample PBMA-siloxane under an air atmosphere with a flow rate of 50 mL/min and a heating rate of 10 °C/min; (b) MS analyses of evaporated compounds (numbers on the curves of different colours denote m/z values, as discussed in the text) with the TG curve added as a reference (black curve); and (c) comparison of a DSC curve, performed under ambient pressure and HP DSC curve performed at a pressure of 50 bars of PBMA-siloxane dried sol under static air atmosphere.
Coatings 13 00675 g001
Figure 2. (a) ATR FTIR transmittance (each bar represents 4%) spectra of as-prepared sol and coatings deposited on the metal substrate and cured at different temperatures (25 °C, 90 °C, 120 °C, 150 °C, 180 °C). The withdrawal rate was 2.3 mm/s. (b,c) show the insert of the specific region of the C=C band at 1636 cm−1 and C=O band at 1724 cm−1 in FTIR spectra.
Coatings 13 00675 g002
Figure 3. PBMA-siloxane coating thickness with error bars deposited on structural steel vs. curing temperature. The withdrawal rate was 2.3 mm/s.
Coatings 13 00675 g003
Figure 4. Total and opened porosity of coatings with error bars deposited on structural steel and cured at different temperatures. The withdrawal rate was 2.3 mm/s.
Coatings 13 00675 g004
Figure 5. Bode plots of impedance magnitude of PBMA-siloxane coatings, cured at different temperatures and measured after immersion in 3.5 wt.% NaCl at 13 weeks. Symbols correspond to the experimental data. The withdrawal rate was 2.33 mm/s.
Coatings 13 00675 g005
Figure 6. Time dependence of the impedance value |Z|5 mHz recorded in 3.5 wt.% NaCl for PBMA-siloxane coatings deposited on structural steel and cured at different curing temperatures. The withdrawal rate was 2.3 mm/s.
Coatings 13 00675 g006
Figure 7. Images of structural steel samples coated with PBMA-siloxane coatings and cured at selected temperatures after 0, 0.5, 1.5, 2 and 3 weeks of salt spray test (ASTM B117) to monitor corrosion propagation (dark brown colour). Samples were scribed before exposure. The withdrawal rate was 2.3 mm/s.
Coatings 13 00675 g007
Figure 8. Graph of thickness and surface roughness (expressed as arithmetic mean height Sa) dependence on the withdrawal rates during the dip-coating procedure. The graph does not present the point for the calculated thickness at 48 mm/s. Coatings were deposited on structural steel and cured at 180 °C.
Coatings 13 00675 g008
Figure 9. 3D topography images of the area 500 μm × 500 μm for coatings obtained with different withdrawal rates (a) 1.2 mm/s, (b) 2.3 mm/s, (c) 4.5 mm/s, (d) 7.0 mm/s, (e) 9.3 mm/s, (f) 11.7 mm/s, (g) 17.4 mm/s, (h) 23.3 mm/s and (i) 48.3 mm/s. Coatings were deposited on structural steel and cured at 180 °C.
Coatings 13 00675 g009
Figure 10. The impedance magnitude |Z|5 mHz is presented for coatings of different thicknesses (1–8 µm) deposited on structural steel and cured at 180 °C vs. immersion time in 3.5 wt.% NaCl.
Coatings 13 00675 g010
Disclaimer/Publisher’s Note: The statements, opinions and data contained in all publications are solely those of the individual author(s) and contributor(s) and not of MDPI and/or the editor(s). MDPI and/or the editor(s) disclaim responsibility for any injury to people or property resulting from any ideas, methods, instructions or products referred to in the content.

