1. Introduction
Coatings are widely used as anti-corrosion layers in ships or marine structures [
1]. When the thickness of the coating and its uniformity directly affect the anti-corrosion effect [
2], it may cause safety problems for ships or marine structures, and ultimately lead to accidents. The life of the coating structure is directly related to the thickness in the coating material. Therefore, it is very important that the thickness in the coating must be monitored regularly, but in practical applications, the coating is obviously thinner, especially on the surface of marine structures [
3]. For example, when the coating material of a ship is applied to the surface of a metal structure, the thickness of the coating material can be even thinner, which increases the difficulty of the assessment of coating thickness.
Non-Destructive Testing (NDT) is an effective method for assessing the structural integrity of these and identifying any thickness degradation, deviations or defects [
4]. Appropriate non-destructive testing techniques need to accurately detect, locate, and measure structural parameters, such as thickness and defects, in a non-invasive manner, and use the results to plan wisely for future use and maintenance. In order to deal with these situations, many researchers and engineers have developed many new NDT technologies, such as ultrasonic (UT) techniques, radiograph (RT), magnetic flux leakage (MT), electromechanical impedance (EMI) techniques and eddy current (ET) technology. Among them, EMI is very effective in the structural health monitoring of bolted structures [
5,
6]. The fundamental part of the method is to utilize electromechanical (EM) impedance responses as local dynamic features for assessing the structural damage. UT has been widely used in many fields such as cleaning, medical treatment [
7] and ultrasonic measurement in the engineering field, for structural non-destructive testing, medical diagnosis and sonar. The existing ultrasonic nondestructive testing methods for coating thickness mainly include ultrasonic microscope technology, ultrasonic surface wave technology and so forth, but these technologies require high testing conditions, and the system and operation are complicated, and the equipment cost is high. So, they are not suitable for application to ultrasonic water immersion coating thickness determination. The Polytec 45MG system, based on the B-scan (back reflection) technique, can measure thicknesses ranging from 1.25 up to 19 mm [
8]. Ultrasonic bulk wave technology has its unique advantages in detecting local thickness and defects point by point [
9]. However, when applied to ships or marine structures, the technology also has certain shortcomings due to environmental influences, such as time-consuming local measurement and limited accessibility. These shortcomings lead to a reduction in efficiency and an increase in cost. Therefore, there is an urgent need for a new non-destructive testing method: ultrasonic water immersion measurement.
The pulse receiver is used to generate and receive ultrasound. A pulse is applied to the short electric pulse on the piezoelectric element in the ultrasonic transducer to make it vibrate and generate sound waves. We call it the Excitation Pulse, also known informally as the “main bang”. However, the main bang area shows that the pulse-echo test method cannot detect fast-returning echoes [
10]. If the propagation time is short, the reflected echoes are superimposed or buried in the “main bang” [
11]. When the pulse duration is short, a transducer with a higher center frequency can be used to solve the problem of echo overlap [
12]. On the other hand, the high-frequency energy decays faster, and the coating thickness with strong attenuation cannot be evaluated [
13]. Ultrasonic pulse echo testing requires the time-of-flight (TOF) of the echo reflected from the coating boundary. However, the back wall echoes of the coating are very close to each other, so it is a key issue to accurately estimate the TOF of the echo signal. Wavelet analysis is based on cognitive estimation using Morlet wavelet and least mean square (LMS) [
14], the edited least squares (LS) method based on modified Gauss Newton (MGN) [
15], based on the use of Hilbert transform between the two signals [
16], and the central ellipse algorithm [
17].
In this paper, ultrasonic water immersion body wave technology is used to detect coating thickness [
18]. In the process of using ultrasonic sensor equipment to calculate the thickness of each propagation medium, reflection is caused at the interface of the medium or at the end of the material [
19], and the thickness of each reflected wave can be calculated through the TOF of each reflected wave. However, in the direct pulse echo measurement of the coating material of the sample, the result was not as good as we expected. When the ultrasonic velocity is high or the sample thickness is thin, the echo signal is very close to the “master bang” of the transmitted signal. The flight time is shortened, and the two echoes overlap, which reduces the accuracy of the measurement. In order to overcome this phenomenon, a delay line is used. In the previous studies, we implement the acrylic delay line; the experiment was carried out in the air [
20] but coatings in water also require accurate thickness measurements, which cannot be done in air. So, in this research, we conducted the water immersion test and measured the thickness under the water. Therefore, a similar method is used in this article. After calculating the optimal distance of the water delay line between the coating material in the water and the immersion transducer, an experiment is performed to select the optimal distance.
2. Ultrasonic Echo Signal Theory of Delay Line
In the direct pulse echo measurement of the specimen coating material, the result was not as good as we expected. The main reason for this is that the coating of the test piece was too thin. The average thickness of building materials is about 2 mm. When the thickness is reduced, the echo is located very close to the base material of the specimen, and the waveforms are mixed. When the ultrasonic speed is high or the specimen thickness is thin, the echo signal is very close to the “main bang” transmission signal. In addition, the flight time is shortened. This phenomenon causes the two echoes to overlap, which reduces the accuracy of the measurement. In order to overcome this phenomenon, a delay line is used.
The ultrasonic delay line is a layer of material used to temporarily and accurately delay the echo signal to isolate it from the transmission signal. The characteristics of the material used for the delay line are the basic factors that need to be considered. It can be quartz, acrylic and aluminum, and even water can be used as the material for the delay line. The amplitude of the reflected signal is related to the incident factor of the normal beam. The acoustic impedance value is directly related to the reflection coefficient and the transmission coefficient. The transmission coefficient equation and the reflection coefficient equation can be obtained from the stress balance equation at the boundary of the two solids.
When the harmonics propagating in the vertical x direction of the emitted ultrasonic wave reach the interface of the two media, the plane wave incident on the interface of the two materials is divided into two parts: part of the energy passes through the interface, and the other is reflected back. Therefore, the elastic field is independent of the horizontal y direction, so all the differentials about the y direction in the equation of motion are zero.
The incident waveform equation as:
in this case, the displacement of the reflected field can be written as:
then
and
At the boundary between the two media, boundary conditions must be met. For the entire elastic field of the first medium and another medium, there are:
for the one-dimensional case, the generalized Hooke’ s law is:
the reflection coefficient obtained from the solution of some equations is as follows:
The ultrasonic wave is reflected at the boundary where the acoustic impedance of the materials on both sides of the interface is different. This difference in is often referred to as impedance mismatch. The greater the impedance mismatch, the greater the percentage of energy reflected at the boundary or the boundary between one medium and another medium.
Since particle velocity and local particle pressure must be continuous at the boundary, the fraction of reflected incident wave intensity can be derived. When the acoustic impedance of the materials on both sides of the boundary is known, the fraction of reflected incident wave intensity can be calculated by the following formula. The resulting value is called the reflection coefficient. Multiply the reflection coefficient by 100 to obtain the reflected energy as a percentage of the original energy.
Since the reflected and transmitted energy must be equal to the total amount of incident energy, the transmission coefficient must be calculated simply by subtracting the reflection coefficient from the first medium. Therefore, the transmission coefficient can be written as:
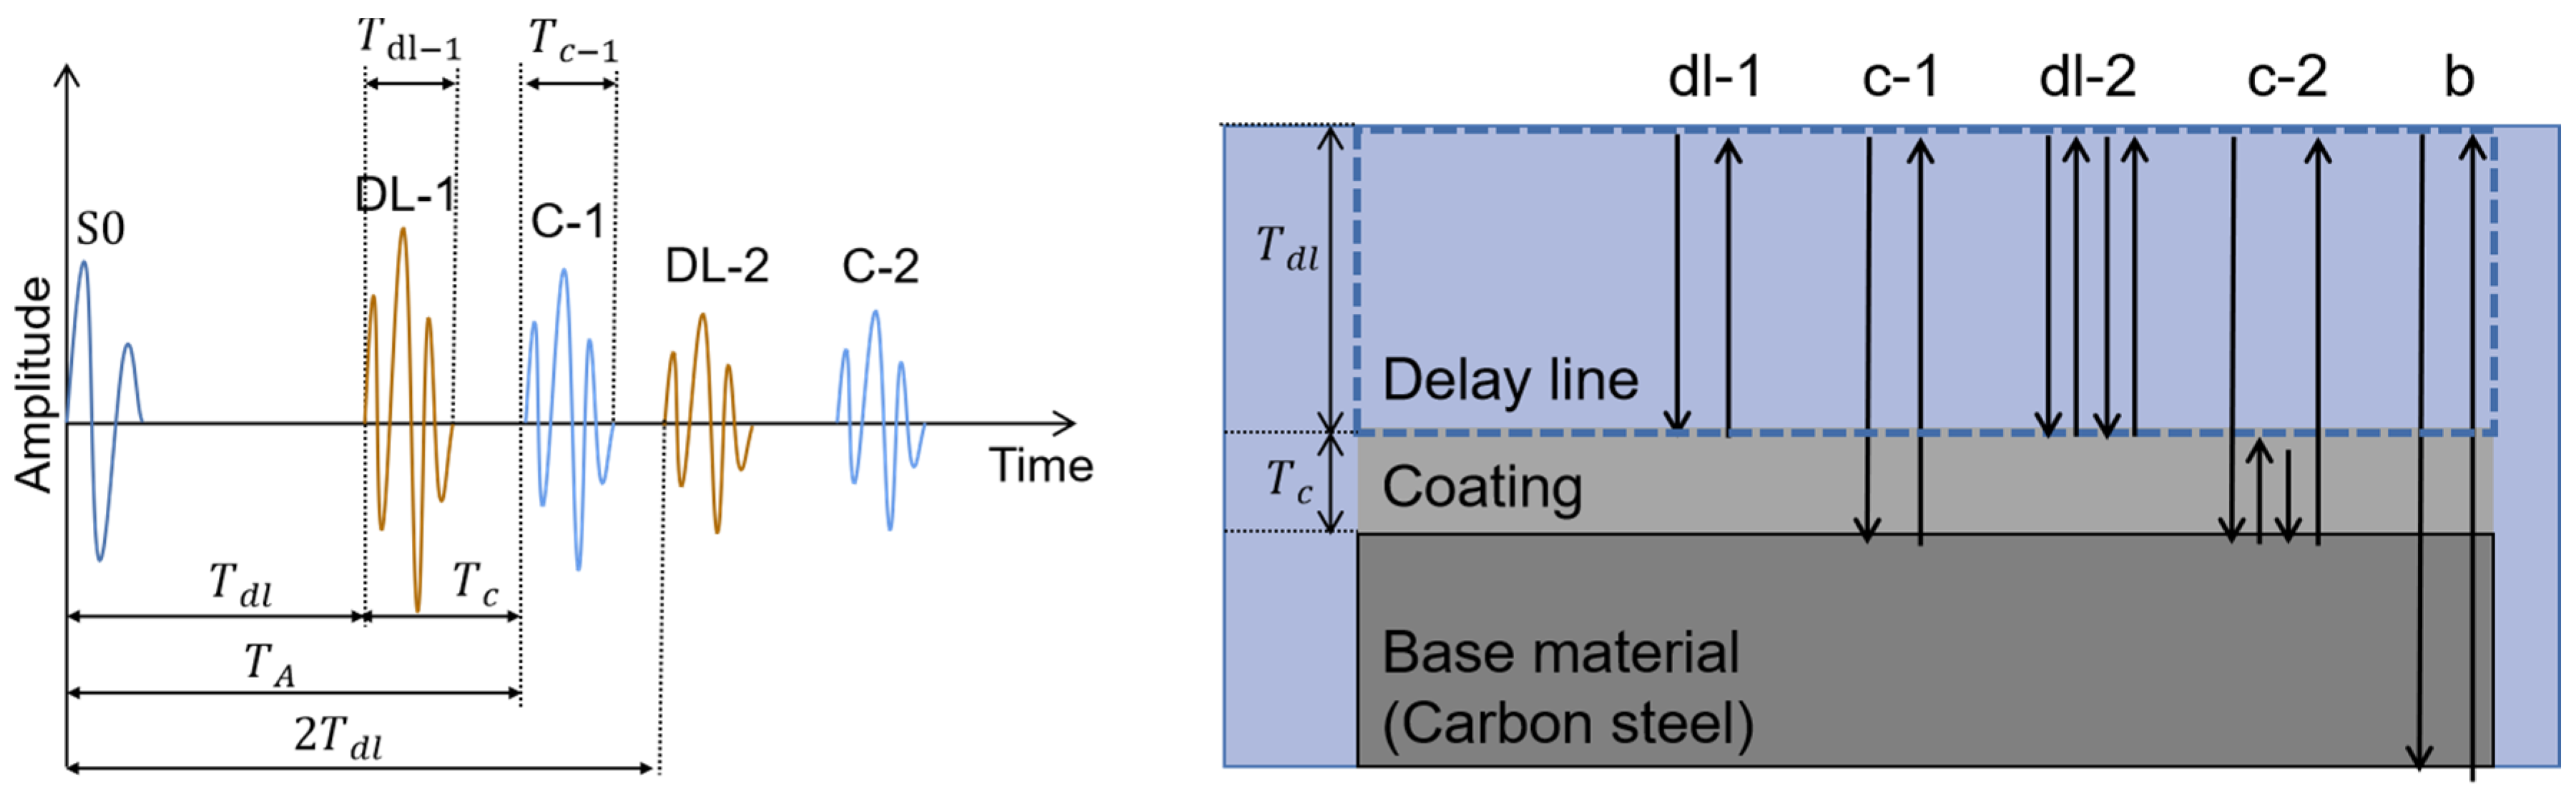
Regarding the optimal thickness of the delay line, apply a delay line on the top of the specimen to propagate the initial signal source to the specimen through the delay line. However, at the boundary between the delay line and the specimen, part of the signal is reflected back, and the remaining part of the signal is transmitted to the specimen. The DL-1 signal is the reflected signal (
Figure 1). Part of the ultrasonic signal propagating from the delay line to the specimen is reflected from the base material of the specimen. Part of the echo is transmitted to the specimen and arrives at the receiver as a waveform. Not all ultrasonic signals propagate from the specimen to the delay line, and the remaining waveforms continue to be reflected in the specimen.
The conventional delay line design method is when the measurement signal of specimen C-1 reaches between the first echo signal DL-1 and the second echo signal DL-2 of the delay line. As shown in the figure, S0 is the signal in the “main bang”,
is the time when the ultrasonic wave returns on the surface of the delay line, and
is the time when the ultrasonic wave is sent from S0 to the surface of the coating. The range between DL-1 and DL-2 signals defines the arrival time limit of the measurement signal as:
By replacing the acoustic path, the maximum and minimum specimen thickness range for a given delay line geometry can be determined as follows:
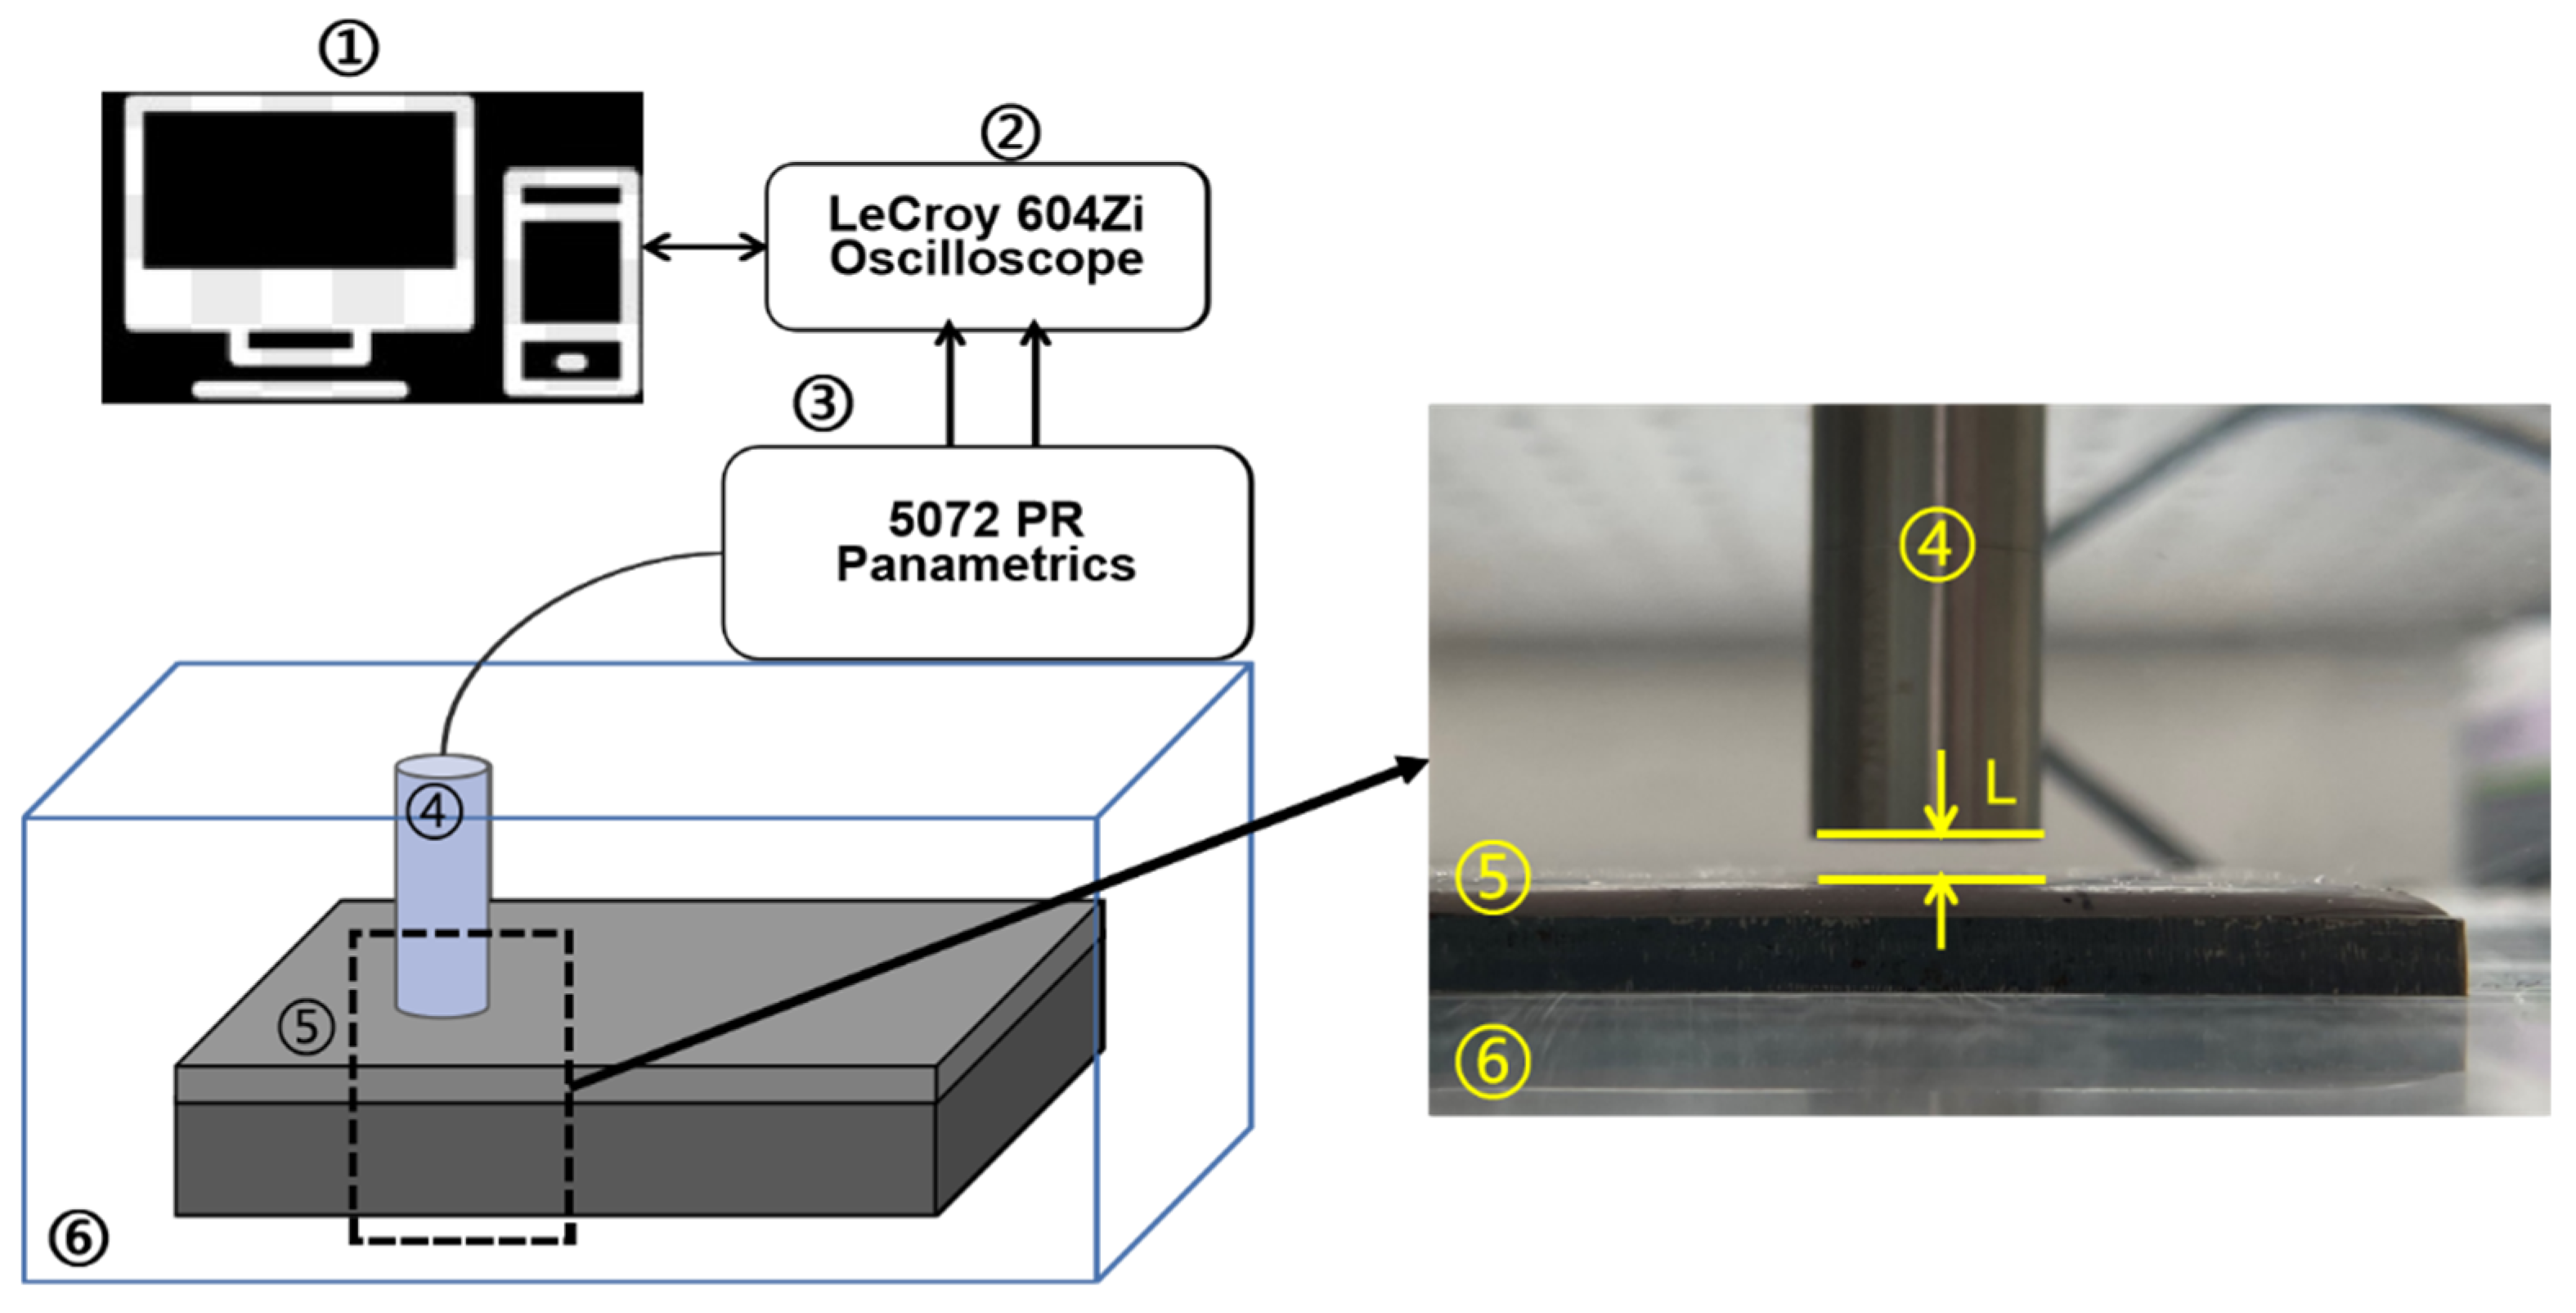
The theory is applied in the experiment. The thickness of the coating used in the experiment is 2.13
. The coating is glued to a 4
thick carbon steel base material and the propagation speed of ultrasonic waves in water is 1.48
. By experimental measurement, the propagation speed of ultrasonic waves in the coating is 2.44
. In order to clearly analyze the water delay line signal and the coating signal, the optimal size of the delay line can be calculated by the following formula:
This section describes the measurement of coating thickness using ultrasonic waves in water. It is deduced by theory that, when water is used as the delay line, the optimal distance of the delay line is 2.6 . The TOF of the peak or trough of the ultrasonic signal of the water delay line determines the coating thickness. In order to ensure the accuracy of the theory, the delay line distances of 2, 2.6, 5 and 10 , were tested on the two regions. At the same time, in order to reduce the error of the experiment, the delay lines of different distances were measured four times and ensured. The same conditions were set again in each experiment.
4. Results and Discussion
The first step was to use ultrasound to check the distance of the water delay line in the 20th area and measure the thickness of the coating.
Figure 4 shows the experimental results of the direct pulse echo test of the water delay line at different distances in the Alocit 28.14 20th area.
The amplitude change can be observed in the figure, where the first echo represented by DL-1 is the signal reflected by the boundary between the delay line and the coating surface, and then DL-2 represents the second echo of this signal. The echo represented by C-1 is the signal reflected by the boundary between the base material and the coating material, and then C-2 represents the second echo of this signal, shown in
Figure 4.
Table 2 lists the TOF and the measured coating thickness in the Alocit 28.14 20th area. At the junction between the water and the coating, part of the ultrasonic wave is transmitted from the water to the inside of the coating, and the rest is reflected back to the ultrasonic transducer (Echo DL-1). The ultrasonic wave transmitted inside the coating reaches the surface of the base material and then returns to the ultrasonic transducer (Echo C-1).
This measurement method was repeated four times to calculate the average value of the measured coating thickness for each delay line. Therefore, the coating thicknesses measured by experiments of (a), (b), (c) and (d) was estimated to be 2.143, 2.137, 2.153, and 2.143
A caliper was used to manually measure and verify the ultrasonic measurement data. The thickness calculation error measured by each method is shown in
Table 2. The results show that, although the four experiments can measure the coating thickness with an error of less than 1%, the thickness error measured by the best delay line theory is the smallest, which is only one-third to two-halves of the error of the other three experimental results. The thickness error measured by the experiment is shown in
Table 3.
It can be seen that the experimental results are similar in theory. The coating thickness measured at the distance of the water delay line of 2.6 is more accurate, and the waveform diagram is also very clear and easy to analyze.
The second step was to use ultrasound to check the distance of the water delay line in the 21st area and measure the thickness of the coating, and the experiment was set up under the same conditions as the first step, and the coating thickness was measured by the ultrasonic experiment, shown in
Figure 5. A caliper was used to manually measure and verify the measurement data. The thickness error measured by the experiment is shown in
Table 4.
Although in experiment (d) the experimental results are more accurate than experiments (a) and (c), the measured results are similar to those of experiment b, and the error is small, but in the waveform diagram, the 10
waveform is too fuzzy and difficult to analyze. So, 2.6
is the optimal delay line length.
Figure 5 shows the signal measured at a water delay line distance of 2.6
. The TOF of the first echo is 4.985
, the arrival time of the next echo is 6.64
, and the thickness is calculated as 2.126
. Four measurements were performed on each of the delay lines of different distances in the two regions, and the same conditions were reset for each measurement, and the results in the following table were obtained. Each measurement will estimate the error and measurement uncertainty and, finally, the experimental results show that, compared with the thickness value, the error measured with calipers between the two was less than 1.1%.
The third experiment was carried out using acrylic delay lines in the 20th and 21st areas. Perform the same method as the water immersion ultrasonic measurement, and the collected signal is shown in
Figure 6. The result of calculating the thickness of the coating material using the information confirmed in the two figures is 2.12
, and the result of comparison with the measured value of the caliper is shown in
Table 3 and
Table 4. The result of the accurate measurement of the coating thickness with the acrylic delay line was obtained in the preliminary research, the purpose of this article is also to accurately measure coating thickness. However, the acrylic delay line cannot measure the coating thickness in water, so the water delay line measurement is required. The coating thickness errors measured by the two delay line experiments are similar, so the feasibility of the water delay line is verified. However, the signal of the water delay line is not as clear as the acrylic delay line.
The thickness of the coating was measured by the water delay line and the ACR delay line, and the optimal water delay line distance measured by the theory was more accurate. Although water delay has obvious limitations, in practical applications, marine structures are usually relatively large. Since the thickness of each scan is measured at one point, if it is applied to large-area scanning, multipoint scanning is required to improve the accuracy. However, most marine structures, such as ships, are in the water. The general ultrasonic nondestructive testing method will be limited, as in the third step in this article, it is difficult for the acrylic delay line to measure the thickness of the coating in the water, and the removal of marine structures from the water will incur a very high cost. Therefore, the method has stability and can directly measure the thickness of the surface coating of marine structures in water, thereby having the advantages of accuracy, high efficiency and low cost. It is predicted that the thickness measurement of coating materials that require high precision or samples thinner than this experiment can be carried out. In the follow-up research, the effect of the frequency on the accuracy of the thickness measurement will studied. The optimal value of the frequency will be selected in order to accurately measure the coating thickness even in complex situations, and so that the signal quality in the water delay line can be as clean and tidy as the acrylic delay line. We tried to develop the measurement by guided waves in water. Guided waves can scan the coating without contact on a large scale, and it is expected to increase the efficiency of coating thickness measurement.


 ,
, 


