Article

Data Analysis of Two-Phase Flow Simulation Experiment of Array Optical Fiber and Array Resistance Probe

1
College of Geophysics and Petroleum Resources, Yangtze University, Wuhan 430100, China
2
Key Laboratory of Exploration Technologies for Oil and Gas Resources (Yangtze University), Ministry of Education, Wuhan 430100, China
3
Xi’an Well-Sun Electronic Technology PLC, Xi’an 710304, China
*
Author to whom correspondence should be addressed.
Coatings 2021, 11(11), 1420; https://doi.org/10.3390/coatings11111420
Submission received: 19 October 2021 / Revised: 8 November 2021 / Accepted: 12 November 2021 / Published: 20 November 2021
(This article belongs to the Special Issue Micro-Nano Optics and Its Applications)

Abstract

:
To solve the problem that traditional single-probe instruments cannot accurately measure the gas and water holdup, the domestic design of the array holdup measuring instrument Array of Optical and Resistance Tool (AORT), composed of five sets of optical fiber probes and five sets of resistance probes, is carried out in both gas–water and oil–water. Simulated measurement experiments were conducted under different water cut in phase flow. Through the analysis of the experimental data, the response relationship between the optical fiber probe and the resistance probe of the AORT instrument in different fluids was obtained. Then, the data under different conditions of fluid, flowrate and water cut in the experiment were compared by drawing. Interpolation algorithm was used to perform two-maintenance holdup imaging, and finally the holdup image was compared with the pictures of the flow in the pipe recorded during the experiment. The results show that the resistance probe has a better response under low water cut conditions, and the optical fiber probe has a better response under high gas cut conditions, which is consistent with the theoretical analysis. The imaging diagram and the flow pattern in the pipe during the experiment are in good agreement. It can be seen that the accuracy of the holdup measured by the AORT instrument under the test conditions is verified, and can provide technical support for further carrying out the measurement and interpretation of the holdup in future, as well as the improvement of the instrument and on-site testing.

1. Introduction

During the development of oil and gas fields, horizontal wells are often used to penetrate the reservoir to increase the contact surface with the oil and gas reservoir to increase production and recovery efficiency. The common gas, liquid and solid three phases in multiphase flow have completely different properties, and they have different phase distributions and phase velocities when mixed together. Therefore, it is very important to determine the actual composition of the multiphase flow. The determination of the phase distribution helps to select the appropriate phase velocity calculation method. As horizontal wells and vertical wells have completely different flow conditions, the existing single-probe instruments and interpretation methods for vertical wells are no longer suitable for horizontal wells [1,2,3,4,5]. Production logging technology for horizontal wells outside China started early, and the current instruments and data-processing software are very complete. For example, Sondex’s Multiple Array Production Suite (MAPS) array imaging instrument and Schlumberger’s FloScan Imager (FSI) array imaging instrument have both achieved commercial applications [6,7]. China’s domestic horizontal well technology started late, and there is no horizontal-well-measuring instrument and data-processing software that can be used for field testing. Some companies have introduced Sondex’s MPS array imaging instrument for research and horizontal well surveys. Due to the confidentiality of Schlumberger’s technology, testing services are currently only available in China [8,9,10]. To make up for the domestic gap in horizontal well array measurement instruments, the horizontal well array measurement instrument Array of Optical and Resistance Tool (AORT) was designed in China, and simulated measurement experiments were carried out in the multiphase flow simulation laboratory to evaluate the applicability of the instrument.

2. Experiment and Interpolation Algorithm Analysis

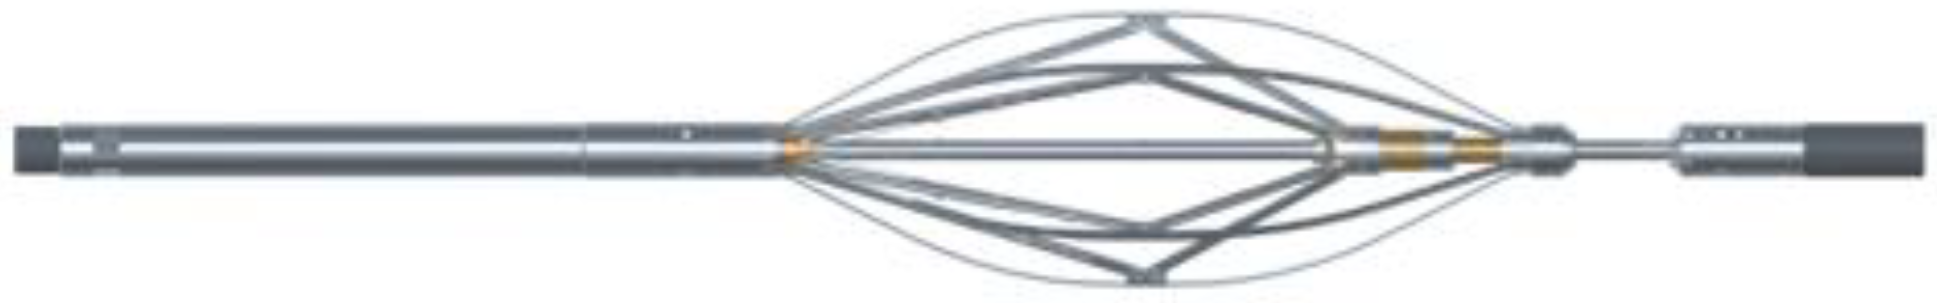
2.1. Test Instrument and Response Principle

As shown in Figure 1, the AORT instrument has five fiber probes, five resistance probes and five support arms. Each support arm is fixed with a fiber probe and a resistance probe. The five supporting arms are equiangularly distributed, so that the optical fiber probes and resistance probes are also distributed in a circular array.
The fiber probe used by AORT can be directly used for the measurement of gas holdup. The probe structure is an integrated structure, and a single fiber probe has a light source and a device for detecting reflectance. The light has different refractive indexes in mediums such as oil, gas and water (the refractive index of gas is 1.00, the refractive index of water is 1.33, and the refractive index of crude oil is 1.50) [11]. The principle of total reflection or refraction can transmit the incident light to the tip of the probe. When the tip is in a gas medium, the light is totally reflected on the contact surface, the intensity of the reflected light is the largest, and the measuring device can measure a high level; when the probe is in a liquid medium, the light cannot be totally reflected on the contact surface and the reflected light. The strength of the measuring device is small, and the measuring device can measure the low level. As the downhole fluid is flowing, the fluid in contact with the probe will continue to change, high and low fluctuation signals can be obtained, and the obtained signal data can be processed to the local instantaneous gas holdup or liquid holdup.
The resistance probes used by AORT are similar to those in MPS (General Electric Company, Boston, MA, USA) and FSI (Schlumberger, Houston, TX, USA). Water and hydrocarbons have different electrical conductivities (water is a conductor, hydrocarbons are non-conductors), so measuring the conductivity of the fluid to distinguish water and hydrocarbons can determine the properties of the fluid. During the measurement, as the fluid flows through the probe, the fluid continuously changes, the real-time conductivity is recorded, and the local water holdup of the wellbore is obtained by the proportion of the water phase time.

2.2. Experimental Program and Instrument Comparison

This experiment was carried out in a multiphase flow simulation experimental device. The simulated wellbore was made of transparent plexiglass, with an inner diameter of 0.124 m and a length of 16 m. The simulated wellbore is completely horizontal, and the experimental instruments Capacitance Array Tool (CAT), Resistance Array Tool (RAT) and AORT are measured in the wellbore in a centered manner. Before starting the two-phase flow measurement, a calibration measurement of the instrument under different fluids and flowrates is carried out. Then, it is measured in gas–water and oil–water, and the two-phase flow in the simulated wellbore has different water holdups by changing the water cut. The measurement scheme is shown in Table 1, and a total of 20 datasets are obtained.
CAT (General Electric Company, Boston, MA, USA), RAT (General Electric Company, Boston, MA, USA) and AORT (Well-sun Company, Xi’an, Shaanxi, China) are compared and analyzed, and the parameters are shown in Table 2. It can be found that AORT has the advantage of directly measuring the gas holdup rate to improve the accuracy of gas identification. However, AORT also has the problem of fewer measuring probes and a limited measuring range

2.3. Data Type Analysis

The data management and drawing in this article are based on CIFLog software (2.1 version). CIFLog is the world’s first third-generation logging processing and interpretation software based on Java-NetBeans cutting-edge computer technology. The data measured by the simulation measurement experiment are loaded to the CIFLog platform. In the data management of the data operation module, there are 11 conventional curves and 12 imaging curves in the data. The conventional curve includes depth, velocity, inclination, rotation angle and tension curve, etc.; the imaging curve includes the number of water droplets, the number of bubbles, the continuous phase of the liquid, the continuous phase of the gas, the maximum value of water, the maximum value of gas, the minimum value of water, The minimum value of gas, the average value of water, the average value of gas, the co-curve of water holdup and gas holdup, etc.

3. Experimental Data Analysis and Data Selection

3.1. Data Measurement Response Analysis

During the test, the instrument calibration was first carried out, and the calibration measurement was carried out when the flowrate of pure gas, pure water and pure oil were 0 and 250 m3/d, as shown in Figure 2, Figure 3 and Figure 4. The scale 0–5 indicates the probe serial number, and the lower scale 0-4096 indicates the range of the probe response value. When the value was 0, it was pure white, and when the value was 4096, it was pure black. As the response value increased in the middle part, the black became deeper and deeper. A holdup mapping analysis was conducted of the data measured in pure gas. As shown in Figure 2, at 0 and 250 m3/d, the water holdup was low, and the gas holdup was high. A holdup mapping analysis was conducted of the data measured in pure water. As shown in Figure 3, at 0 and 250 m3/d, the water holdup was high and the air holdup was low. A holdup mapping analysis was conducted of the data measured in pure oil. As shown in Figure 4, at 0 and 250 m3/d, the water holdup and gas holdup response were both low values. The scale of pure oil and pure water found that the fiber probe can effectively identify the gas, and the resistance probe can effectively identify the water. Comparing Figure 2, Figure 3 and Figure 4, it can be found that a single probe can only identify gas or water, but cannot accurately identify oil; however, the combination of resistance and optical fiber probes can be used as a new method to identify oil.
After analyzing the calibration data of pure gas, pure oil and pure water, the water cut of the total gas and water flowrate of 300 m3/d is 10%, 50%, and 90%, respectively, and the water cut of the total oil and water flowrate of 30 m3/d is 10%, 50%, 90% of the experimental data for graphical analysis, as shown in Figure 5 and Figure 6. In Figure 5, the gas holdup and water holdup are approximately complementary shapes. The responses of the fiber probe and the resistance probe verify each other’s measurement accuracy; from Figure 5, it can also be found that, as the moisture content increases, the water holdup increases. The gas holdup also decreases, and is eventually almost completely water. At the same time, according to the changes in the gas holdup and the water holdup response, it is inferred that it is a slug flow in this case. Compared with the video recorded in the experiment, the result remains consistent. In Figure 6, the fiber optic probe does not respond in the oil–water two-phase flow, and the gas holdup is 0. Under low water cut conditions, the water holdup response is relatively stable, and the water holdup does not significantly change. The response is good when the water cut is high, and the performance is better. There is a good response to changes in water holding capacity. Under different water cut conditions, the probe response value is stable during the measurement process. The oil–water flow is analyzed as a smooth stratified flow at this flowrate. Compared with the photos recorded during the experiment, the results of the two are consistent. In addition, the analysis may be due to the relationship between the structure of the instrument and the position of the probe, which may result in no change in the holdup response when the water cut changes.

3.2. Data Interpolation Imaging Analysis

During the simulation measurement experiment, the array capacitance CAT and the array resistance RAT of some 12 probes were measured simultaneously with AORT. According to the experiment and field experience, the capacitance probe response is better than the resistance probe under the conditions of low water cut. The response of the resistance probe is better than that of the capacitance probe under the conditions of high water cut. The probe response value was obtained when the total flowrate of gas and water was 300 m3/d and the total flowrate of oil and water was 30 m3/d, and interpolation imaging was gathered. Through the comparison and analysis of the literature research, this article adopts a simple distance inverse weighting, which is more effective in the ring array instrument interpolation algorithm [12,13,14,15]. The water holdup of the wellbore section was calculated through the holdup diagram, and then the comparison and analysis were performed. The interpolation results are shown in Figure 7 and Figure 8.

4. Discussion

As shown in Figure 7, according to the experimental photos, it can be found that when the total flowrate of gas and water is 300 m3/d, the gas and water are separated. With the increase in the water cut, the height of the liquid level continues to rise, and the water holdup also constantly increases. The image obtained by interpolation of the data measured by CAT, RAT and AORT was compared with the experimental photos. In the case of separation of gas and water, the measured data of CAT and RAT can reflect the phenomenon that, as the water cut increases, the water holdup increases. The effect of RAT is better, which is closer to the experimental gas–water interface and water holdup; although AORT leads to a change in water holdup, the effect is slightly worse. However, the analysis showed that it is possible to use a combination of AORT and RAT instruments to perform gas–water two-phase measurements, use the AORT instrument to identify the fluid, determine the approximate range of the gas–water interface, and use the RAT data to perform further imaging calculations to obtain increased accuracy regarding the gas–water interface and gas holdup.
As shown in Figure 8, the experimental photos show that when the total oil–water flowrate is 30 m3/d, the interface height of the oil–water layer increases with the increase in the water cut, and the water holdup also increases. The image obtained by interpolation of the data measured by CAT, RAT and AORT can be compared with the experimental photos. In the case of oil–water layers, the measured data of CAT and RAT can reflect the phenomenon that, as the water cut increases, the water holdup increases. The effect of CAT is better, as it is closer to the experimental oil–water interface and water holdup; although AORT has a change in water holdup, the effect is slightly worse. However, the analysis shows that the combination of AORT and CAT instruments can be used to measure the oil and water phases. The AORT instrument is used for fluid identification to determine the approximate range of the oil–water interface, and the CAT data are used for further imaging calculations to obtain accurate oil and water interface and water holdup.

5. Conclusions

Through analysis of the calibration data of the AORT instrument, the response relationship of the instrument in pure gas, pure water and pure oil was established; through the imaging comparison and analysis of the gas–water and oil–water two-phase flow data, the AORT instrument is under the experimental conditions. Applicability was evaluated, suggestions for the combination of measuring instruments under different phases were put forward, and the following conclusions were obtained.
(1)
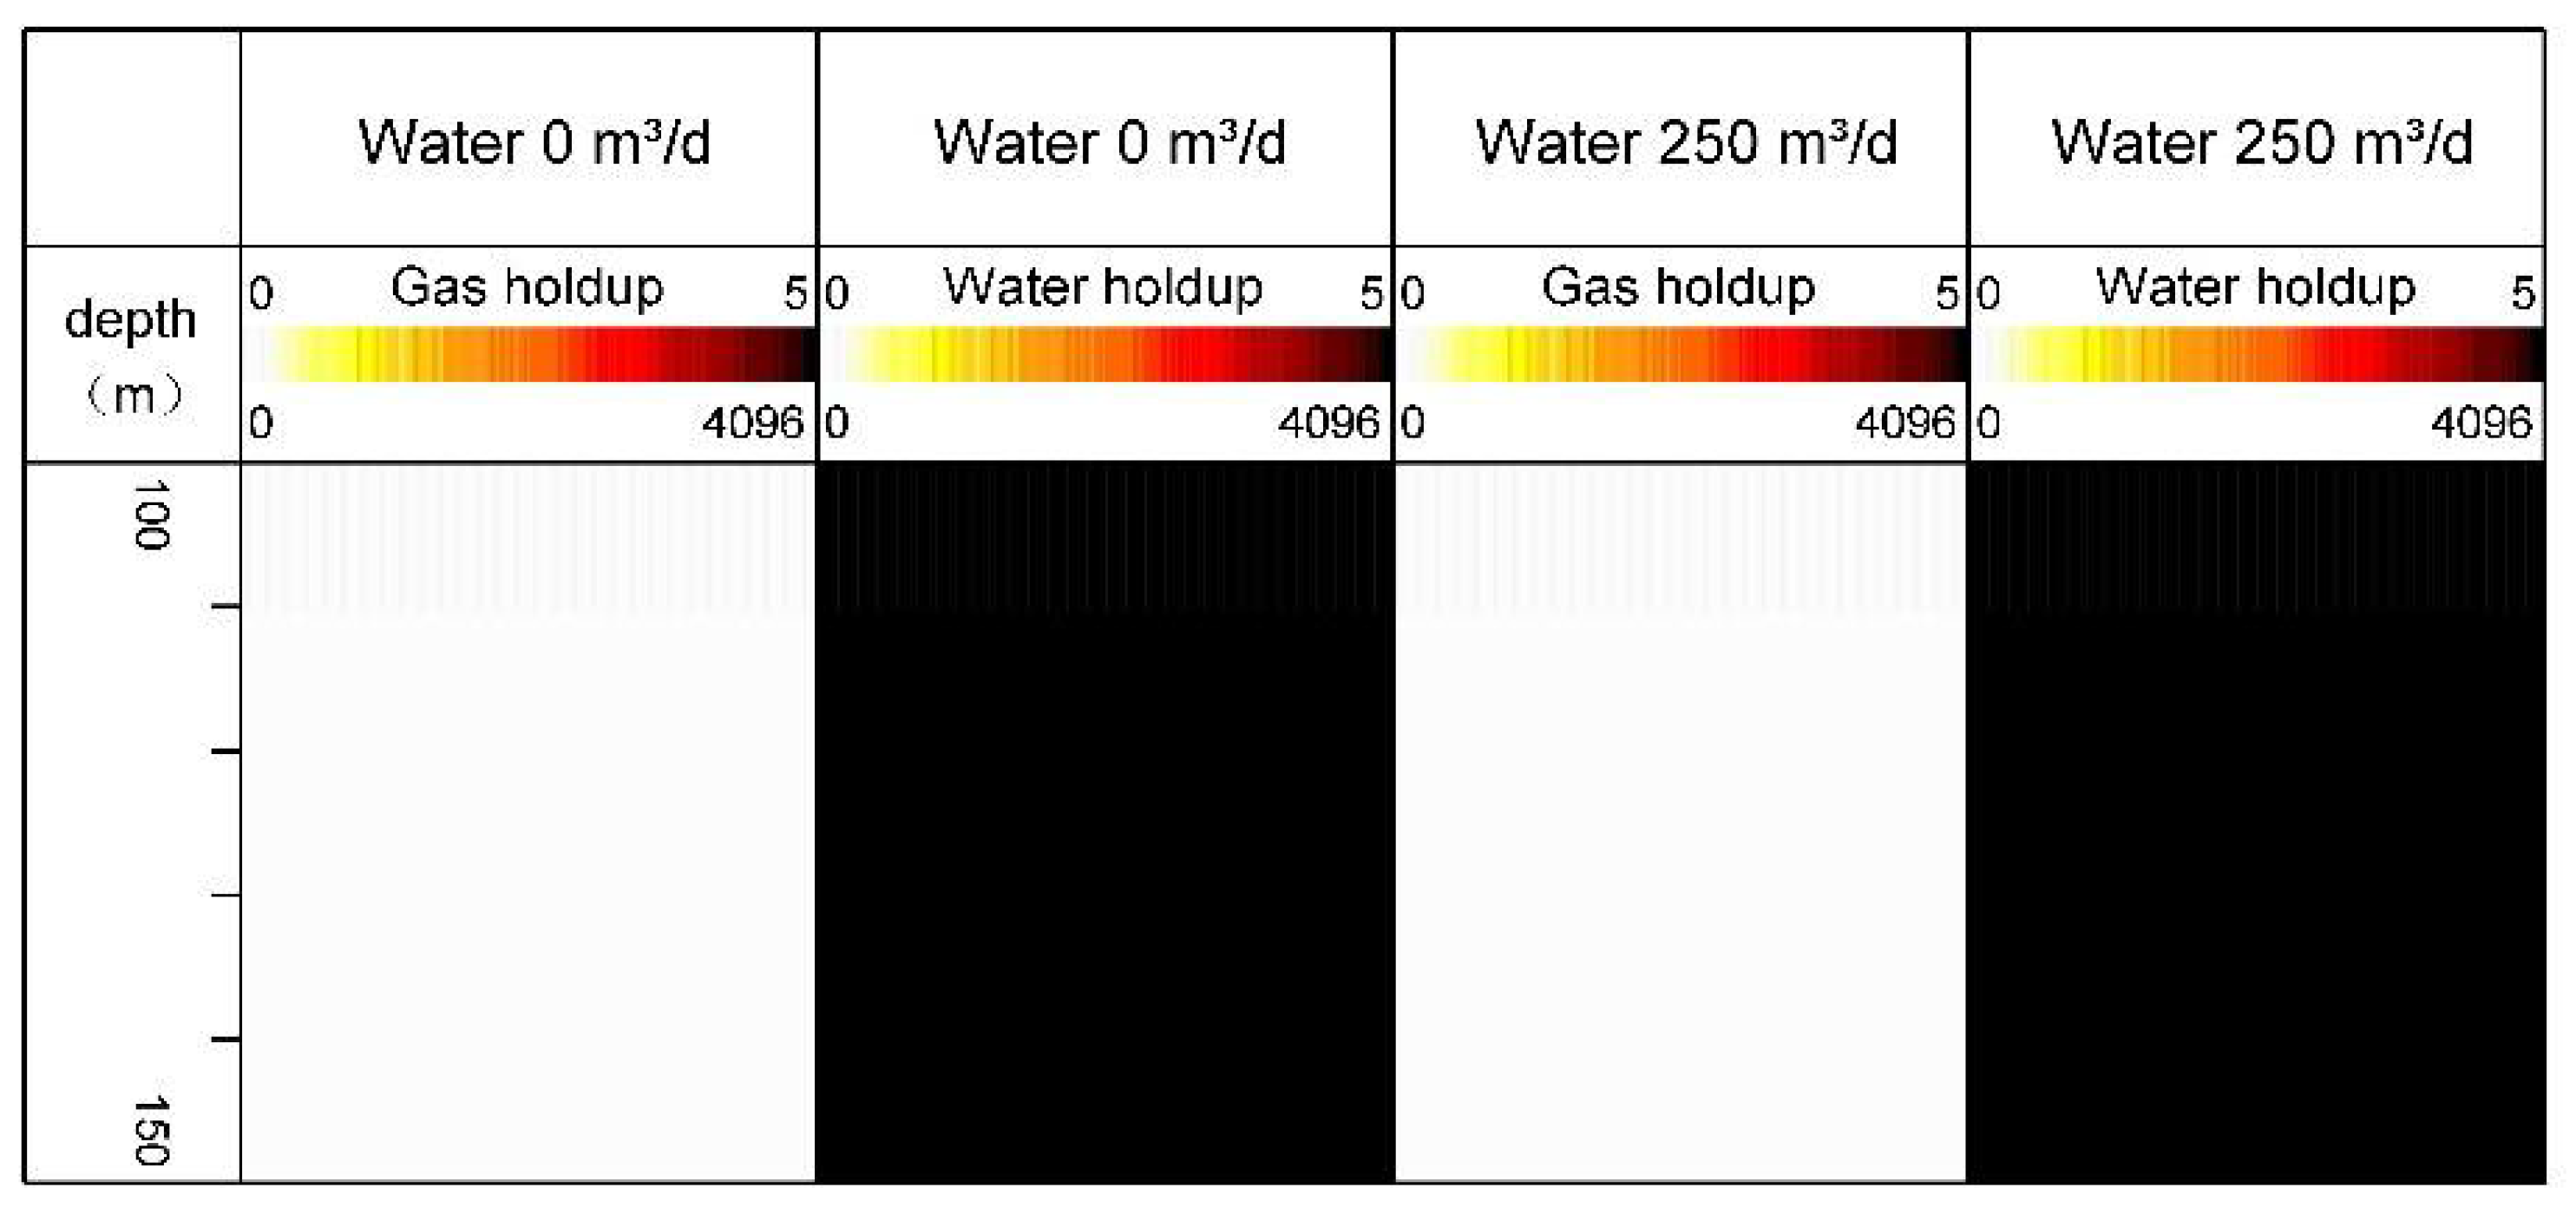
According to the calibration results in pure gas, pure water and pure oil, it can be seen that the fiber probe can accurately identify the gas, the resistance probe can accurately identify the water, and both of them have low identification accuracy for oil. Based on this response relationship, the combination of an optical fiber probe and a resistance probe can realize an accurate identification of oil, gas and water, to determine whether the fluid at the probe is gas, water, or oil.
(2)
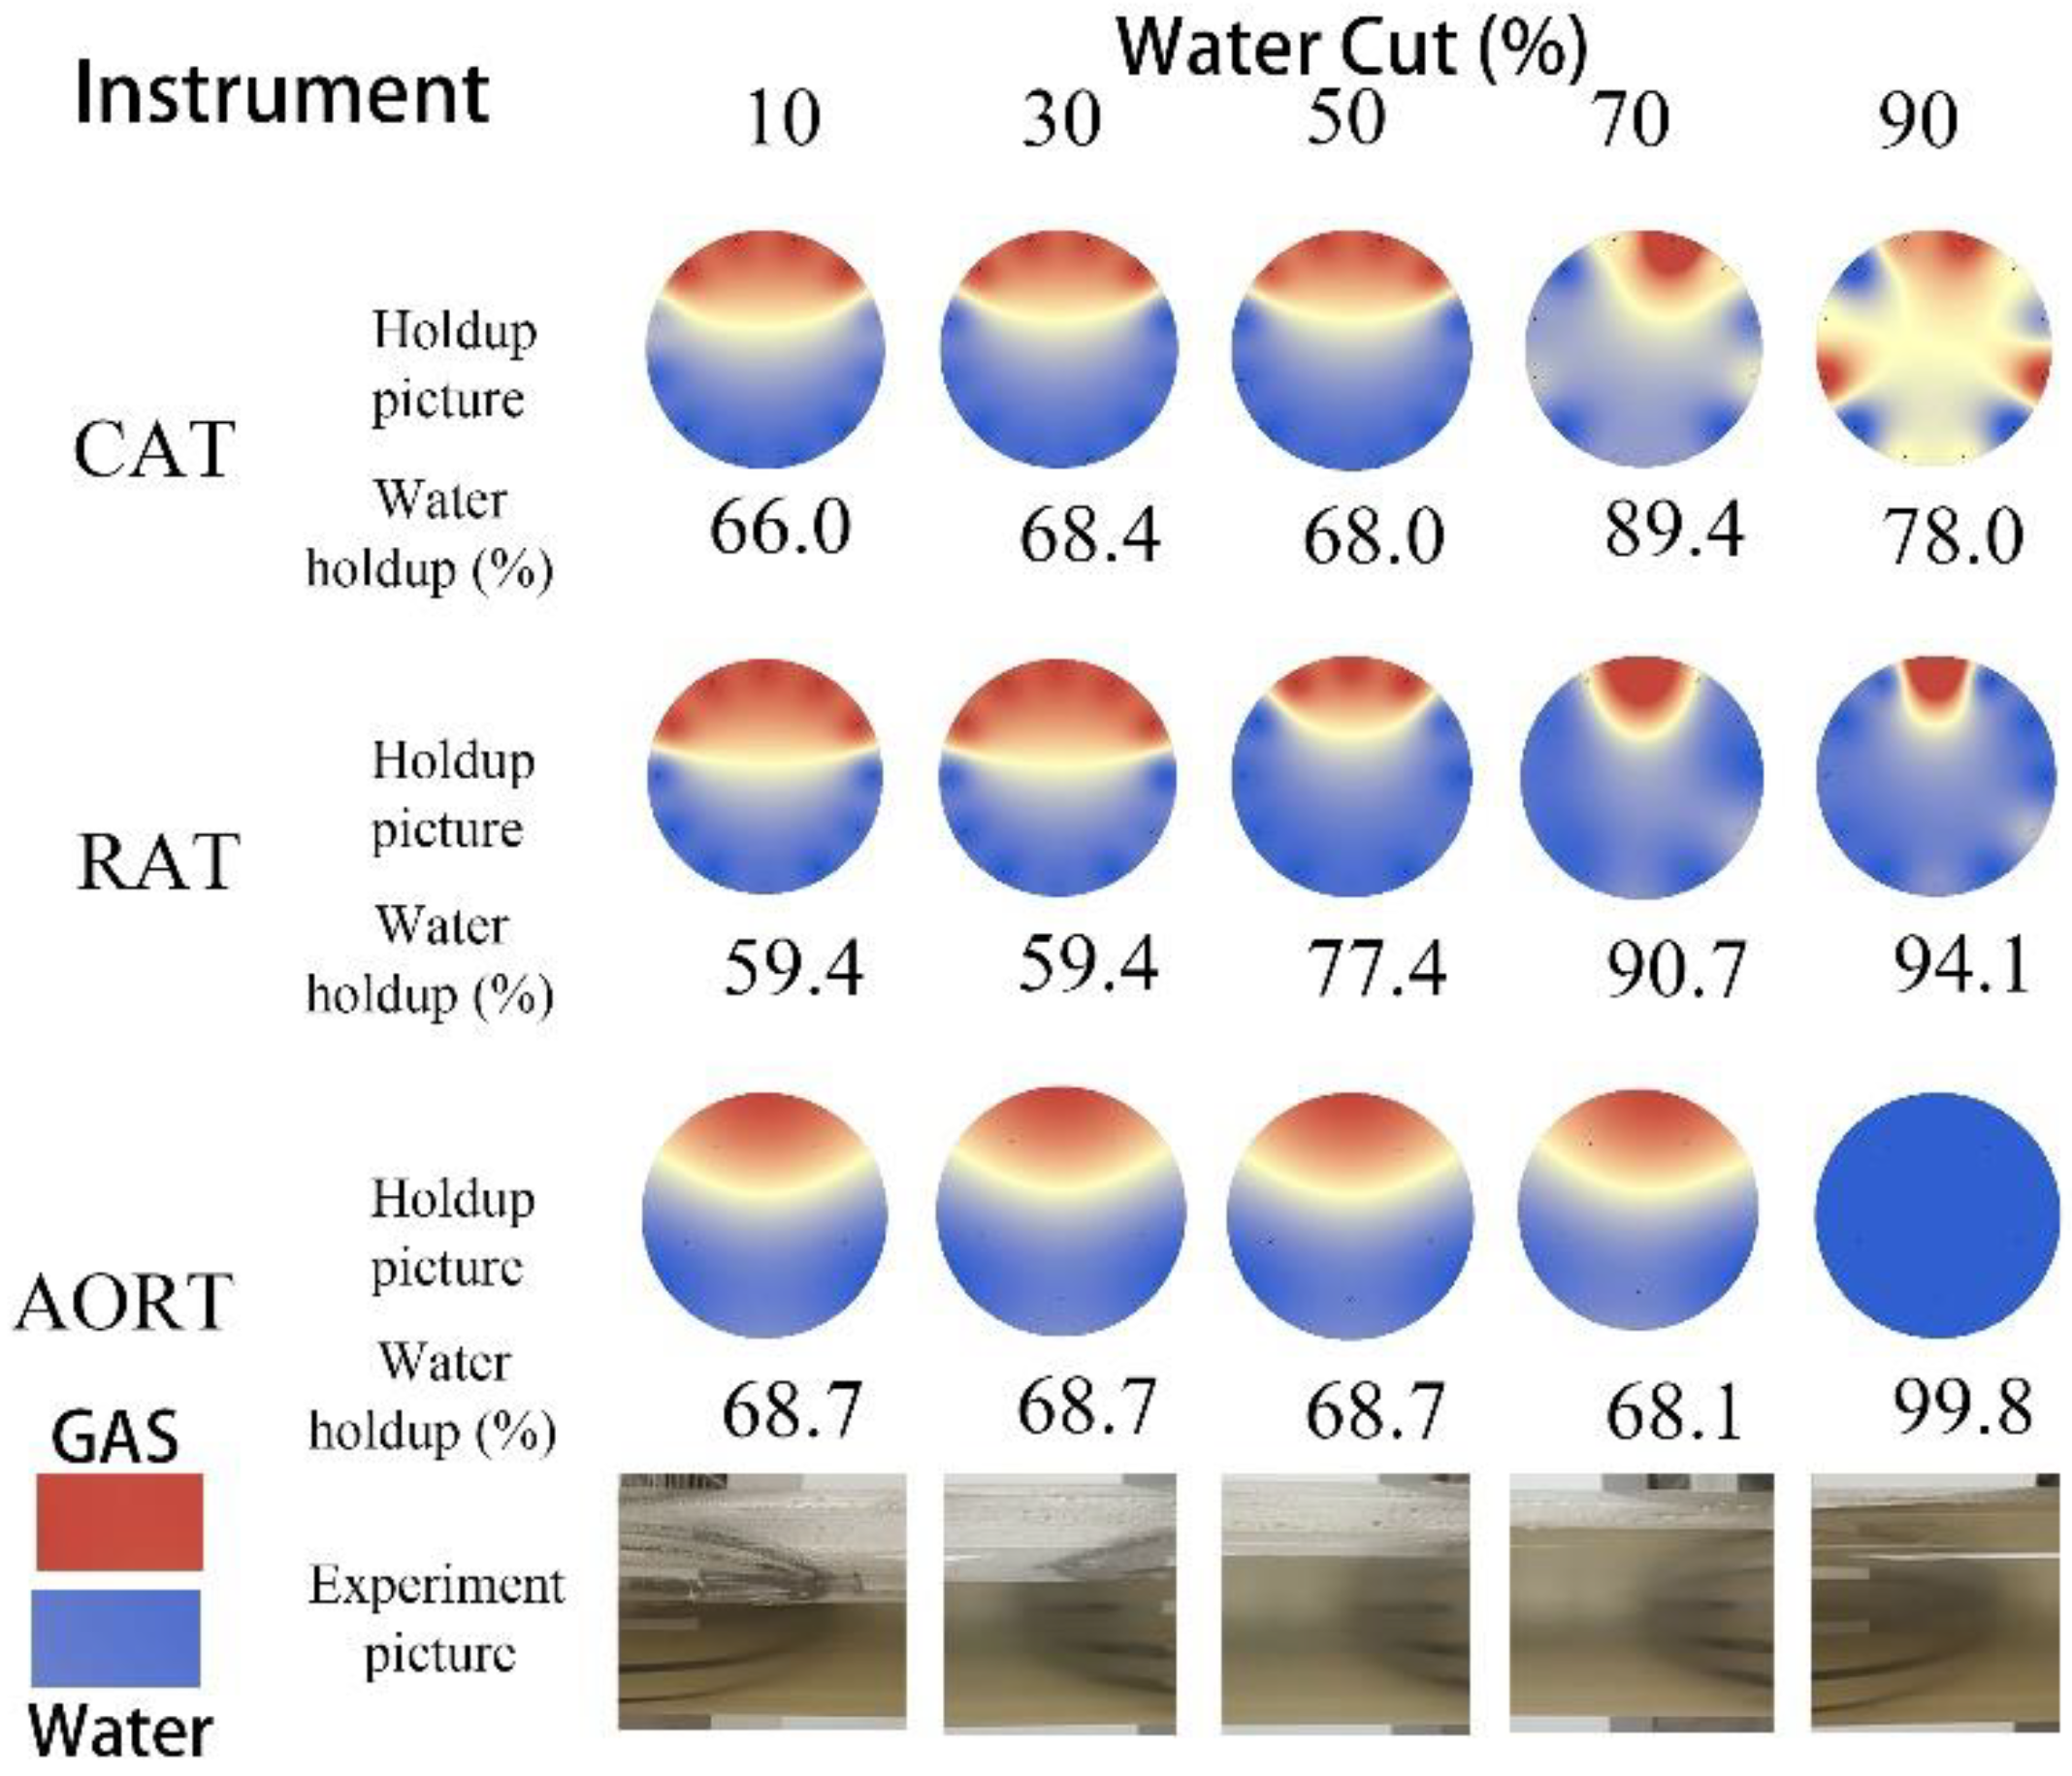
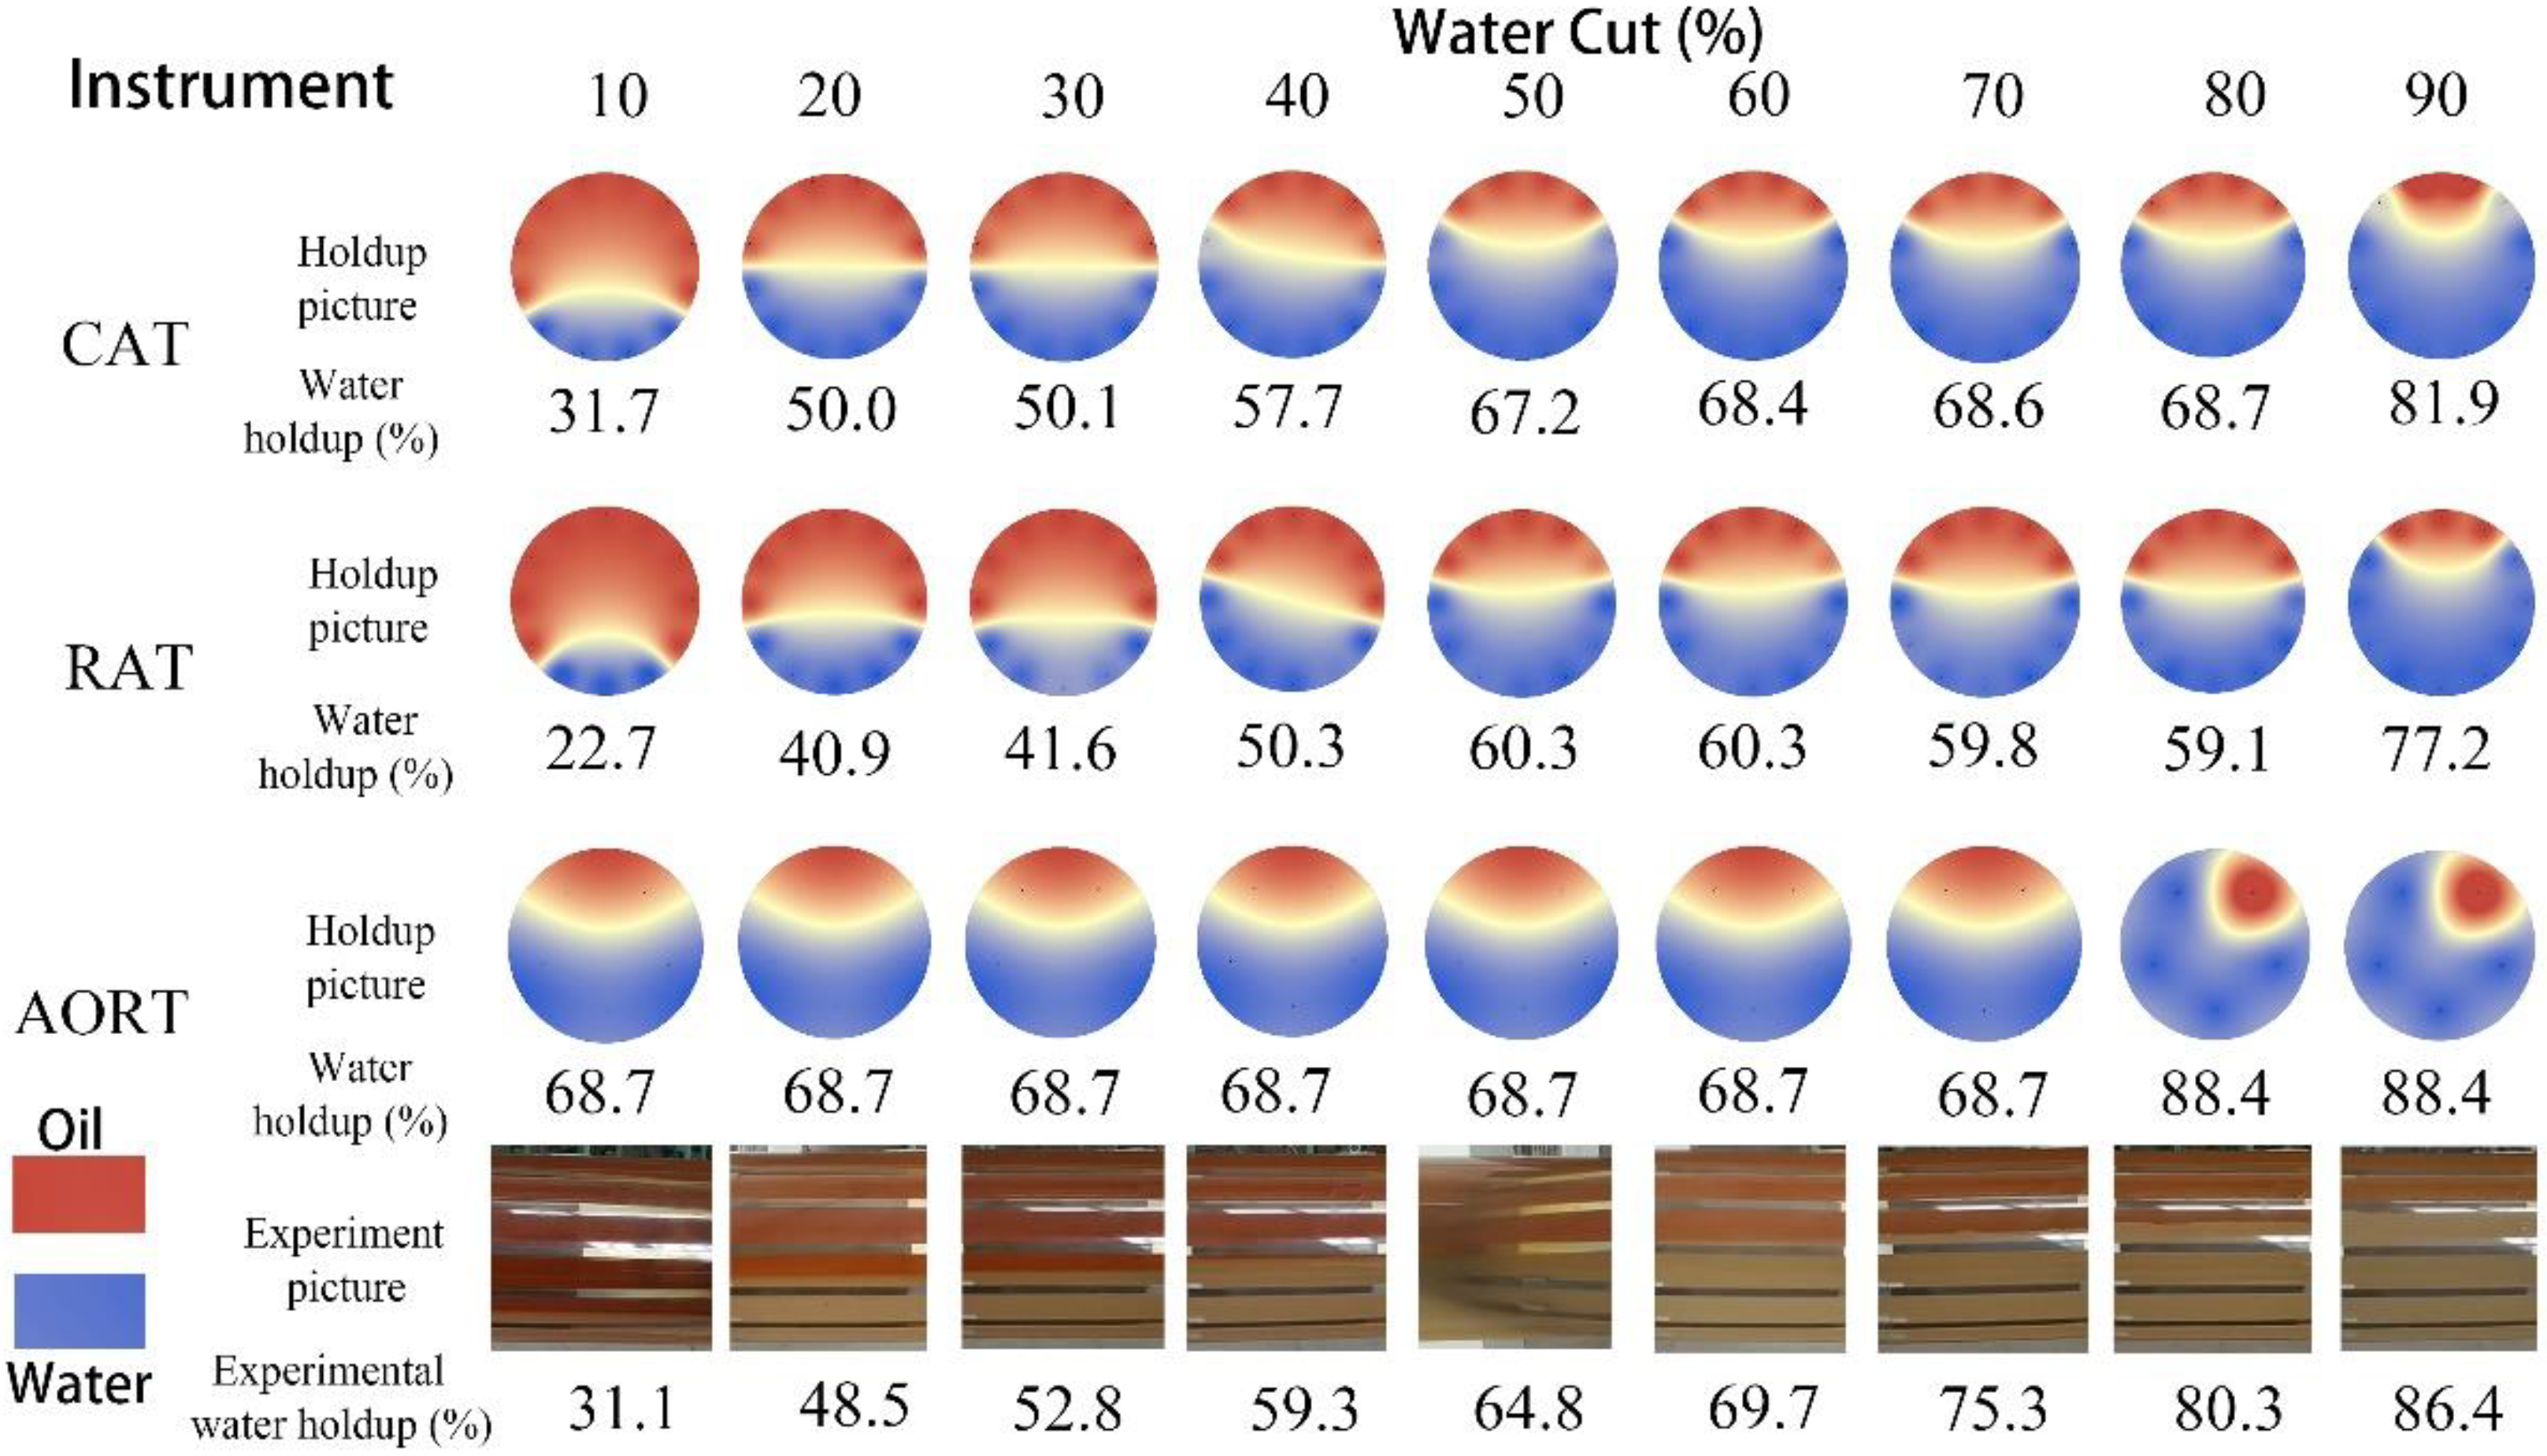
Through the data analysis and verification of gas–water and oil–water two-phase flow, the AORT instrument can accurately identify and distinguish oil, gas and water. Due to the small number of probes, there is a certain error in the measurement of holdup. Through comparative analysis with the data of RAT and CAT, it was determined to be better to use a combination of AORT and RAT for gas–water two-phase flow; while a combination of AORT and CAT is preferred for oil–water two-phase flow. Through the current experimental analysis, the advantages and disadvantages of the AORT instrument were found. According to the analysis of the experimental results, the combination of instruments were superior for use in the oil–water and gas–water two phase flow, providing a reference for subsequent instrument improvement and experiments.

Author Contributions

Conceptualization, S.C.; methodology, S.C.; software, Q.L.; validation, Q.L.; formal analysis, S.C.; investigation, S.C.; resources, J.L.; data curation, S.C.; writing—original draft preparation, S.C.; writing—review and editing, J.L.; visualization, S.C. and K.L.; supervision, K.L.; project administration, J.L.; funding acquisition, J.L. All authors have read and agreed to the published version of the manuscript.

Funding

This paper is supported by the Science Research Program from Hubei Provincial Department of Education (Grant No. D20151301) and Open Fund of Key Laboratory of Exploration Technologies for Oil and Gas Resources (Yangtze University), Ministry of Education (Grant No. K2018-10).

Institutional Review Board Statement

Not applicable.

Informed Consent Statement

Not applicable.

Data Availability Statement

Data is contained within the article.

Acknowledgments

All the data used in this paper are from the production logging Laboratory of Xinjiang Branch of China National Petroleum Logging Co., Ltd. The authors are grateful to the production logging laboratory of Xinjiang Branch of China National Petroleum Logging Co., Ltd.

Conflicts of Interest

The authors declare no conflict of interest.

References

  1. Guo, H.M. Introduction to Production Logging, 2nd ed.; Petroleum Industry Press: Beijing, China, 2010. [Google Scholar]
  2. Guo, H.M.; Dai, J.C.; Chen, K.G. Production Logging Principle and Data Interpretation; Petroleum Industry Press: Beijing, China, 2007. [Google Scholar]
  3. Parijat, M.; Zouhir, Z.; Hugh, R. The Role of Enhanced Production Logging Measurements in Challenging Openhole Horizontal Completions. In Proceedings of the SPE Annual Technical Conference and Exhibition, San Antonio, TX, USA, 24–27 September 2006; Volume 102198, pp. 1–7. [Google Scholar]
  4. Vu-Hoang, D.; Faur, M.; Marcus, R.; Cadenhead, J.; Besse, F.; Haus, J.; Di-Pierro, E.; Wadjiri, A.; Gabon, P.; Hofmann, A. A novel approach to production logging in multiphase horizontal wells. In Proceedings of the SPE Annual Technical Conference and Exhibition, Houston, TX, USA, 26–29 September 2004; pp. 1–11. [Google Scholar]
  5. Abbassi, L.; Tavernier, E.; Donzier, E.; Gysen, A.; Gysen, M.; Chen, C.K.; Zied, A.; Cedillo, G. Efficiency improvements in production profiling using ultracompact flow array sensing technology. Petrophysics 2018, 59, 457–488. [Google Scholar] [CrossRef]
  6. Ojukwu, K.I.; Khalil, M.I.; Clark, J.; Sharji, H.; Edwards, J.; Chang, T.K. Production logging low flow rate wells with high water cut. In Proceedings of the IPTC 2007: International Petroleum Technology Conference, Dubai, United Arab Emirates, 4–6 December 2007; pp. 1–11. [Google Scholar]
  7. Liu, J.F.; Xu, Y.Z.; Wu, Q.X. Flow imaging analysis of capacitive and resistive annular array probes. Prog. Geophys. 2018, 33, 2141–2147. [Google Scholar]
  8. Qin, H.; Dai, J.C.; Qin, M.J.; Pei, Y.; Wang, Z.T. Experimental study on the array water holdup meter for low-yield horizontal wells. Well Logging Technol. 2017, 41, 637–641, 647. [Google Scholar]
  9. Meng, X. Imaging Study of Horizontal Well Oil-Water Two-Phase Flow Based on MAPS. Master’s Thesis, Yangtze University, Wuhan, China, June 2019. [Google Scholar]
  10. Yin, G.P.; Liu, H.; Zou, Y.Y.; Chen, H.X. Application of production logging array imager in horizontal wells. Pet. Tubing Tools 2016, 2, 59–62. [Google Scholar] [CrossRef]
  11. Cui, S.F.; Liu, J.F.; Chen, X.L.; Li, Q.Z. Experimental Analysis of Gas Holdup Measured by Gas Array Tool in Gas–Water Two Phase of Horizontal Well. Coatings 2021, 11, 343. [Google Scholar] [CrossRef]
  12. Dukler, A.E.; Taitel, Y. Flow pattern transitions in gas–liquid systems: Measurement and modeling. Multiph. Sci. Technol. 1986, 2, 1–94. [Google Scholar] [CrossRef]
  13. Zhai, L.S.; Bian, P.; Han, Y.F.; Gao, Z.K.; Jin, N.D. The measurement of gas–liquid two phase flows in a small diameter pipe using a dual-sensor multi-electrode conductance probe. Meas. Sci. Technol. 2016, 27, 045101. [Google Scholar] [CrossRef]
  14. Liu, X.L. Study on imaging logging method of oil-water two phase flow in horizontal wells based on array probe. Pet. Tubing Tools 2018, 4, 70–73. [Google Scholar]
  15. Yan, C. Research on the Measurement Method of Stratified Flow Interface Characteristics of Horizontal Oil-Water Two-Phase Flow. Master’s Thesis, Tianjin University, Tianjin, China, June 2018. [Google Scholar]
Figure 1. Schematic diagram of AORT structure.
Coatings 11 01420 g001
Figure 2. Response characteristics of pure gas at 0 and 250 m3/d.
Coatings 11 01420 g002
Figure 3. Response characteristics of pure water at 0 and 250 m3/d.
Coatings 11 01420 g003
Figure 4. Response characteristics of pure oil at 0 and 250 m3/d.
Coatings 11 01420 g004
Figure 5. Response characteristics when water cut of 300 m3/d of gas and water is 10%, 50%, and 90%.
Coatings 11 01420 g005
Figure 6. Response characteristics when the water cut of 30 m3/d of oil and water is 10%, 50%, and 90%.
Coatings 11 01420 g006
Figure 7. Comparison of interpolation imaging under different water cut conditions of 300 m3/d of gas and water.
Coatings 11 01420 g007
Figure 8. Comparison of interpolation imaging under different water cut conditions of 30 m3/d of oil and water.
Coatings 11 01420 g008
Table 1. Simulation experiment measurement scheme.
Fluid NatureTotal Flowrate
(m3/d)
InstrumentWater Cut
(%)
Oil0 and 250CAT
+
RAT
+
AORT
100
Water0 and 2500
Gas0 and 2500
Gas-Water30010, 30, 50, 70, 90
Oil-Water30010, 20, 30, 40, 50, 60, 70, 80, 90
Table 2. Comparative analysis table of FSI, MPS and AORT.
InstrumentProbe TypeHoldupQuantityDistribution Method
CATCapacitanceWater holdup12Circular distribution
RATResistanceWater holdup12
AORTOpticalGas holdup5
ResistanceWater holdup5
Publisher’s Note: MDPI stays neutral with regard to jurisdictional claims in published maps and institutional affiliations.

