Abstract
The effects of specimen size and welded joints on the very high cycle fatigue properties of compressor blade steel KMN-I were studied by ultrasonic fatigue testing. It was found that the S-N curve of large specimens had a slow decline above 107 cycles, and fatigue failure still occurred in the very high cycle regime (>107 cycles), while the very high cycle fatigue characteristics of welded specimens was less obvious, and the fatigue limit was observed. Metallographic observation and SEM analysis were carried out on the fracture of the specimens. The results showed that surface fractures were mostly observed in the large specimens, and only a small number of cracks initiated from non-metallic inclusions above 107 cycles. The cracks of welded specimens initiated from the surface below 107 cycles and initiated from the internal matrix above 107 cycles. In addition, the formation mechanism of GBF (granular bright facet) was analyzed by the “dispersive decohesion of spherical carbide” theory, and the fatigue strength and fatigue life were predicted, which was consistent with the experimental results.
1. Introduction
The centrifugal compressor impeller is a typical gas delivery equipment which plays an important role in energy, petroleum, nuclear power, and other important industries. With an increase of rotation speed and service years of a large centrifugal compressor, the working life of impeller rotors that serve for decades has been far more than 107 cycles. In recent years, much research proved that there was no traditional fatigue limit in the S-N curve of many materials, especially high strength steels, in a very high cycle regime [1,2,3]. Therefore, it is no longer reliable to design a centrifugal compressor impeller with fatigue life and fatigue strength in the traditional S-N curve, and thus it is very important to study the very high cycle fatigue behavior and mechanism of compressor blade steel.
Welding is an important method of molding compressor impellers and blades. There is usually a stress concentration in the welded joint (such as the connecting parts of blades and wheel), which is prone to fatigue failure. Some scholars studied the very high cycle fatigue behavior of welded joints using the ultrasonic fatigue test system, and the results showed that the cracks mainly initiated from the welded seam, which is the most dangerous part of the welded joint. Zhu [4] studied the very high cycle fatigue properties of Cr-Ni-Mo-V welded joints at 370 °C. It was found that the main reasons for internal crack initiation at high temperature were matrix softening, surface oxidation, and surface compressive residual stress. Zhu [5] also studied the very high cycle fatigue properties of Cr-Ni-Mo-V welded joints at different frequencies. The results showed that most fatigue cracks initiated from the internal voids of the weld seam at 110 Hz, while the fatigue cracks usually initiated from internal non-metallic inclusions at 20 kHz. Cremer [6] studied the very high cycle fatigue properties of aluminum alloy welded joints. The results showed that the fatigue properties of the welded seam were relatively lower than those of the heat affected zone and the base metal, which proved that a welded seam containing weld defects was the weakest area of welded joints. In addition, currently most of the very high cycle fatigue tests use normal specimens. Due to the size effect, there is a difference between the fatigue properties of normal specimens and the actual components. The size of the normal specimen is calculated by the USF-2000 ultrasonic fatigue testing and KMN-I parameters. A specimen with this size can better resonate. In order to distinguish different sizes of specimens, larger specimens and normal specimens are called in the following part. Therefore, we mainly studied the effects of specimen size and welded joints on the very high cycle fatigue properties of compressor blade steel KMN-I, and hope to provide theoretical guidance for fatigue design and safe operation of welded compressor impellers.
2. Materials and Methods
KMN-I is an important material for the compressor blades due to its high strength and good weld ability. KMN-I is a low alloy steel with a metal grade of 15Cr2Mo1. The main chemical composition and mechanical properties of KMN-I are shown in Table 1 and Table 2. The heat treatment process is shown in Table 3.

Table 1.
Mechanical properties of KMN-I.
Table 2.
Chemical composition of KMN-I (wt.%).
Table 3.
Heat treatment process.
The size of the welding plate with an X-groove was 100 mm × 300 mm × 13 mm, and the plates were butt welded by manual arc welding, namely shielded metal arc welding (SMAW). The welding rod was a low carbon electrode, and the chemical composition was Cr14–Ni5–Mo1.5–Cu–1.5–Nb0.3. The preheating temperature of welding was 150 °C. The plates were carried out heat treatments before welding, and the heat treatment processes are shown in Table 3. The plates were carried out the same heat treatments after welding to relieve the residual stress.
The metallographic structure of the KMN-I base metal is mainly acicular and lath tempered troostite, as shown in Figure 1. The metallographic structure of the KMN-I welded specimen is shown in Figure 2. Due to the influence of the welding process, the microstructure of the welded seam is larger than that of the base metal.
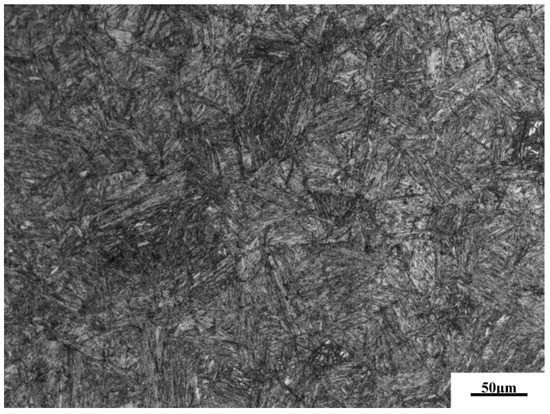
Figure 1.
Microstructure of the KMN-I base metal.

Figure 2.
Microstructure of the KMN-I welded joint. (a) Welded seam; (b) fusion zone.
A very high cycle fatigue test was carried out on the Shimadzu USF-2000 ultrasonic fatigue testing machine (Shimadzu, Kyoto, Japan) at a resonance frequency of 20 kHz and stress ratio R = −1. The thermal effect was not obvious for the large specimen, so the resonance time and interval time were set to 200 ms: 200 ms. For the welded specimen, the use of 200 ms: 200 ms intermittent ratio was likely to cause specimen burning due to the thermal effect, so the resonance time and interval time were set to 200 ms: 600 ms to give the specimen better heat dissipation. During the test, compressed cold air was used to cool the specimen until fatigue failure of the specimen occurred or up to 109 cycles. The shape and dimensions of the specimens are shown in Figure 3. Among them, the welded specimen is shown in Figure 3a, and the minimum diameter was 3 mm. The large specimen is shown in Figure 3b, and the minimum diameter was 4.5 mm. The normal specimen was the same size as the welded specimen, while the welded specimen was taken from a welded plate. The weld zone was located at the minimum diameter of the specimen after processing. Specimens were polished by 2000 mesh sandpaper before the test. The maximum stress during the test was located in the minimum section of the specimen.
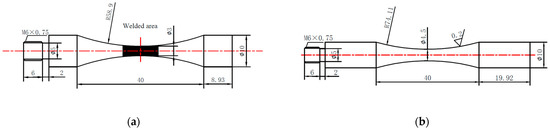
Figure 3.
Shape and dimensions of the specimens (in mm). (a) Welded specimen; (b) large specimen.
3. Results
3.1. S-N Curve
First, the very high cycle fatigue S-N curve of the large specimen obtained from the experiment was compared with the S-N curve of the normal specimen previously obtained, as shown in Figure 4. It was found that the S-N curve of the large specimen had a slow decline above 107 cycles, and fatigue failure still occurred in the very high cycle regime (>107 cycles). There was no fatigue limit in the S-N curve. Compared with the S-N curve of the normal specimen, we found that the S-N curve of the large specimen had a downward movement, and the fatigue strength was reduced by about 75 MPa. This is mainly because the control volume of the large specimen was larger, and correspondingly the possibility of microstructure defects in the dangerous location was larger. So, the fatigue strength of the large specimen was reduced.

Figure 4.
The very high cycle fatigue S-N curve of large specimens.
Similarly, we obtained the very high cycle fatigue S-N curve of the welded specimen and compared it with the S-N curve of the normal specimen previously obtained, as shown in Figure 5. It was found that the fatigue strength of the welded specimen was lower than that of the normal specimen. Fatigue failure mainly occurred below 107 cycles, which did not show the characteristics of the continuous decline in the very high cycle fatigue regime. The fatigue limit was observed, which was about 450 MPa.
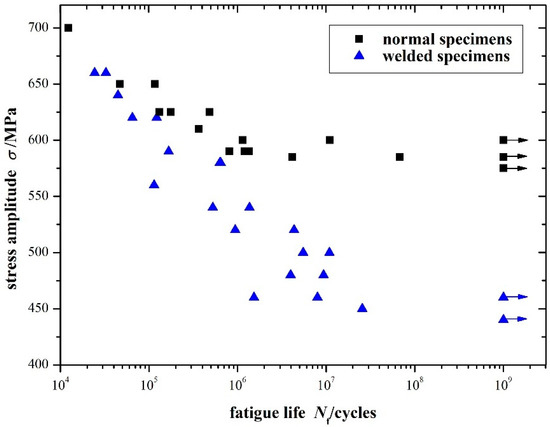
Figure 5.
The very high cycle fatigue S-N curve of welded specimens.
3.2. Fracture Surface Observation
The specimen resonated during the test. When fatigue failure occurred, the natural frequency of the specimen changed, and then the test automatically stopped. The specimen was broken in liquid nitrogen, and the fracture surface was observed using SEM (scanning electron microscope). The experimental results showed that there were two crack initiation modes in the large specimens: internal initiation and surface initiation. The fatigue cracks below 107 cycles initiated from surface defects, while the fatigue cracks above 107 cycles usually initiated from internal inclusions, as shown in Figure 6. There were also individual specimens above 107 cycles in which cracks initiated from surface defects, as shown in Figure 7.

Figure 6.
Internal inclusion crack initiation of the large specimen (σa = 520 MPa, Nf = 4.25 × 10⁷).

Figure 7.
Surface crack initiation of the large specimen (σa = 510 MPa, Nf = 1.06 × 10⁸).
Fatigue cracks that initiated from the surface were mainly caused by a dislocation slip at the stress concentration of the specimen surface. When fatigue failure occurred below 107 cycles, the fatigue crack mainly initiated from surface defects. With an increase of the fatigue cycles (above 107 cycles), the fatigue crack tended to transfer to internal initiation. However, not all fatigue cracks above 107 cycles initiated from the interior. When the internal inclusions were small or there were obvious surface defects, the fatigue crack in the very high cycle regime may also initiate from the surface stress concentration [7,8,9]. Internal crack initiation is a significant feature of very high cycle fatigue. Because the very high cycle fatigue characteristics of the compressor blade steel KMN-I were not obvious, there was relatively less fatigue failure above 107 cycles, and there were also less fatigue cracks that initiated from internal inclusions. Energy spectrum analysis was carried out at the internal inclusion, as shown in Figure 8. The chemical composition was mainly MnS, in addition, there were a small amount of impurity elements such as Ti and Si. MnS was the main inclusion component of KMN-I, and the same inclusions had been found in many other specimens.

Figure 8.
Energy spectrum analyses of KMN-I large specimen inclusion.
Then, we analyzed the fatigue fracture of the welded specimens and found that there were also two kinds of fatigue crack initiation modes. Fatigue cracks below 107 cycles initiated from surface defects, while fatigue cracks above 107 cycles mainly initiated from the internal matrix, as shown in Figure 9 and Figure 10. Fatigue cracks were transferred from surface initiation to internal initiation in the very high cycle regime. Most of the fatigue cracks of the welded specimens in this regime initiated from the internal matrix, and no specimen of internal inclusion crack initiation was observed. This may be because the KMN-I specimen had a high purity of metallographic structure and less inclusions, so the internal fatigue crack initiated from the weak matrix. In addition, there was a highlighted area called the GBF (granular bright facet) around the fatigue source area, which was relatively rough. Some researchers think that the boundary of the GBF is the boundary of the crack initiation area and the crack propagation area [10]. The GBF was surrounded by a relatively smooth area, which was caused by the slow propagation of the crack. When the fatigue crack propagated to the specimen surface, the crack propagation rate changed due to the change of the stress intensity factor. This difference in the rate of crack propagation led to the formation of the “fish-eye” area [11,12]. In some specimens, the fish-eye area was less obvious because the fatigue source was far from the specimen surface, which meant that the transformation of the crack propagation speed was not obvious.
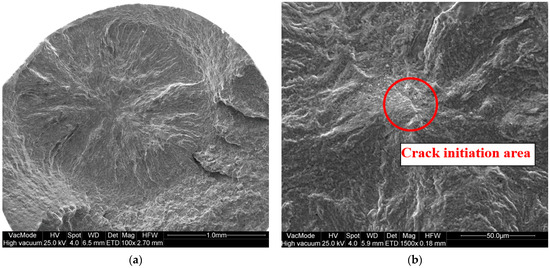
Figure 9.
Internal matrix crack initiation of the welded specimen (σa = 480 MPa, Nf = 9.36 × 10⁶). (a) Fracture cross section; (b) crack initiation area.

Figure 10.
Internal matrix crack initiation of the welded specimen (σa = 500 MPa, Nf = 1.09 × 10⁷).
Similarly, the fatigue cracks of the welded specimens below 107 cycles initiated from the surface, which was also caused by the dislocation slip at the stress concentration of the specimen surface, as shown in Figure 11.

Figure 11.
Surface crack initiation of the welded specimen (σa = 540 MPa, Nf = 1.36 × 10⁶).
3.3. Formation of the GBF
GBF is the main region of the very high cycle fatigue crack initiation, so the formation mechanism of the GBF is of great significance in studying the very high cycle fatigue behavior of the material. There are two main points of view for the formation of the GBF: Shiozawa proposed the “dispersive decohesion of spherical carbide” model [10], which stated that first some micro-cracks initiated from the inclusions, and then the micro-cracks merged around the carbides to form the GBF. Murakami observed the enrichment of hydrogen around the inclusions through hydrogen isotope ray imaging and secondary ion mass spectrometry, and proposed the theory of hydrogen promotion [3].
We found that the carbon element content in the fatigue source area was relatively high in the previous fracture microstructure analysis. In order to observe the influence of the carbon element more intuitively, we analyzed the distribution of the carbon element around the fatigue source area of the internal crack initiation using an electron probe, as shown in Figure 12. It was found that the enrichment of carbon elements around the fatigue source area was more obvious, which proved that the carbon element promoted the formation of the GBF.
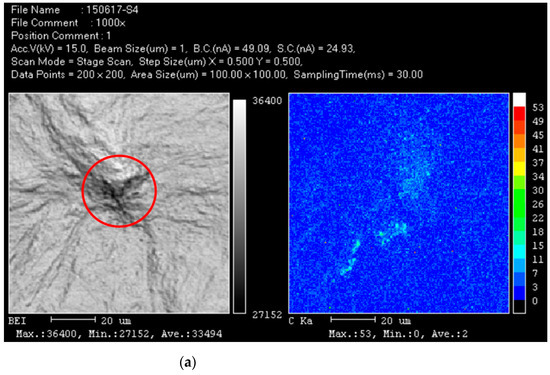
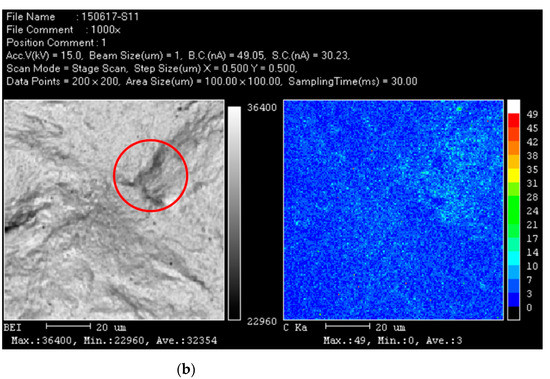
Figure 12.
Electron probe scanning results of the welded specimen. (a) Specimen 4 (σa = 480 MPa, Nf = 9.36 × 10⁶); (b) Specimen 18 (σa = 500 MPa, Nf = 1.09 × 10⁷).
4. Discussion
Very high cycle fatigue behavior usually appears in high strength steel (Rm ≥ 1600 MPa), but is not obvious in low strength steel. In the fatigue damage stage, cyclic stress attacks both surface and internal defects, and it is considered that the site which is selected for crack initiation is always competitive. It can be found that the microstructure is acicular and lath troostite, which is unfavorable for the propagation of micro-cracks, so it is easier for cracks to initiate from the surface [13]. In addition, there were relatively few inclusions of KMN-I, so the very high cycle fatigue characteristic of KMN-I was inconspicuous. Since the cracks mainly initiated from the surface, surface roughness and defects are discussed below in order to research their influence on fatigue strength and fatigue life.
4.1. Fatigue Strength Prediction
The GBF has an important role in determining the very high cycle fatigue strength (fatigue strength at 109 cycles in this paper, hereinafter referred to as “fatigue strength”). Most prediction models of very high cycle fatigue strength were obtained by inclusion and GBF characteristics. Among them, the model established by Murakami, et al. [14,15,16] is widely used because it contains fewer physical quantities and is easy to measure. The Murakami model regards the inclusion as a penny-shaped crack in an infinite volume using linear elastic fracture mechanics. Regarding crack propagation around inclusions as a critical condition, the “inclusion equivalent projected area model” was established, which correlates the fatigue strength with the hardness of the matrix and the size of the inclusion. The fatigue strength with interior nonmetallic inclusions can be expressed as:
where HV is the Vickers hardness of the material in kgf/mm2 and equivalent inclusion size is the square root of the inclusion projection area perpendicular to the maximum principal stress, approximately 0.886 times the diameter of the inclusions, in units of μm. When the inclusion is located in a different location, such as the surface, the subsurface, and the interior, the modulus C is 1.43, 1.41, and 1.56, respectively.
For compressor blade steel KMN-I, the cracks usually initiated from the surface, and therefore we focused on the fatigue strength determined by surface detects and surface roughness. Murakami et al. thought that the fatigue strength with surface roughness was determined by the threshold condition for non-propagation of a crack emanating from a notch root. Referring to the definition of , the equivalent surface defect size () was established to describe the influence of the surface roughness on fatigue strength [15]. can be determined by Equations (2) and (3) according to different situation.
where a and b are parameters of surface roughness: a is the vertical distance between the maximum peak and valley (namely Rz), which is the depth of the surface defect perpendicular to the maximum principal stress. 2b is the horizontal distance between two peaks. Murakami regarded surface roughness as a periodic distribution, which meant that 2b was a constant, while surface roughness was random in the actual situation. Itoga et al. [17] thought that 2b should be the average distance between two peaks without small peaks and valleys, as shown in Figure 13. Ra is the average depth of surface defects. Rz is the vertical distance between the maximum peak and valley. Compared with the experiment results, it is found that when a is set to Rz, the predicted value of the Murakami model is more consistent with the fatigue strength obtained in the experiment. When a is set to Ra, the predicted value of the Murakami model is quite different from the experimental results. Therefore, a is set to Rz in the subsequent analysis.

Figure 13.
Schematic diagram of depth and spacing of surface roughness.
Based on the Murakami model, was introduced in Equation (1) instead of . Then, fatigue strength determined by surface roughness can be expressed as:
We measured the surface roughness of the specimens using a white light interferometer. The values of a and 2b were obtained, as shown in Figure 14. Then, was calculated using Equation (2), and the fatigue strength of Murakami model was obtained, as shown in Table 4.
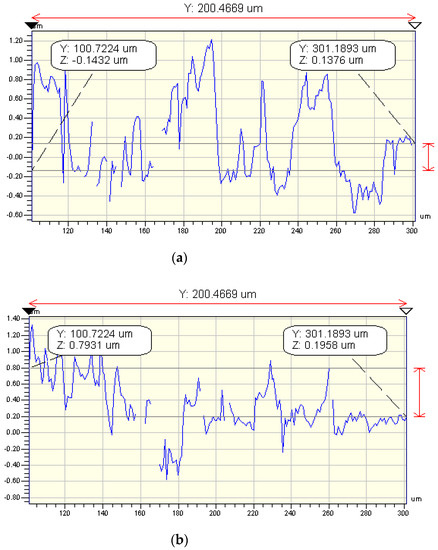
Figure 14.
Surface roughness of KMN-I specimens. (a) Large specimen; (b) welded specimen.
Table 4.
Fatigue strength of Murakami model and related parameters.
The fatigue strength of the large specimen and welded specimen at 109 cycles extrapolated by the S-N curve was about 500 MPa and 440 MPa, respectively, and the Murakami fatigue strength model predictions were 508 MPa and 487 MPa, respectively. The roughness in certain locations was used to reflect the overall state of roughness. There will be some deviation due to the inhomogeneity of the surface roughness.
The Murakami model assumed surface roughness as a uniform defect, however, the surface defect in the minimum cross-section of the specimen is the decisive reason for crack initiation in the actual situation. Therefore, fracture mechanics were introduced to modify the Murakami fatigue strength model. Assuming there was a surface crack with a depth of Rz in the middle of the specimen, then regarding crack propagation as a critical condition, the modified model of fatigue strength was obtained.
For a surface crack with an arbitrary shape, the depth of the crack was assumed as a, and the minimum radius of the specimen was R. When a/R approaches zero, it can be equivalent to a surface crack in a semi-infinite solid under uniform tension. The stress intensity factor is:
When the width of the crack is ten times larger than the depth of it, the defect area can be calculated by 10a2 [18], namely . The stress intensity factor threshold calculated using the Murakami model is:
Combining Equations (5) and (6) we can derive the modified fatigue strength model determined by a surface crack with an arbitrary shape.
Combined with the surface roughness of the compressor blade steel KMN-I, the fatigue strength estimated by the modified model can be obtained. The results of the Murakami model and the modified model are compared, as shown in Table 5.
Table 5.
Comparison between the Murakami model and the modified model.
Comparing the two prediction models, it was found that the prediction results of the modified model were closer to the experimental results, which prove the validity of this modified model.
4.2. Fatigue Life Prediction
The initiation life of the very high cycle fatigue crack accounts for the majority of the total fatigue life, so we can use initiation life of the crack to estimate the total fatigue life. Tanaka and Mura proposed an estimation model of crack initiation life [19]:
where Ni is the initiation life of the crack, Ws is the specific fracture energy of KMN-I, Δτ is the range of local shear stress, and τf is the friction stress that needs to be overcome the dislocations. According to the different initiation locations of the crack, the function A has different values:
where G is the shear modulus of the KMN-I matrix, Gi is the shear modulus of the inclusion, l is the semilength of the slip band, h is the semi-minor size of the elliptical slip band, and ν is Poisson’s ratio.
Wang et al. [20] simplified the model according to the following assumptions: the crack initiation size ai is equal to the inclusion size a0, the semi-minor length of the slip band l is equal to the semi-minor length of the elliptical slip band area h, the shear modulus of inclusion Gi is equal to the shear modulus of matrix G, and the friction stress τf is half of the shear fatigue limit, namely, when the stress amplitude is less than 2τf, the crack cannot initiate.
According to the von Mises yield criterion, the relational expression between the shear stress amplitude and the allowable stress amplitude is:
The friction stress can be expressed as:
where is the fatigue limit with a stress ratio of R, which is denoted as σ−1 when R = −1.
Thus, the initiation life of the crack can be expressed as:
When a very high cycle fatigue crack initiates from internal inclusions, the initiation life of the crack can be expressed as:
When a very high cycle fatigue crack initiates from the surface slip band, the initiation life of the crack can be expressed as:
Assuming the fatigue crack propagation follows the Paris formula:
where a is the crack length, N is the fatigue cycle, and C and n are the material parameters. For Cr-Mo steel, C, n, and ΔKth are 2.0 × 10⁻¹¹, 2.5 and 3.3 MPa, respectively [21].
Wang simplified the propagation life model of the high cycle fatigue crack based on long and short crack behavior:
where β1 is the geometric constant (β1 = 0.5).
Thus, when the very high cycle fatigue crack initiates from internal inclusions, the total fatigue life of the crack can be expressed as:
The fatigue limits of three groups of S-N curves (normal specimen, large specimen, and welded specimen) were 565 MPa, 488 MPa, and 453 MPa, respectively. The specific fracture energy of low carbon steel (Ws ≈ 3.8 × 10⁵ N·m−1 [20]) was used in this study, and the estimated results of the very high cycle fatigue life are shown in Table 6.
Table 6.
Comparison of the very high cycle fatigue life estimation model and experimental results.
It can be seen that the prediction model agrees relatively well with the test results, except for specimen 5-4#. The error of fatigue life is usually very large due to the discrete fatigue test. In addition, there were fewer specimens with internal cracks in this project, which caused the error to become larger. The initiation life of the very high cycle fatigue crack is much larger than the propagation life, which proves that the initiation life of the very high cycle fatigue crack is the majority of the total fatigue life. Therefore, we can ignore the propagation life of the crack in the subsequent calculation, and use the initiation life of the crack to approximate the total fatigue life.
Because most of the fatigue cracks in this experiment initiated from the surface slip band, we used Equation (14) to estimate the very high cycle fatigue life of the material. The fatigue life estimation model can be simplified as:
Similarly, the material parameters of KMN-I were put into Equation (18), and l was about half the grain size (10 μm). The estimated results are shown in Figure 15.

Figure 15.
Very high cycle fatigue life prediction model of KMN-I.
It can be seen that the fatigue life prediction results of the KMN-I large specimen and welded specimen were in good agreement with the experimental results, especially in the high and very high cycle regime (above 106 cycles). In the low cycle fatigue regime, the prediction model was higher than the experimental results, which may be because the vibration of the specimen during the test was very large when the stress amplitude was high. The temperature rise led to burning of the specimen surface, and the crack did not sufficiently propagate. Therefore, the measured fatigue life was relatively lower than the model prediction results.
5. Conclusions
The very high cycle fatigue S-N curves of the compressor blade steel KMN-I needed were obtained through ultrasonic fatigue tests of large specimens and welded specimens, which provided theoretical support for the follow-up design of compressor impeller blades. The experimental results demonstrated:
(1) Large specimens of KMN-I had a slow decline above 107 cycles, and fatigue failure still occurred in the very high cycle regime (>107 cycles). The very high cycle fatigue characteristics of the KMN-I welded specimens were inconspicuous, and the fatigue limit was observed. The fracture SEM showed that the surface fractures were mainly observed in large specimens, and a small number of cracks initiated from non-metallic inclusions above 107 cycles, while cracks of the welded specimens initiated from the surface below 107 cycles and initiated from the internal matrix above 107 cycles.
(2) The formation mechanism of GBF was explained by the theory of “dispersive decohesion of spherical carbide”. The enrichment of carbides leads to the initiation of the fatigue crack at the weak matrix of the material.
(3) The Murakami fatigue strength model was modified using fracture mechanics, and the modified model was closer to the experimental results. The parallel layer model was used to predict the very high cycle fatigue life of the compressor blade steel KMN-I. It proved that the initiation life of the very high cycle fatigue crack accounts for the majority of the total fatigue life.
Author Contributions
P.W. contributed to formal analysis, and edited the manuscript; W.W. contributed to methodology and performed data curation; M.Z. and Q.Z. completed the experiment. Z.G. was involved in project administration. All authors have read and agreed to the published version of the manuscript.
Funding
This research was funded by National Natural Science Foundation of China (Grant No. 51905484) and Zhejiang Province Public Welfare Technology Application Research Project (Grant No. LGG20E050018).
Institutional Review Board Statement
Not applicable.
Informed Consent Statement
Not applicable.
Data Availability Statement
Not applicable.
Acknowledgments
Thanks to Edward C. Mignot, Shandong University, for linguistic advice.
Conflicts of Interest
The authors declare no conflict of interest.
References
- Naito, T.; Ueda, H.; Kikuchi, M. Observation of fatigue fracture surface of carburized steel. J. Soc. Mater. Sci. Jpn. 1983, 32, 1162–1166. [Google Scholar] [CrossRef]
- Sakai, T.; Sato, Y.; Oguma, N. Characteristic S-N properties of high-carbon-chromium-bearing steel under axial loading in long-life fatigue. Fatigue Fract. Eng. Mater. Struct. 2002, 25, 765–773. [Google Scholar] [CrossRef]
- Murakam, Y.; Nomoto, T.; Ueda, T. Factors influencing the mechanism of superlong fatigue failure in steels. Fatigue Fract. Eng. Mater. Struct. 1999, 22, 581–590. [Google Scholar] [CrossRef]
- Zhu, M.L.; Xuan, F.Z.; Du, Y.-N.; Tu, S.-T. Very high cycle fatigue behaviour of a low strength welded joint at moderate temper-ature. Int. J. Fatigue 2012, 40, 74–83. [Google Scholar] [CrossRef]
- Zhu, M.L.; Liu, L.L.; Xuan, F.Z. Effect of frequency on very high cycle fatigue behaviour of a low strength Cr–Ni–Mo–V steel welded joint. Int. J. Fatigue 2015, 77, 166–173. [Google Scholar] [CrossRef]
- Cremer, M.; Zimmermann, M.; Christ, H.-J. High-frequency cyclic testing of welded aluminium alloy joints in the region of very high cycle fatigue (VHCF). Int. J. Fatigue 2013, 57, 120–130. [Google Scholar] [CrossRef]
- Lu, Y.-H.; Xiao, Z.-Y.; Hu, L.; Luo, F.; Wu, Y.-B.; Ni, D.-H. Ultra-high cycle fatigue behaviour of warm compaction Fe–Cu–Ni–Mo–C sintered material. Mater. Des. 2014, 55, 758–763. [Google Scholar] [CrossRef]
- Chen, J.; Xia, Z. A fatigue life prediction method for coke drum base, weld, and HAZ materials from tensile properties. Mater. Des. 2014, 63, 575–583. [Google Scholar] [CrossRef]
- Wang, J.; Zhang, Y.; Sun, Q.; Liu, S.; Shi, B.; Lu, H. Giga-fatigue life prediction of FV520B-I with surface roughness. Mater. Des. 2016, 89, 1028–1034. [Google Scholar] [CrossRef]
- Shiozawa, K.; Morii, Y.; Nishino, S.; Lu, L. Subsurface crack initiation and propagation mechanism in high-strength steel in a very high cycle fatigue regime. Int. J. Fatigue 2006, 28, 1521–1532. [Google Scholar] [CrossRef]
- Ochi, Y.; Matsumura, T.; Masaki, K.; Yoshida, S. High-cycle rotating bending fatigue property in very long-life regime of high-strength steels. Fatigue Fract. Eng. Mater. Struct. 2002, 25, 823–830. [Google Scholar] [CrossRef]
- Otsuka, T.; Hanada, H.; Nakashima, H.; Sakamoto, K.; Hayakawa, M.; Hashizume, K.; Sugisaki, M. Observation of hydrogen distribution around non-metallic inclusions in steels with tritium microautoradiography. Fusion Sci. Technol. 2005, 48, 708–711. [Google Scholar] [CrossRef]
- Zuo, J.H.; Wang, Z.G.; Han, E.H. Effect of microstructure on ultra-high cycle fatigue behavior of Ti–6Al–4V. Mater. Sci. Eng. A 2008, 473, 147–152. [Google Scholar] [CrossRef]
- Murakami, Y. Metal fatigue: Effects of small defects and nonmetallic inclusions. Chromatographia 2002, 70, 1197–1200. [Google Scholar]
- Murakami, Y.; Sakae, C.; Ichimaru, K. Three-dimensional fracture mechanics analysis of pit formation mechanism under lubricated rolling-sliding contact loading. Tribol. Trans. 2008, 37, 445–454. [Google Scholar] [CrossRef]
- Murakami, Y.; Endo, M. Quantitative evaluation of fatigue strength of metals containing various small defects or cracks. Eng. Fract. Mech. 1983, 17, 1–15. [Google Scholar]
- Itoga, H.; Tokaji, K.; Nakajima, M. Effect of surface roughness on step-wise-characteristics in high strength steel. Int. J. Fatigue 2003, 25, 379–385. [Google Scholar] [CrossRef]
- Chinese Aeronautical Establishment. Stress Intensity Factor Handbook; Science Press: Beijing, China, 1993. (In Chinese) [Google Scholar]
- Tanaka, K.; Mura, T. A dislocation model for fatigue crack initiation. J. Appl. Mech. 1981, 48, 97–103. [Google Scholar] [CrossRef]
- Wang, Q.Y.; Pidaparti, R.M.; Palakal, M.J. Comparative study of corrosion-fatigue in aircraft materials. AIAA J. 2001, 39, 325–330. [Google Scholar] [CrossRef]
- Wang, Q.Y.; Berard, J.Y.; Bathias, C. High-cycle fatigue crack initiation and propagation behaviour of high-strength spring steel wires. Fatigue Fract. Eng. Mater. Struct. 1999, 22, 673–677. [Google Scholar] [CrossRef]
Publisher’s Note: MDPI stays neutral with regard to jurisdictional claims in published maps and institutional affiliations. |
© 2021 by the authors. Licensee MDPI, Basel, Switzerland. This article is an open access article distributed under the terms and conditions of the Creative Commons Attribution (CC BY) license (https://creativecommons.org/licenses/by/4.0/).