Research on Non-Contact Monitoring System for Human Physiological Signal and Body Movement

 ,
,
Abstract
1. Introduction
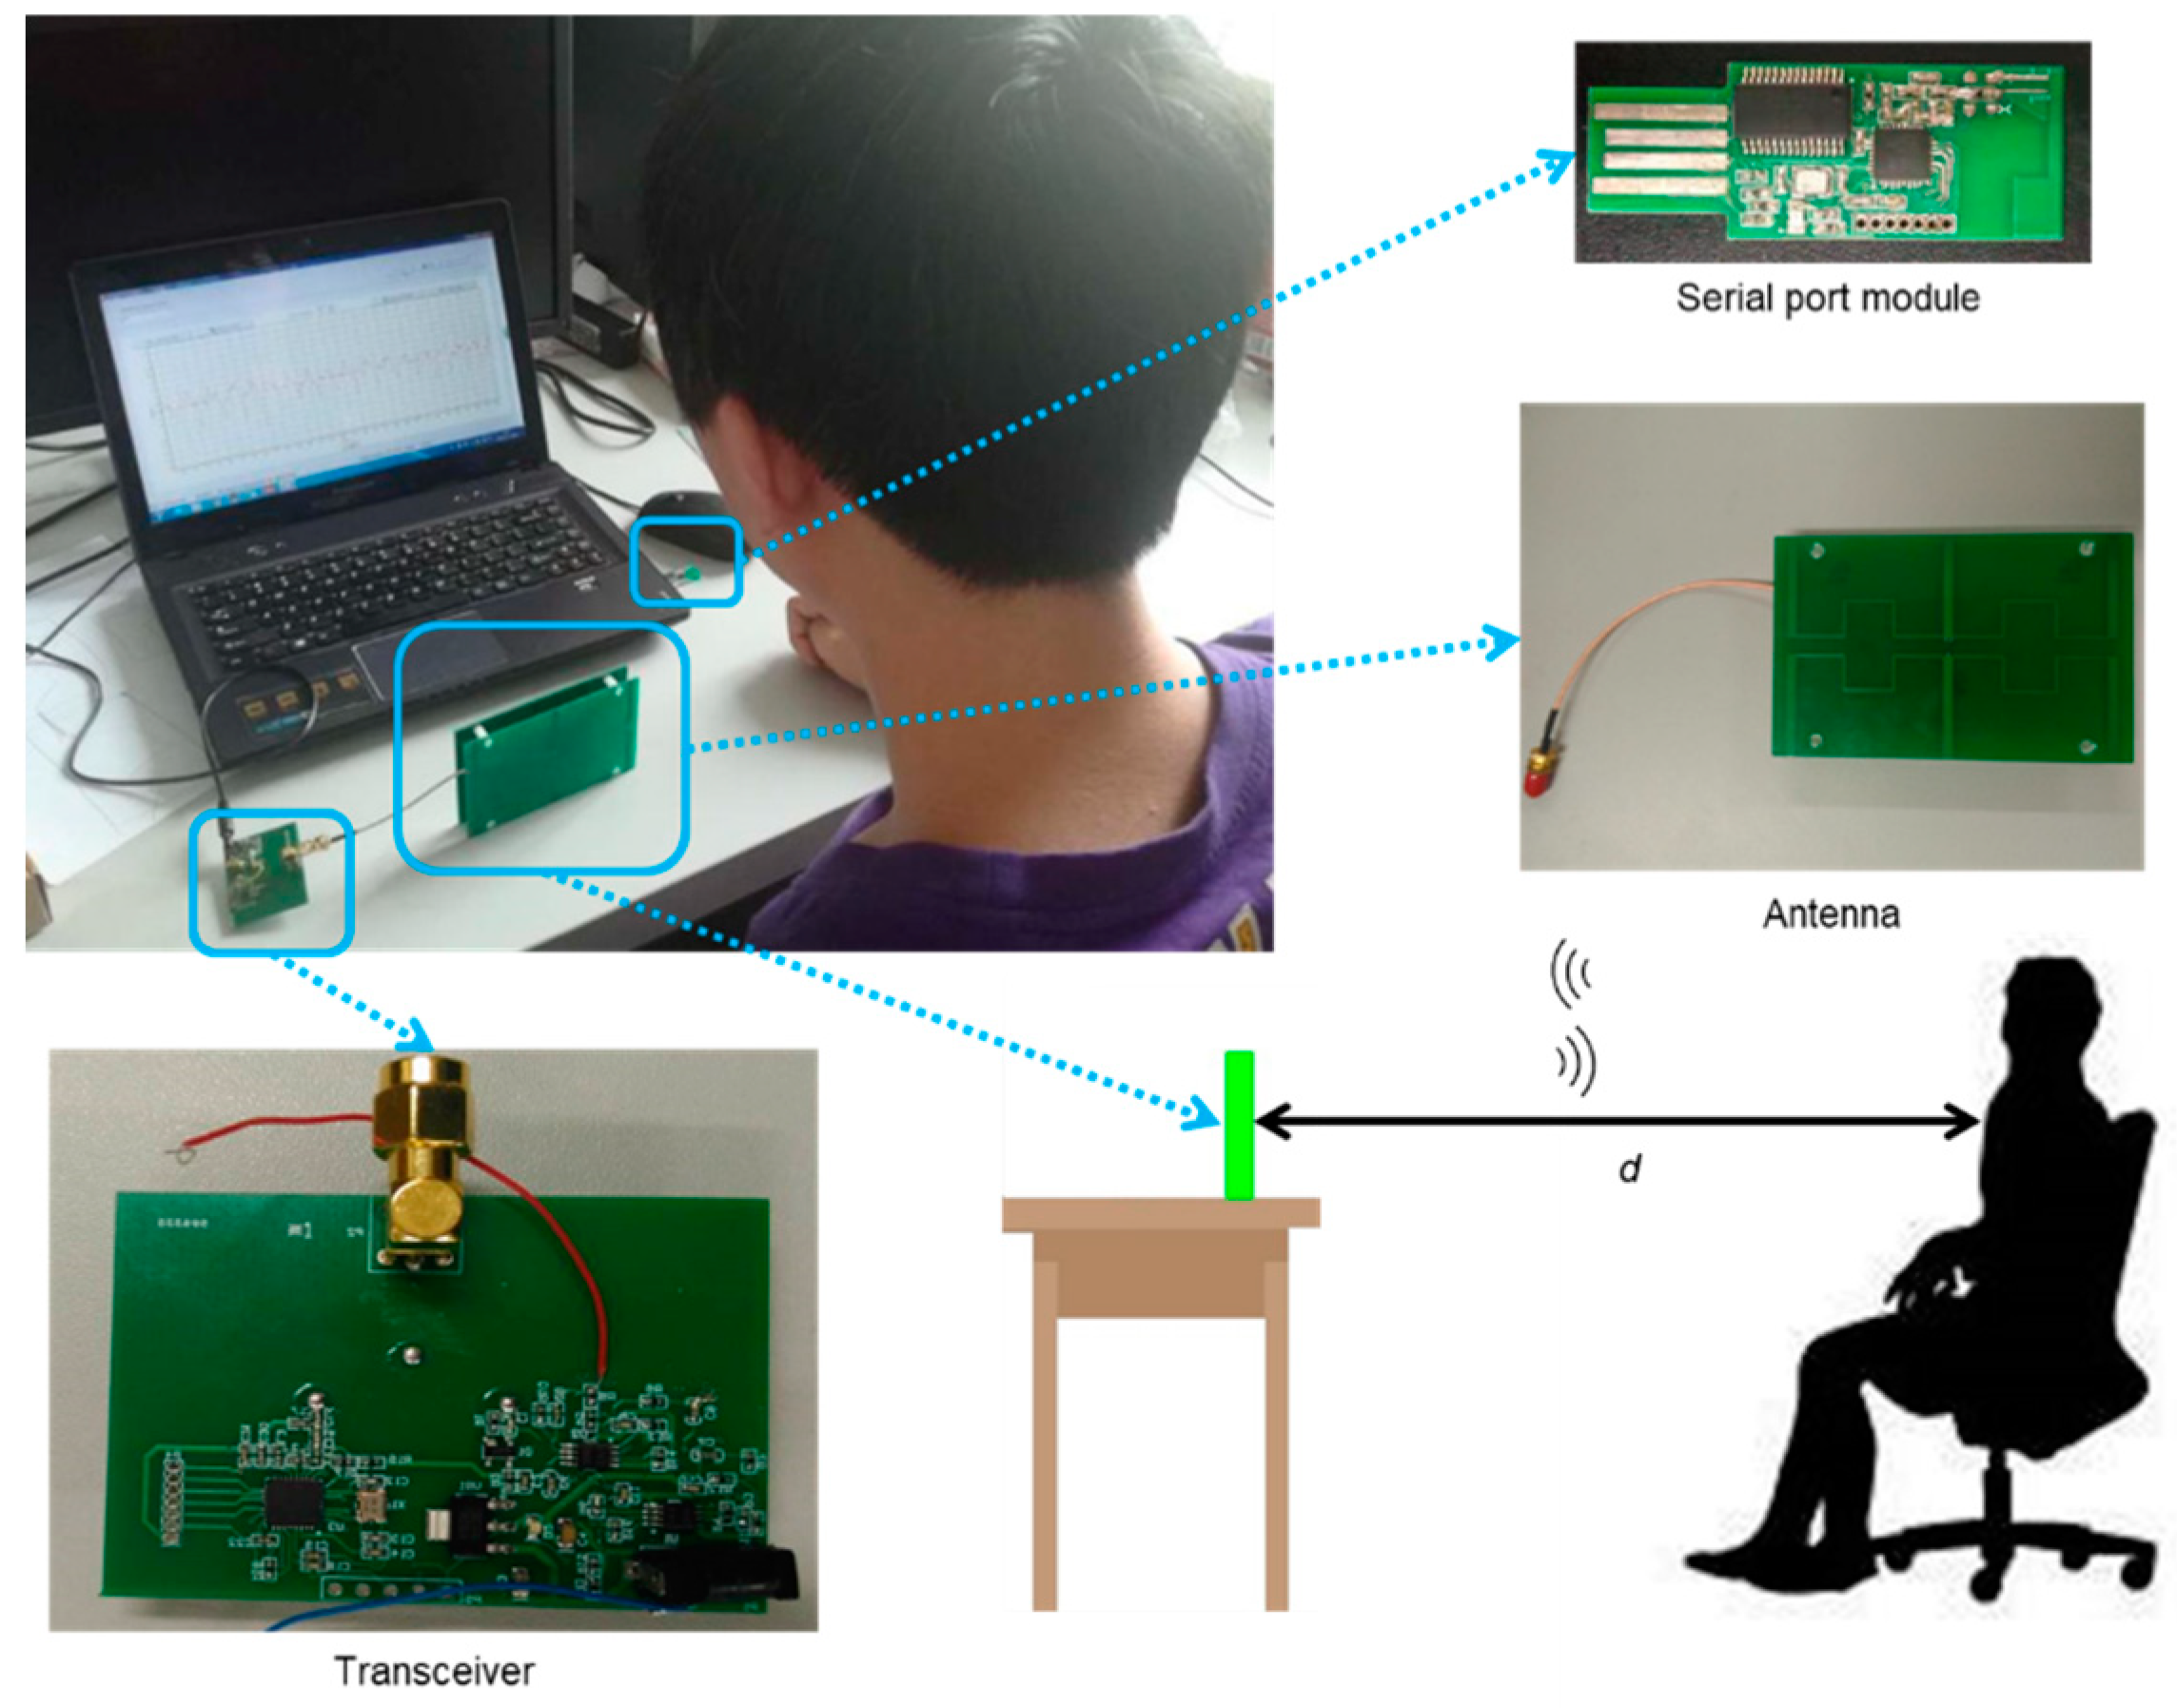
2. System Overview
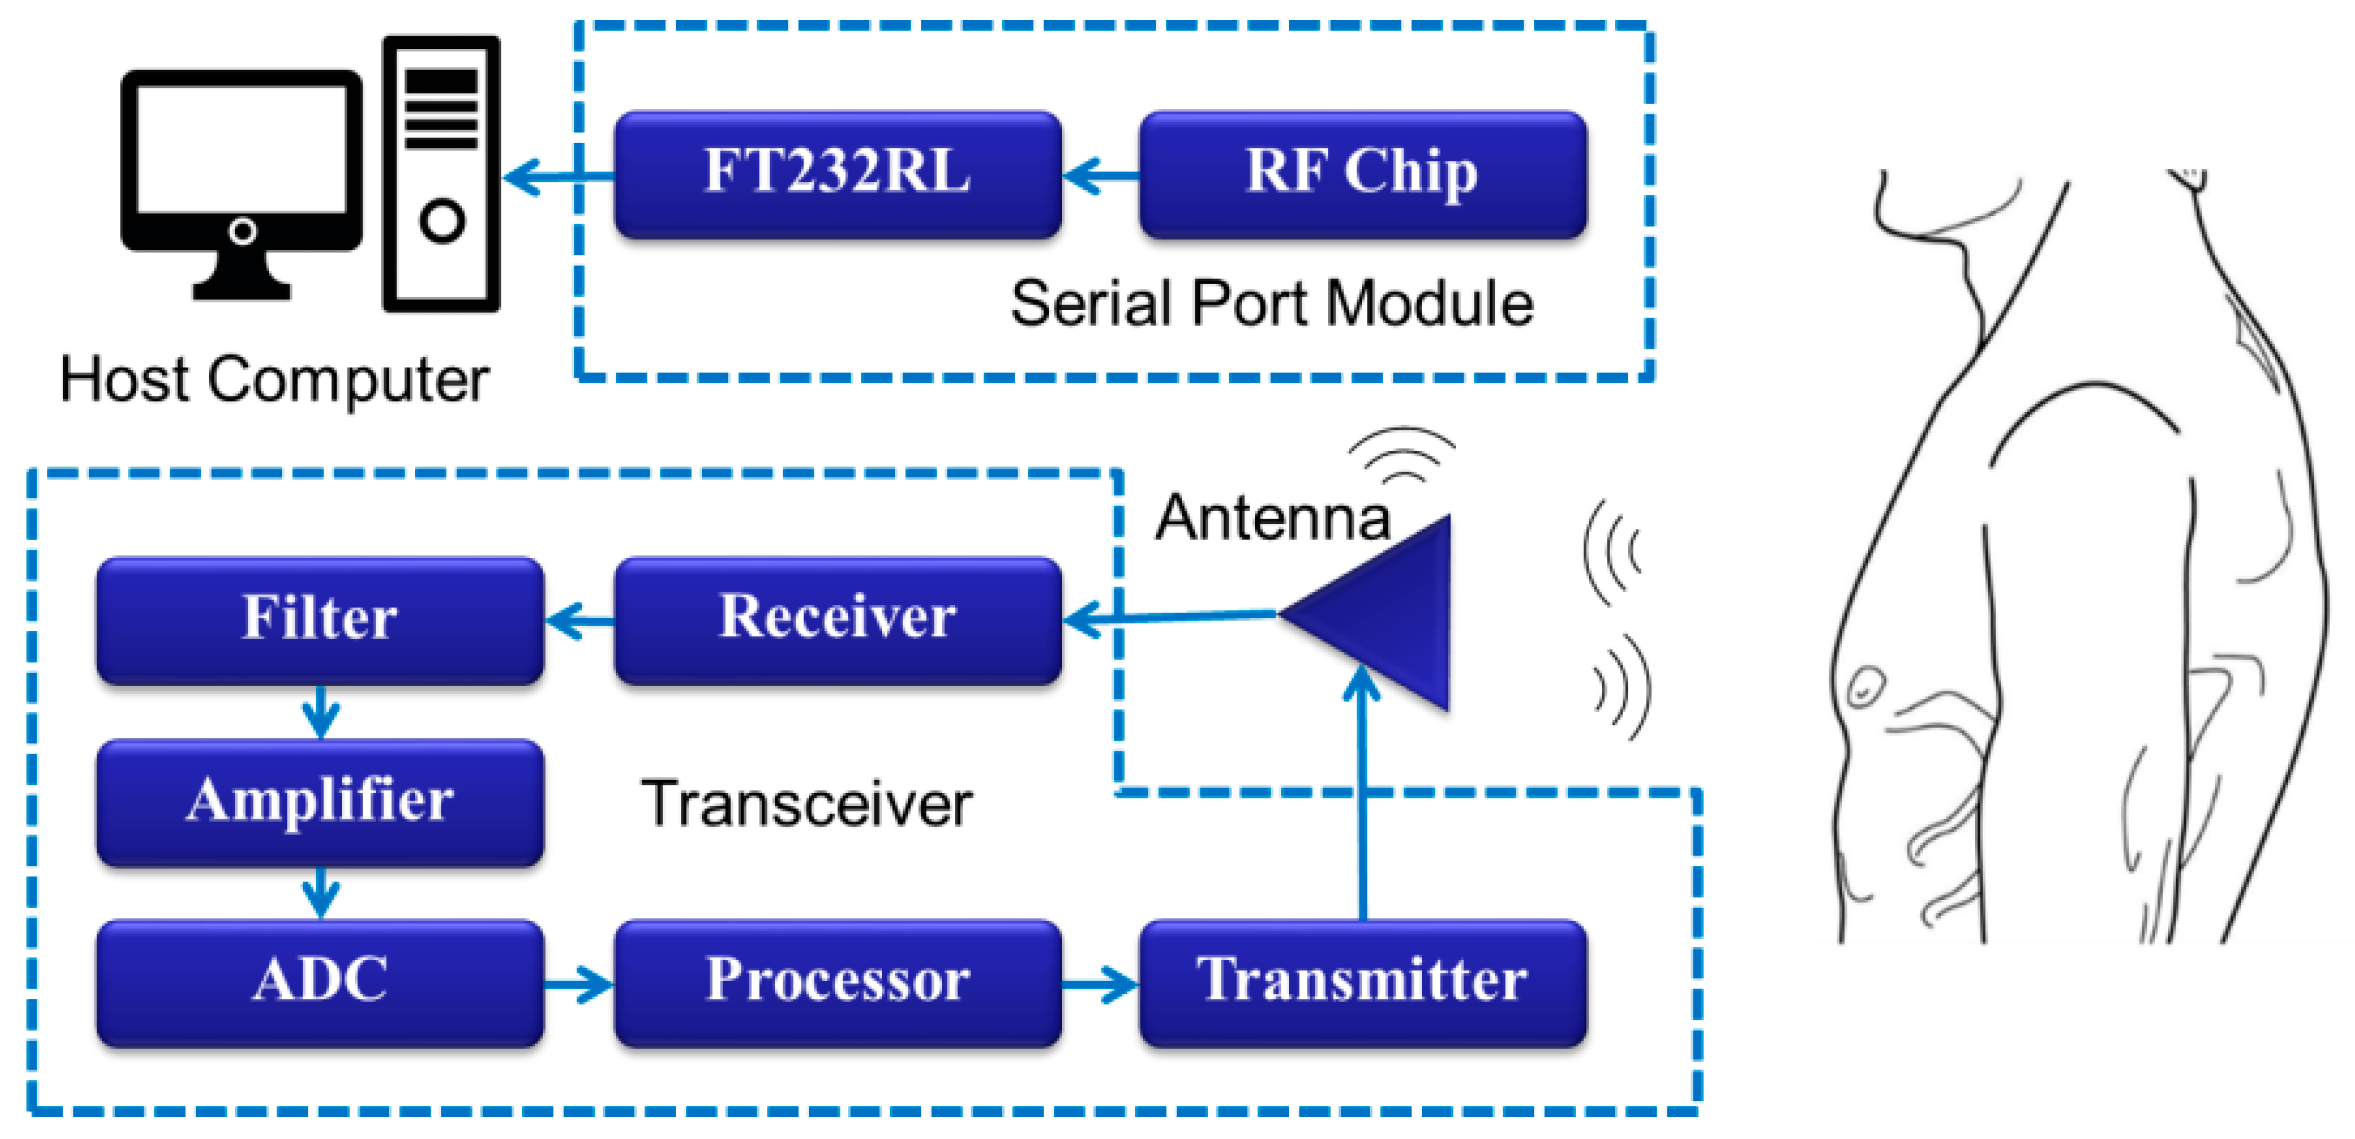
2.1. Hardware System
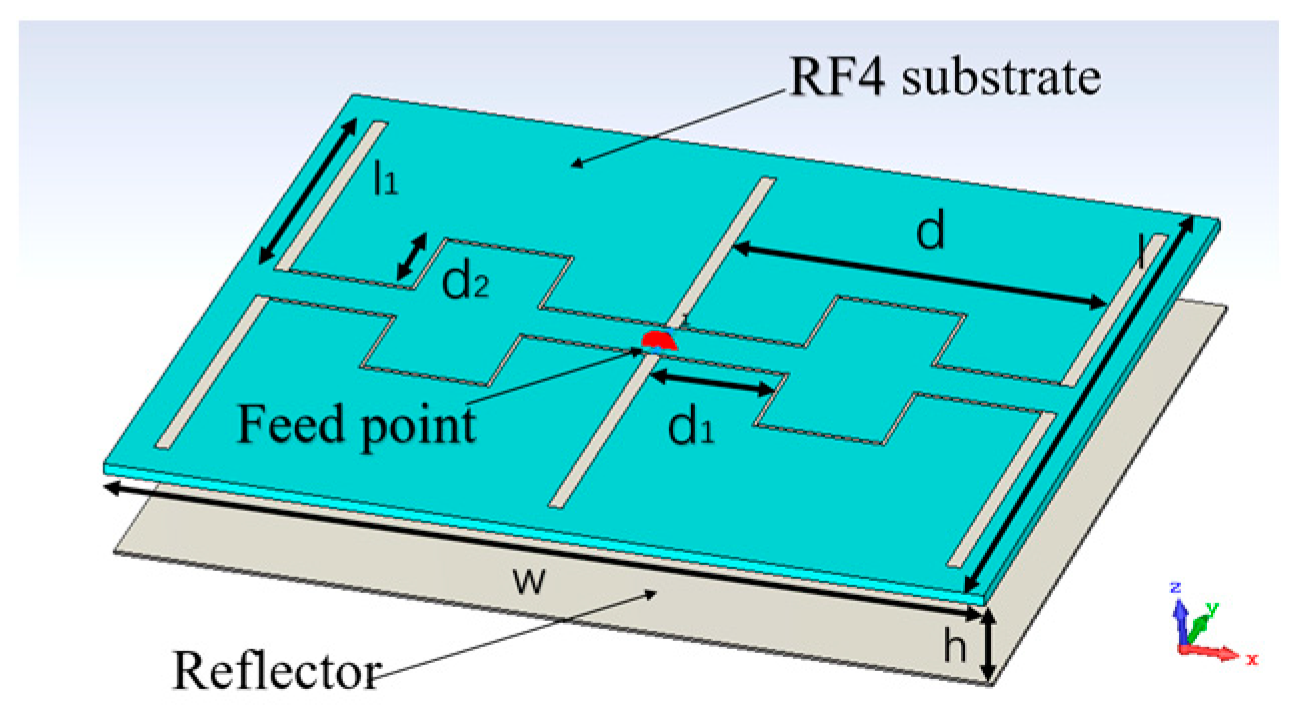
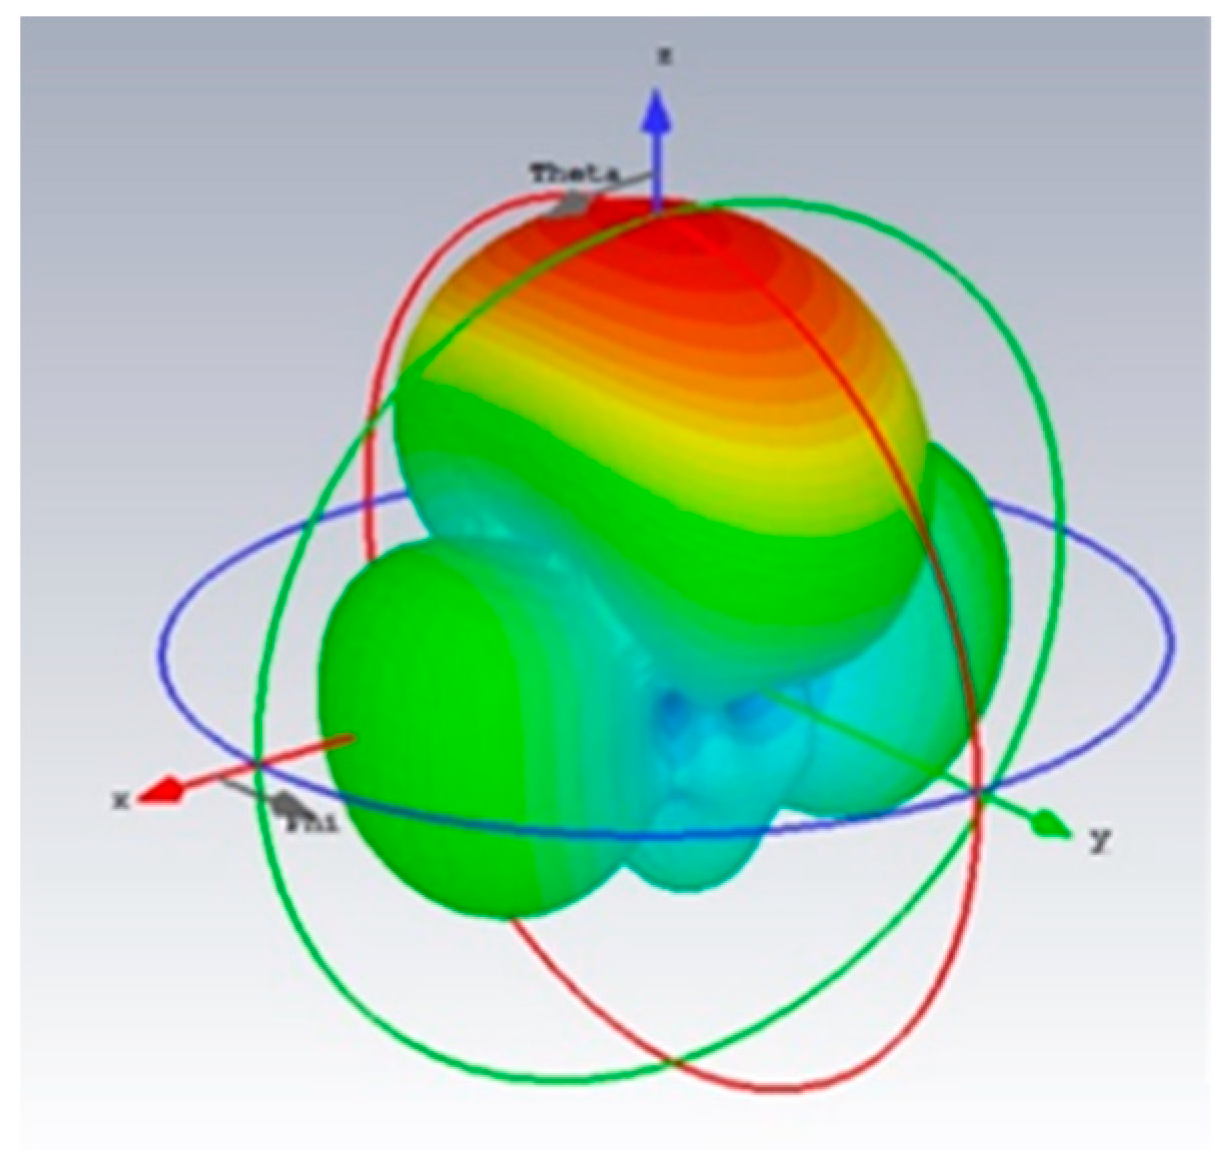
2.1.1. Antenna
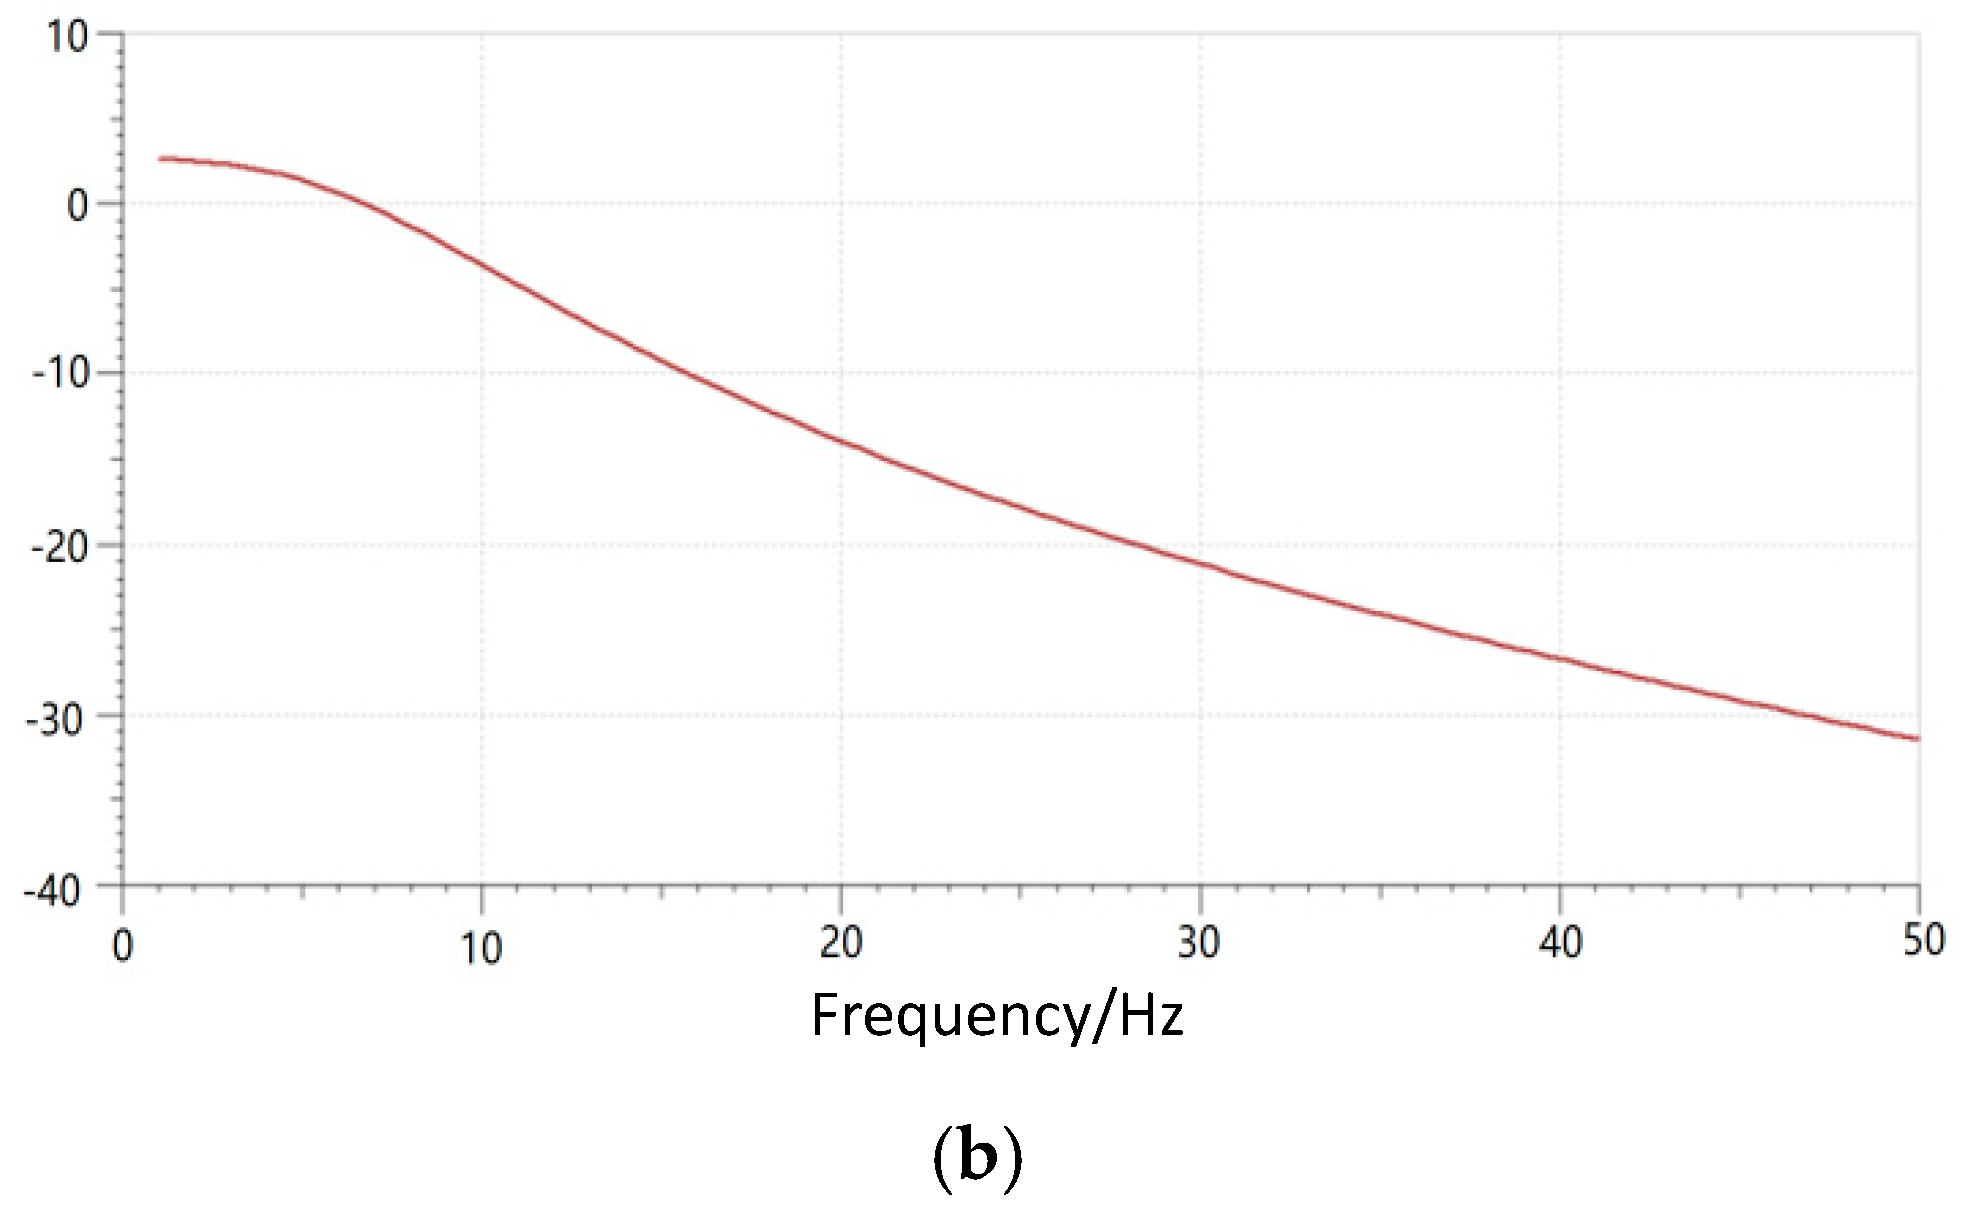
2.1.2. Transceiver
2.1.3. Serial Port Module
2.2. Algorithm Design
2.2.1. Classification Algorithm
2.2.2. Physiological Signal Algorithm
3. Experiment
- (1)
- According to experimental physiology and electromagnetism, it could be known that others will greatly affect the accuracy of the experiment when measuring the equipment. Therefore, the experimental environment with less affected should be a better option.
- (2)
- When the system is turned on and off, it will affect the generated waveform to some extent. In addition, when the system is filtered in the frequency domain, it will also affect the waveform at the edge. Therefore, during the verification test of cardiac signal and respiratory signal extraction, more than one minute of data should be collected in the experiment, and the middle one minute of data should be used for calculation, so as to avoid the influence of the above phenomenon on the experimental results.
- (3)
- Try to ensure the diversity of samples when collecting classified actions, that is, each action has data collected by 10 subjects.
- (4)
- In the verification test of cardiac signal and respiratory signal extraction, try to ensure that the range of each breath of the subject is the same. This verification can be generally judged by the waveform form collected by the contact device.
4. Results and Discussion
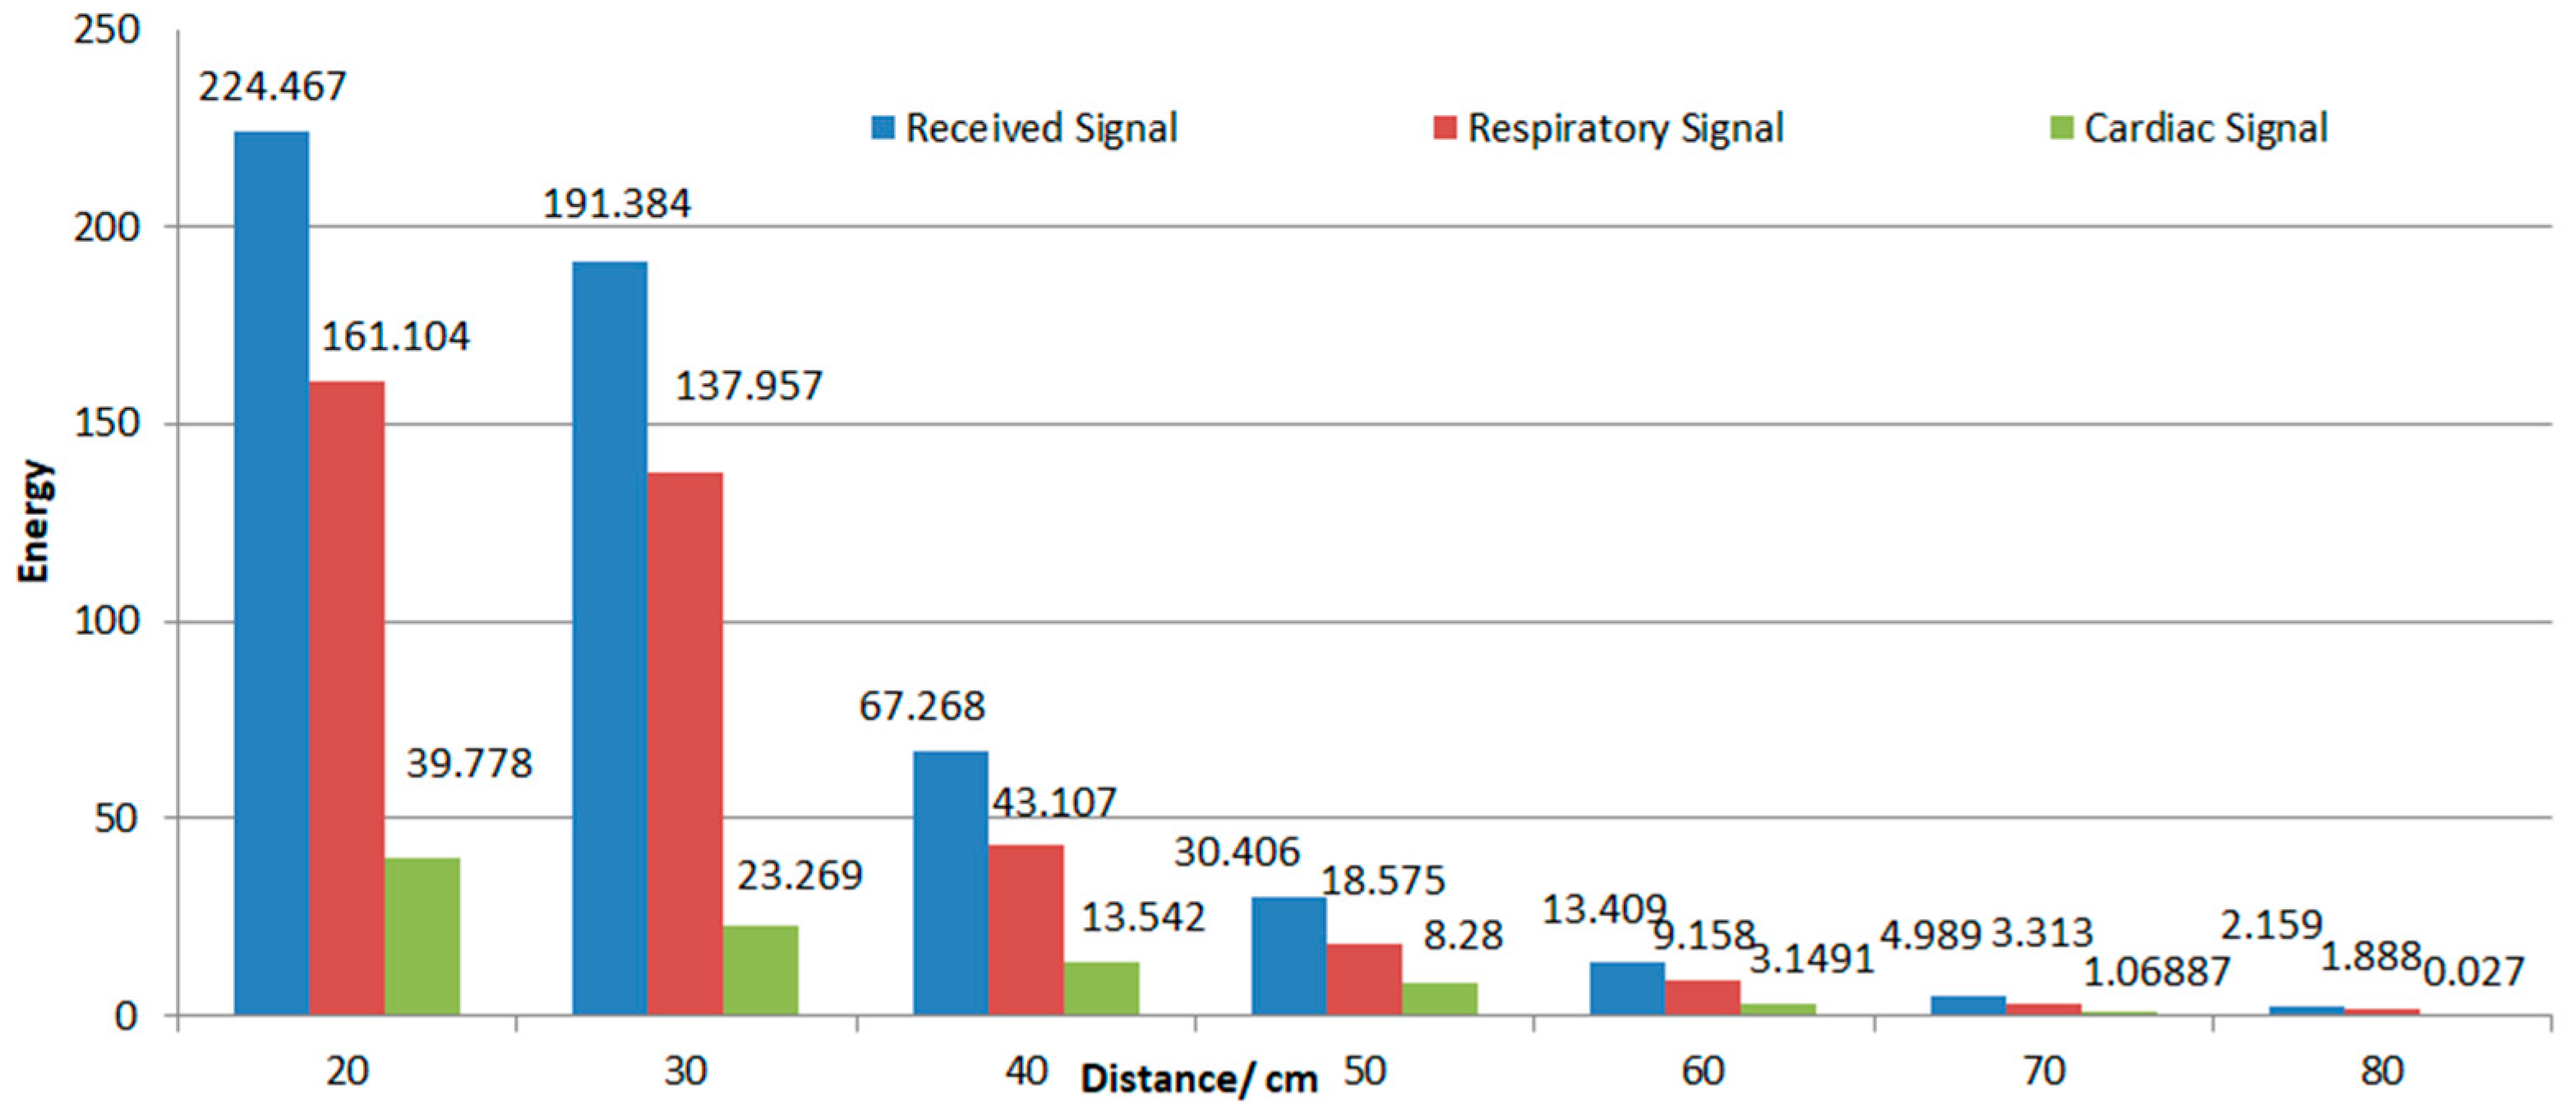
4.1. Effective Distance
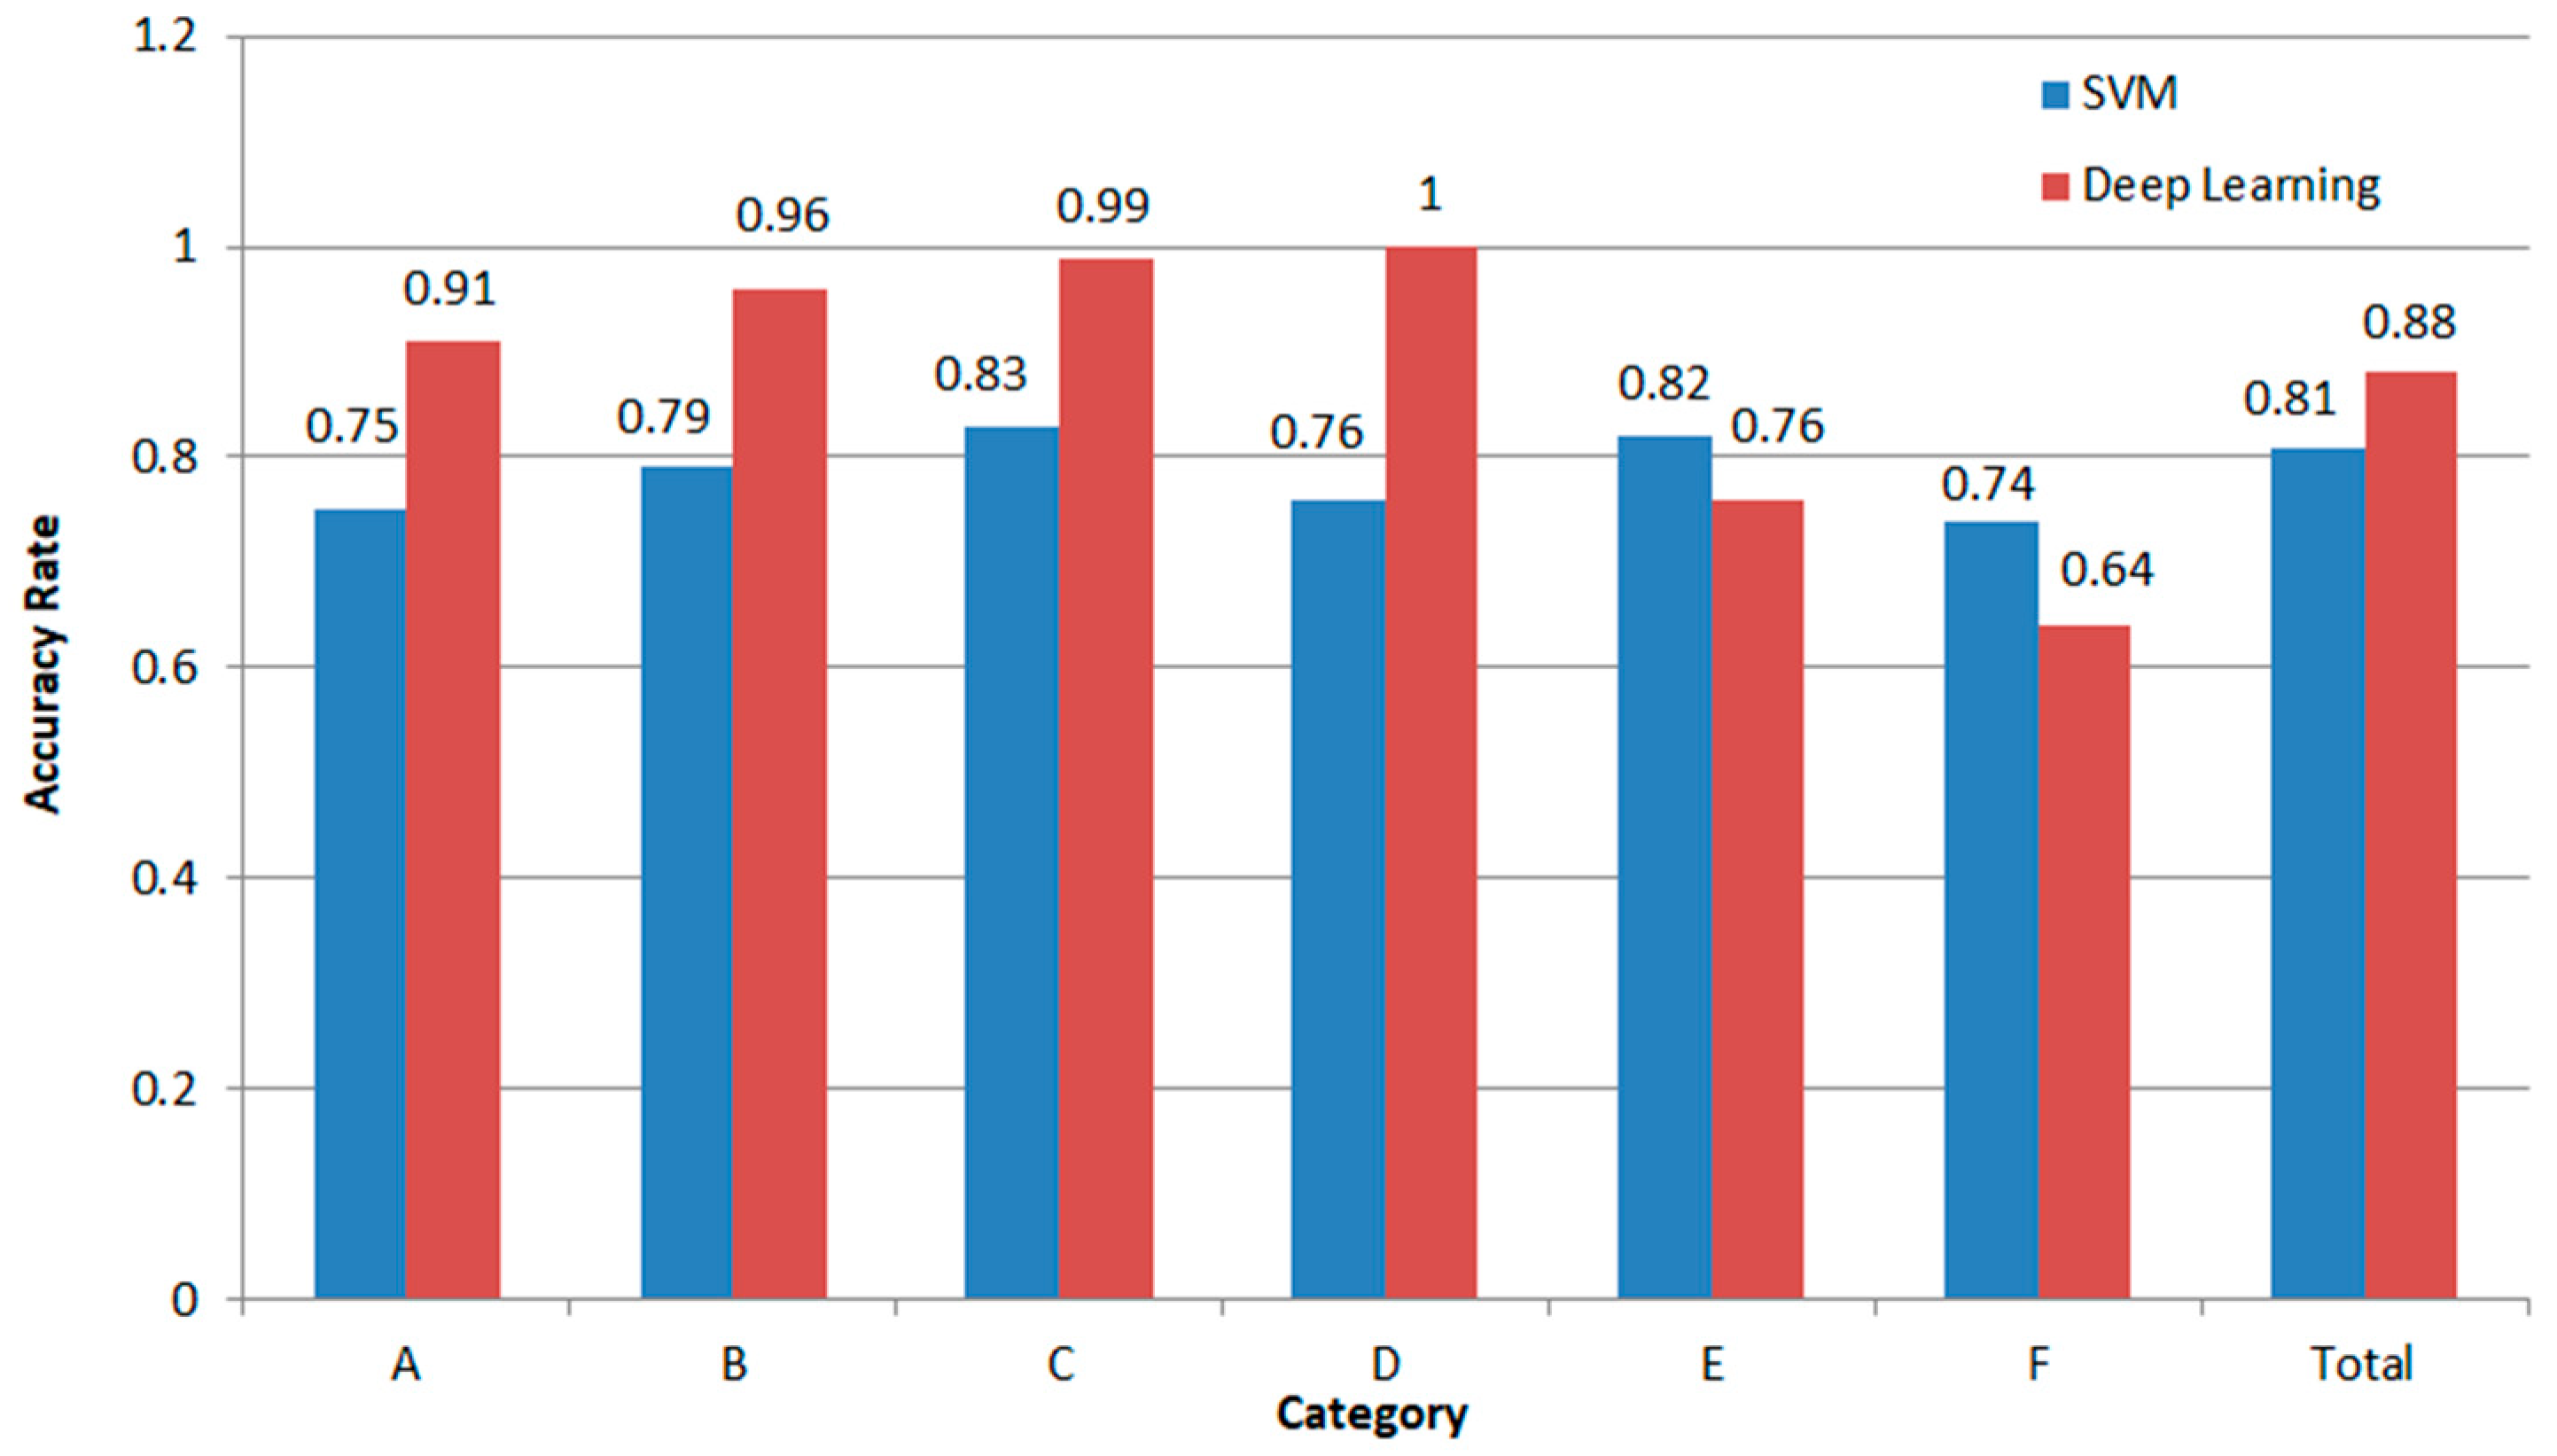
4.2. Action Classification
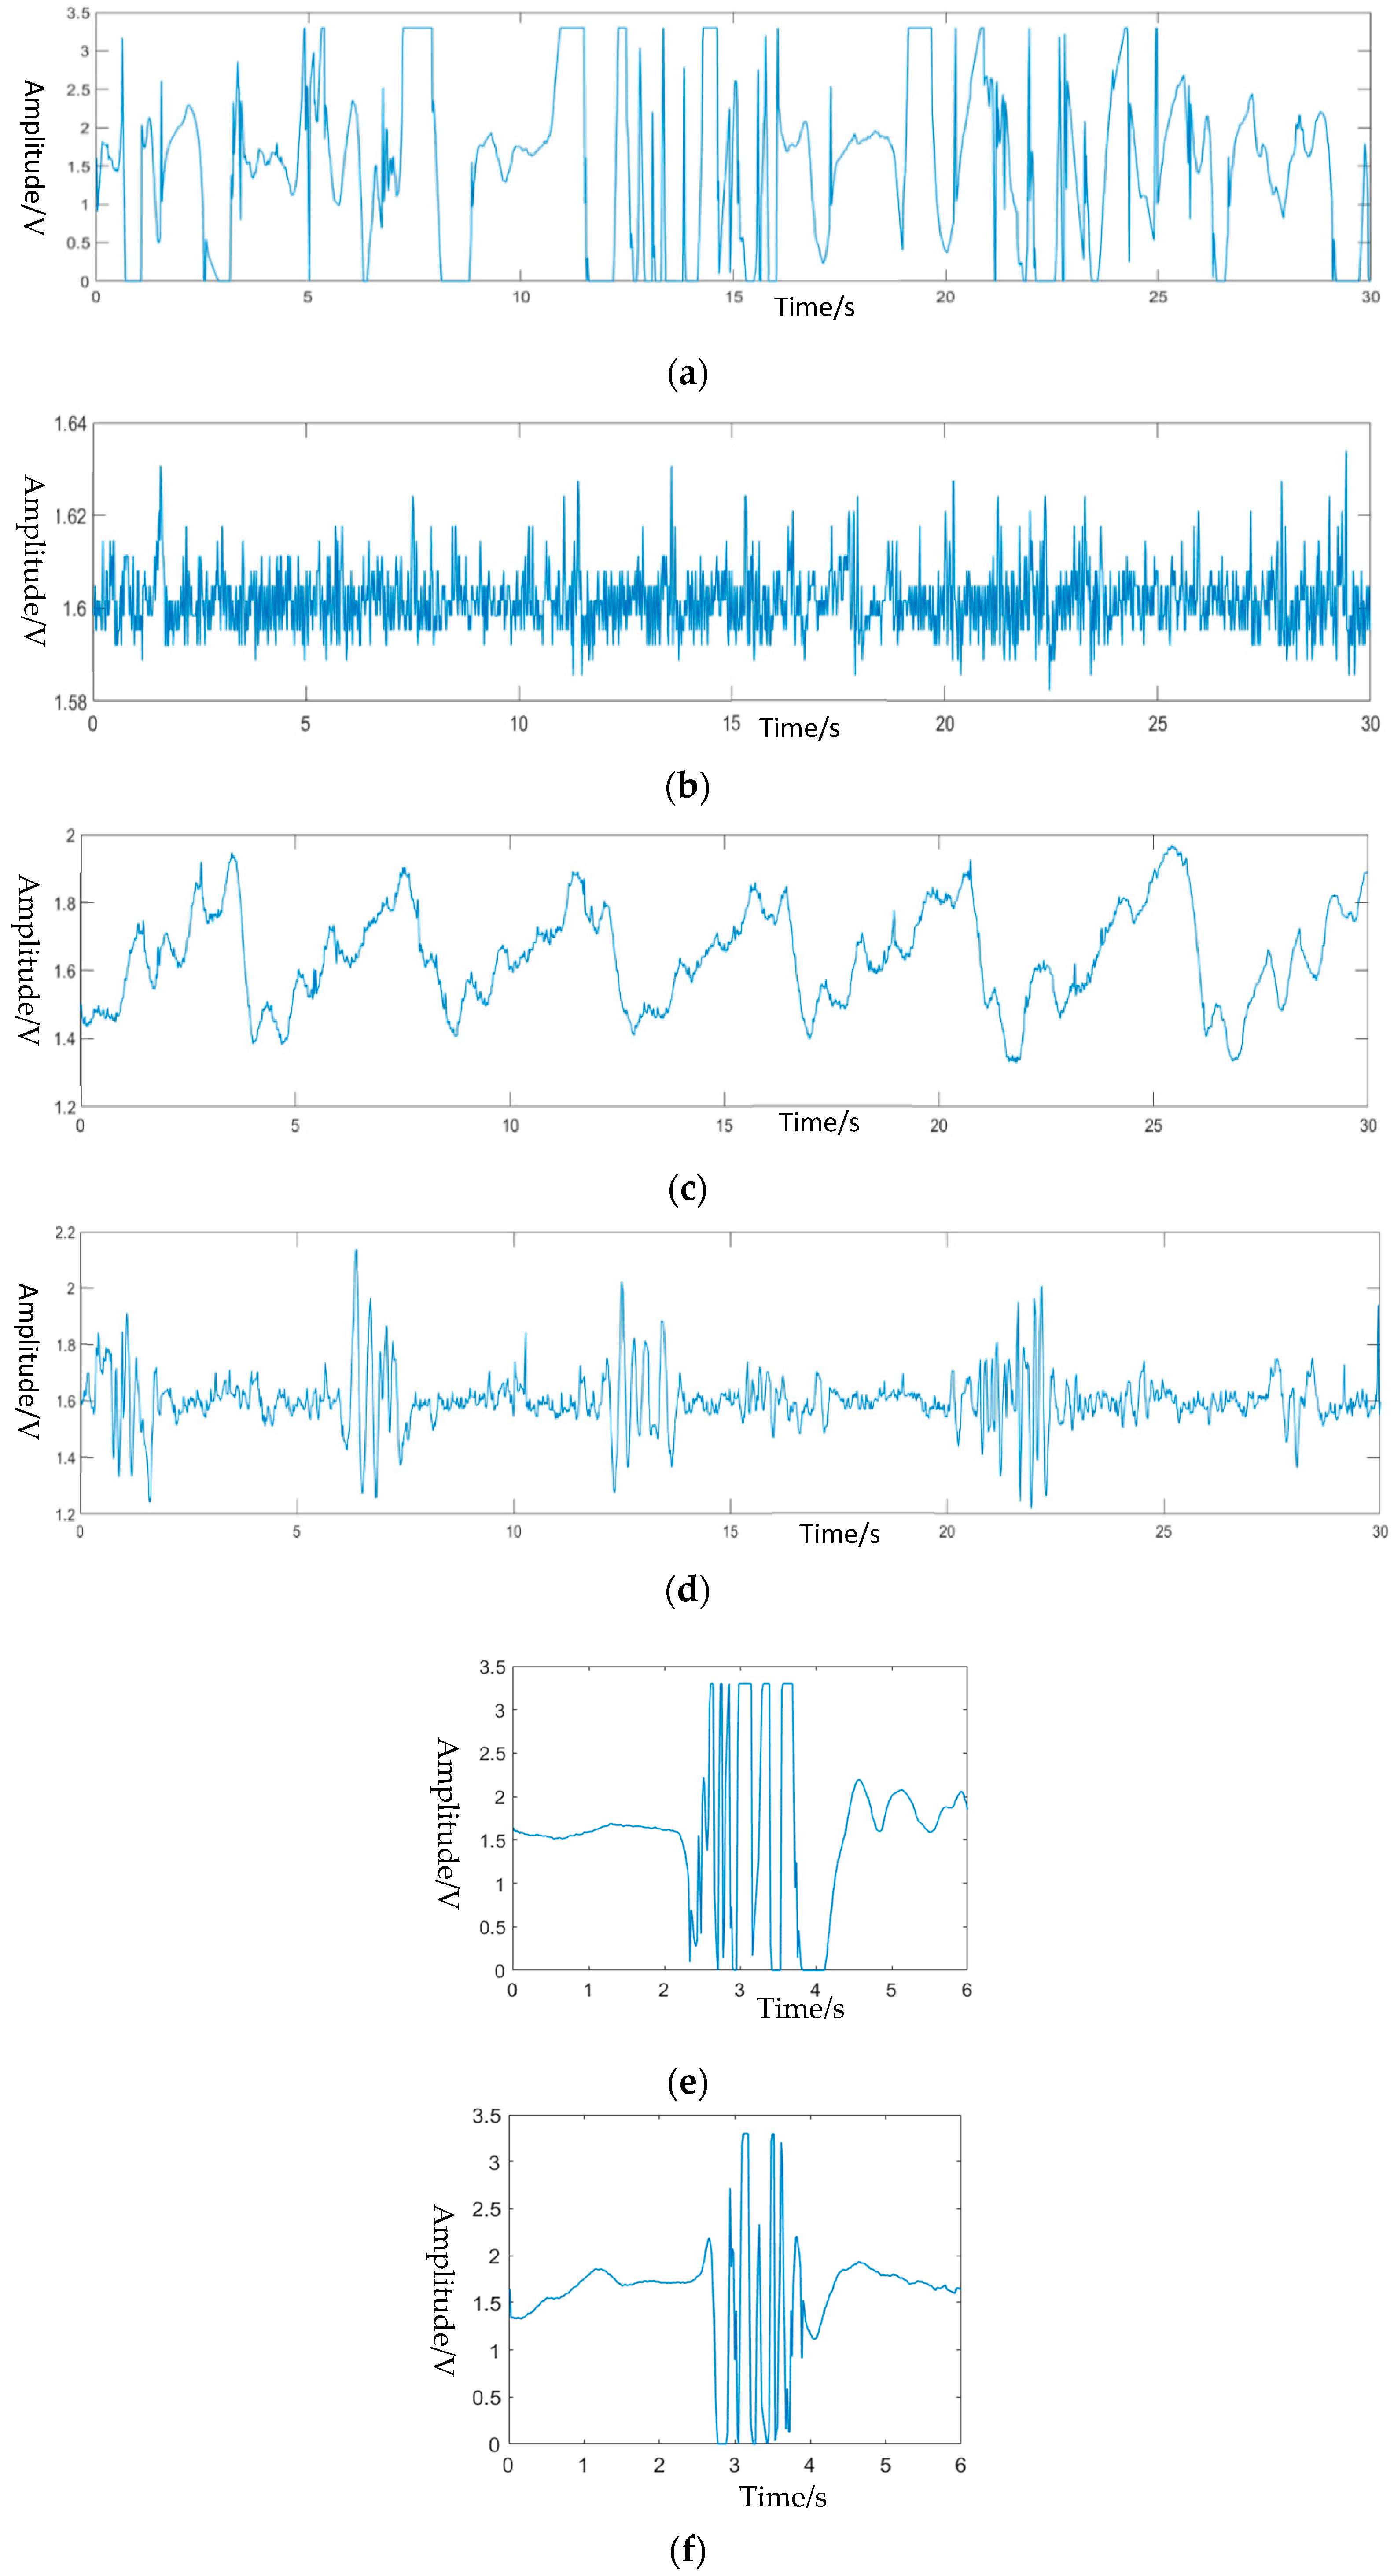
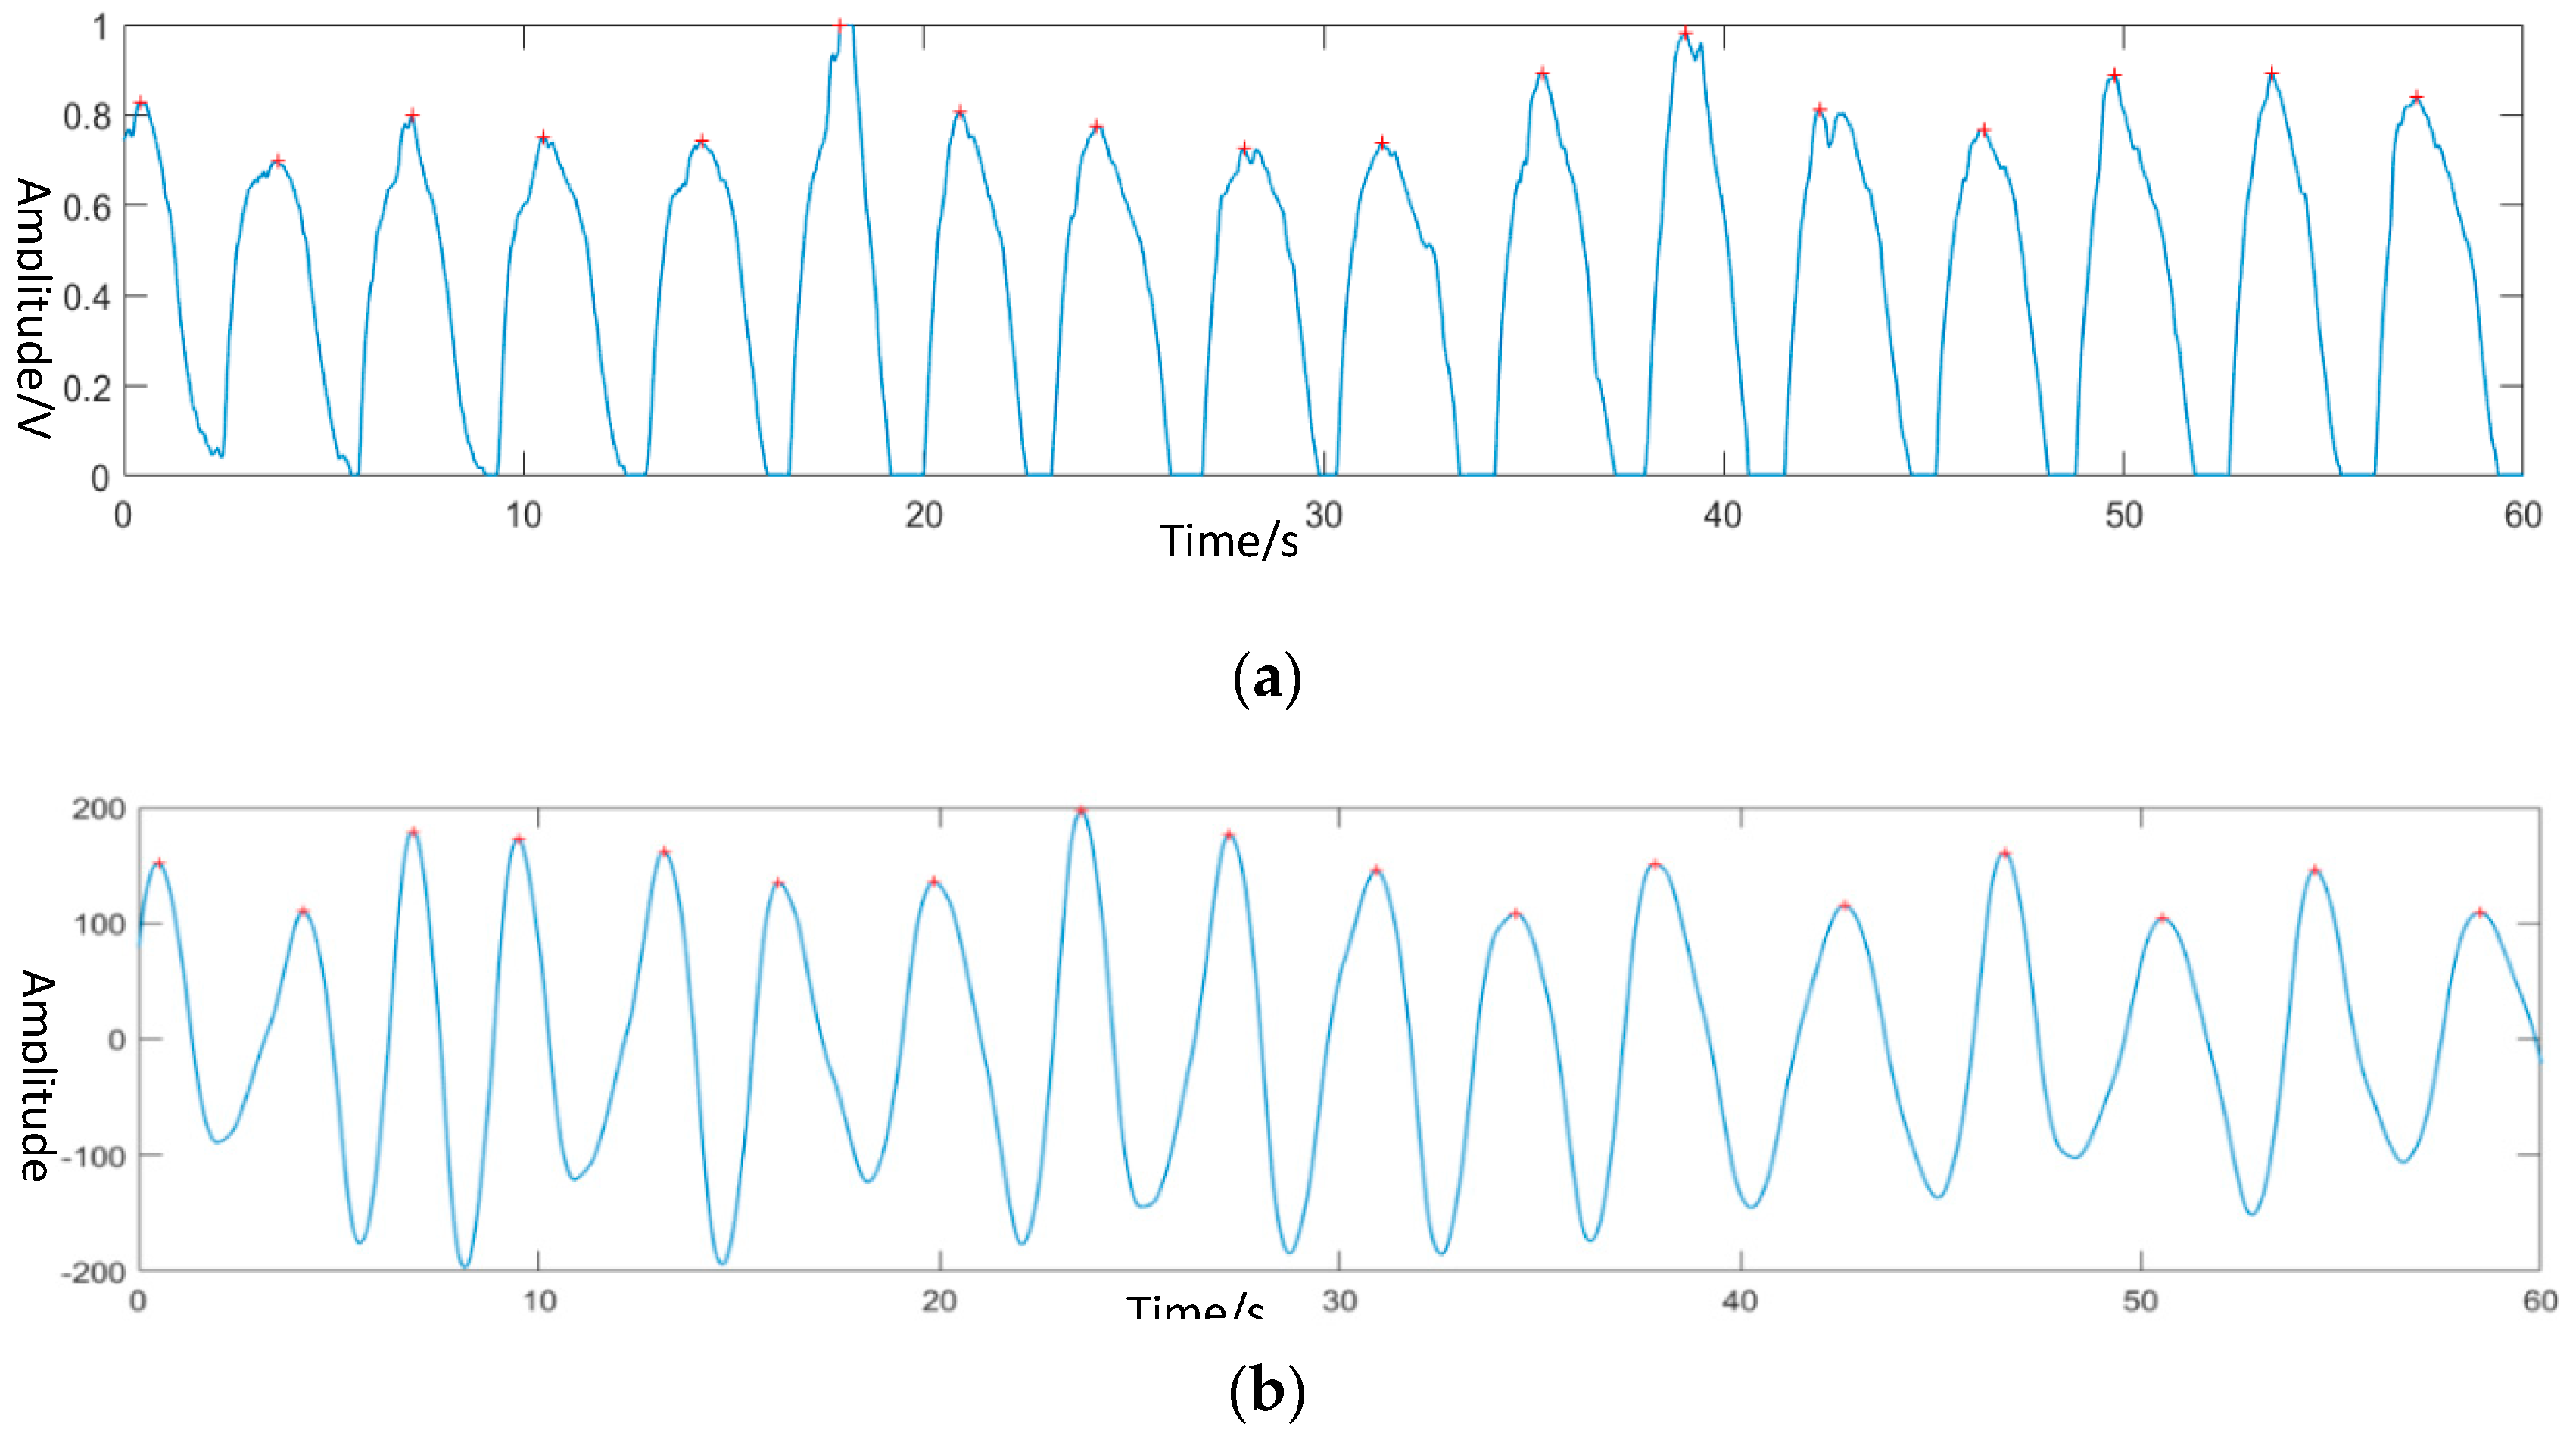
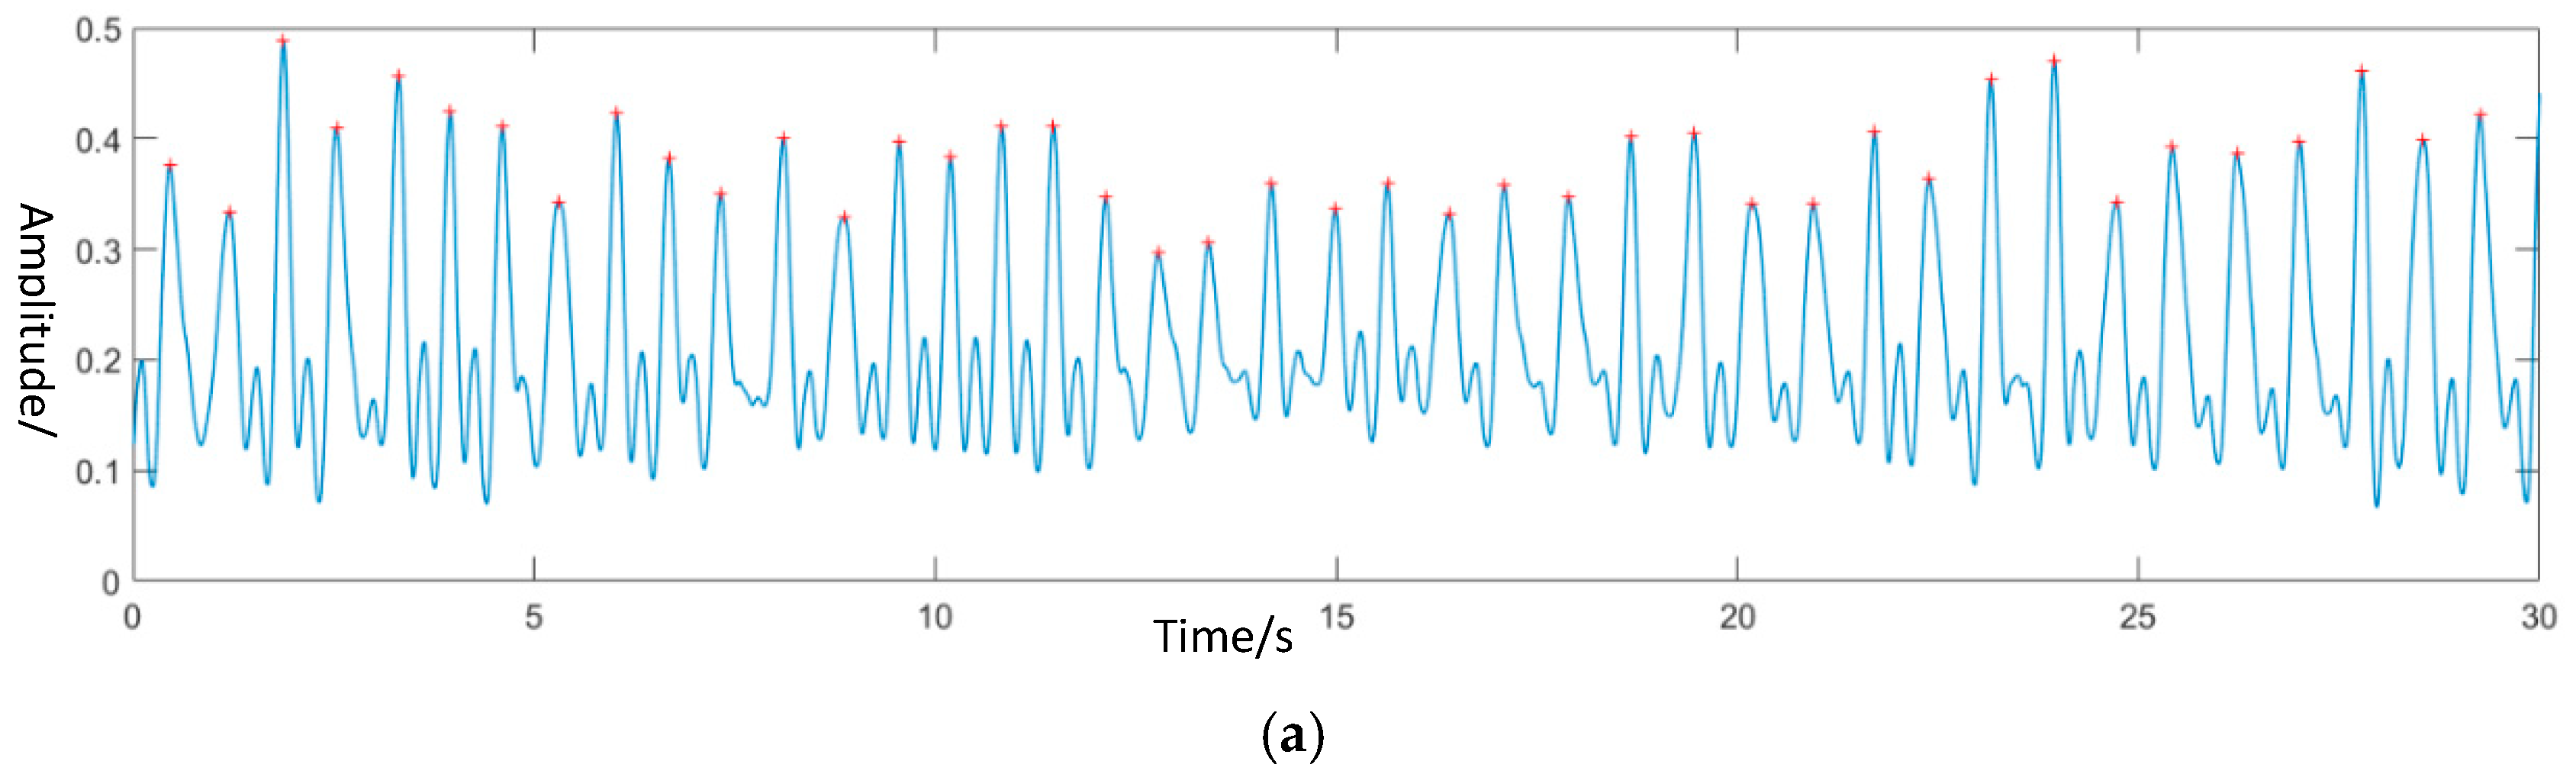
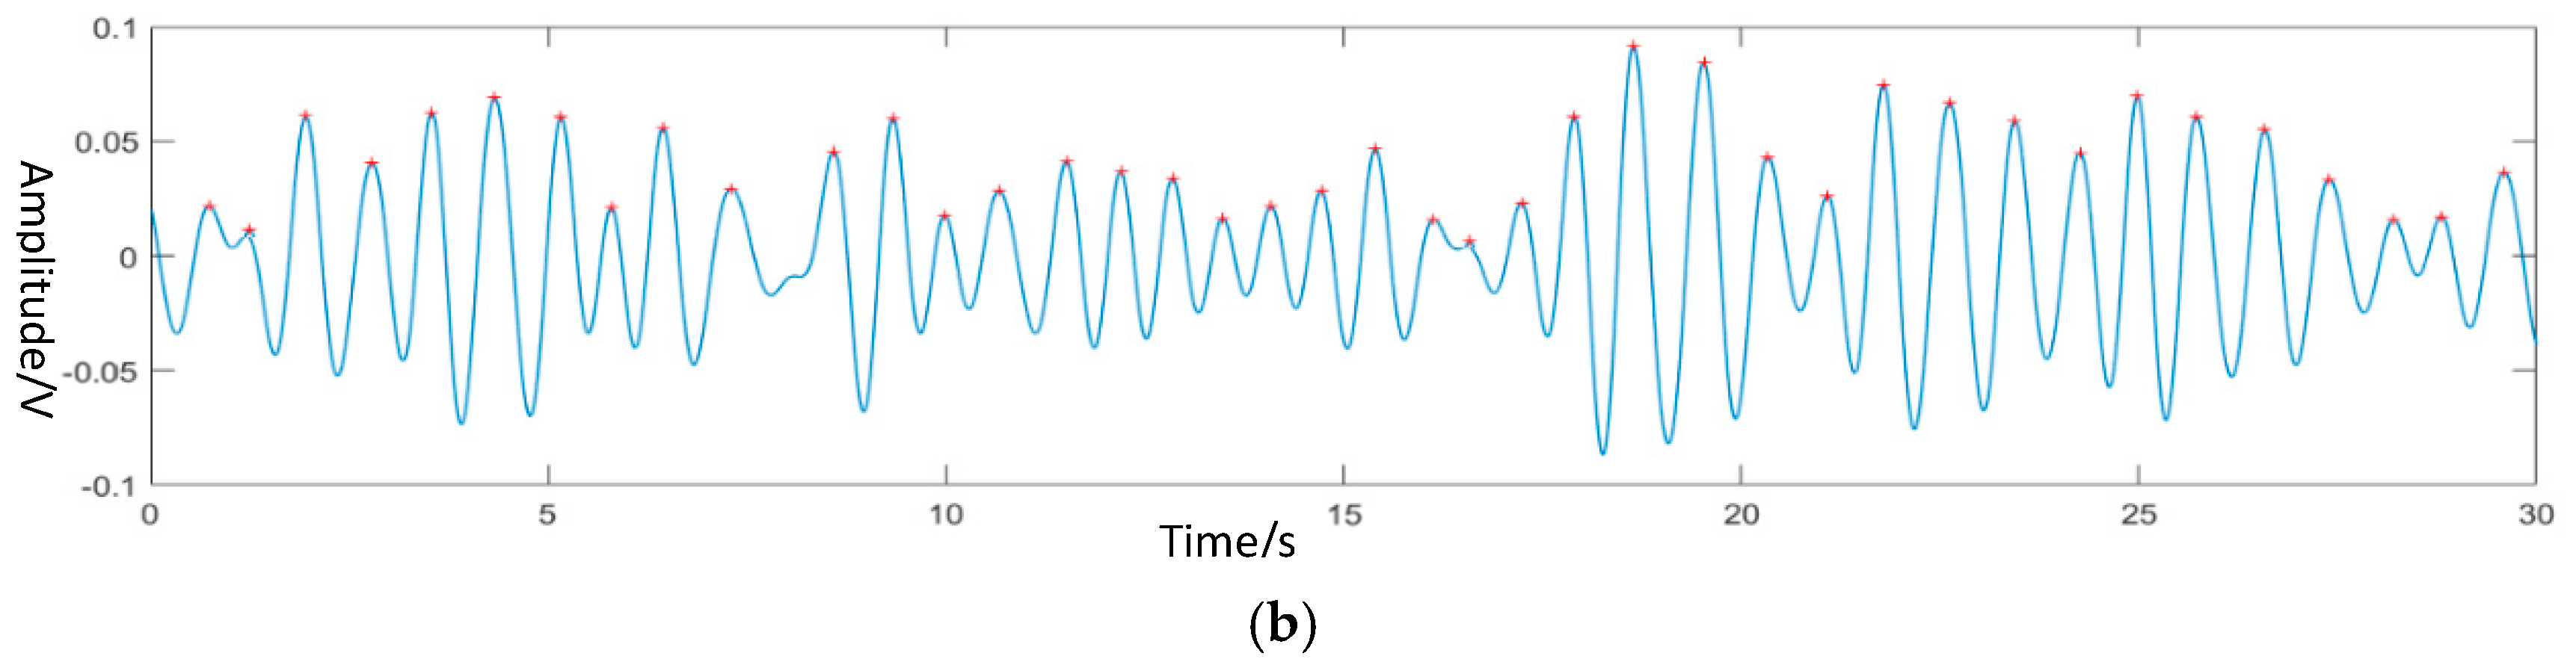
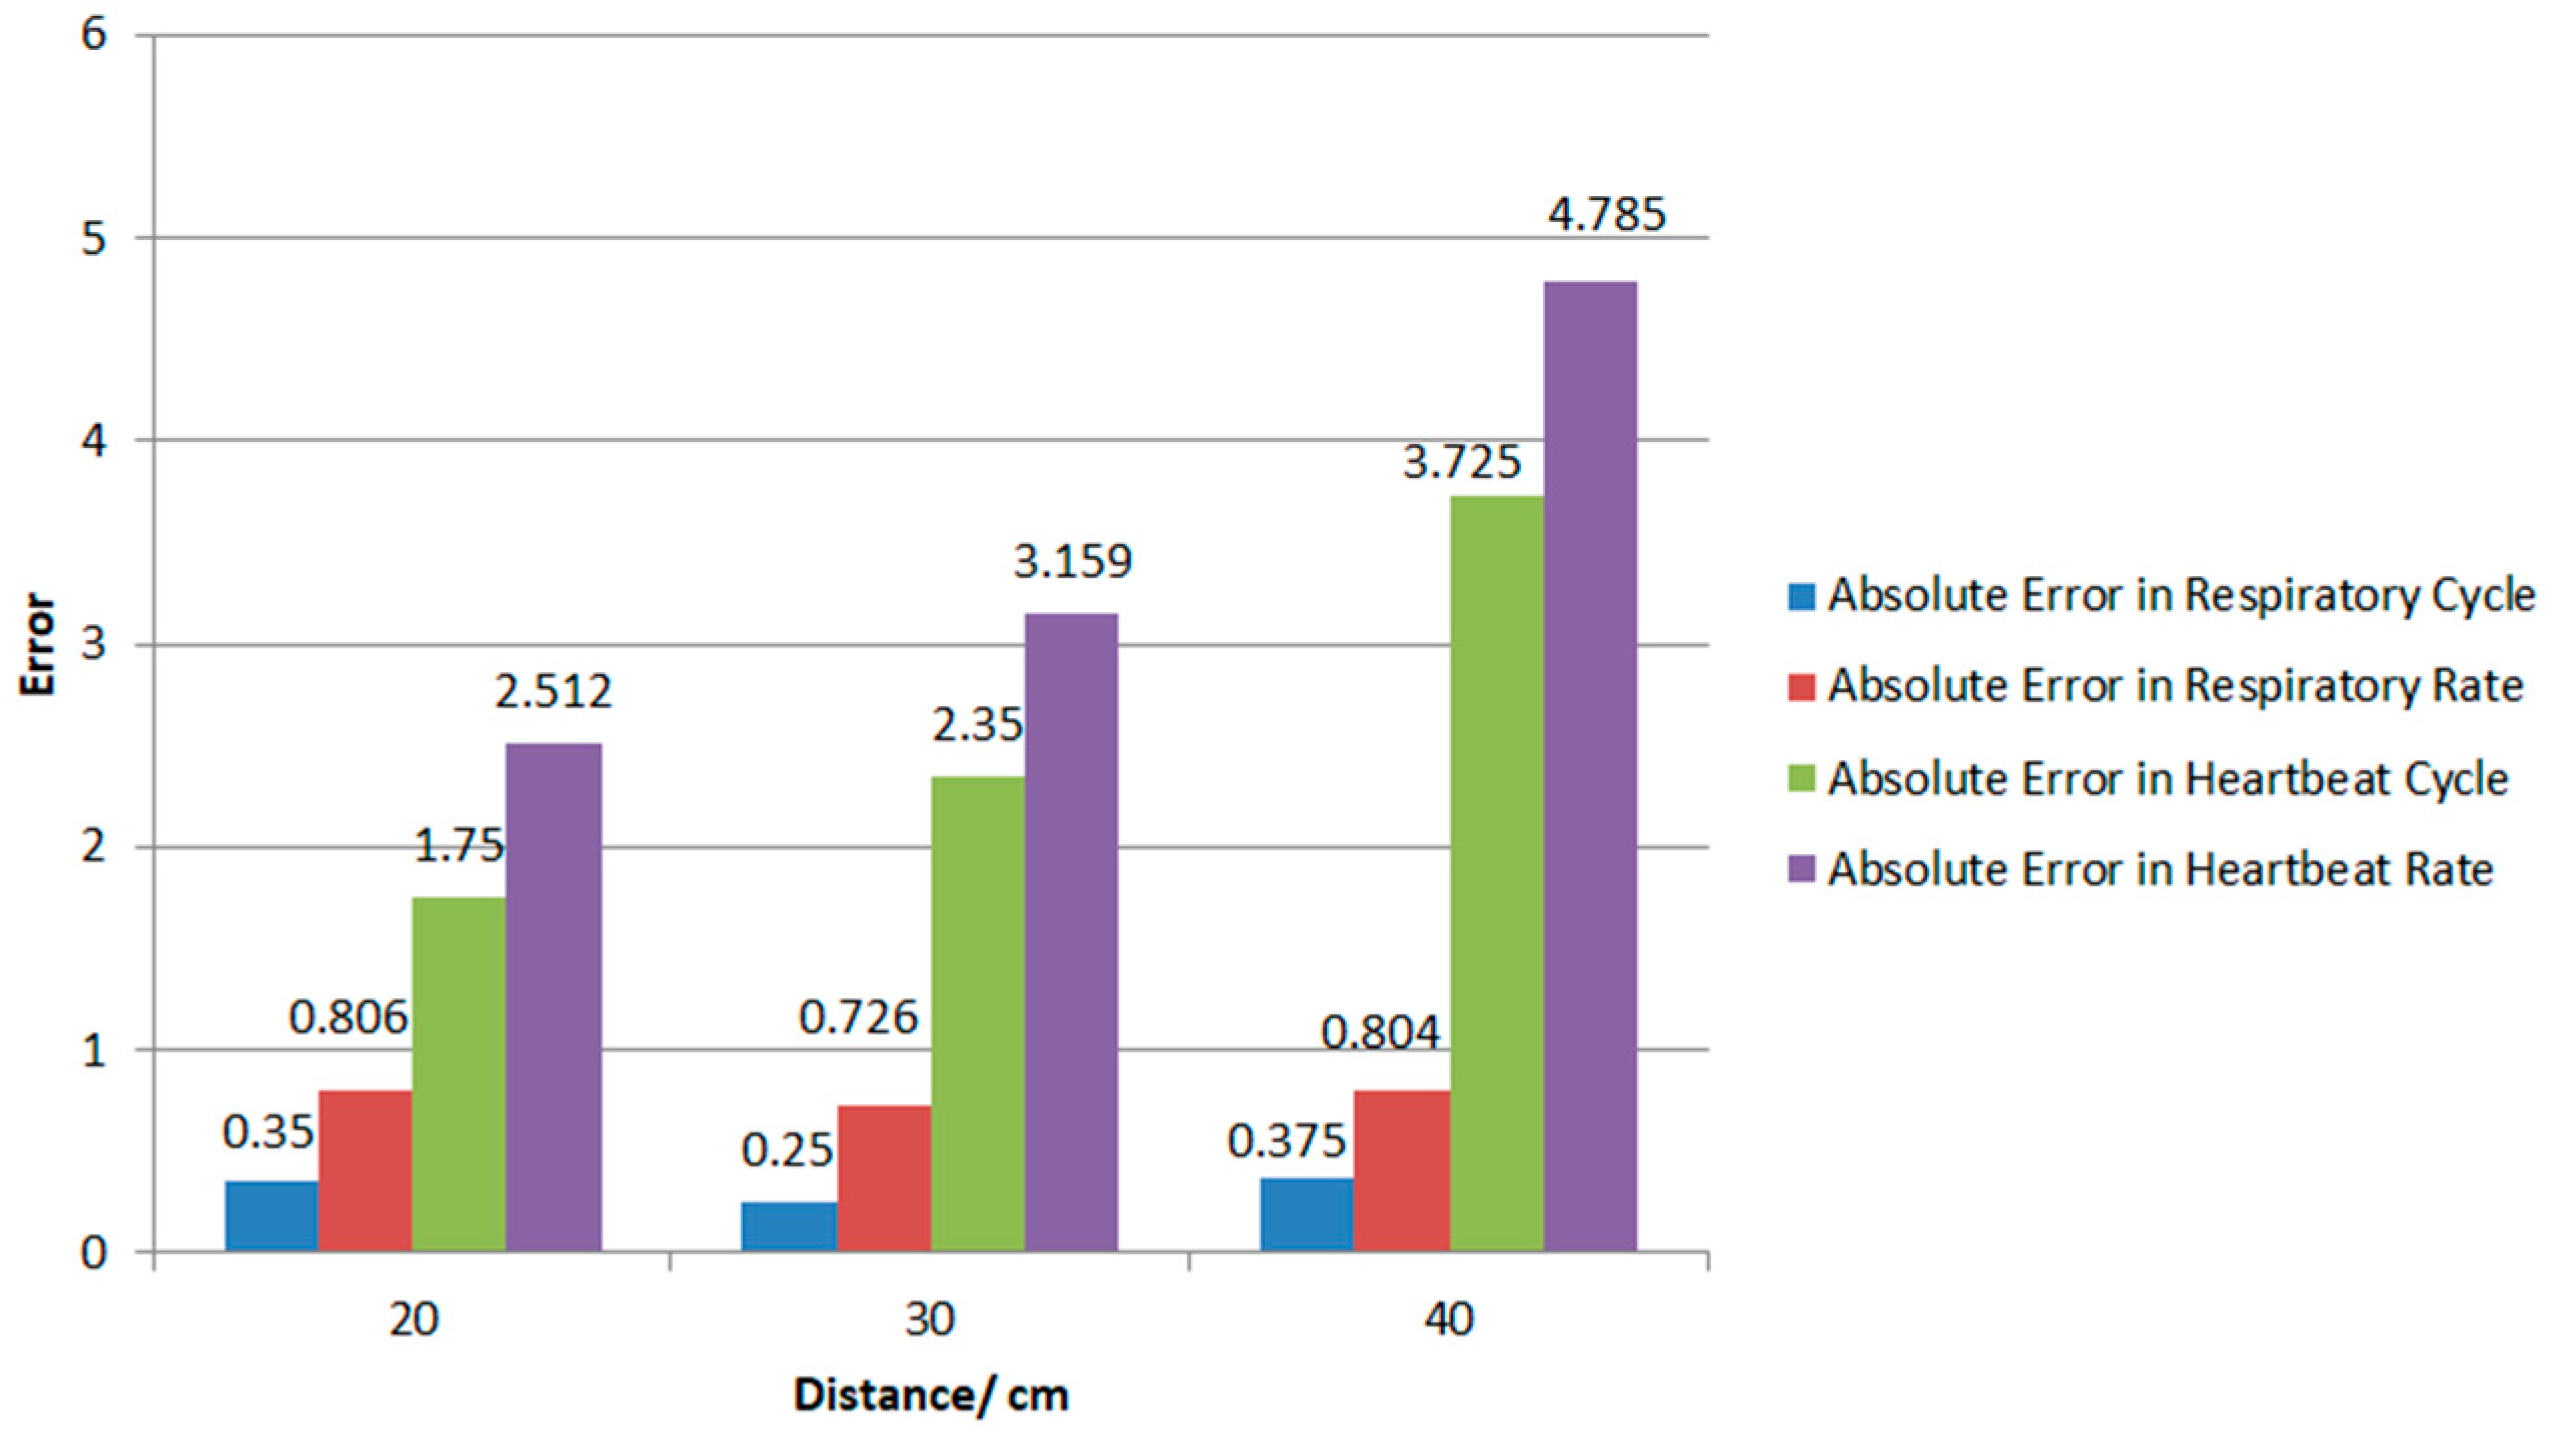
4.3. Physiological Signal Extraction
5. Conclusions
Author Contributions
Funding
Conflicts of Interest
References
- Lee, Y.S.; Pathirana, P.N.; Steinfort, C.L.; Caelli, T. Monitoring and Analysis of Respiratory Patterns Using Microwave Doppler Radar. IEEE J. Transl. Eng. Health Med. 2014, 2, 1–12. [Google Scholar] [CrossRef] [PubMed]
- Singh, L. Respiratory Monitoring and Clutter Rejection Using a CW Doppler Radar with Passive RF Tags. IEEE Sens. J. 2012, 12, 558–565. [Google Scholar] [CrossRef]
- Liu, Y.; Draper, S.C.; Sayeed, A.M. A Secret Key Generation System Based on Multipath Channel Randomness, RSSI vs. CSSI. IEEE Trans. Inf. Forensics Secur. 2011, 3534, 1484–1497. [Google Scholar]
- Li, H.; Ota, K.; Dong, M.; Guo, M. Learning Human Activities through Wi-Fi Channel State Information with Multiple Access Points. IEEE Commun. Mag. 2018, 56, 124–129. [Google Scholar] [CrossRef]
- Wang, X.; Gao, L.; Mao, S. CSI Phase Fingerprinting for Indoor Localization with a Deep Learning Approach. IEEE Internet Things J. 2017, 3, 1113–1123. [Google Scholar] [CrossRef]
- Wang, H.; Zhang, D.; Wang, Y.; Ma, J.; Wang, Y.; Li, S. RT-Fall, A Real-time and Contactless Fall Detection System with Commodity WiFi Devices. IEEE Trans. Mob. Comput. 2017, 16, 511–526. [Google Scholar] [CrossRef]
- Wu, C.; Yang, Z.; Zhou, Z.; Liu, X.; Liu, Y.; Cao, J. Non-Invasive Detection of Moving and Stationary Human with WiFi. IEEE J. Sel. Areas Commun. 2015, 33, 2329–2342. [Google Scholar] [CrossRef]
- Van Dorp, P.; Groen, F.C.A. Human Walking Estimation with Radar. IEE Proc. Radar Sonar Navig. 2003, 150, 356–358. [Google Scholar] [CrossRef]
- Balleri, A.; Chetty, K.; Woodbridge, K. Classification of Personnel Targets by Acoustic micro-Doppler signatures. IET Radar Sonar Navig. 2011, 5, 943–951. [Google Scholar] [CrossRef]
- Giovanni, D.; Alessandro, L.; Pietro, S. A Radar-Based Smart Sensor for Unobtrusive Elderly Monitoring in Ambient Assisted Living Applications. Biosensors 2017, 7, 55. [Google Scholar]
- Li, C.; Lin, J. Random Body Movement Cancellation in Doppler Radar Vital Sign Detection. IEEE Trans. Microw. Theory Tech. 2008, 56, 3143–3152. [Google Scholar]
- Munoz-Ferreras, J.M.; Peng, Z.; Gomez-Garcia, R.; Li, C. Random Body Movement Mitigation for FMCW-radar-based Vital-sign Monitoring. In Proceedings of the 2016 IEEE Topical Conference on Biomedical Wireless Technologies, Networks, and Sensing Systems (BioWireleSS), Austin, TX, USA, 24–27 January 2016; pp. 22–24. [Google Scholar]
- Tang, M.C.; Wang, F.K.; Horng, T.S. Single Self-Injection-Locked Radar with Two Antennas for Monitoring Vital Signs with Large Body Movement Cancellation. IEEE Trans. Microw. Theory Tech. 2017, 65, 5324–5333. [Google Scholar] [CrossRef]
- Lv, Q.; An, K.; Chen, L.; Wang, J.; Li, H.; Ye, D.; Huangfu, J.; Li, C.; Ran, L. Doppler Vital Signs Detection in the Presence of Large-Scale Random Body Movements. IEEE Trans. Microw. Theory Tech. 2018, 66, 4261–4270. [Google Scholar] [CrossRef]
- Faheem, K.; Sung, C. A Detailed Algorithm for Vital Sign Monitoring of a Stationary/Non-Stationary Human through IR-UWB Radar. Sensors 2017, 17, 290. [Google Scholar]
- Li, W.; Tan, B.; Piechocki, R. Passive Radar for Opportunistic Monitoring in E-Health Applications. IEEE J. Transl. Eng. Health Med. 2018, 6, 1–10. [Google Scholar] [CrossRef] [PubMed]
- Van Nguyen, T.P.; Tang, L.; Nguyen, D.M.; Hasan, F.; Mukhopadhyay, S. Wide Band Antennae System for Remote Vital Signs Detecting Doppler Radar Sensor. In Modern Sensing Technologies; Springer: Cham, Switzerland, 2019; pp. 47–62. [Google Scholar]
- Park, Z.; Li, C.; Lin, J. A Broadband Microstrip Antenna with Improved Gain for Noncontact Vital Sign Radar Detection. IEEE Antennas Wirel. Propag. Lett. 2009, 8, 939–942. [Google Scholar]
- Liang, Q.; Mpanda, R.S.; Wang, X.; Shi, J.; Xu, L. A Printed Dipole Array Antenna for Non-contact Monitoring System. In Proceedings of the 2018 Cross Strait Quad-Regional Radio Science and Wireless Technology Conference (CSQRWC), Xuzhou, China, 21–24 July 2018; pp. 1–3. [Google Scholar]
- Hu, X.; Jin, T. Short-range Vital Signs Sensing Based on EEMD and CWT Using IR-UWB Radar. Sensors 2016, 16, 2025. [Google Scholar] [CrossRef] [PubMed]
- Shoaib, M.; Bosch, S.; Incel, O.D.; Scholten, H.; Havinga, P.J.M. Complex Human Activity Recognition Using Smartphone and Wrist-Worn Motion Sensors. Sensors 2016, 16, 426. [Google Scholar] [CrossRef]
- Zhang, M.; Sawchuk, A.A. A Feature Selection-based Framework for Human Activity Recognition Using Wearable Multimodal Sensors. In Proceedings of the ACM Conference on Ubiquitous Computing, Beijing, China, 17–21 September 2011; pp. 92–98. [Google Scholar]
- Chavarriaga, R.; Millán, J.D.R. Unsupervised Adaptation for Acceleration-based Activity Recognition: Robustness to Sensor Displacement and Rotation. Pers. Ubiquitous Comput. 2013, 17, 479–490. [Google Scholar] [CrossRef]
- Sekine, M.; Tamura, T.; Akay, M.; Fujimoto, T.; Togawa, T.; Fukui, Y. Discrimination of Walking Patterns Using Wavelet-based Fractal Analysis. IEEE Trans. Neural Syst. Rehabil. Eng. 2002, 10, 188–196. [Google Scholar] [CrossRef]
- Hemalatha, C.S.; Vaidehi, V. Frequent Bit Pattern Mining Over Tri-axial Accelerometer Data Streams for Recognizing Human Activities and Detecting Fall. Procedia Comput. Sci. 2013, 19, 56–63. [Google Scholar] [CrossRef]
- Simonyan, K.; Zisserman, A. Very Deep Convolutional Networks for Large-Scale Image Recognition. Comput. Sci. 2014, 4, 1–15. [Google Scholar]


| A | B | C | D | E | F | |
|---|---|---|---|---|---|---|
| A | 0.75 | 0.04 | 0.03 | 0.12 | 0.02 | 0.06 |
| B | 0.11 | 0.79 | 0.02 | 0.07 | 0.03 | 0.05 |
| C | 0.02 | 0.04 | 0.83 | 0.04 | 0.01 | 0.04 |
| D | 0.09 | 0.04 | 0.03 | 0.76 | 0 | 0.01 |
| E | 0.01 | 0.06 | 0.05 | 0.01 | 0.82 | 0.10 |
| F | 0.02 | 0.03 | 0.04 | 0 | 0.12 | 0.74 |
| A | B | C | D | E | F | |
|---|---|---|---|---|---|---|
| A | 0.91 | 0 | 0.01 | 0 | 0 | 0.04 |
| B | 0.01 | 0.96 | 0 | 0 | 0.01 | 0 |
| C | 0.08 | 0.02 | 0.99 | 0 | 0.01 | 0.01 |
| D | 0 | 0 | 0 | 1 | 0 | 0.01 |
| E | 0 | 0.02 | 0 | 0 | 0.76 | 0.30 |
| F | 0 | 0 | 0 | 0 | 0.22 | 0.64 |
| [16] | Proposed System | |
|---|---|---|
| Maximum distance | 1 m | 0.4 m |
| Methods of classification | SVM | VGG-16 and LSTM |
| Classification accuracy | 85% | >88% |
| Error of respiratory detection | 13% | 0.779 beats/min |
| Error of Heart rate detection | No experiment | 3.49 beats/min |
© 2019 by the authors. Licensee MDPI, Basel, Switzerland. This article is an open access article distributed under the terms and conditions of the Creative Commons Attribution (CC BY) license (http://creativecommons.org/licenses/by/4.0/).
Share and Cite
Liang, Q.; Xu, L.; Bao, N.; Qi, L.; Shi, J.; Yang, Y.; Yao, Y. Research on Non-Contact Monitoring System for Human Physiological Signal and Body Movement. Biosensors 2019, 9, 58. https://doi.org/10.3390/bios9020058
Liang Q, Xu L, Bao N, Qi L, Shi J, Yang Y, Yao Y. Research on Non-Contact Monitoring System for Human Physiological Signal and Body Movement. Biosensors. 2019; 9(2):58. https://doi.org/10.3390/bios9020058
Chicago/Turabian StyleLiang, Qiancheng, Lisheng Xu, Nan Bao, Lin Qi, Jingjing Shi, Yicheng Yang, and Yudong Yao. 2019. "Research on Non-Contact Monitoring System for Human Physiological Signal and Body Movement" Biosensors 9, no. 2: 58. https://doi.org/10.3390/bios9020058
APA StyleLiang, Q., Xu, L., Bao, N., Qi, L., Shi, J., Yang, Y., & Yao, Y. (2019). Research on Non-Contact Monitoring System for Human Physiological Signal and Body Movement. Biosensors, 9(2), 58. https://doi.org/10.3390/bios9020058