Abstract
This paper demonstrated a new design structure for minimizing the power consumption of a pulse meter. Monolithic devices composed of a red (625 nm) organic light-emitting diode (OLED) and an organic photodiode (OPD) were fabricated on the same substrate. Two organic devices were designed differently. One had a circle-shaped OLED in the center of the device and was surrounded by the OPD, while the other had the opposite structure. The external quantum efficiency (EQE) of the OLED and the OPD were 7% and 37%, respectively. We evaluated and compared the signal-to-noise ratio (SNR) of the photoplethysmogram (PPG) signal on different parts of the body and successfully acquired clear PPG signals at those positions, where the best signal was obtained from the fingertip at a SNR of about 62 dB. The proposed organic pulse meter sensor was operated successfully with a power consumption of 0.1 mW. Eventually, the proposed organic biosensor reduced the power consumption and improved the capability of the pulse meter for long-term use.
1. Introduction
Wearable health-monitoring devices can promote public health by facilitating a person’s health assessment based on their personal vital signs. Due to considerable increased concern for the monitoring of vital signs in normal conditions as well as during physical activities, there has been an enhancement of wearable medical devices and their performance for personal health care [1,2]. Wearable medical devices have been developed to constantly monitor human performance both comfortably and noninvasively [3,4]. These devices have different forms and target different healthy people or patients based on biosensors such as portable electrocardiogram (ECG) [5], cuff-less blood pressure measurement [6], wearable devices for the diagnosis and therapy of movement disorders [7] and pulse oximeters based on photoplethysmogram (PPG) [8]. The PPG signal is one of the crucial biosignals used for monitoring and evaluating the heart rate (HR) and peripheral oxygen saturation (SpO2). The pulse oximeter can be a very useful tool in monitoring and detecting certain disorders such as sleep apnea, which is detected by measuring the SpO2 in the blood [9]. Currently, there are various kinds of commercial pulse meters and pulse oximeter devices available on the market. However, there are still some issues with these kinds of pulse meters that need to be improved in areas such as power consumption, signal quality, and the flexibility of the device. In order to make a flexible pulse meter, an organic light-emitting diode (OLED), and an organic photodiode (OPD) are used with the advantage of its design freedom. Moreover, the relatively low cost, simple fabrication, and lower power consumption of the OLEDs and OPDs makes them preferable options for wearable pulse meters [10].
To obtain a PPG signal from a pulse meter, there are two approaches that can be used: a reflective mode and a transmissive mode, as shown in Figure 1, which illustrates the differences between the two methods for an organic pulse meter.
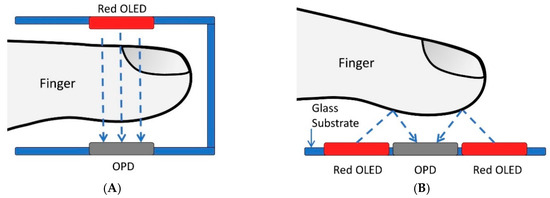
Figure 1.
Obtaining the photoplethysmogram (PPG) signal based on an organic pulse meter: (A) Transmissive mode; (B) Reflective mode [11].
In the transmissive mode, where the light source and the detector are placed on opposite sides as shown in Figure 1A, the light from the OLED goes through the finger and is received on the OPD from the other side. This mode is limited to be applied on terminal body parts such as fingertips and ear lobes. On the other hand, the reflective mode, which is illustrated in Figure 1B, uses light reflection instead of tissue transillumination. The light source and the detector are both mounted side-by-side, where the OPD detector obtains the reflected light from the human skin. Therefore, by taking advantage of the design freedom presented by the organic materials and fabricating it onto a flexible substrate, the pulse meter can be easily worn or attached to the human body. However, in the pulse oximeter, it is difficult to perform accurate oxygen saturation level measurement on some body locations, such as the torso or limbs, using the reflection mode due to the higher density of fat and lower density of blood vessels in those locations [12]. Several researchers have started to work on the reflectance detection method [13,14], as the transmissive mode has been reported to be uncomfortable and have a limited usage. The reflective mode, on the other hand, has several advantages over the transmissive method, as it can be applied to different parts of the body, not only on the fingertips or the thin portion of the ear, to measure the PPG signal.
One of the best advantages of the organic optoelectronic devices is the freedom of design, where the designer engineer can make the best match between the OLED and OPD for improving the power consumption and the PPG signal quality. There are several proposed design structures in the literature. In [15], separated two square-shaped OLED devices and one rectangular-shaped OPD device were proposed as a transmissive mode pulse oximeter, while in [16], they proposed a monolithic device of array square-shaped OLEDs and OPDs for measuring the oxygen saturation and creating two-dimensional (2D) oxygenation maps. The configuration of an annularly-shaped photodiode (PD) ring and light-emitting diode (LED) located in the center was first proposed by [12] for improving the battery longevity of the inorganic reflective pulse oximeter. In [17], a circular-shaped OPD in the center of half-ring-shaped of red polymer light-emitting diode (PLED) and the second half-ring for green PLED design was proposed for the flexible reflective pulse oximeter. Also, a ring-shaped OPD surrounding a circular-shaped OLED was proposed in [18] for a flexible pulse oximetry sensor. They employed an optical simulation for deciding the best dimension area and the best distance between the OLED and the OPD for low-power consumption. However, the PPG signal quality was not adequately addressed in the previously proposed designs. Moreover, the dimension design, the material structure, and the characteristics of the OLED and OPD in this work are different than those in previous works. Consequently, we proposed and compared different dimensions and material structures based on our previous works in [11,19] as part of our continuous research into improving the power consumption and the signal quality of portable pulse meters, and highlighted the significance of the optical simulation in designing the OLED and the OPD.
There are several studies that have been carried out in the literature to improve the power consumption of the pulse meter. In [20], they proposed a reflective pulse meter prototype with a total power of about 40 mW, with the LED driving current between 17.4–50 mA. In contrast, [21] proposed an analog single-chip pulse oximeter that was implemented with 4.8 mW of total power consumption required of the LED power and the processing power chips. A fully integrated pulse oximeter front-end with about 1 mW of total power consumption, 0.31 mW for the LEDs, and 0.53 mW for the front-end was proposed in [22]. For improving the flexible pulse oximeter, a promising result of the average OLED’s power consumption of 0.097 mW, at a full-duty cycle, was reported in [18]. While we are presenting the power consumption of the previous works on the pulse oximeter, which requires two light sources, it is worth mentioning that our proposed pulse meter requires a single light source that leads to half the power consumption of two light sources when they operate at the same time with a full-duty cycle.
The PPG signal can be contaminated by noises from different kinds of sources such as motion artifacts, electronic noises, and high-frequency noises from the ambient light fixture and appliances. Consequently, extensive works have been done on denoising the PPG signals with several noise reduction techniques such as discrete wavelet transform (DWT) [23], independent component analysis (ICA) [24], and morphological characteristics comparison [25]. In [26], sporadic noise was reduced from a continuous periodic signal after applying a cluster analysis for picking similar replications or pulses from a periodic single, while in [27], a pattern recognition filtering system for PPG and ECG signals was proposed. However, it is difficult to implement these methods into wearable devices due to their requirements and complexity. In this work, we implemented a finite impulse response (FIR) digital filter in order to improve the signal’s quality due to its efficacy in the embedded systems.
This paper presents the significance of designing an effective OLED and OPD structure that is guided by optical simulation for improving pulse meter sensors in terms of power consumption and signal quality. Two new designs of OLED and OPD were fabricated and tested for their performance verification. The rest of this paper is organized into three sections. Section 1 is the introduction. The materials and methodology are present in Section 2, where we discuss the approach that we used to simulate the new design, define the characteristics of the organic optoelectronic device along with explaining the driving circuit, and describe the digital filter that we applied to the system. In Section 3, we discuss the comparative results of the two devices as well as the results of the obtained PPG signals from different parts of the body.
2. Materials and Methods
Two different design structures were fabricated and named as Device-A and Device-B. In Device-A, a circle-shaped red OLED was set in the center of the pulse meter with a total emitting area of 0.03 cm2 and surrounded by a ring-shaped OPD with a surface area 0.16 cm2, whereas in Device-B, a circle-shaped OPD was set in the center and surrounded by a ring-shaped red OLED with areas of 0.03 cm2 and 0.16 cm2, respectively. The rationale behind the use of the ring-shaped OPD structure that surrounds the OLED is to allow the OPD to collect the reflected photons from the skin efficiently. The proposed devices were tested on healthy individuals, who gave their informed consent for inclusion before they participated in the study.
2.1. Optical Simulation
In order to get the best OLED and OPD design for improving the power consumption and quality of the signal, a simplified finger model and OLED/OPD model were simulated optically by LightTools software (Synopsys, Inc., California, USA). The simulator traces the light rays using the ray-tracing method in combination with the Monte Carlo method, where two opposite design structures of the pulse meter were simulated: Device-A and Device-B. The finger model was simplified into a four-layer structure of skin, subcutaneous adipose tissue, muscle, and bone. The optical parameters of these layers were approximated from the literature in [28,29,30,31]. The thickness of each layer was approximately assumed as 2 mm, 2.5 mm, 3 mm and 6 mm, respectively. The distribution of the light rays from the OLED into the human body and the reflection on the OPD were illustrated in Figure 2A. The pulse meter model was composed of a light object source (625 nm) that represented the red OLED, and a surface receiver that represented the OPD.
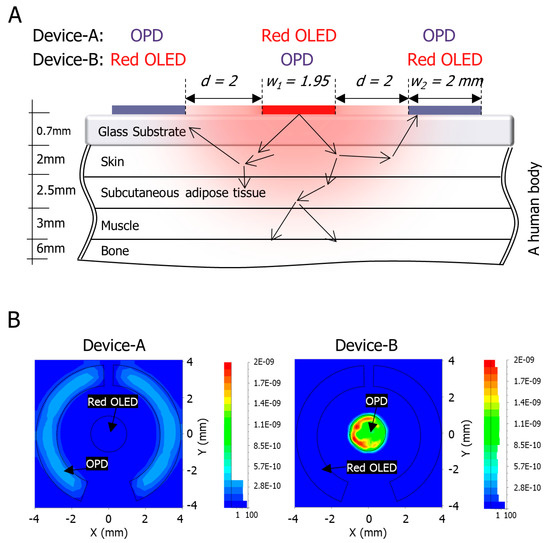
Figure 2.
(A) Optical skin schematic model of a human finger, an organic light-emitting diode (OLED) as a light object source, and an organic photodiode (OPD) as a surface receiver, where d is the distance between the edges of the OLED and the OPD, W1 is the diameter of the OLED, and W2 is width of the OPD; (B) The optical simulation results at the surface receiver.
The light ray’s energy is determined, in the optical simulation, by the source’s power and the number of rays emitted. The radiant powers of the light object source of Device-A and Device-B were assumed, based on our previous OLED device, as 1.4 μW and 7.5 μW, respectively. The number of the traced rays were 1,000,000 rays. According to the simulation results in Figure 2B, the maximum estimated irradiance of Device-A and Device-B were 3.7 × 10⁻¹⁰ W/mm2 and 2 × 10⁻⁹ W/mm2, respectively. By multiplying the irradiance with the area of the OPD, the total power of Device-A will be 5.9 × 10⁻⁹ W and that of Device-B will be 6 × 10⁻⁹ W, where the maximum irradiance was assumed to be distributed equally, which is expected to provide closer values of the PPG amplitude from both OPD devices. Therefore, from these two opposite design structures, we conducted a comparison in order to choose the best one in terms of power consumption and signal quality.
2.2. The Organic Optoelectronic Device
In this work, we fabricated two different pattern monolithic devices, Device-A and Device-B. The red OLED and the OPD were placed on the same 0.7 mm thick glass substrate, as shown in Figure 3A, where the two-identical ring-type OLED/OPDs were fabricated on the same substrate as a spare and reference device. The red OLED was adopted in this work due to its various advantages. For instance, the green OLED light is efficiently absorbed through the skin, which leads to producing a higher signal-to-noise ratio (SNR) level than the red OLED. However, absorbing more light through the skin, especially darker skin where the shorter wavelengths of light are strongly absorbed by melanin [32], limits the depth that light can pass through, and hence weakens the strength of the PPG signal [33]. Based on that, green OLEDs will face some challenges when they are used as a light source for wearable pulse oximeters.
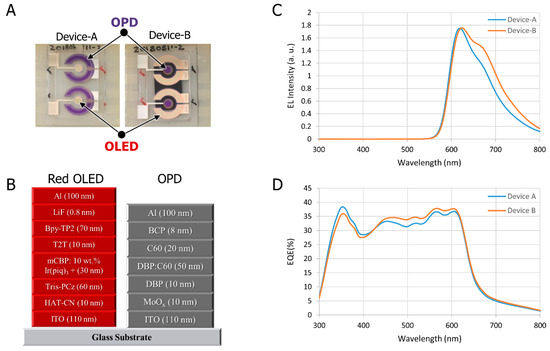
Figure 3.
(A) Top view of the fabricated optoelectronic Device-A and Device-B; (B) The organic device structure of the OLED and OPD; (C) Electroluminescence spectrum of the OLED with respect to the wavelength (nm); and (D) External quantum efficiency (EQE) of the OPD with respect to the wavelength (nm).
The performances of the OLED and OPD devices are essential to the quality of the pulse meter measurements. We used the same material structure of the OLED in Device-A and Device-B and the same material structure of the OPD in both devices. In the fabrication process, we prepared 2.5 cm × 2.5 cm glass substrates coated with indium-tin-oxide (ITO) and cleaned via sonication in detergent, deionized (DI) water, acetone, and isopropyl alcohol (IPA). Next, the substrates were boiled in IPA for 10 min and subjected to UV-ozone treatment for 15 min. Then, the samples were loaded into a thermal evaporator chamber where the organic and metal layers were deposited with proper shadow mask patterns for the OLED, followed by the OPD. After the evaporation processes, the samples were encapsulated in a glove box by glass lids using UV curable epoxy resin [19]. The device structure of the OLED was composed of ITO (110 nm)/HAT-CN (10 nm)/Tris-PCz (60 nm)/mCBP:10 wt.% Ir(piq)3 + (30 nm)/T2T (10 nm)/Bpy-TP2 (70 nm)/LiF (0.8 nm)/Al (100 nm), and the device structure of the OPD was composed of ITO (110 nm)/MoOx (10 nm)/DBP (10 nm)/DBP:C60 (50 nm)/C60 (20 nm)/BCP (8 nm)/Al (100 nm) as shown in Figure 3B. Figure 3C shows the electroluminescence (EL) characteristic of the OLED with respect to the wavelength, where the maximum intensity of light is at 625 nm. OLEDs have advantages over LEDs such as high flexibility and low manufacturing cost. The very thin organic layers of the OLED and OPD device make it applicable for fabrication onto a flexible substrate, which will be comfortable when placed on the human skin. The EQE of the OPD device at 625 nm, of a zero-bias condition, for Device-A and Device-B was about 37%, which is compatible with the red OLED wavelength, as shown in Figure 3D.
2.3. The Driving Circuit
The system structure of the proposed pulse meter is composed of three parts: an optoelectronic device, an analog circuit, and a microcontroller unit (MCU). The analog circuit employed in this work involved three main stages: a transimpedance amplifier (TIA), a bandpass filter (BPF), and amplification, as illustrated in Figure 4A.
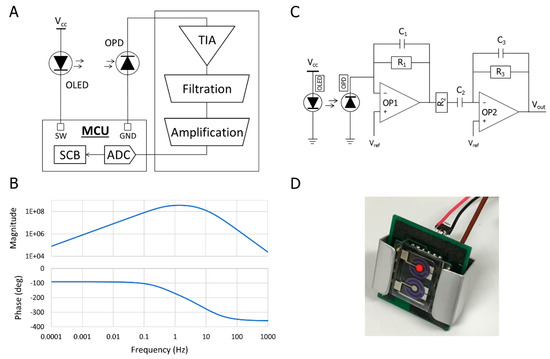
Figure 4.
Circuit design of the pulse meter. (A) The system structure of the pulse meter; (B) The Bode plot of the bandpass filter (BPF) circuit; (C) The proposed analog circuit for acquiring the photoplethysmogram (PPG) signal from the pulse meter; and (D) The proposed portable pulse meter prototype.
The generated photocurrent from the OPD, as a response of the reflected light from the blood vessels, is a very small amount in the nanoampere range, which requires a current-to-voltage converter such as a TIA to translate the current output of the OPD to a voltage signal in the first stage of the analog circuit. The TIA should have a low input impedance and low output impedance to avoid impedance mismatch in the circuit. It offers a low impedance to the OPD, and isolates it from the output voltage of the operational amplifier [34,35]. The next stage is the analog filtration process where the PPG signal needs to be filtered out before the amplification. The PPG signal contains an alternating current (AC) component and a direct current (DC) component where the aim is to eliminate the DC component and amplify the AC component. Therefore, a BPF that was composed of a low-pass filter to eliminate the high-frequency noise coming from the ambient light fixture and AC devices, and a high-pass filter to eliminate the DC signal, was applied with a cut-off frequency from 0.5 Hz to 16 Hz. The transfer function (TF) of the BPF is stated in Equation (1), which indicates three negative poles of a stable system where we can simulate the frequency response of the circuit, as shown in Figure 4B:
The last stage after filtering the signal is to amplify it to be suitable for the analog-to-digital converter (ADC) process in order to send the data via a serial communication block (SCB) or Bluetooth low energy (BLE). Therefore, in order to amplify the signal in the range of 0 to Vdd for the single-supply op-amp, a virtual ground (Vref) needs to be connected, as shown in Figure 4C. The MCU module that we applied in this work was a PSoC4 CYBLE-214015-01 module. It improved the battery life by offering low-power modes, during which the chip offered restricted performance for the lowest possible power consumption. The final prototype of the wearable pulse meter is shown in Figure 4D.
2.4. Digital Filter
In portable pulse meters, the PPG signals are susceptible to corruption by noise and motion artifacts, where the analog filter is not adequate to eliminate these noises. Hence, the digital filter was implemented to improve the PPG signal’s quality. There are several noise reduction methods using digital signal processing techniques in the literature such as the discrete wavelet transform (DWT) [23], morphological characteristics comparison [25], and cluster analysis [26]. However, it is difficult to implement these methods into embedded systems due to their requirements and complexity. Therefore, we implemented a finite impulse response (FIR) digital filter in order to improve the signal’s quality. The representative equation of the FIR digital filter is shown in Equations (2) and (3):
where y[n] is the output sequence of the digital filter; x[k] is the input sequence; L is the interval; b[k] is the weight coefficient; and is the Hamming window coefficient 0.54 [36,37]. The cut-off frequency of the FIR digital filter was set at 16 Hz, as choosing a very low cut-off frequency would alter the PPG waveform structure and lose information from the signal such as the systolic peak, dicrotic notch, and diastolic peak, as shown in Figure 5. The FIR digital filter reduced the noise and enhanced the stopband slope from −20 dB/decade in the analog filter to more than −86 dB/decade.
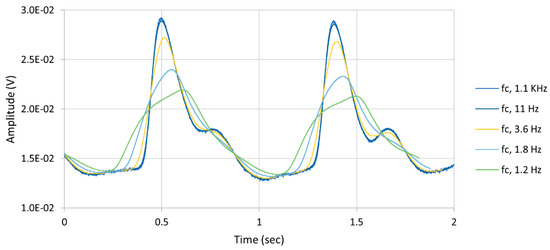
Figure 5.
Digital low-pass filter effect on the PPG signal, where the signal lost its morphological structure if the cut-off frequency (fc) was set very close to the carrier frequency.
2.5. SNR Measurement
The common term for quantifying the digital signal is the signal-to-noise ratio (SNR), and it can be simply calculated, as formulated in Equation (4). Fast Fourier transform (FFT) is a fast computation algorithm for discrete Fourier transform (DFT), which is defined by the formula in Equation (5). FFT analysis was used to compute the noise of the digital signal by converting the time-domain signal to the frequency domain by decomposing a sequence of values into components of different frequencies.
where Asignal is the amplitude of the signal and Anoise is the amplitude of the noise.
where xn is discrete-time input sequence; Xk is the DFT; and N is the number of samples.
The spectra of the FFT is a series of N/2 points in the frequency domain from 0 Hz to fs/2 Hz, where N is the number of samples and fs is the sampling frequency. The SNR of the PPG signal is calculated by subtracting the amplitude of the PPG signal from the amplitude of the noise level in dB, as illustrated in Figure 6.
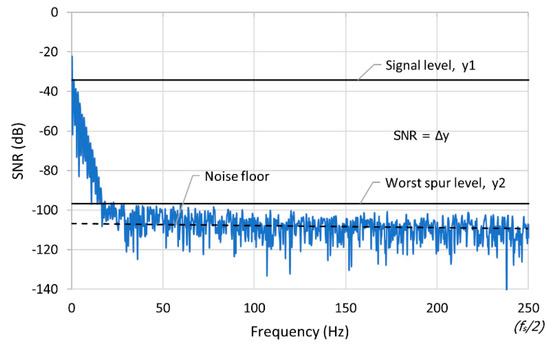
Figure 6.
Fast Fourier transform waveform to calculate the signal-to-noise ratio (SNR) of the PPG signal.
3. Results and Discussion
3.1. Comparative Results for Device-A and Device-B
The performance of the proposed pulse meter was tested in vivo on a healthy male subject. The portable pulse meter was attached to the index finger to acquire the PPG signal from Device-A and Device-B sequentially, in order to compare their performance. The PPG signals were obtained from the same subject for a specific time period while he was resting in a chair. For the evaluation process, the data were recorded at the sampling frequency of 500 SPS. The FIR digital filter was applied at a 16 Hz cut-off frequency. The heart rates were extracted accurately in both devices and estimated by averaging the beat-to-beat interval of the peaks in the PPG signal. The portable pulse oximeter (NURSE ANGIE, Custom Co., Tokyo, Japan) was selected as a reference device for estimating the pulse rate (PR) due to its ability to measure the PR in the range of 25 bpm to 250 bpm with a resolution of 1 bpm and accuracy of 3% error. The proposed pulse meter showed accurate results of about 1.5% error of the PR compared to the commercial reference. Figure 7 shows the comparison between the PPG waveform of Device-A and Device-B before and after applying the digital filter. Both devices were reliable and acquired the PPG signal clearly and were almost similar in their output.
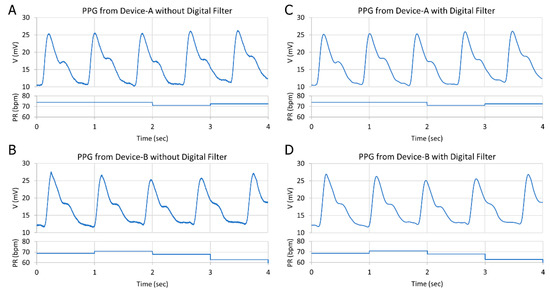
Figure 7.
Comparison between the PPG signal from (A) Device-A without a digital filter; (B) Device-B without a digital filter; (C) Device-A after a digital filter; and (D) Device-B after a digital filter.
A summary of the PPG signal characteristics of Device-A and Device-B are shown in Table 1.

Table 1.
Summary of the PPG signal’s quality for Device-A and Device-B.
The amplitude Vp-p of the PPG signal in Device-A and Device-B was roughly 15 mV, which was as expected in the optical simulation where the amount of reflected light that was received from both OPDs was almost equal. There was a slight difference between the SNR in Device-A and Device-B, which could be due to the difference in the OPD dimension area where the biggest area gained more noise. It is noteworthy that the power consumption recorded a significant disparity between the two devices, where Device-B consumed 8 mW, while Device-A consumed only 0.1 mW. Consequently, these findings support the assumption that designing an OLED to emit a large amount of light is not necessary to produce a high-quality PPG signal; instead, it will consume more power. On the other hand, designing an effective OLED and OPD structure guided by optical simulation led to the best result in terms of power consumption and signal quality. The digital filter demonstrated a noticeable improvement of about 25% in both devices from 45.4 dB to 62.6 dB in Device-A and from 47.4 dB to 63.3 dB in Device-B. As a result, Device-A was selected as the effective device structure in terms of power consumption and quality level in comparison with Device-B.
3.2. Results of Device-A on Different Body Parts
The Device-A pulse meter was attached to multiple locations on the body (index finger, middle finger, little finger, forearm, wrist, and forehead) within a specific time period. The PPG signals were obtained from those body locations sequentially, from the same subject, in order to compare the PPG signal quality between them, as shown in Figure 8.
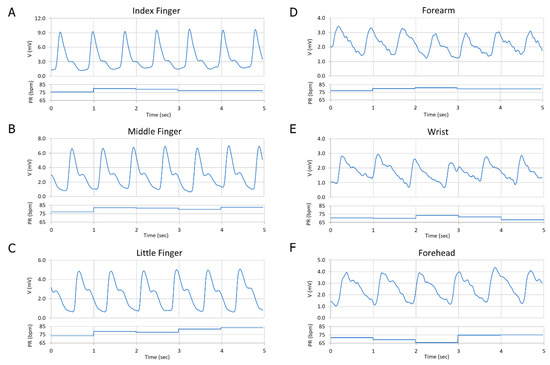
Figure 8.
Comparison between the PPG signal on different parts of the body: (A) Index finger; (B) Middle finger; (C) Little finger; (D) The forearm; (E) The wrist; and (F) The forehead.
Device-A successfully showed a very clear PPG signal on the fingers and a lower quality signal on the forearm, wrist, and forehead. Table 2 summarizes the amplitude, the average pulse rate (PR), and the SNR of the different PPG signals.
Table 2.
Summary of the PPG signal’s quality at different parts of the body. PR: pulse rate.
The amplitude of the PPG signal varied between 2–20 mV in the devices. There are several factors that can affect changes in the signal amplitude and can be influenced by the type of human skin, the position of the finger on the OPD, and how much pressure is applied from the finger to the OPD where the amount of the reflected light from the arterial blood vessels on the OPD changes based on that pressure. The SNR table demonstrated a very good quality level from the three fingers with an average of 56 dB and showed a good quality from the forehead of 51.4 dB, while it presented a lower quality signal on the forearm and on the wrist position of about 46 dB, as the fat tissue in these parts is thicker, and the arterial blood vessels are deeper than in the skin tissue. In such cases, the intensity of the OLED needs to be increased, which means more power is consumed. For that trade-off between the SNR level and power consumption, we chose a suitable current source for the OLED at 20 μA, 5 V, in order to obtain a very good quality signal from the fingers and a good quality signal from the other body parts. The PR was calculated accurately based on our algorithm. The results showed that the proposed pulse meter based on the new OLED and OPD design structure was capable of acquiring the PPG signals accurately and consistently and was able to minimize the power consumption to as low as 0.1 mW in comparison to the other design structure.
4. Conclusions
This paper addressed the significance of designing an effective OLED and OPD structure to improve pulse meter sensors in terms of power consumption and signal quality. Designing an OLED that emits a high amount of light is not necessary to produce a high-quality PPG signal; instead, it will consume more power. On the other hand, designing an effective OLED and OPD structure guided by optical simulation led to the best result in terms of power consumption and signal quality. That assumption was verified by comparing two opposite pulse meter design structures. One had a circle-shaped OLED in the center of the device and was surrounded by a ring-shaped OPD, while the other had the opposite structure. The two methods of obtaining the PPG signal—the reflective method and the transmissive method—were described in this paper, where the reflective method was implemented. The materials and methods that were used in this work, which were the optical simulation, the organic optoelectronic device, the driving circuit, the FIR digital filter, and the SNR measurement, were discussed in detail. The proposed pulse meter successfully showed compatible characteristics, as Device-A effectively demonstrated its ability to measure a clear PPG signal up to a SNR of 62 dB from different parts of the body and operated at a very low power consumption of 0.1 mW, which is essential for the long-term use of portable medical devices.
In future work, the wireless monitoring of the PPG signals will be studied. In order to improve the power consumption performance of the wireless pulse meter, BLE will be integrated into the system. Moreover, the OLED and OPD will be fabricated onto a flexible substrate. These additives will increase the pulse meter’s reliability and flexibility of use as a comfortable wearable device for medical applications.
Author Contributions
Supervision and Validation, R.H.; Conceptualization, all authors; Formal analysis, F.E. and M.A.; Methodology, A.B., H.I., C.-H.S., and F.E.; Software, F.E.; Writing—Original Draft Preparation F.E.; Writing—Review and Editing, R.H. and F.E. All authors approved the final manuscript.
Funding
This research was funded by the Center of Innovation Program (COI STREAM) from the Japan Science and Technology Agency (JST).
Acknowledgments
The support from Kyushu University and the Ministry of Education, Culture, Sports, Science, and Technology (MEXT), Japan is highly appreciated.
Conflicts of Interest
The authors declare no conflict of interest. The funder had no role in the design of the study; in the collection, analyses, or interpretation of data; in the writing of the manuscript, or in the decision to publish the results.
References
- Angelov, G.V.; Nikolakov, D.P.; Ruskova, I.N.; Gieva, E.E.; Spasova, M.L. Healthcare Sensing and Monitoring. In Enhanced Living Environments; Springer: New York, NY, USA, 2019; pp. 226–262. [Google Scholar]
- Bogue, R. Towards the trillion sensors market. Sens. Rev. 2014, 34, 137–142. [Google Scholar] [CrossRef]
- Seneviratne, S.; Hu, Y.; Nguyen, T.; Lan, G.; Khalifa, S.; Thilakarathna, K.; Hassan, M.; Seneviratne, A. A survey of wearable devices and challenges. IEEE Commun. Surv. Tutor. 2017, 19, 2573–2620. [Google Scholar] [CrossRef]
- Khan, Y.; Ostfeld, A.E.; Lochner, C.M.; Pierre, A.; Arias, A.C. Monitoring of Vital Signs with Flexible and Wearable Medical Devices. Adv. Mater. 2016, 28, 4373–4395. [Google Scholar] [CrossRef]
- Koo, J.H.; Jeong, S.; Shim, H.J.; Son, D.; Kim, J.; Kim, D.C.; Choi, S.; Hong, J.-I.; Kim, D.-H. Wearable electrocardiogram monitor using carbon nanotube electronics and color-tunable organic light-emitting diodes. ACS Nano 2017, 11, 10032–10041. [Google Scholar] [CrossRef]
- Zheng, Y.L.; Yan, B.P.; Zhang, Y.T.; Poon, C.C.Y. An armband wearable device for overnight and cuff-less blood pressure measurement. IEEE Trans. Biomed. Eng. 2014, 61, 2179–2186. [Google Scholar] [CrossRef]
- Son, D.; Lee, J.; Qiao, S.; Ghaffari, R.; Kim, J.; Lee, J.E.; Song, C.; Kim, S.J.; Lee, D.J.; Jun, S.W.; et al. Multifunctional wearable devices for diagnosis and therapy of movement disorders. Nat. Nanotechnol. 2014, 9, 397–404. [Google Scholar] [CrossRef]
- Jubran, A. Pulse oximetry. Intensive Care Med. 1999, 3, R11–R17. [Google Scholar]
- Álvarez, D.; Hornero, R.; García, M.; del Campo, F.; Zamarrón, C. Improving diagnostic ability of blood oxygen saturation from overnight pulse oximetry in obstructive sleep apnea detection by means of central tendency measure. Artif. Intell. Med. 2007, 41, 13–24. [Google Scholar] [CrossRef] [PubMed]
- Williams, G.; Backhouse, C.; Aziz, H. Integration of Organic Light Emitting Diodes and Organic Photodetectors for Lab-on-a-Chip Bio-Detection Systems. Electronics 2014, 3, 43–75. [Google Scholar] [CrossRef]
- Elsamnah, F.; Hattori, R.; Shim, C.-H.; Bilgaiyan, A.; Sugawara, R.; Affiq, M. Reflectance-based Monolithic Organic Pulsemeter Device for Measuring Photoplethysmogram Signal. In Proceedings of the 2018 IEEE International Instrumentation and Measurement Technology Conference (I2MTC), Houston, TX, USA, 14–17 May 2018; pp. 1–5. [Google Scholar]
- Mendelson, Y.; Pujary, C. Measurement site and photodetector size considerations in optimizing power consumption of a wearable reflectance pulse oximeter. In Proceedings of the 25th Annual International Conference of the IEEE Engineering in Medicine and Biology Society, Cancun, Mexico, 17–21 September 2003; pp. 3016–3019. [Google Scholar]
- Lee, H.; Ko, H.; Lee, J. Reflectance pulse oximetry: Practical issues and limitations. ICT Express 2016, 2, 195–198. [Google Scholar] [CrossRef]
- Chung, S.C.; Sun, C.C. Signal-enhancement reflective pulse oximeter with Fresnel lens. Opt. Commun. 2016, 375, 9–14. [Google Scholar] [CrossRef]
- Lochner, C.M.; Khan, Y.; Pierre, A.; Arias, A.C. All-organic optoelectronic sensor for pulse oximetry. Nat. Commun. 2014, 5, 1–7. [Google Scholar] [CrossRef]
- Khan, Y.; Han, D.; Pierre, A.; Ting, J.; Wang, X.; Lochner, C.M.; Bovo, G.; Yaacobi-Gross, N.; Newsome, C.; Wilson, R.; et al. A flexible organic reflectance oximeter array. Proc. Natl. Acad. Sci. USA 2018, 115, E11015–E11024. [Google Scholar] [CrossRef]
- Tachibana, Y.; Kaltenbrunner, M.; Koizumi, M.; Matsuhisa, N.; Yukita, W.; Zalar, P.; Jinno, H.; Someya, T.; Kitanosako, H.; Yokota, T. Ultraflexible organic photonic skin. Sci. Adv. 2016, 2, e1501856. [Google Scholar]
- Kim, H.; Lee, H.; Yoo, S.; Kim, M.; Kim, E.; Lee, J.; Yoo, H.-J.; Lee, Y. Toward all-day wearable health monitoring: An ultralow-power, reflective organic pulse oximetry sensing patch. Sci. Adv. 2018, 4, eaas9530. [Google Scholar]
- Bilgaiyan, A.; Sugawara, R.; Elsamnah, F.; Shim, C.; Affiq, M.; Hattori, R. Optimizing performance of reflectance-based organic Photoplethysmogram (PPG) sensor. In Proceedings of the Organic and Hybrid Sensors and Bioelectronics XI, San Diego, CA, USA, 14 September 2018; Volume 10738, p. 1073808. [Google Scholar]
- Rodrigues, E.M.G.; Godina, R.; Cabrita, C.M.P.; Catalão, J.P.S. Experimental low cost reflective type oximeter for wearable health systems. Biomed. Signal Process. Control 2017, 31, 419–433. [Google Scholar] [CrossRef]
- Amplifier, E.T.; Tavakoli, M.; Member, S.; Turicchia, L.; Sarpeshkar, R.; Member, S. An Ultra-Low-Power Pulse Oximeter Implemented. IEEE Trans. Biomed. Circuits Syst. 2010, 4, 27–38. [Google Scholar]
- Glaros, K.N.; Drakakis, E.M. A Sub-mW fully-integrated pulse oximeter front-end. IEEE Trans. Biomed. Circuits Syst. 2013, 7, 363–375. [Google Scholar] [CrossRef] [PubMed]
- Kabir, M.A.; Shahnaz, C. Denoising of ECG signals based on noise reduction algorithms in EMD and wavelet domains. Biomed. Signal Process. Control 2012, 7, 481–489. [Google Scholar] [CrossRef]
- Kim, B.S.; Yoo, S.K. Motion Artifact Reduction in Photoplethysmography Using Independent Component Analysis. IEEE Trans. Biomed. Eng. 2006, 53, 566–568. [Google Scholar] [CrossRef] [PubMed]
- Sun, X.; Yang, P.; Zhang, Y.-T. Assessment of photoplethysmogram signal quality using morphology integrated with temporal information approach. In Proceedings of the 2012 Annual International Conference of the IEEE Engineering in Medicine and Biology Society (EMBC), San Diego, CA, USA, 28 August–1 September 2012; pp. 3456–3459. [Google Scholar] [PubMed]
- Waugh, W.; Allen, J.; Wightman, J.; Sims, A.J.; Beale, T.A.W. Novel Signal Noise Reduction Method through Cluster Analysis, Applied to Photoplethysmography. Comput. Math. Methods Med. 2018, 2018. [Google Scholar] [CrossRef] [PubMed]
- Rundo, F.; Conoci, S.; Ortis, A.; Battiato, S. An advanced bio-inspired photoplethysmography (PPG) and ECG pattern recognition system for medical assessment. Sensors 2018, 18, 405. [Google Scholar] [CrossRef] [PubMed]
- Zamburlini, M.; Pejović-Milić, A.; Chettle, D.R.; Webber, C.E.; Gyorffy, J. In vivo study of an x-ray fluorescence system to detect bone strontium non-invasively. Phys. Med. Biol. 2007, 52, 2107–2122. [Google Scholar] [CrossRef]
- Akkus, O. Evaluation of Skin and Subcutaneous Adipose Tissue Thickness for Optimal Insulin Injection. J. Diabetes Metab. 2012, 3, 2. [Google Scholar] [CrossRef]
- Jacques, S.L. Optical properties of biological tissues: A review. Phys. Med. Biol. 2013, 58, R37. [Google Scholar] [CrossRef]
- Drahanský, M.; Kanich, O.; Březinová, E.; Shinoda, K. Experiments with Optical Properties of Skin on Fingers. Int. J. Opt. Appl. 2016, 6, 37–46. [Google Scholar]
- Anderson, R.R.; Parrish, J.A. The optics of human skin. J. Investig. Dermatol. 1981, 77, 13–19. [Google Scholar] [CrossRef] [PubMed]
- Tamura, T.; Maeda, Y.; Sekine, M.; Yoshida, M. Wearable Photoplethysmographic Sensors—Past and Present. Electronics 2014, 3, 282–302. [Google Scholar] [CrossRef]
- Jung, S.; Cressler, J.D.; Babcock, J.A.; Cestra, G.; Buchholz, A. A design methodology to achieve low input impedance and non-constant gain-bandwidth product in TIAs for optical communication. Proc. - IEEE Int. Symp. Circuits Syst. 2013, 3, 598–601. [Google Scholar]
- Park, S.M.; Toumazou, C. Low noise current-mode CMOS transimpedance amplifier for giga-bit\noptical communication. In Proceedings of the 1998 IEEE International Symposium on Circuits and Systems (Cat. No.98CH36187), Monterey, CA, USA, 31 May–3 June 1998; Volume 1, pp. 293–296. [Google Scholar]
- Gautam, G.; Shrestha, S.; Cho, S. Spectral Analysis of Rectangular, Hanning, Hamming and Kaiser Window for Digital Fir Filter. Int. J. Adv. Smart Converg. 2015, 4, 138–144. [Google Scholar] [CrossRef]
- Raza, G.A.; Alam, M.J. Design and Performance Analysis of Low Pass Fir Filter Using Hamming and Kaiser Windows. Int. J. Adv. Res. Sci. Eng. 2014, 3, 394–400. [Google Scholar]


© 2019 by the authors. Licensee MDPI, Basel, Switzerland. This article is an open access article distributed under the terms and conditions of the Creative Commons Attribution (CC BY) license (http://creativecommons.org/licenses/by/4.0/).