Validity and Reliability of a Smartphone-Based Gait Assessment in Measuring Temporal Gait Parameters: Challenges and Recommendations

 , ,
, ,  and
and
Abstract
1. Introduction
2. Materials and Methods
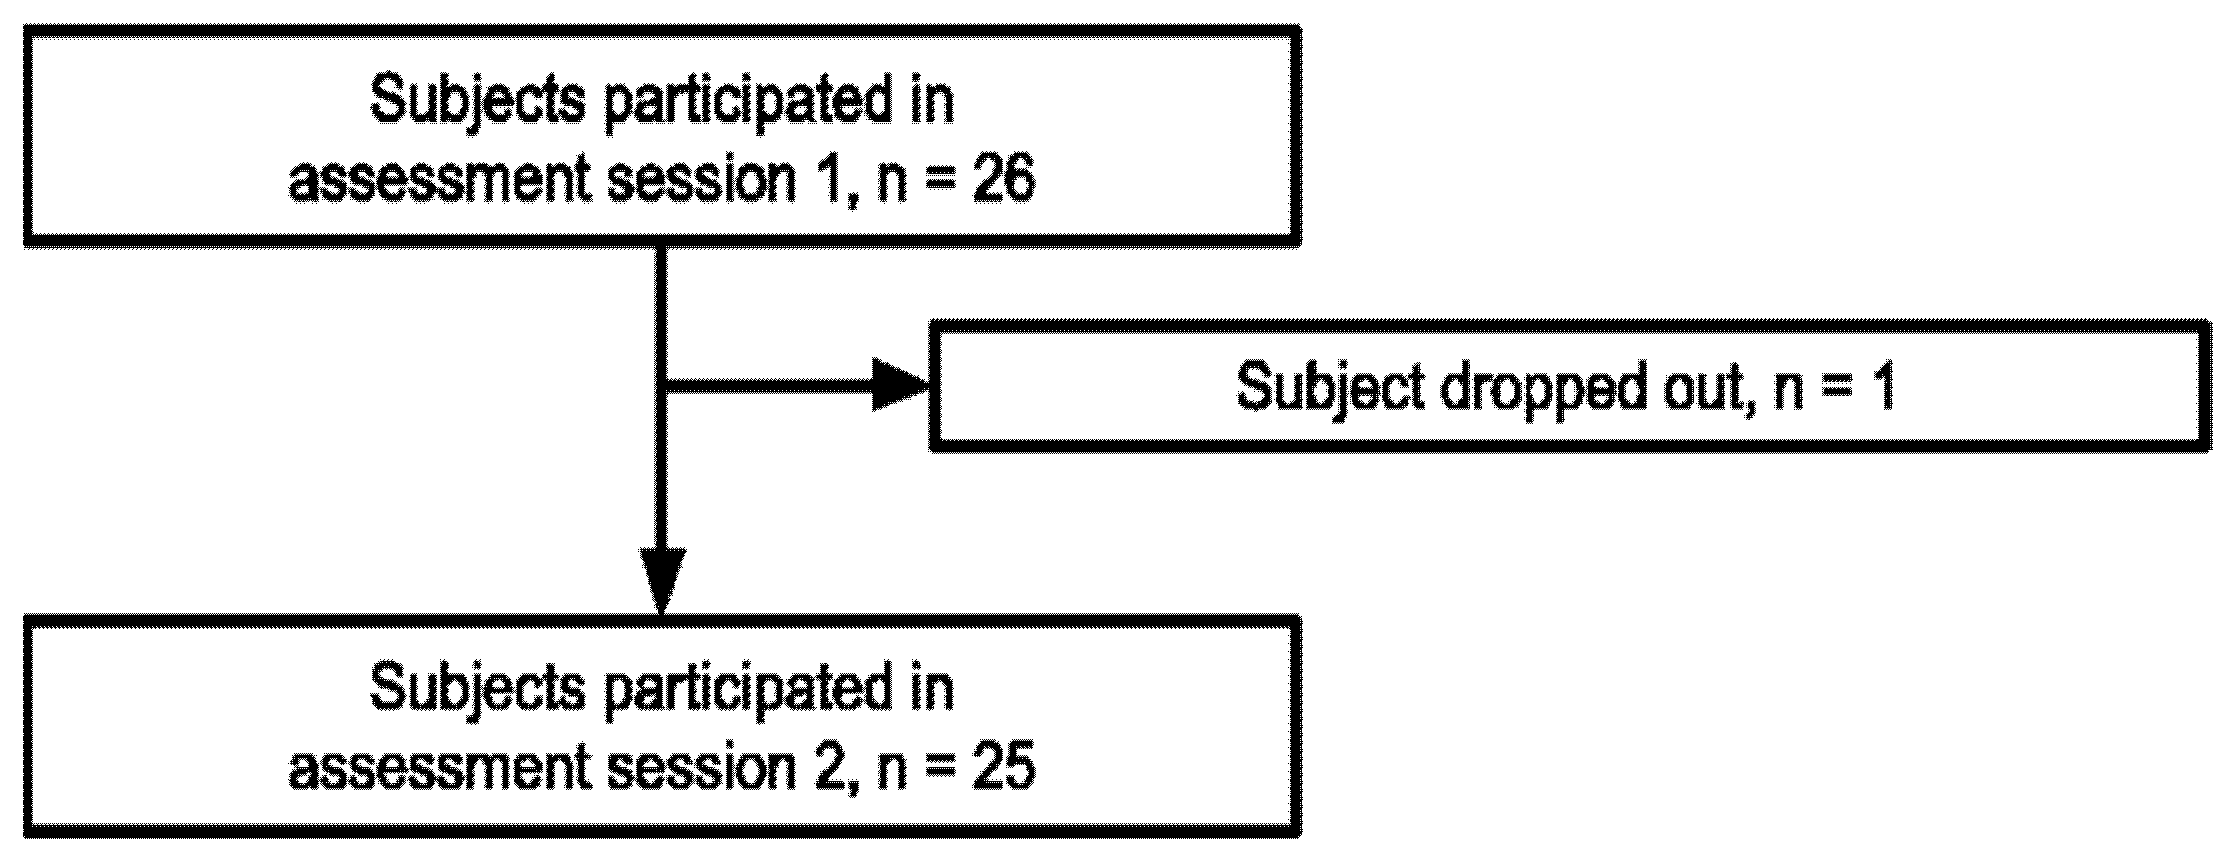
2.1. Participants
2.2. Experimental Procedure
2.3. VICON Motion Capture System
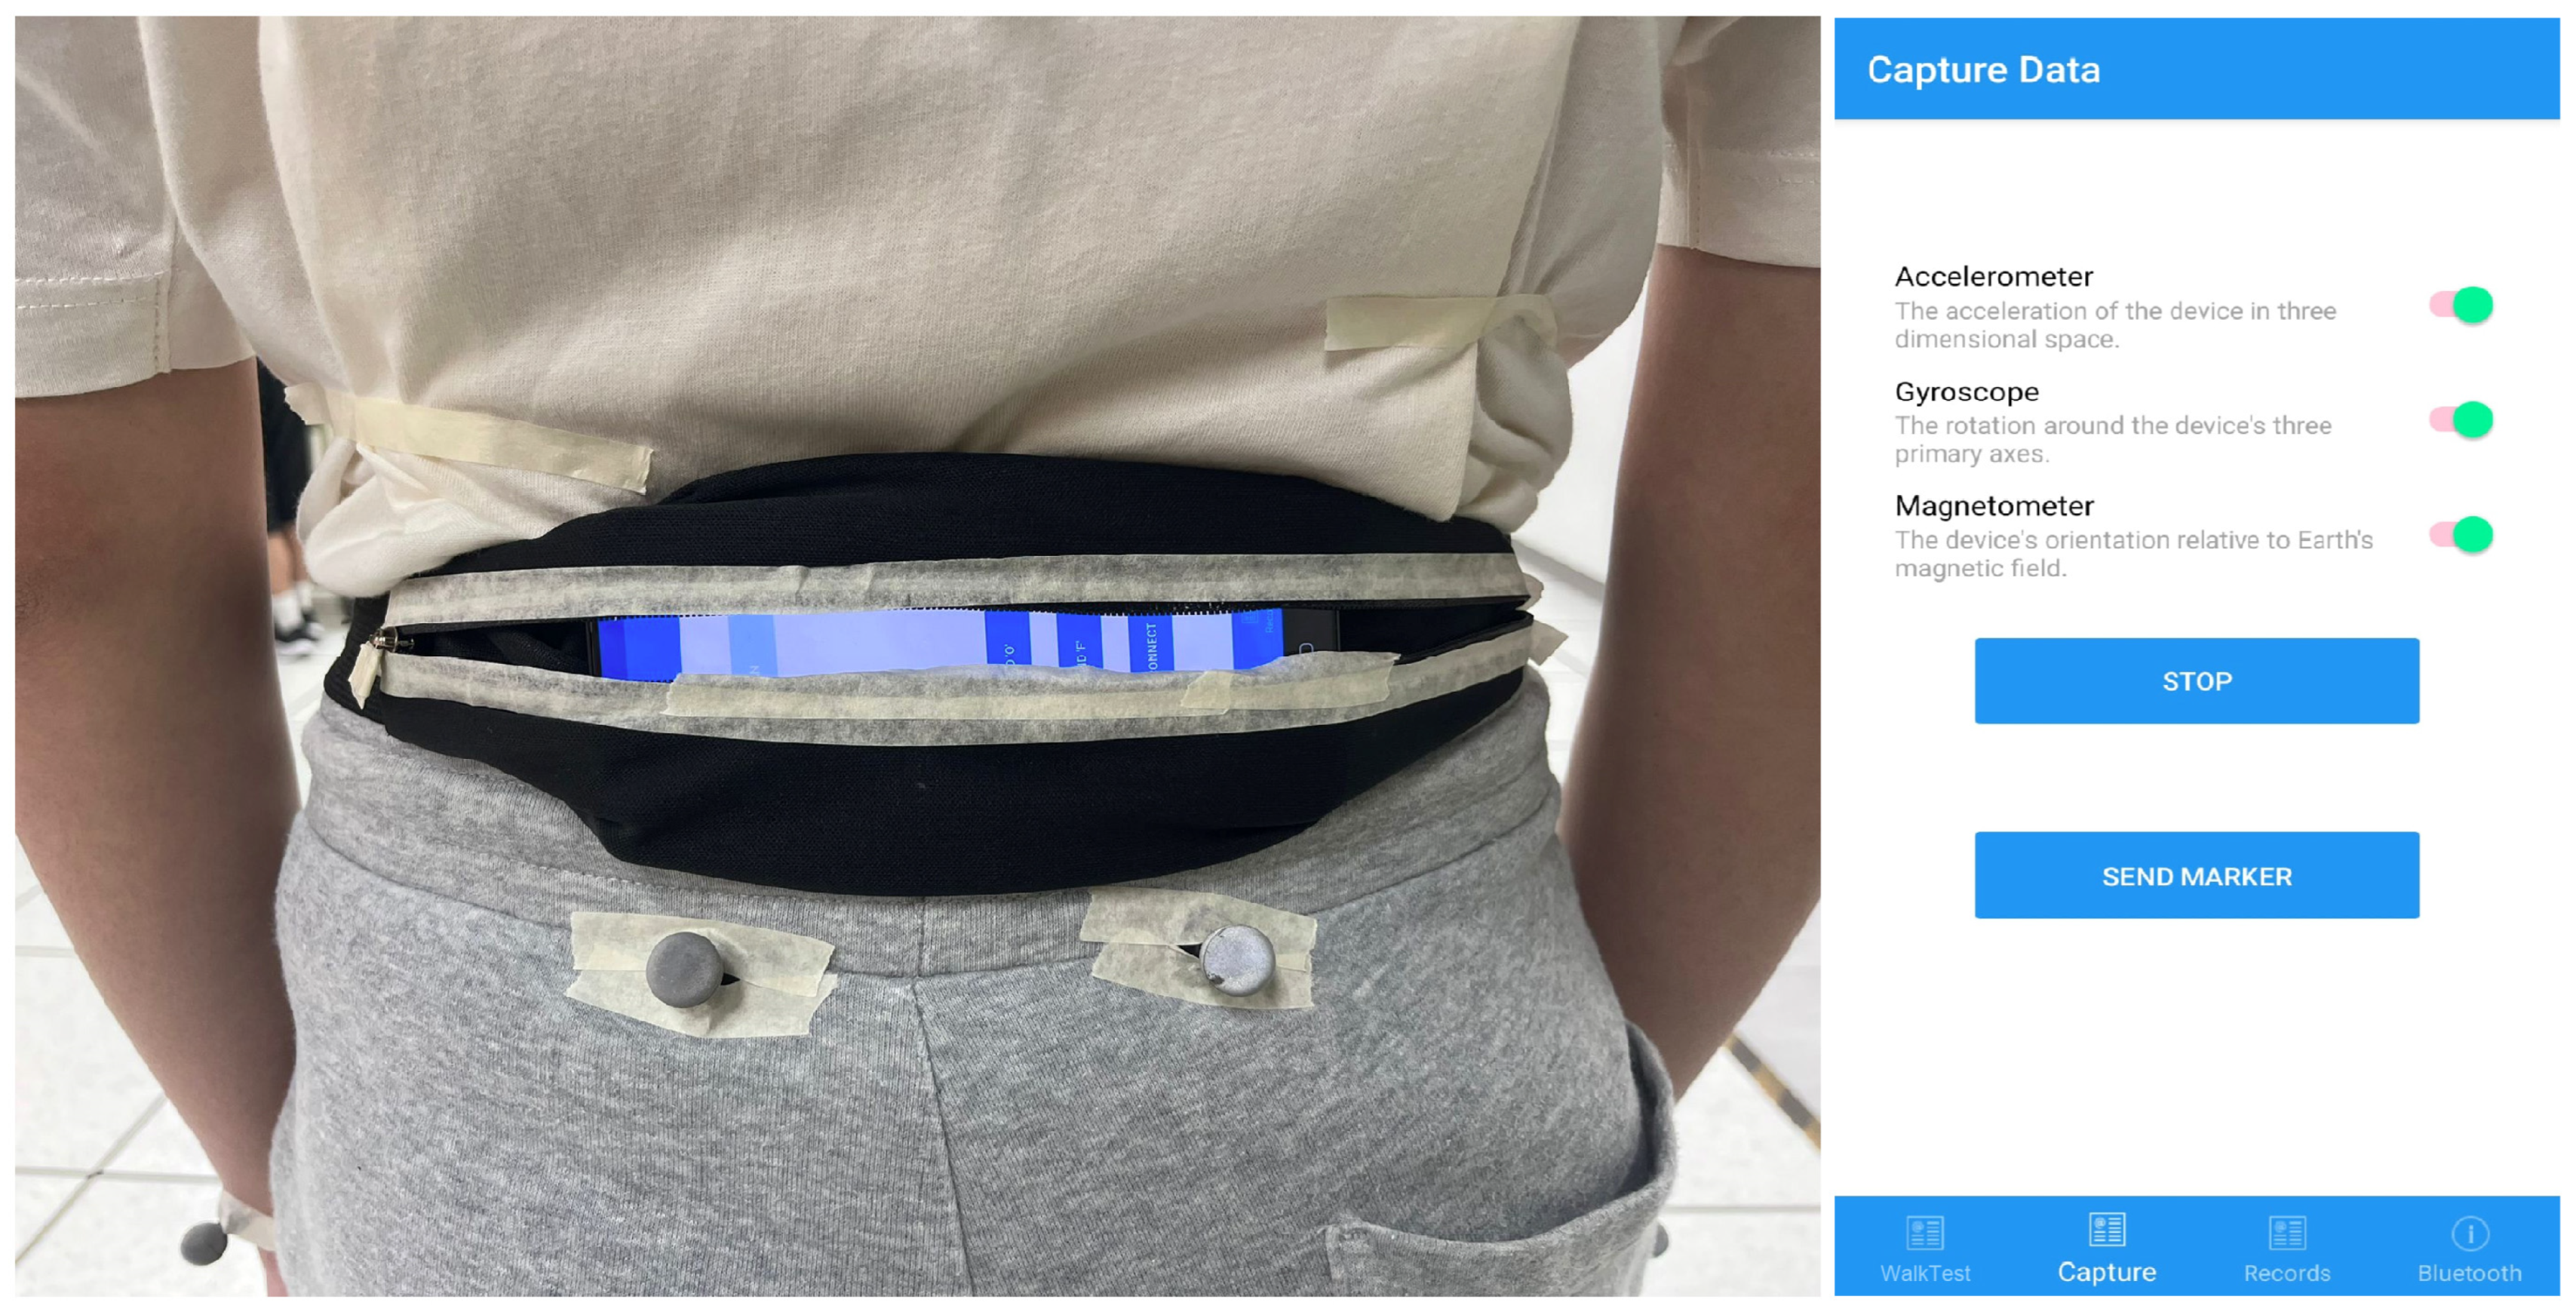
2.4. Smartphone-Based Gait Assessment
2.5. Data Processing
2.5.1. VICON Data
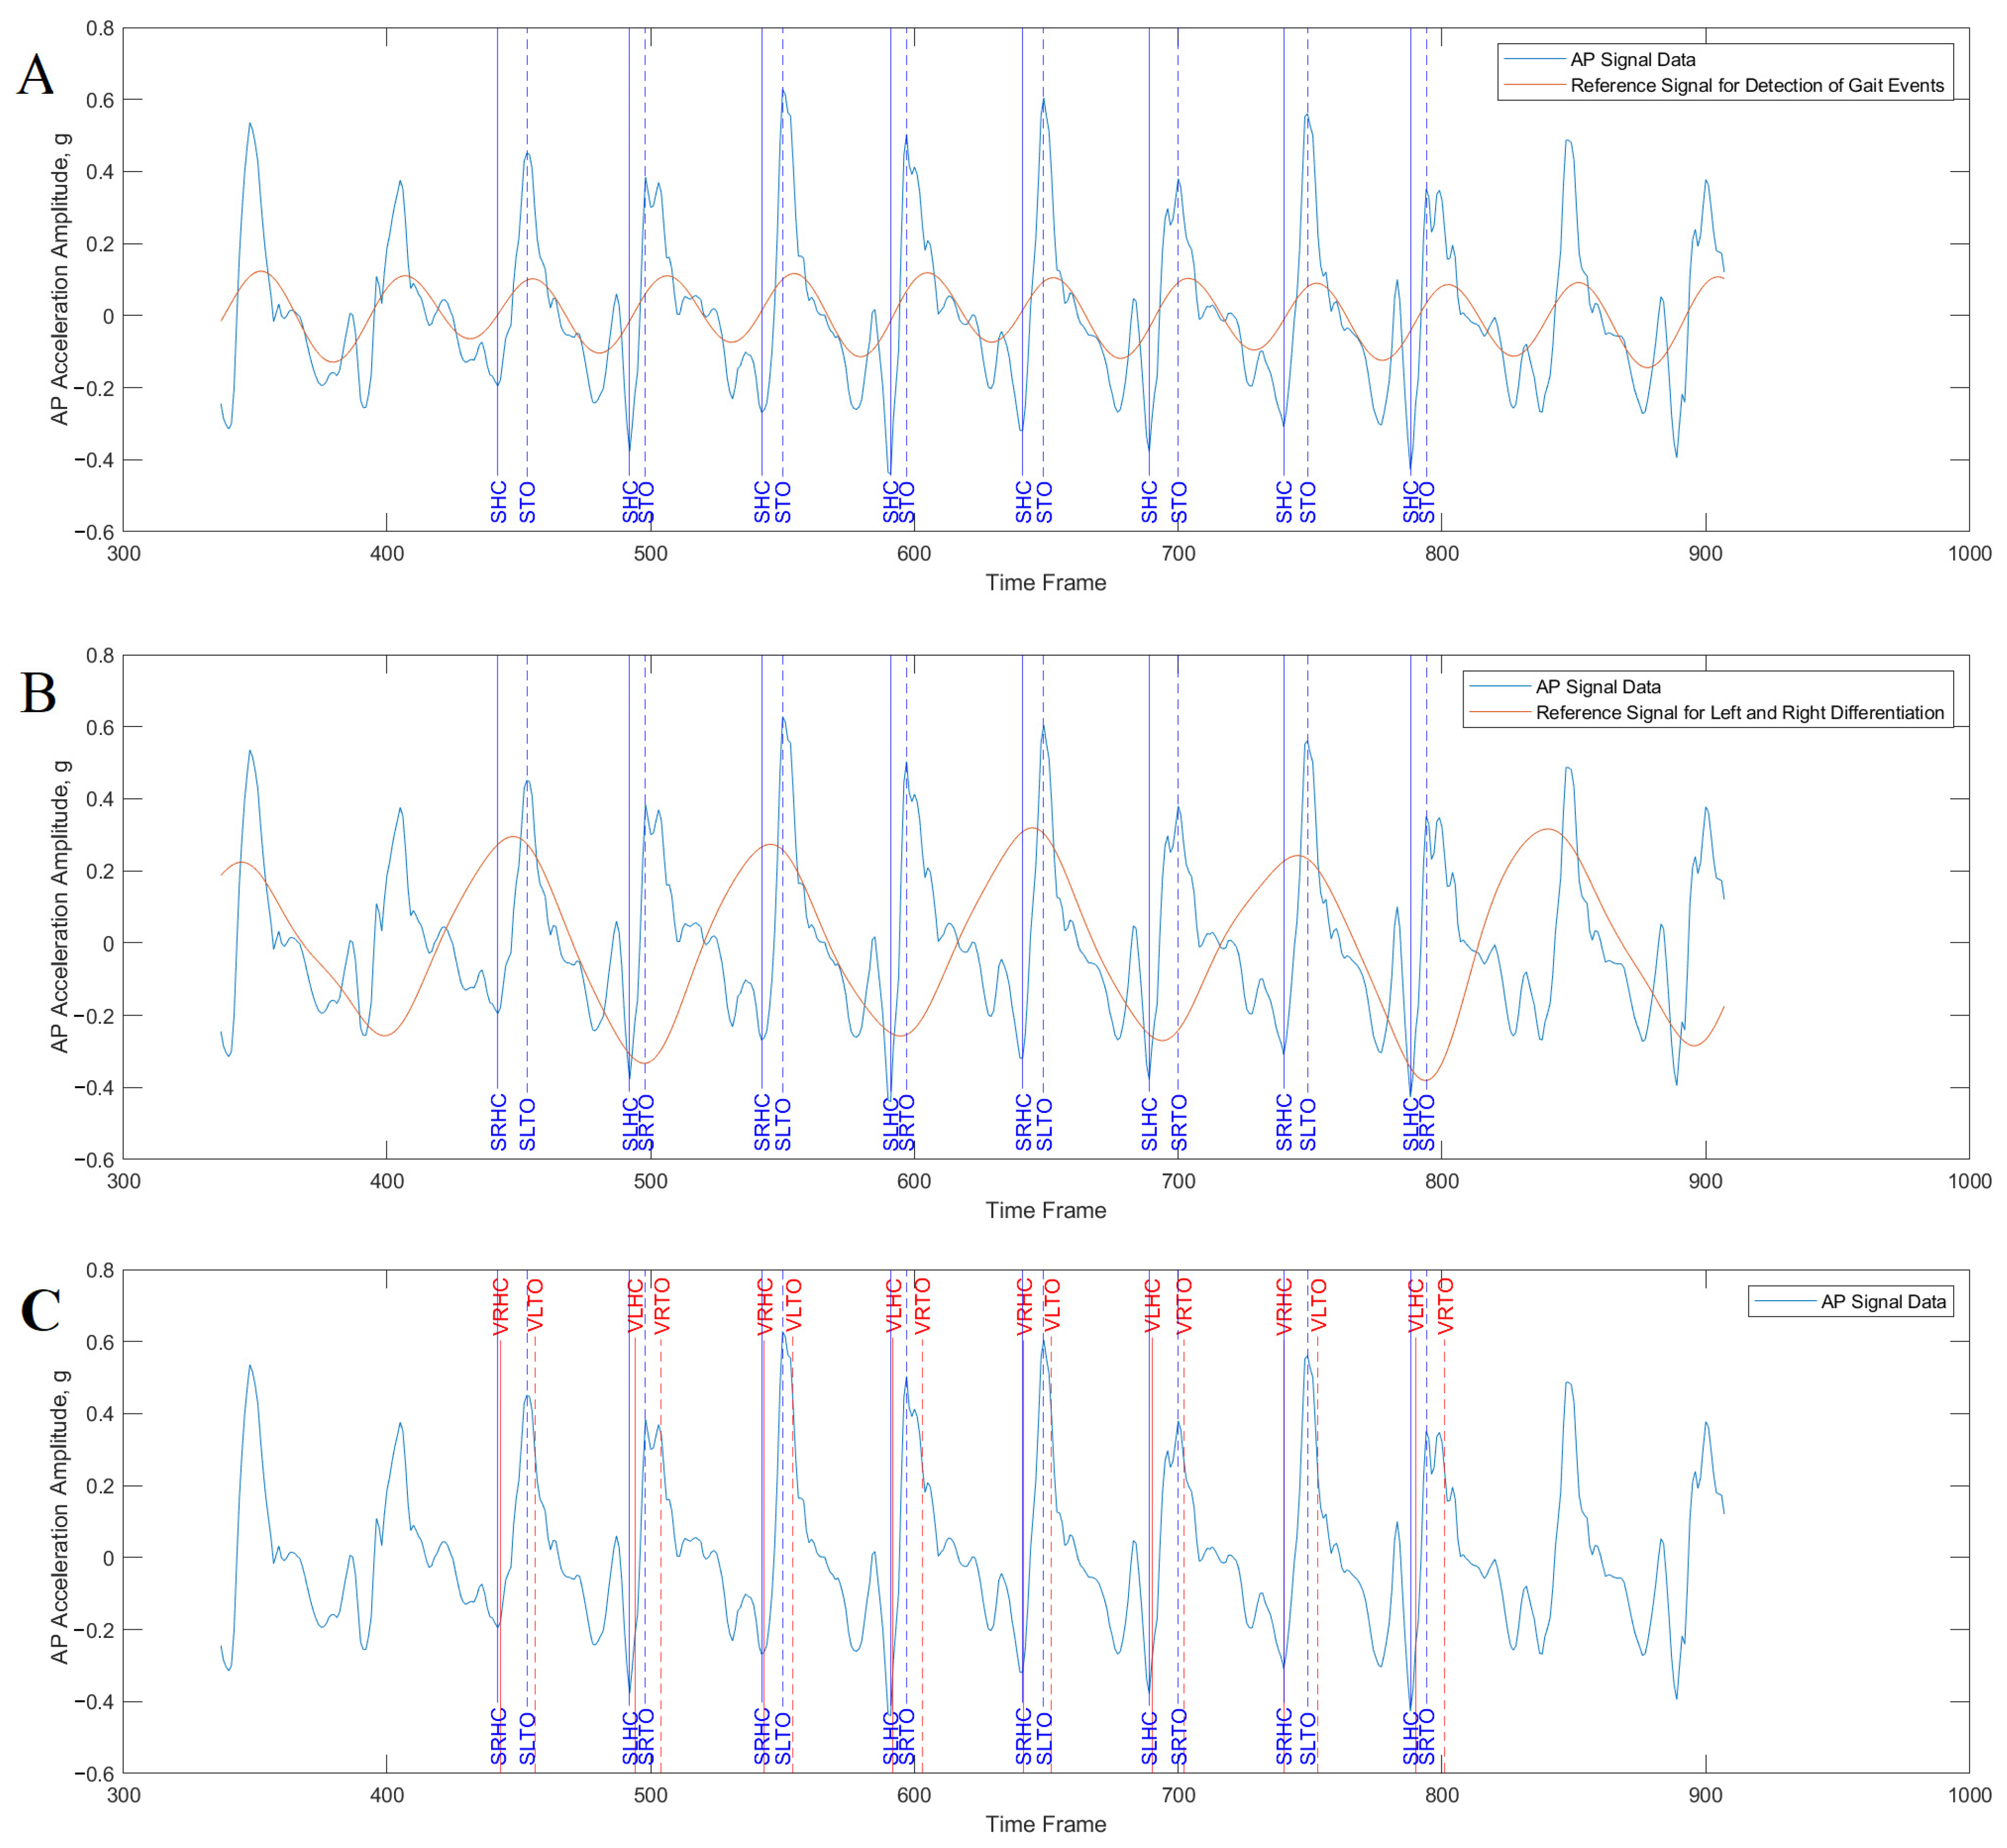
2.5.2. Smartphone Data
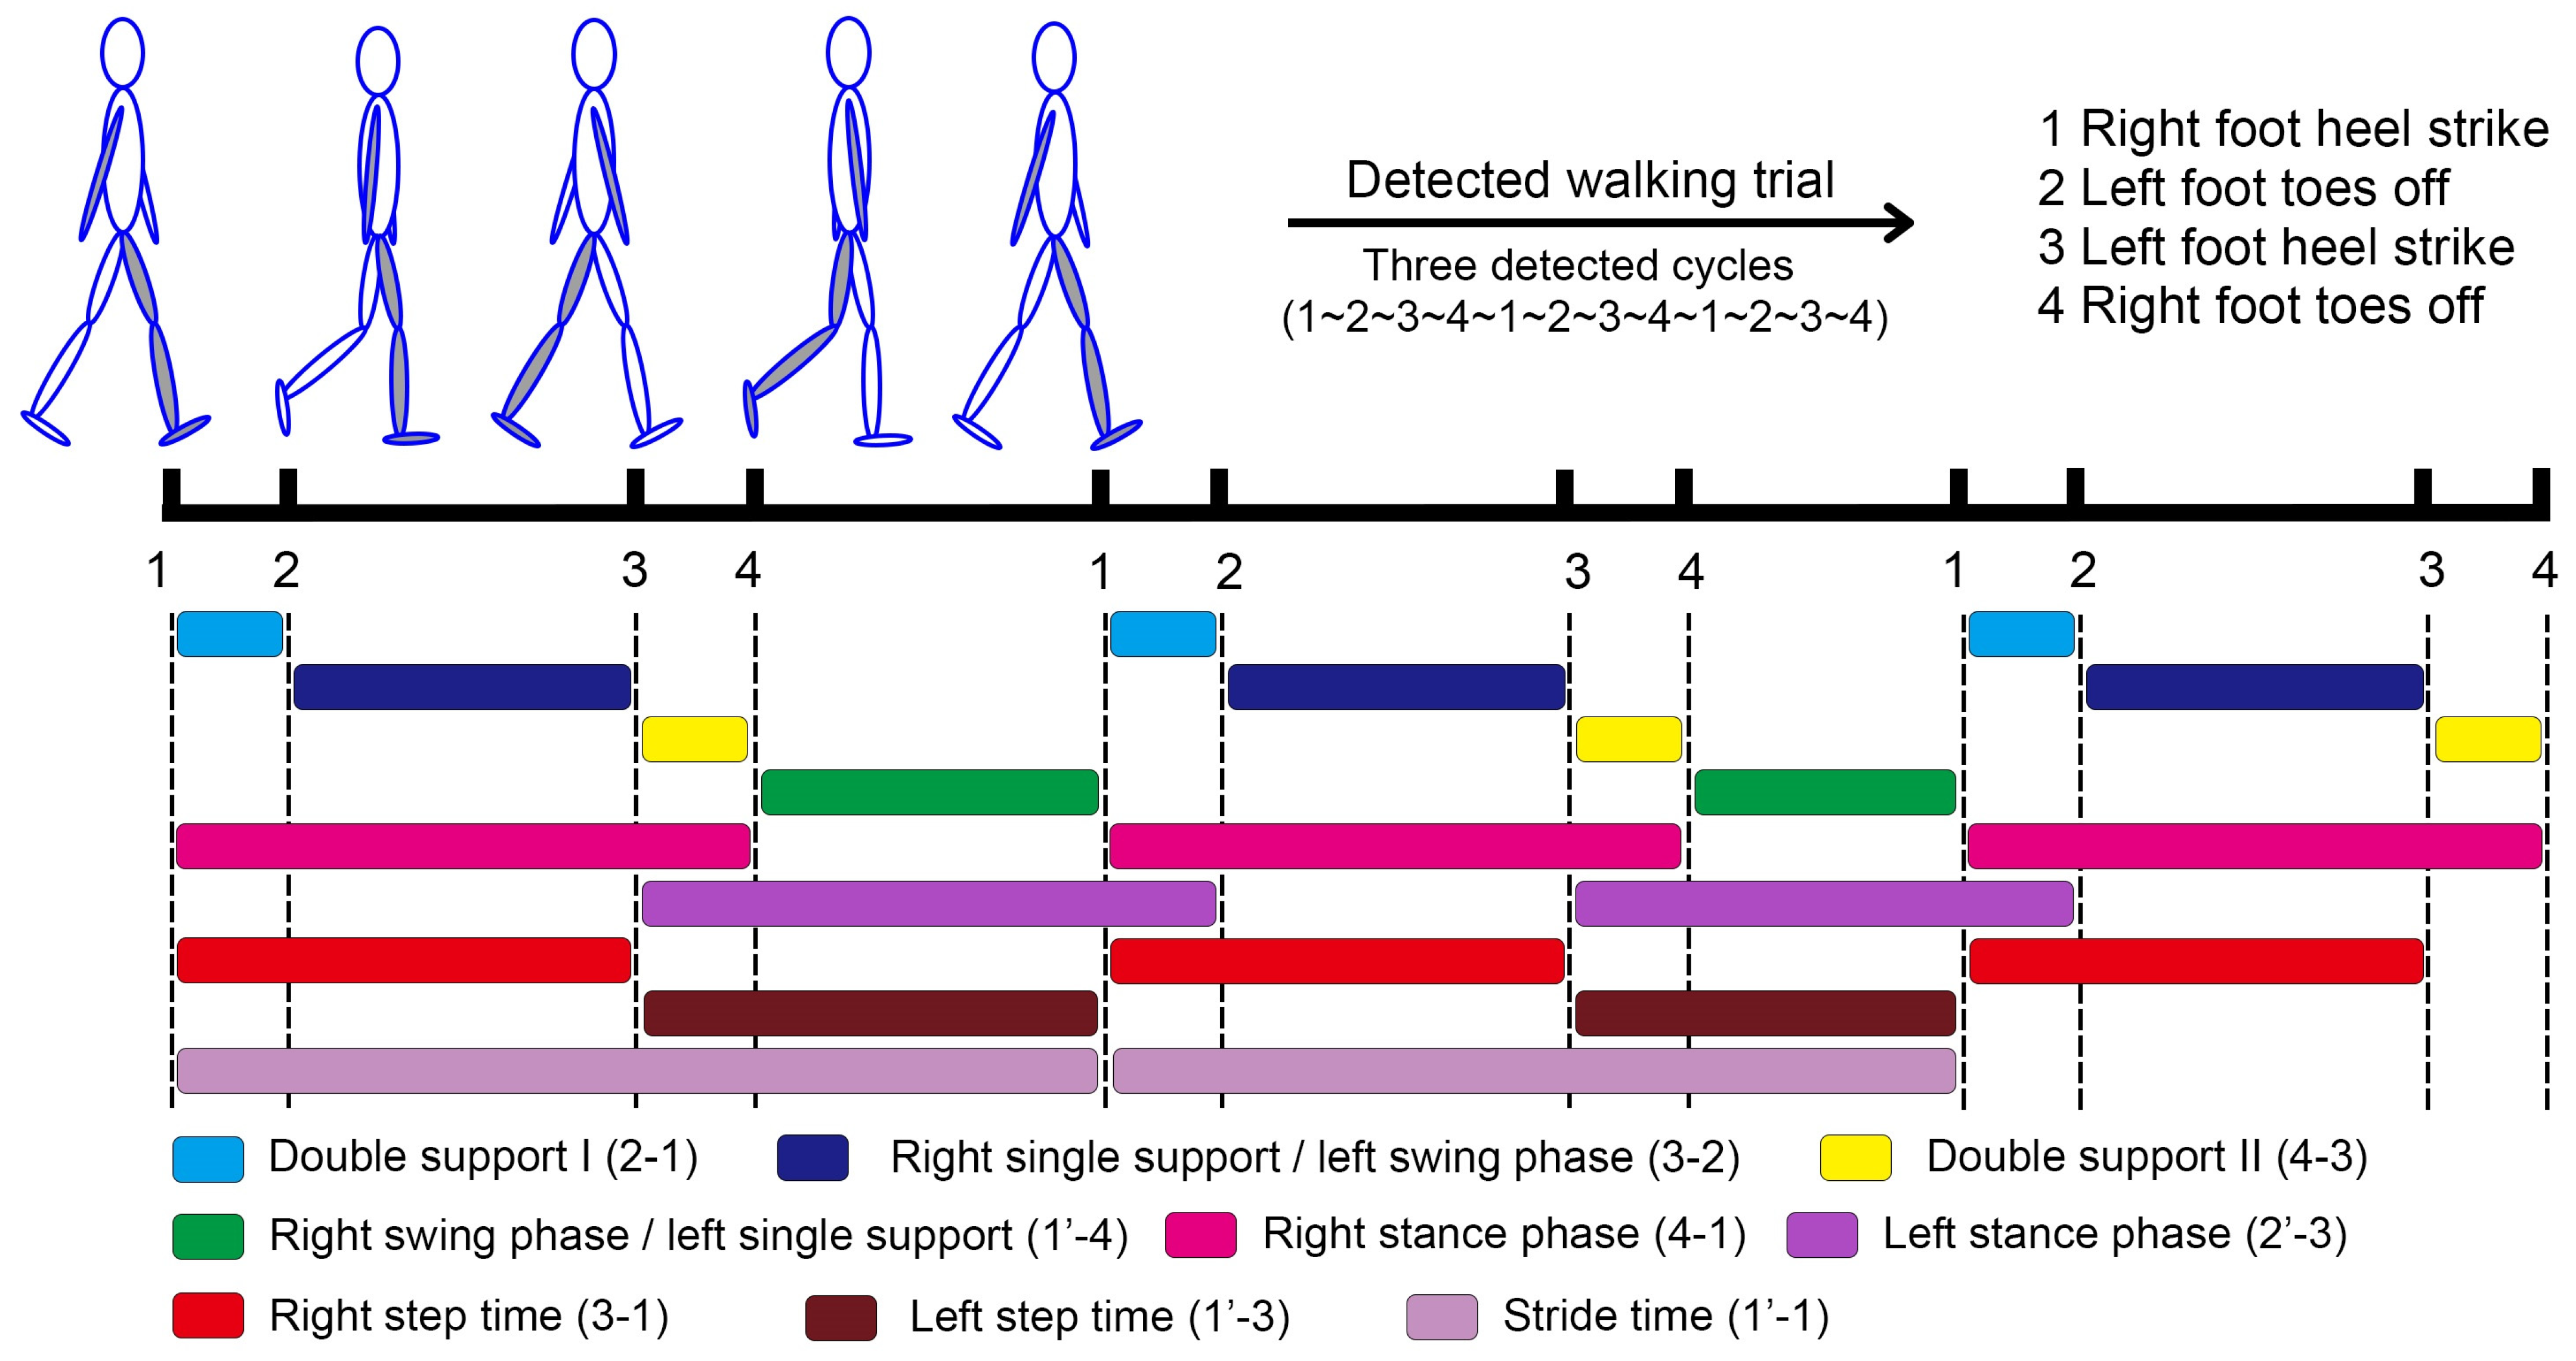
2.5.3. Generating Temporal Parameters
2.6. Statistical Analysis
3. Results
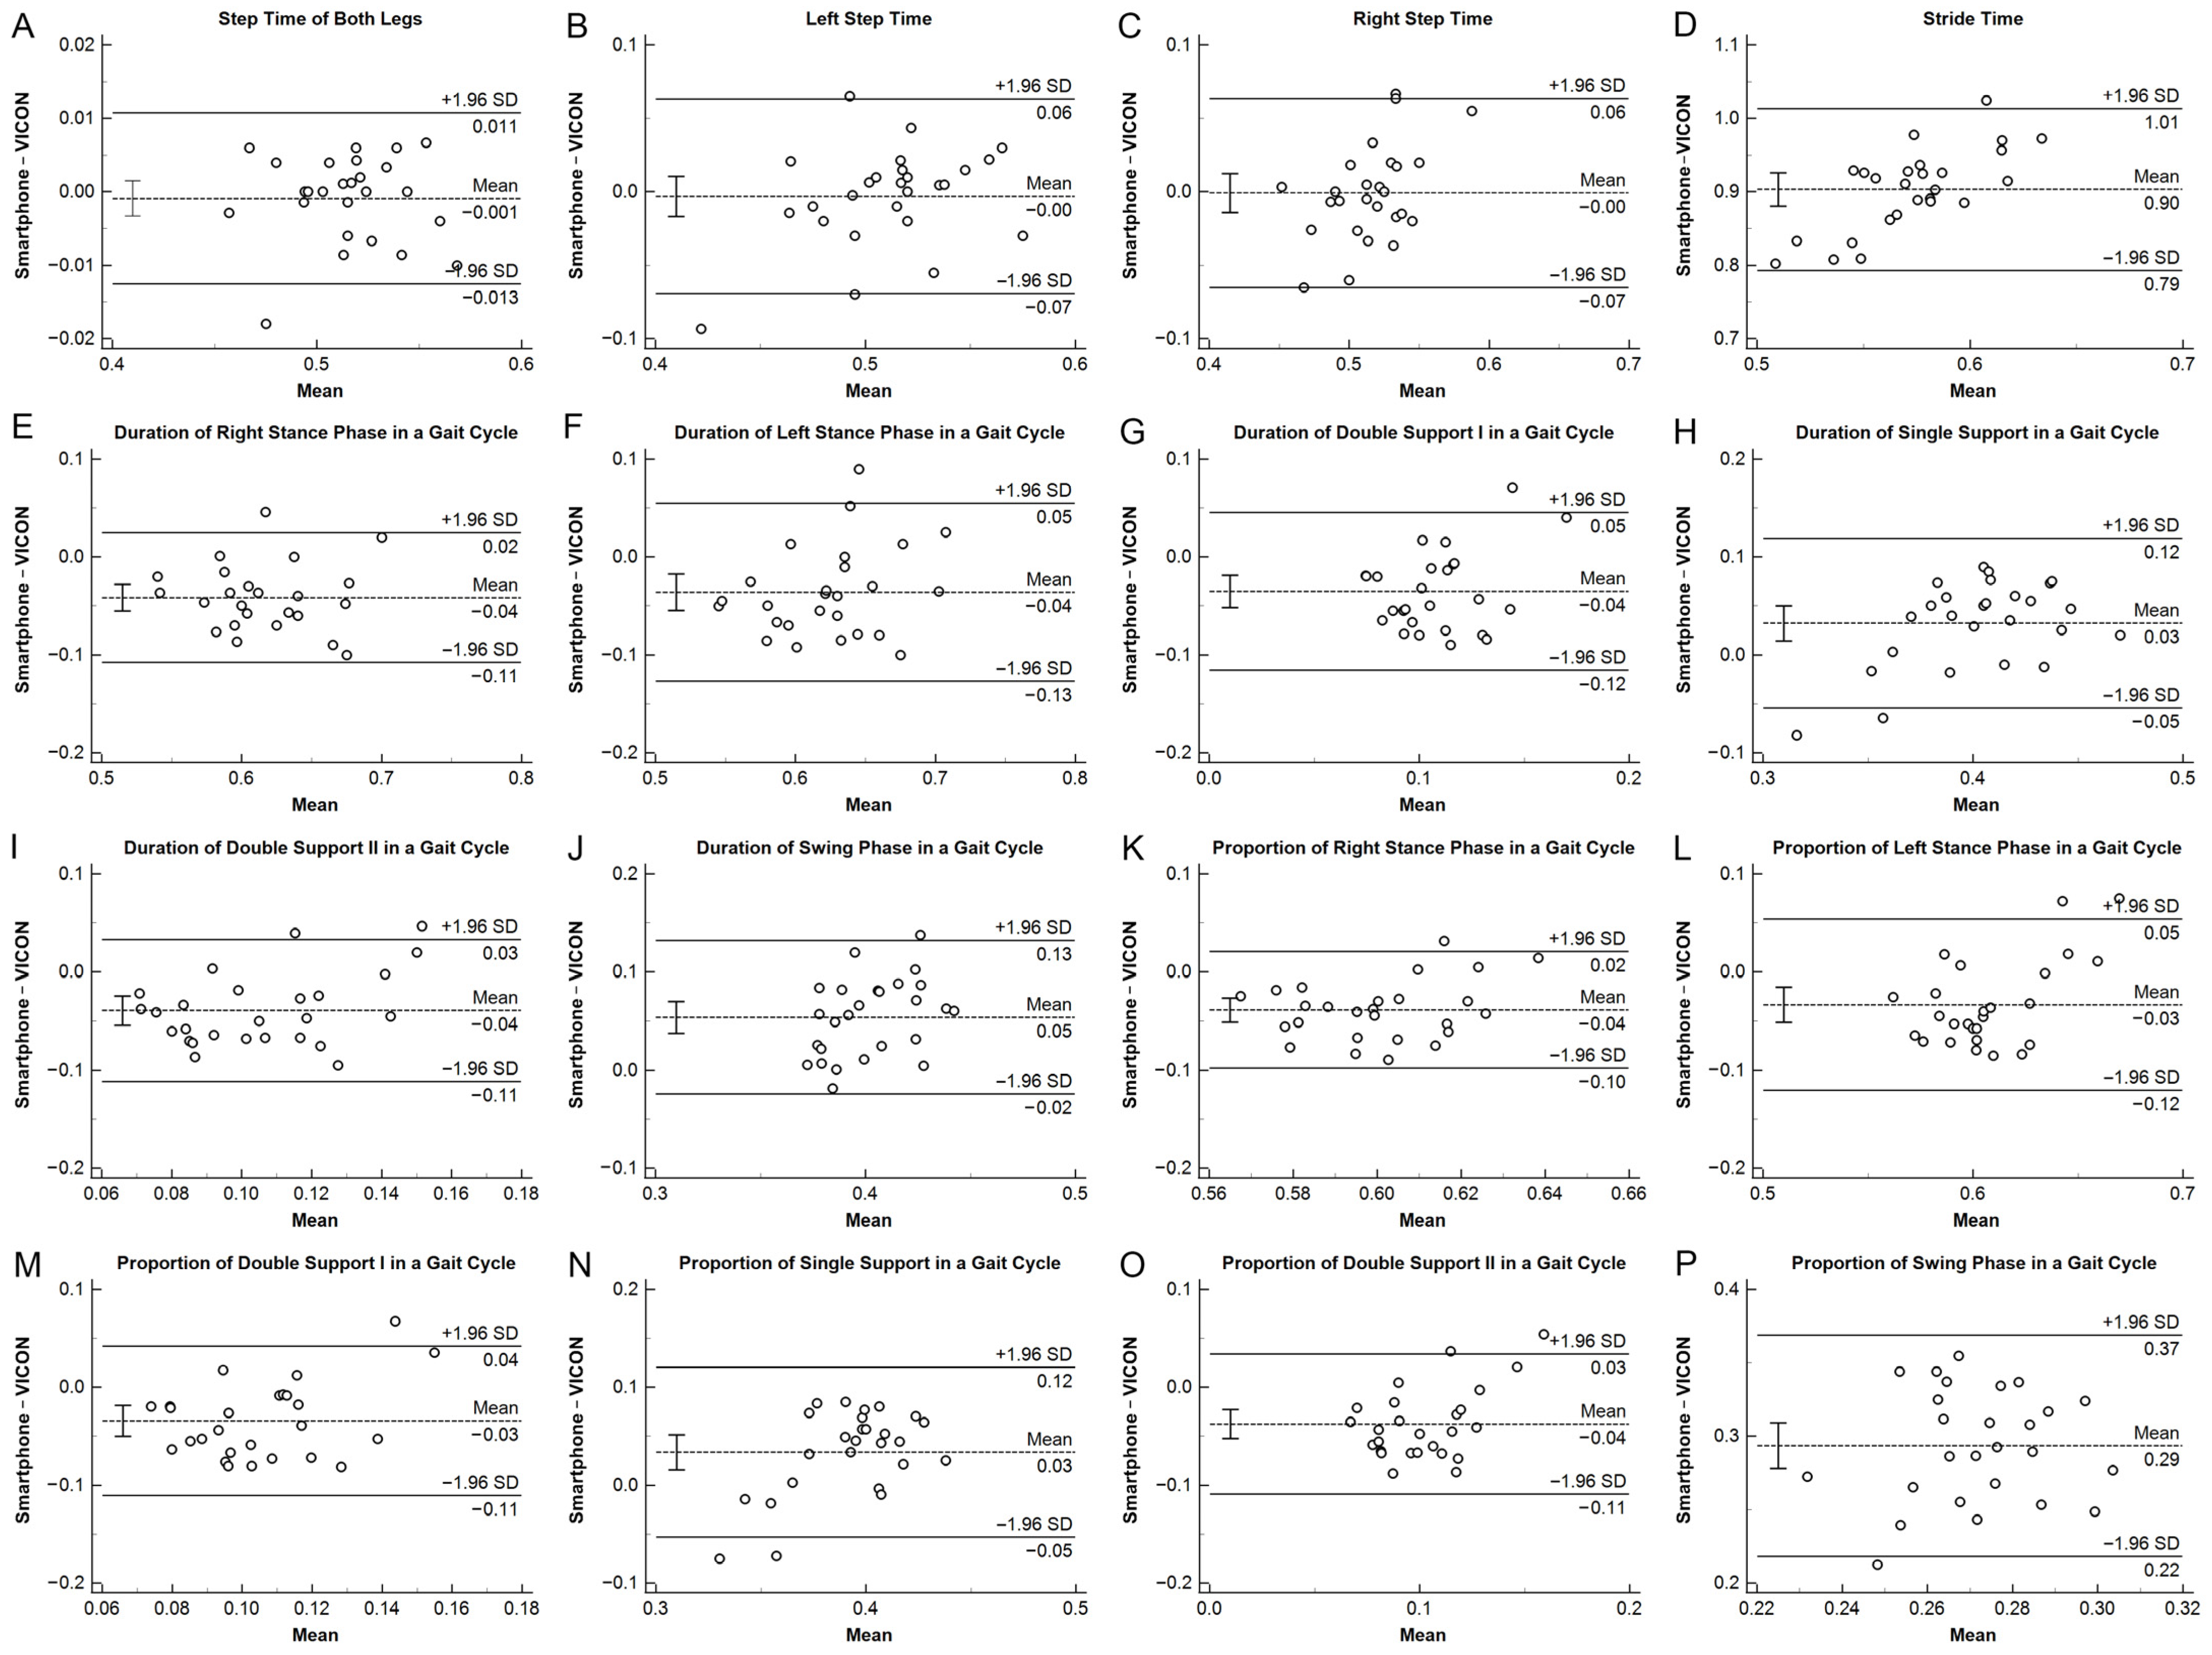
3.1. Validity
3.2. Reliability
4. Discussion
4.1. Inaccuracy in Toes-off-Derived Gait Parameters
4.2. A Higher Step Count Is Associated with Better Validity
4.3. Gait Phases with Shorter Durations Is Associated with Worse Validity
4.4. Inaccuracy in Proportion Parameters
4.5. Clinical Implications and Future Direction
4.6. Limitations
5. Conclusions
Supplementary Materials
Author Contributions
Funding
Institutional Review Board Statement
Informed Consent Statement
Data Availability Statement
Conflicts of Interest
References
- Clark, D.J. Automaticity of walking: Functional significance, mechanisms, measurement and rehabilitation strategies. Front. Hum. Neurosci. 2015, 9, 246. [Google Scholar] [CrossRef]
- Muren, M.A.; Hütler, M.; Hooper, J. Functional capacity and health-related quality of life in individuals post stroke. Top. Stroke Rehabil. 2008, 15, 51–58. [Google Scholar] [CrossRef] [PubMed]
- Hallqvist, C.; Grönstedt, H.; Arvidsson, L. Gait, falls, cognitive function, and health-related quality of life after shunt-treated idiopathic normal pressure hydrocephalus—A single-center study. Acta Neurochir. 2022, 164, 2367–2373. [Google Scholar] [CrossRef] [PubMed]
- Whittle, M.W. Clinical gait analysis: A review. Hum. Mov. Sci. 1996, 15, 369–387. [Google Scholar] [CrossRef]
- Wren, T.A.L.; Gorton, G.E.; Õunpuu, S.; Tucker, C.A. Efficacy of clinical gait analysis: A systematic review. Gait Posture 2011, 34, 149–153. [Google Scholar] [CrossRef]
- Jarchi, D.; Pope, J.; Lee, T.K.M.; Tamjidi, L.; Mirzaei, A.; Sanei, S. A Review on Accelerometry-Based Gait Analysis and Emerging Clinical Applications. IEEE Rev. Biomed. Eng. 2018, 11, 177–194. [Google Scholar] [CrossRef] [PubMed]
- Cicirelli, G.; Impedovo, D.; Dentamaro, V.; Marani, R.; Pirlo, G.; D’Orazio, T.R. Human Gait Analysis in Neurodegenerative Diseases: A Review. IEEE J. Biomed. Health Inform. 2022, 26, 229–242. [Google Scholar] [CrossRef]
- Faccioli, S.; Cavalagli, A.; Falocci, N.; Mangano, G.; Sanfilippo, I.; Sassi, S. Gait analysis patterns and rehabilitative interventions to improve gait in persons with hereditary spastic paraplegia: A systematic review and meta-analysis. Front. Neurol. 2023, 14, 1256392. [Google Scholar] [CrossRef]
- Byun, S.; Han, J.W.; Kim, T.H.; Kim, K.W. Test-Retest Reliability and Concurrent Validity of a Single Tri-Axial Accelerometer-Based Gait Analysis in Older Adults with Normal Cognition. PLoS ONE 2016, 11, e0158956. [Google Scholar] [CrossRef]
- Mielke, M.M.; Roberts, R.O.; Savica, R.; Cha, R.; Drubach, D.I.; Christianson, T.; Pankratz, V.S.; Geda, Y.E.; Machulda, M.M.; Ivnik, R.J.; et al. Assessing the Temporal Relationship Between Cognition and Gait: Slow Gait Predicts Cognitive Decline in the Mayo Clinic Study of Aging. J. Gerontol. Ser. A 2013, 68, 929–937. [Google Scholar] [CrossRef]
- Chen, X.; Liao, S.; Cao, S.; Wu, D.; Zhang, X. An Acceleration-Based Gait Assessment Method for Children with Cerebral Palsy. Sensors 2017, 17, 1002. [Google Scholar] [CrossRef]
- Wren, T.A.L.; Tucker, C.A.; Rethlefsen, S.A.; Gorton, G.E.; Õunpuu, S. Clinical efficacy of instrumented gait analysis: Systematic review 2020 update. Gait Posture 2020, 80, 274–279. [Google Scholar] [CrossRef]
- van Schooten, K.S.; Pijnappels, M.; Rispens, S.M.; Elders, P.J.M.; Lips, P.; van Dieën, J.H. Ambulatory Fall-Risk Assessment: Amount and Quality of Daily-Life Gait Predict Falls in Older Adults. J. Gerontol. Ser. A 2015, 70, 608–615. [Google Scholar] [CrossRef]
- Montero-Odasso, M.; van der Velde, N.; Martin, F.C.; Petrovic, M.; Tan, M.P.; Ryg, J.; Aguilar-Navarro, S.; Alexander, N.B.; Becker, C.; Blain, H.; et al. World guidelines for falls prevention and management for older adults: A global initiative. Age Ageing 2022, 51, afac205. [Google Scholar] [CrossRef]
- Dye, D.C.; Eakman, A.M.; Bolton, K.M. Assessing the Validity of the Dynamic Gait Index in a Balance Disorders Clinic: An Application of Rasch Analysis. Phys. Ther. 2013, 93, 809–818. [Google Scholar] [CrossRef]
- Zhao, Y.; Yu, L.; Fan, X.; Pang, M.Y.C.; Tsui, K.-L.; Wang, H. Design of a Sensor-Technology-Augmented Gait and Balance Monitoring System for Community-Dwelling Older Adults in Hong Kong: A Pilot Feasibility Study. Sensors 2023, 23, 8008. [Google Scholar] [CrossRef]
- Bugané, F.; Benedetti, M.G.; Casadio, G.; Attala, S.; Biagi, F.; Manca, M.; Leardini, A. Estimation of spatial-temporal gait parameters in level walking based on a single accelerometer: Validation on normal subjects by standard gait analysis. Comput. Methods Programs Biomed. 2012, 108, 129–137. [Google Scholar] [CrossRef]
- Dong, W.; Yang, L.; Gravina, R.; Fortino, G. Soft Wrist-Worn Multi-Functional Sensor Array for Real-Time Hand Gesture Recognition. IEEE Sens. J. 2022, 22, 17505–17514. [Google Scholar] [CrossRef]
- Prieto-Avalos, G.; Cruz-Ramos, N.A.; Alor-Hernández, G.; Sánchez-Cervantes, J.L.; Rodríguez-Mazahua, L.; Guarneros-Nolasco, L.R. Wearable Devices for Physical Monitoring of Heart: A Review. Biosensors 2022, 12, 292. [Google Scholar] [CrossRef]
- Babu, M.; Lautman, Z.; Lin, X.; Sobota, M.H.B.; Snyder, M.P. Wearable Devices: Implications for Precision Medicine and the Future of Health Care. Annu. Rev. Med. 2024, 75, 401–415. [Google Scholar] [CrossRef]
- Chen, S.; Lach, J.; Lo, B.; Yang, G.Z. Toward Pervasive Gait Analysis with Wearable Sensors: A Systematic Review. IEEE J. Biomed. Health Inform. 2016, 20, 1521–1537. [Google Scholar] [CrossRef]
- Cho, Y.-S.; Jang, S.-H.; Cho, J.-S.; Kim, M.-J.; Lee, H.D.; Lee, S.Y.; Moon, S.-B. Evaluation of Validity and Reliability of Inertial Measurement Unit-Based Gait Analysis Systems. Ann. Rehabil. Med. 2018, 42, 872–883. [Google Scholar] [CrossRef]
- Patel, G.; Mullerpatan, R.; Agarwal, B.; Shetty, T.; Ojha, R.; Shaikh-Mohammed, J.; Sujatha, S. Validation of wearable inertial sensor-based gait analysis system for measurement of spatiotemporal parameters and lower extremity joint kinematics in sagittal plane. Proc. Inst. Mech. Eng. Part H J. Eng. Med. 2022, 236, 686–696. [Google Scholar] [CrossRef] [PubMed]
- Pacher, L.; Carcreff, L.; Armand, S.; Chatellier, C.; Vauzelle, R.; Fradet, L. Gait kinematics based on inertial measurement units with the sensor-to-segment calibration and multibody optimization adapted to the patient’s motor capacities, a pilot study. Gait Posture 2024, 108, 275–281. [Google Scholar] [CrossRef]
- Yoon, D.H.; Kim, J.-H.; Lee, K.; Cho, J.-S.; Jang, S.-H.; Lee, S.-U. Inertial measurement unit sensor-based gait analysis in adults and older adults: A cross-sectional study. Gait Posture 2024, 107, 212–217. [Google Scholar] [CrossRef] [PubMed]
- Arshad, M.Z.; Jamsrandorj, A.; Kim, J.; Mun, K.-R. Gait Events Prediction Using Hybrid CNN-RNN-Based Deep Learning Models through a Single Waist-Worn Wearable Sensor. Sensors 2022, 22, 8226. [Google Scholar] [CrossRef]
- González, R.C.; López, A.M.; Rodriguez-Uría, J.; Alvarez, D.; Alvarez, J.C. Real-time gait event detection for normal subjects from lower trunk accelerations. Gait Posture 2010, 31, 322–325. [Google Scholar] [CrossRef] [PubMed]
- Kosse, N.M.; Caljouw, S.; Vervoort, D.; Vuillerme, N.; Lamoth, C.J.C. Validity and Reliability of Gait and Postural Control Analysis Using the Tri-axial Accelerometer of the iPod Touch. Ann. Biomed. Eng. 2015, 43, 1935–1946. [Google Scholar] [CrossRef]
- Silsupadol, P.; Teja, K.; Lugade, V. Reliability and validity of a smartphone-based assessment of gait parameters across walking speed and smartphone locations: Body, bag, belt, hand, and pocket. Gait Posture 2017, 58, 516–522. [Google Scholar] [CrossRef]
- Kirk, C.; Kuderle, A.; Mico-Amigo, M.E.; Bonci, T.; Paraschiv-Ionescu, A.; Ullrich, M.; Soltani, A.; Gazit, E.; Salis, F.; Alcock, L.; et al. Mobilise-D insights to estimate real-world walking speed in multiple conditions with a wearable device. Sci. Rep. 2024, 14, 1754. [Google Scholar] [CrossRef]
- Brognara, L. Gait Assessment Using Smartphone Applications in Older Adults: A Scoping Review. Geriatrics 2024, 9, 95. [Google Scholar] [CrossRef] [PubMed]
- van Schooten, K.S.; Pijnappels, M.; Rispens, S.M.; Elders, P.J.; Lips, P.; Daffertshofer, A.; Beek, P.J.; van Dieen, J.H. Daily-Life Gait Quality as Predictor of Falls in Older People: A 1-Year Prospective Cohort Study. PLoS ONE 2016, 11, e0158623. [Google Scholar] [CrossRef] [PubMed]
- Mohammed, Z.; Elfadel, I.M.; Rasras, M. Monolithic Multi Degree of Freedom (MDoF) Capacitive MEMS Accelerometers. Micromachines 2018, 9, 602. [Google Scholar] [CrossRef]
- Grouios, G.; Ziagkas, E.; Loukovitis, A.; Chatzinikolaou, K.; Koidou, E. Accelerometers in Our Pocket: Does Smartphone Accelerometer Technology Provide Accurate Data? Sensors 2023, 23, 192. [Google Scholar] [CrossRef] [PubMed]
- Zijlstra, W.; Hof, A.L. Displacement of the pelvis during human walking: Experimental data and model predictions. Gait Posture 1997, 6, 249–262. [Google Scholar] [CrossRef]
- Rantalainen, T.; Karavirta, L.; Pirkola, H.; Rantanen, T.; Linnamo, V. Gait Variability Using Waist- and Ankle-Worn Inertial Measurement Units in Healthy Older Adults. Sensors 2020, 20, 2858. [Google Scholar] [CrossRef] [PubMed]
- Tao, S.; Zhang, H.; Kong, L.; Sun, Y.; Zhao, J. Validation of gait analysis using smartphones: Reliability and validity. Digit. Health 2024, 10, 20552076241257054. [Google Scholar] [CrossRef]
- Christensen, J.C.; Stanley, E.C.; Oro, E.G.; Carlson, H.B.; Naveh, Y.Y.; Shalita, R.; Teitz, L.S. The validity and reliability of the OneStep smartphone application under various gait conditions in healthy adults with feasibility in clinical practice. J. Orthop. Surg. Res. 2022, 17, 417. [Google Scholar] [CrossRef]
- Marom, P.; Brik, M.; Agay, N.; Dankner, R.; Katzir, Z.; Keshet, N.; Doron, D. The Reliability and Validity of the OneStep Smartphone Application for Gait Analysis among Patients Undergoing Rehabilitation for Unilateral Lower Limb Disability. Sensors 2024, 24, 3594. [Google Scholar] [CrossRef]
- Baltadjieva, R.; Giladi, N.; Gruendlinger, L.; Peretz, C.; Hausdorff, J.M. Marked alterations in the gait timing and rhythmicity of patients with de novo Parkinson’s disease. Eur. J. Neurosci. 2006, 24, 1815–1820. [Google Scholar] [CrossRef]
- Modarresi, S.; Divine, A.; Grahn, J.A.; Overend, T.J.; Hunter, S.W. Gait parameters and characteristics associated with increased risk of falls in people with dementia: A systematic review. Int. Psychogeriatr. 2019, 31, 1287–1303. [Google Scholar] [CrossRef] [PubMed]
- Springer, S.; Yogev Seligmann, G. Validity of the Kinect for Gait Assessment: A Focused Review. Sensors 2016, 16, 194. [Google Scholar] [CrossRef] [PubMed]
- Albert, J.A.; Owolabi, V.; Gebel, A.; Brahms, C.M.; Granacher, U.; Arnrich, B. Evaluation of the Pose Tracking Performance of the Azure Kinect and Kinect v2 for Gait Analysis in Comparison with a Gold Standard: A Pilot Study. Sensors 2020, 20, 5104. [Google Scholar] [CrossRef]
- Hockett, S.; Dunbar, S.; Williams, C.; Sturdivant, R.; Garner, B.; Rylander, J. Comparison of spatiotemporal gait parameter measurements across various emulated foot strike patterns between the Tekscan® Strideway™ pressure sensitive walkway and gold-standard marker-based motion capture. J. Biomech. 2024, 176, 112310. [Google Scholar] [CrossRef]
- Vicon. Plug-in Gait Reference Guide. Available online: https://help.vicon.com/space/Nexus216/11607059/Plug-in+Gait+Reference+Guide#Plug-inGaitReferenceGuide (accessed on 10 February 2024).
- Soaz, C.; Diepold, K. Step Detection and Parameterization for Gait Assessment Using a Single Waist-Worn Accelerometer. IEEE Trans. Biomed. Eng. 2016, 63, 933–942. [Google Scholar] [CrossRef]
- Godfrey, A.; Del Din, S.; Barry, G.; Mathers, J.C.; Rochester, L. Instrumenting gait with an accelerometer: A system and algorithm examination. Med. Eng. Phys. 2015, 37, 400–407. [Google Scholar] [CrossRef] [PubMed]
- Mikkonen, J.; Leinonen, V.; Luomajoki, H.; Kaski, D.; Kupari, S.; Tarvainen, M.; Selander, T.; Airaksinen, O. Cross-Cultural Adaptation, Reliability, and Psychophysical Validation of the Pain and Sleep Questionnaire Three-Item Index in Finnish. J. Clin. Med. 2021, 10, 4887. [Google Scholar] [CrossRef]
- Giavarina, D. Understanding Bland Altman analysis. Biochem. Med. 2015, 25, 141–151. [Google Scholar] [CrossRef] [PubMed]
- Koo, T.K.; Li, M.Y. A Guideline of Selecting and Reporting Intraclass Correlation Coefficients for Reliability Research. J. Chiropr. Med. 2016, 15, 155–163. [Google Scholar] [CrossRef]
- Kwak, S. Are Only p-Values Less Than 0.05 Significant? A p-Value Greater Than 0.05 Is Also Significant! J. Lipid Atheroscler. 2023, 12, 89–95. [Google Scholar] [CrossRef]
- De Ridder, R.; Lebleu, J.; Willems, T.; De Blaiser, C.; Detrembleur, C.; Roosen, P. Concurrent Validity of a Commercial Wireless Trunk Triaxial Accelerometer System for Gait Analysis. J. Sport Rehabil. 2019, 28, 295. [Google Scholar] [CrossRef] [PubMed]
- Abou, L.; Peters, J.; Wong, E.; Akers, R.; Dossou, M.S.; Sosnoff, J.J.; Rice, L.A. Gait and Balance Assessments using Smartphone Applications in Parkinson’s Disease: A Systematic Review. J. Med. Syst. 2021, 45, 87. [Google Scholar] [CrossRef] [PubMed]

| Parameter | Definition |
|---|---|
| Parameters Derived from the Gait Events of Heel Strike | |
| Step time of both legs | Mean time between two consecutive heel strikes of reciprocal legs for each subject. |
| Left step time | Mean time from a right heel strike to the next left heel strike for each subject. |
| Right step time | Mean time from a left heel strike to the next right heel strike for each subject. |
| Stride time | Mean time between two consecutive right heel strikes for each subject. |
| Parameters Derived from the Gait Events of Heel Strike and Toes Off | |
| Right stance phase duration | Mean time from a right heel strike to the following right toe off for each subject. |
| Left stance phase duration | Mean time from a left heel strike to the following left toes off for each subject. |
| Double support I duration | Mean time from a right heel strike to the following left toe off for each subject. |
| Right single support/Left swing phase duration | Mean time from a left toe off to the following left heel strike for each subject. |
| Double support II duration | Mean time from a left heel strike to the following right toe off for each subject. |
| Right swing phase/Left single support duration | Mean time from a right toe off to the following right heel strike for each subject. |
| Proportion Parameters | |
| Right stance phase proportion | Right stance phase duration divided by stride time |
| Left stance phase proportion | Left stance phase duration divided by stride time |
| Double support I proportion | Double support I duration divided by stride time |
| Right single support/Left swing phase proportion | Right single support/Left swing phase duration divided by stride time |
| Double support II proportion | Double support II duration divided by stride time |
| Right swing phase/Left single support proportion | Right swing phase/Left single support duration divided by stride time |
| Demographics | Assessment Session 1 | Assessment Session 2 |
|---|---|---|
| Number of subjects | 26 | 25 |
| Male (%) | 13 (50%) | 13 (52%) |
| Age (years) | 20.8 ± 0.7 | 20.8 ± 0.7 |
| Height (cm) | 168.8 ± 8.5 | 169.2 ± 8.5 |
| Weight (kg) | 62.6 ± 9.9 | 63.1 ± 9.7 |
| Gait speed (m/s) | 1.50 ± 0.12 | 1.50 ± 0.12 |
| Average number of steps | 177.3 ± 66.3 | 177.8 ± 67.6 |
| Parameter | Average Step Count | VICON Mean ± SD (n = 26) | Smartphone Mean ± SD (n = 26) | r | Bias | Percentage Bias | Lower LOA | Upper LOA |
|---|---|---|---|---|---|---|---|---|
| Duration parameters derived from HS only (sec) | ||||||||
| Step time of both legs | 177.3 | 0.516 ± 0.028 | 0.515 ± 0.028 | 0.977 ** | −0.001 | −0.2% | −0.013 | 0.011 |
| Left step time | 103.2 | 0.513 ± 0.032 | 0.510 ± 0.043 | 0.628 ** | −0.003 | −0.6% | −0.069 | 0.063 |
| Right step time | 74.1 | 0.516 ± 0.025 | 0.518 ± 0.039 | 0.553 * | −0.001 | −0.2% | −0.065 | 0.063 |
| Stride time | 74.1 | 1.028 ± 0.054 | 1.025 ± 0.054 | 0.969 ** | −0.004 | −0.4% | −0.030 | 0.023 |
| Duration parameters derived from HS and TO (sec) | ||||||||
| Right stance phase | 103.2 | 0.637 ± 0.045 | 0.595 ± 0.043 | 0.704 ** | −0.042 ** | −6.5% | −0.108 | 0.025 |
| Left stance phase | 74.1 | 0.642 ± 0.043 | 0.606 ± 0.053 | 0.554 * | −0.036 ** | −5.6% | −0.127 | 0.055 |
| Double support I | 103.2 | 0.127 ± 0.026 | 0.090 ± 0.035 | 0.098 ‡ | −0.035 ** | −27.7% | −0.116 | 0.045 |
| Right single support/Left swing phase | 103.2 | 0.388 ± 0.030 | 0.419 ± 0.050 | 0.568 * ‡ | 0.032 * | 8.3% | −0.055 | 0.119 |
| Double support II | 103.2 | 0.125 ± 0.025 | 0.087 ± 0.036 | 0.387 ‡ | −0.039 ** | −31.3% | −0.112 | 0.033 |
| Right swing/Left single support phase | 74.1 | 0.391 ± 0.025 | 0.429 ± 0.034 | 0.467 * | 0.038 ** | 9.8% | −0.024 | 0.100 |
| Proportion parameters | ||||||||
| Right stance phase | 103.2 | 0.620 ± 0.020 | 0.581 ± 0.026 | 0.244 ‡ | −0.039 ** | −6.2% | −0.098 | 0.021 |
| Left stance phase | 74.1 | 0.624 ± 0.024 | 0.591 ± 0.043 | 0.310 ‡ | −0.033 ** | −5.3% | −0.120 | 0.054 |
| Double support I | 103.2 | 0.123 ± 0.023 | 0.087 ± 0.033 | 0.091 ‡ | −0.034 ** | −27.8% | −0.111 | 0.042 |
| Right single support/Left swing phase | 103.2 | 0.376 ± 0.023 | 0.408 ± 0.044 | 0.255 ‡ | 0.034 ** | 9.0% | −0.053 | 0.120 |
| Double support II | 103.2 | 0.121 ± 0.022 | 0.085 ± 0.036 | 0.350 ‡ | −0.037 ** | −31.0% | −0.109 | 0.034 |
| Right swing/Left single support phase | 74.1 | 0.380 ± 0.020 | 0.419 ± 0.026 | 0.244 ‡ | 0.039 ** | 10.2% | −0.021 | 0.098 |
| Parameter | Average Step Count | Session 1 Smartphone Mean ± SD (n = 25) | Session 2 Smartphone Mean ± SD (n = 25) | ICC3, 1 |
|---|---|---|---|---|
| Duration parameters derived from HS only (sec) | ||||
| Step time of both legs | 177.8 | 0.516 ± 0.028 | 0.518 ± 0.037 | 0.845 ** |
| Left step time | 103.4 | 0.509 ± 0.044 | 0.519 ± 0.039 | 0.684 ** |
| Right step time | 74.4 | 0.518 ± 0.036 | 0.518 ± 0.048 | 0.388 * |
| Stride time | 74.4 | 1.027 ± 0.054 | 1.038 ± 0.077 | 0.829 ** |
| Duration parameters derived from HS and TO (sec) | ||||
| Right stance phase | 103.4 | 0.596 ± 0.044 | 0.604 ± 0.048 | 0.796 ** |
| Left stance phase | 74.4 | 0.608 ± 0.053 | 0.608 ± 0.063 | 0.691 ** |
| Double support I | 103.4 | 0.090 ± 0.035 | 0.089 ± 0.031 | 0.709 ** |
| Right single support/Left swing phase | 103.4 | 0.419 ± 0.050 | 0.430 ± 0.043 | 0.827 ** |
| Double support II | 103.4 | 0.087 ± 0.036 | 0.085 ± 0.030 | 0.615 ** |
| Right swing/Left single support phase | 74.4 | 0.431 ± 0.033 | 0.433 ± 0.043 | 0.582 * |
| Proportion parameters | ||||
| Right stance phase | 103.4 | 0.580 ± 0.026 | 0.582 ± 0.024 | 0.429 * |
| Left stance phase | 74.4 | 0.592 ± 0.044 | 0.585 ± 0.034 | 0.710 ** |
| Double support I | 103.4 | 0.087 ± 0.033 | 0.085 ± 0.028 | 0.681 ** |
| Right single support/Left swing phase | 103.4 | 0.408 ± 0.044 | 0.415 ± 0.034 | 0.710 ** |
| Double support II | 103.4 | 0.085 ± 0.036 | 0.082 ± 0.028 | 0.628 ** |
| Right swing/Left single support phase | 74.4 | 0.420 ± 0.026 | 0.418 ± 0.024 | 0.429 * |
Disclaimer/Publisher’s Note: The statements, opinions and data contained in all publications are solely those of the individual author(s) and contributor(s) and not of MDPI and/or the editor(s). MDPI and/or the editor(s) disclaim responsibility for any injury to people or property resulting from any ideas, methods, instructions or products referred to in the content. |
© 2025 by the authors. Licensee MDPI, Basel, Switzerland. This article is an open access article distributed under the terms and conditions of the Creative Commons Attribution (CC BY) license (https://creativecommons.org/licenses/by/4.0/).
Share and Cite
Liang, S.G.; Chung, H.Y.; Chu, K.W.; Gao, Y.H.; Lau, F.Y.; Lai, W.I.; Fong, G.C.-H.; Kwong, P.W.-H.; Lam, F.M.H. Validity and Reliability of a Smartphone-Based Gait Assessment in Measuring Temporal Gait Parameters: Challenges and Recommendations. Biosensors 2025, 15, 397. https://doi.org/10.3390/bios15070397
Liang SG, Chung HY, Chu KW, Gao YH, Lau FY, Lai WI, Fong GC-H, Kwong PW-H, Lam FMH. Validity and Reliability of a Smartphone-Based Gait Assessment in Measuring Temporal Gait Parameters: Challenges and Recommendations. Biosensors. 2025; 15(7):397. https://doi.org/10.3390/bios15070397
Chicago/Turabian StyleLiang, Sam Guoshi, Ho Yin Chung, Ka Wing Chu, Yuk Hong Gao, Fong Ying Lau, Wolfe Ixin Lai, Gabriel Ching-Hang Fong, Patrick Wai-Hang Kwong, and Freddy Man Hin Lam. 2025. "Validity and Reliability of a Smartphone-Based Gait Assessment in Measuring Temporal Gait Parameters: Challenges and Recommendations" Biosensors 15, no. 7: 397. https://doi.org/10.3390/bios15070397
APA StyleLiang, S. G., Chung, H. Y., Chu, K. W., Gao, Y. H., Lau, F. Y., Lai, W. I., Fong, G. C.-H., Kwong, P. W.-H., & Lam, F. M. H. (2025). Validity and Reliability of a Smartphone-Based Gait Assessment in Measuring Temporal Gait Parameters: Challenges and Recommendations. Biosensors, 15(7), 397. https://doi.org/10.3390/bios15070397