Article

Growth Mechanism of Seed-Layer Free ZnSnO3 Nanowires: Effect of Physical Parameters

i3N/CENIMAT, Department of Materials Science, Faculty of Science and Technology, Universidade NOVA de Lisboa and CEMOP/UNINOVA, Campus de Caparica, 2829-516 Caparica, Portugal
*
Authors to whom correspondence should be addressed.
Nanomaterials 2019, 9(7), 1002; https://doi.org/10.3390/nano9071002
Submission received: 12 June 2019 / Revised: 2 July 2019 / Accepted: 9 July 2019 / Published: 11 July 2019
(This article belongs to the Special Issue The Synthesis, Assembly, Property and Application of Nanocrystals)

Abstract

:
ZnSnO3 semiconductor nanostructures have several applications as photocatalysis, gas sensors, and energy harvesting. However, due to its multicomponent nature, the synthesis is far more complex than its binary counter parts. The complexity increases even more when aiming for low-cost and low-temperature processes as in hydrothermal methods. Knowing in detail the influence of all the parameters involved in these processes is imperative, in order to properly control the synthesis to achieve the desired final product. Thus, this paper presents a study of the influence of the physical parameters involved in the hydrothermal synthesis of ZnSnO3 nanowires, namely volume, reaction time, and process temperature. Based on this study a growth mechanism for the complex Zn:Sn:O system is proposed. Two zinc precursors, zinc chloride and zinc acetate, were studied, showing that although the growth mechanism is inherent to the material itself, the chemical reactions for different conditions need to be considered.

Graphical Abstract

1. Introduction

As a result of its impressive multifunctionality, ZnO-based thin films and nanostructures have received a lot of attention in the last 10 years [1,2,3,4,5]. While ZnO on its own captured a large interest, doping or mixing with other binary compounds brings a new level of possibilities, as the material properties can be improved/tailored to different applications depending on the cationic ratio. This has been widely explored in oxide thin films, with materials such as indium-gallium-zinc oxide (IGZO) [6,7,8] or with more sustainable approaches that avoid critical raw materials (In and Ga) [9], as zinc-tin oxide (ZTO) [10,11]. While in thin film form one of the major arguments of these multicomponent materials has been their amorphous structure, highly desirable for uniform large area electronics, when moving to nanostructure synthesis it is important to consider the different crystalline phases that are possible to achieve. ZTO structures crystalize by solid-state reaction in the stable inverse spinel ortho-stannate Zn2SnO4 phase [12,13]. Nonetheless, it can also crystalize in metastable ZnSnO3 phase, either in perovskite (orthorhombic, orth, or face centered, fcc) [14] or rhombohedral [15] forms. Both of these phases can result in nanostructures with different shapes and different properties, thus providing a large degree of multifunctionality with this material system [16,17,18,19,20]. Zn2SnO4 is an n-type semiconductor with high mobilities in the order of 112 cm2 V−1 s−1 and a reported band gap of 3.6 eV for nanostructures [21,22]. On the other hand, ZnSnO3 is reported as having a high polarization along the z-axis of ~59 μC/cm2, which is much higher than that of ZnO (~5 μC/cm2) [18,23,24], and also as a ferroelectric material [19,25]. Its band gap of 3.9 eV is higher than that of Zn2SnO4 [26,27]. Depending on the structure and phase ZTO nanostructures have been used for electronic [22,28,29,30,31] and energy harvesting [14,32,33,34,35,36] devices, catalysis [18,37,38,39,40,41], and sensors [42,43,44].
While vapor phase processes such as chemical vapor deposition (CVD) and thermal evaporation can be used to synthetize ZTO nanostructures with high efficiency [29,45], these expensive techniques are cumbersome and require high temperatures (>700 °C). The demand for low-cost processes compatible with flexible substrates requires solution processes that allow for the synthesis of nanostructures at low cost, using simple and easy methods, ideally upscalable to industrial-scale quantities [46]. Recently, Shaodong et al. reviewed the different methods to fabricate ZTO nanostructures, showing the lack of well-controlled solution based methods to produce ZTO nanowires (NWs) of both ZnSnO3 and Zn2SnO4 phases [12].
The multicomponent nature of ZTO makes the synthesis process quite challenging, given the different ionic sizes and diffusivity of the cations. Furthermore, each ZTO structure has different nucleation and growth times and requires a specific range of synthesis temperature [47]. For these reasons, a comprehensive study on the synthesis of ZTO nanostructures is needed. Studies on the influence of chemico-physical parameters on the hydrothermal synthesis of ZTO have been reported, showing the possibility to control the shape and type of the nanostructures and consequently the electrical, optical, and mechanical properties [13,48,49]. Recently, we reported a thorough description of the influence of different hydrothermal synthesis’ chemical parameters in the growth of ZTO nanostructures [50]. This work was conducted without employing any seed-layer; hence, the obtained structures depend exclusively on the chemico-physical parameters of the synthesis. Moreover, the obtained nanostructures are produced in form of powder, which in conjunction with a variety of transfer methods, allow for a higher degree of freedom for integration on different substrates [51], without contamination from the seed-layer material [44]. In the last decade, the physical parameters of solution-based synthesis have also been studied showing that they have a large influence in the growth of the nanostructures. Zeng et al. reported the influence of temperature and time [49], showing that in order to achieve Zn2SnO4 nanocrystals, a temperature of 200 °C and at least 20 h of reaction time are needed. Gou et al. studied the evolution of ZnSnO3-orth nanoplates with the time and temperature of the synthesis, showing that producing these type of structures required 12 h at 260 °C, for that specific solution process [14]. These structures were applied to nanogenerators, in a composite with PDMS, resulting in a piezoelectric coefficient (d33) of 49 pC/N. This value is more than three times than the typically reported for ZnO nanostructures [52].
In this paper, the effect of the physical parameters on the hydrothermal synthesis of ZTO nanostructures, namely the influence of the volume of solution, temperature, and reaction time of the synthesis, is shown. In line with our previous work about the effect of the chemical conditions, this study is orientated towards the synthesis of ZTO nanowires, more specifically ZnSnO3, which properties allow to envisage application on numerous next-generation nanoscale devices such as nanogenerators [35,36,53], sensors [54,55,56], photocatalysis [57], solar cells [58], resistive switching memories [59,60], and transistors [22,29]. Moreover, we have previously shown that the structures synthetized using this hydrothermal method have properties that are similar to those produced by expensive and high-temperature methods [50], thus, being promising materials for a new wave of multifunctional and low-cost devices.

2. Materials and Methods

2.1. Nanostructures’ Synthesis

ZnSnO3 nanowires were synthesized via hydrothermal method in a conventional oven, using the same methodologies and reagents reported previously by our group [50]. The most favorable chemical conditions to produce ZnSnO3 nanowires previously obtained in [50] using tin (IV) chloride 5-hydrate (SnCl4·5H2O) as tin precursor and both zinc chloride (ZnCl2) and zinc acetate (Zn(CH3COO)2, ZnAc) as zinc precursors were maintained in this work. Briefly the ZTO hydrothermal synthesis was performed by dissolving the zinc (0.02 M/0.0657 g of ZnAc or 0.04 M/0.0818 g of ZnCl2) and tin (0.02 M/0.1050 g) precursors separately in 7.5 mL of deionized water and then mixed together, 7.5 mL of the surfactant ethylenediamine (EDA) were then added and left stirring for 30 min, after which the mineralizer sodium hydroxide (NaOH, 0.24 M/0.1450 g) was added. The solution was then transferred into a 45 mL Teflon-lined stainless-steel autoclave (Parr Acid Digestion Bombs, no 4744, Moline, IL, USA), and kept in an electric oven (Thermo Scientific, Waltham, MA, USA) varying the temperature and the reaction time, using a heating ramp of 200 °C/h. Aiming to study the influence of the physical parameters in the ZTO nanostructures growth, we varied the mixture volume (7.5 mL, 11 mL, and 15 mL), the synthesis temperature (150 °C, 180 °C, 200 °C, and 220 °C), and reaction time (2 h, 8 h, 12 h, 18 h, 24 h, 36 h, and 48 h). After the synthesis time, the autoclave was cooled to ambient temperature, naturally. The final product (white precipitate) comprising the nanostructures, was alternately washed with deionized water and isopropyl alcohol (at least 5 times) and centrifuged at 4000 rpm. After washed, the nanostructures were dried at 60 °C, in vacuum, for 2 h. As was previously reported [50], the syntheses present a good reproducibility, especially when using ZnCl2 due its better solubility in ethylenediamine.

2.2. Nanostructures’ Characterization

All the nanostructures’ characterization was performed with the synthesis product in powder form. In order to study the morphology and elemental composition of the nanostructures, scanning electron microscopy (SEM) and energy dispersive X-ray spectroscopy (EDS) inside an AURIGA CrossBeam workstation were performed (Zeiss, Oberkochen, Germany). The structural characterization was carried out by X-Ray diffraction (XRD) using X’Pert PRO MRD diffractometer (PANalytical, Royston, UK) with Cu Kα radiation and the data acquisition range was 10–90° (2θ) with a step size of 0.033°. Fourier-transform infrared (FTIR) spectra were acquired in the range of 4000–525 cm−1 with 4 cm−1 resolution and 45° incident angle. The data was recorded using a Smart iTR attenuated total reflectance (ATR) sampling accessory (Thermo Scientific, Waltham, MA, USA) equipped with a single bounce diamond crystal on a Thermo Nicolet 6700 Spectrometer (Thermo Scientific, Waltham, MA, USA). Raman spectra were acquired using an inVia Reflex micro-Raman spectrometer (Renishaw, Wotton-under-Edge, UK) equipped with an air-cooled CCD detector and a HeNe laser using a 532 nm laser excitation with a power of 50 mW, with 0.3 cm−1 resolution. All measurements were obtained with an intensity of 50 µW at room temperature in a range of 100–1600 nm, using an integration time of 2 scans (10 s each).

3. Results and Discussion

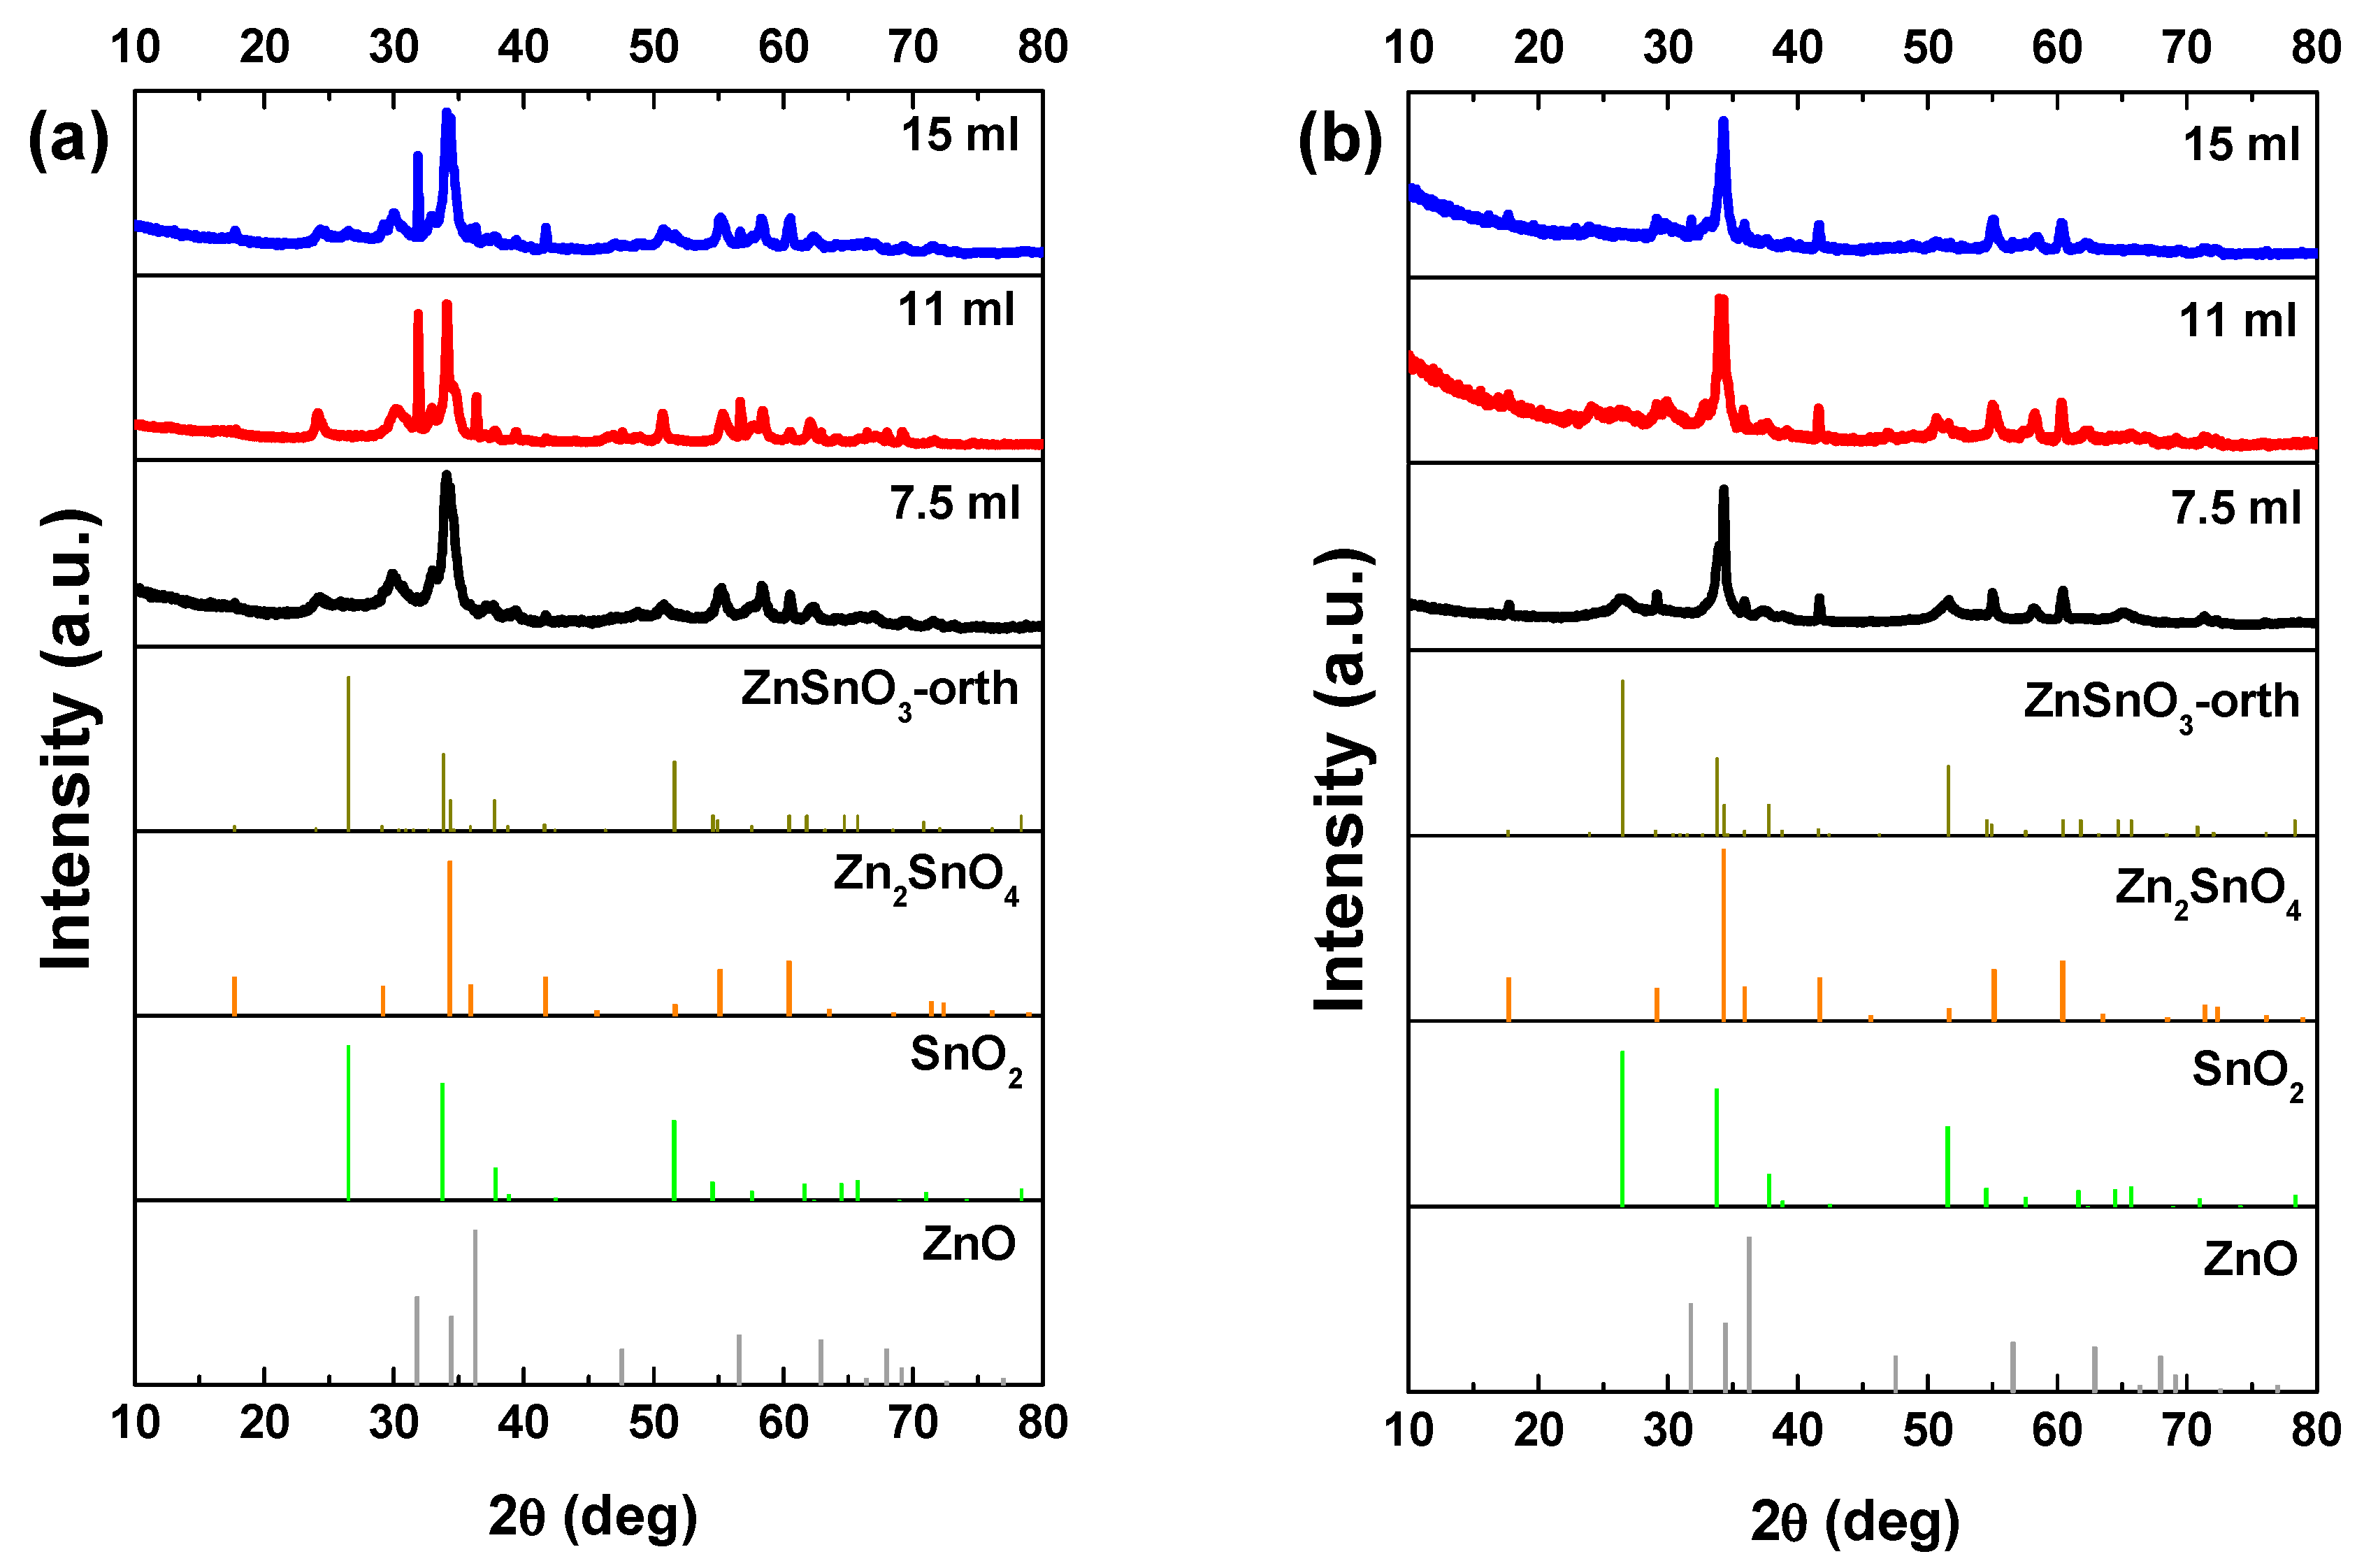
3.1. Reaction Mixture Volume

A hydrothermal process is a method to produce single and polycrystalline structures, in aqueous solution at high temperature and high pressure. Both reaction mixture volume and temperature are determinant to the pressure inside the autoclave, consequently defining the growth of the nanocrystals. However, the phase transformation mechanism that occurs in polymorphs materials under high pressure is not completely controlled and understood [61].
In order to study the influence of the pressure caused by the solution’s volume in the ZnSnO3 nanowires growth in this specific hydrothermal method, volumes of 7.5 mL, 11 mL, and 15 mL were tested, representing 17%, 24%, and 33% of the autoclave volume, respectively. The temperature was fixed at 200 °C and the reaction time was 24 h.
In general, a mixture of ZnO nanowires, SnO2 nanoparticles, and Zn2SnO4 nanostructures can be found in these syntheses, still with the increasing of the mixture volume mainly ZnSnO3 nanowires are obtained. Figure 1a shows small differences in the XRD pattern for the different volumes when using the ZnCl2 precursor. The most significant difference is the peak at 32° appearing for the volumes of 11 and 15 mL, attributed to ZnO phase. Raman analysis (Figure S1a) shows an intense peak at 437 cm−1, characteristic of ZnO [62], being this peak more intense for 11 mL, in agreement with the XRD data. The SEM images in Figure 2 clearly show that less volume gives rise to smaller nanowires. As we previously identified in Reference [50], when a volume of 15 mL was used, these nanowires have the ZnSnO3 orthorhombic perovskite phase, represented by the card 00-028-1486. Even if this card has been used before in several reports [63,64,65,66], it was deleted from ICDD database due to matching peaks with the mixture of SnO2 and Zn2SnO4. Although in 00-028-1486 card the peak with most intensity is at 26°, this peak corresponds to the 012 plane, which is not the preferential orientation of the nanowires when measured in XRD. In order to confirm the ZnSnO3 identification, we performed peak indexing in different samples, which always showed matching to an orthorhombic phase characteristic of ZnSnO3 and not of Zn2SnO4 and SnO2 mixture. EDS analysis confirms the 1:1 Zn:Sn ratio of the nanowires (Figure S2), reinforcing the hypothesis of the ZnSnO3 phase. Nevertheless, Raman analysis suggests that both ZnSnO3 and Zn2SnO4 should be present in the sample, given the characteristic peaks identified at 538 cm−1 and 676 cm−1 [49].
When ZnAc is used as the zinc source the presence of ZnO is partially or even completely suppressed. Similar to the results obtained using ZnCl2, longer ZnSnO3 nanowires are obtained for higher volumes of solution mixture. While for the lower volume (7.5 mL) Zn2SnO4 is the predominant phase, for 11 mL, ZnSnO3 nanowires are predominant, although some Zn2SnO4 nanostructures are also observed (Figure S3) and ultimately for 15 mL, ZnSnO3 nanowires are the predominant structures. SnO2 can also be identified by XRD (Figure 1b), even if it is not clear by Raman (Figure S1b) for all the conditions. The presence of residual ZnO/SnO2 for synthesis using the ZnCl2/ZnAc precursors, is attributed to the Zn precursor’s higher/lower solubility in ethylenediamine when compared to the SnCl4.5H2O, leading to an earlier availability of Zn/Sn species in the synthesis [50].
Nakayama et al. reported a theoretical study where the relation between the enthalpy and pressure for the system Zn–Sn–O was investigated [23]. They showed that the global energy minimum corresponds to the mixed phases Zn2SnO4 and SnO2. Our experimental results are in agreement with this study, as for lower volume and consequently lower pressure, the formation of Zn2SnO4 and SnO2 nanoparticles is favored, although mixed with ZnSnO3 nanowires. Moreover, in 2010 Gou et al. also reported a theoretical study about the ZnSnO3 phase transition under pressure [61]. According to the authors the ZnSnO3 synthesis at low-temperature (<700 °C) is unfavorable, leading to a mixture of phases, mainly due to its positive formation enthalpies. This decomposition has also been reported to occur at temperature above 500 °C [13,67]. Taking into account the temperature used in this study (200 °C), our results are in fair agreement with this, since with decreasing volume, and consequently pressure, the trend is to achieve higher mixture of phases while the more homogeneous ZnSnO3 nanowires are obtained when using the higher solution volume, 15 mL. The high pressure inside the autoclave, characteristic of a hydrothermal method, supplies high energy levels to the reaction, leading to an acceleration of the nucleation processes at even lower temperatures. For the reasons explained, 15 mL was the volume used for both precursors for the next studies presented here.

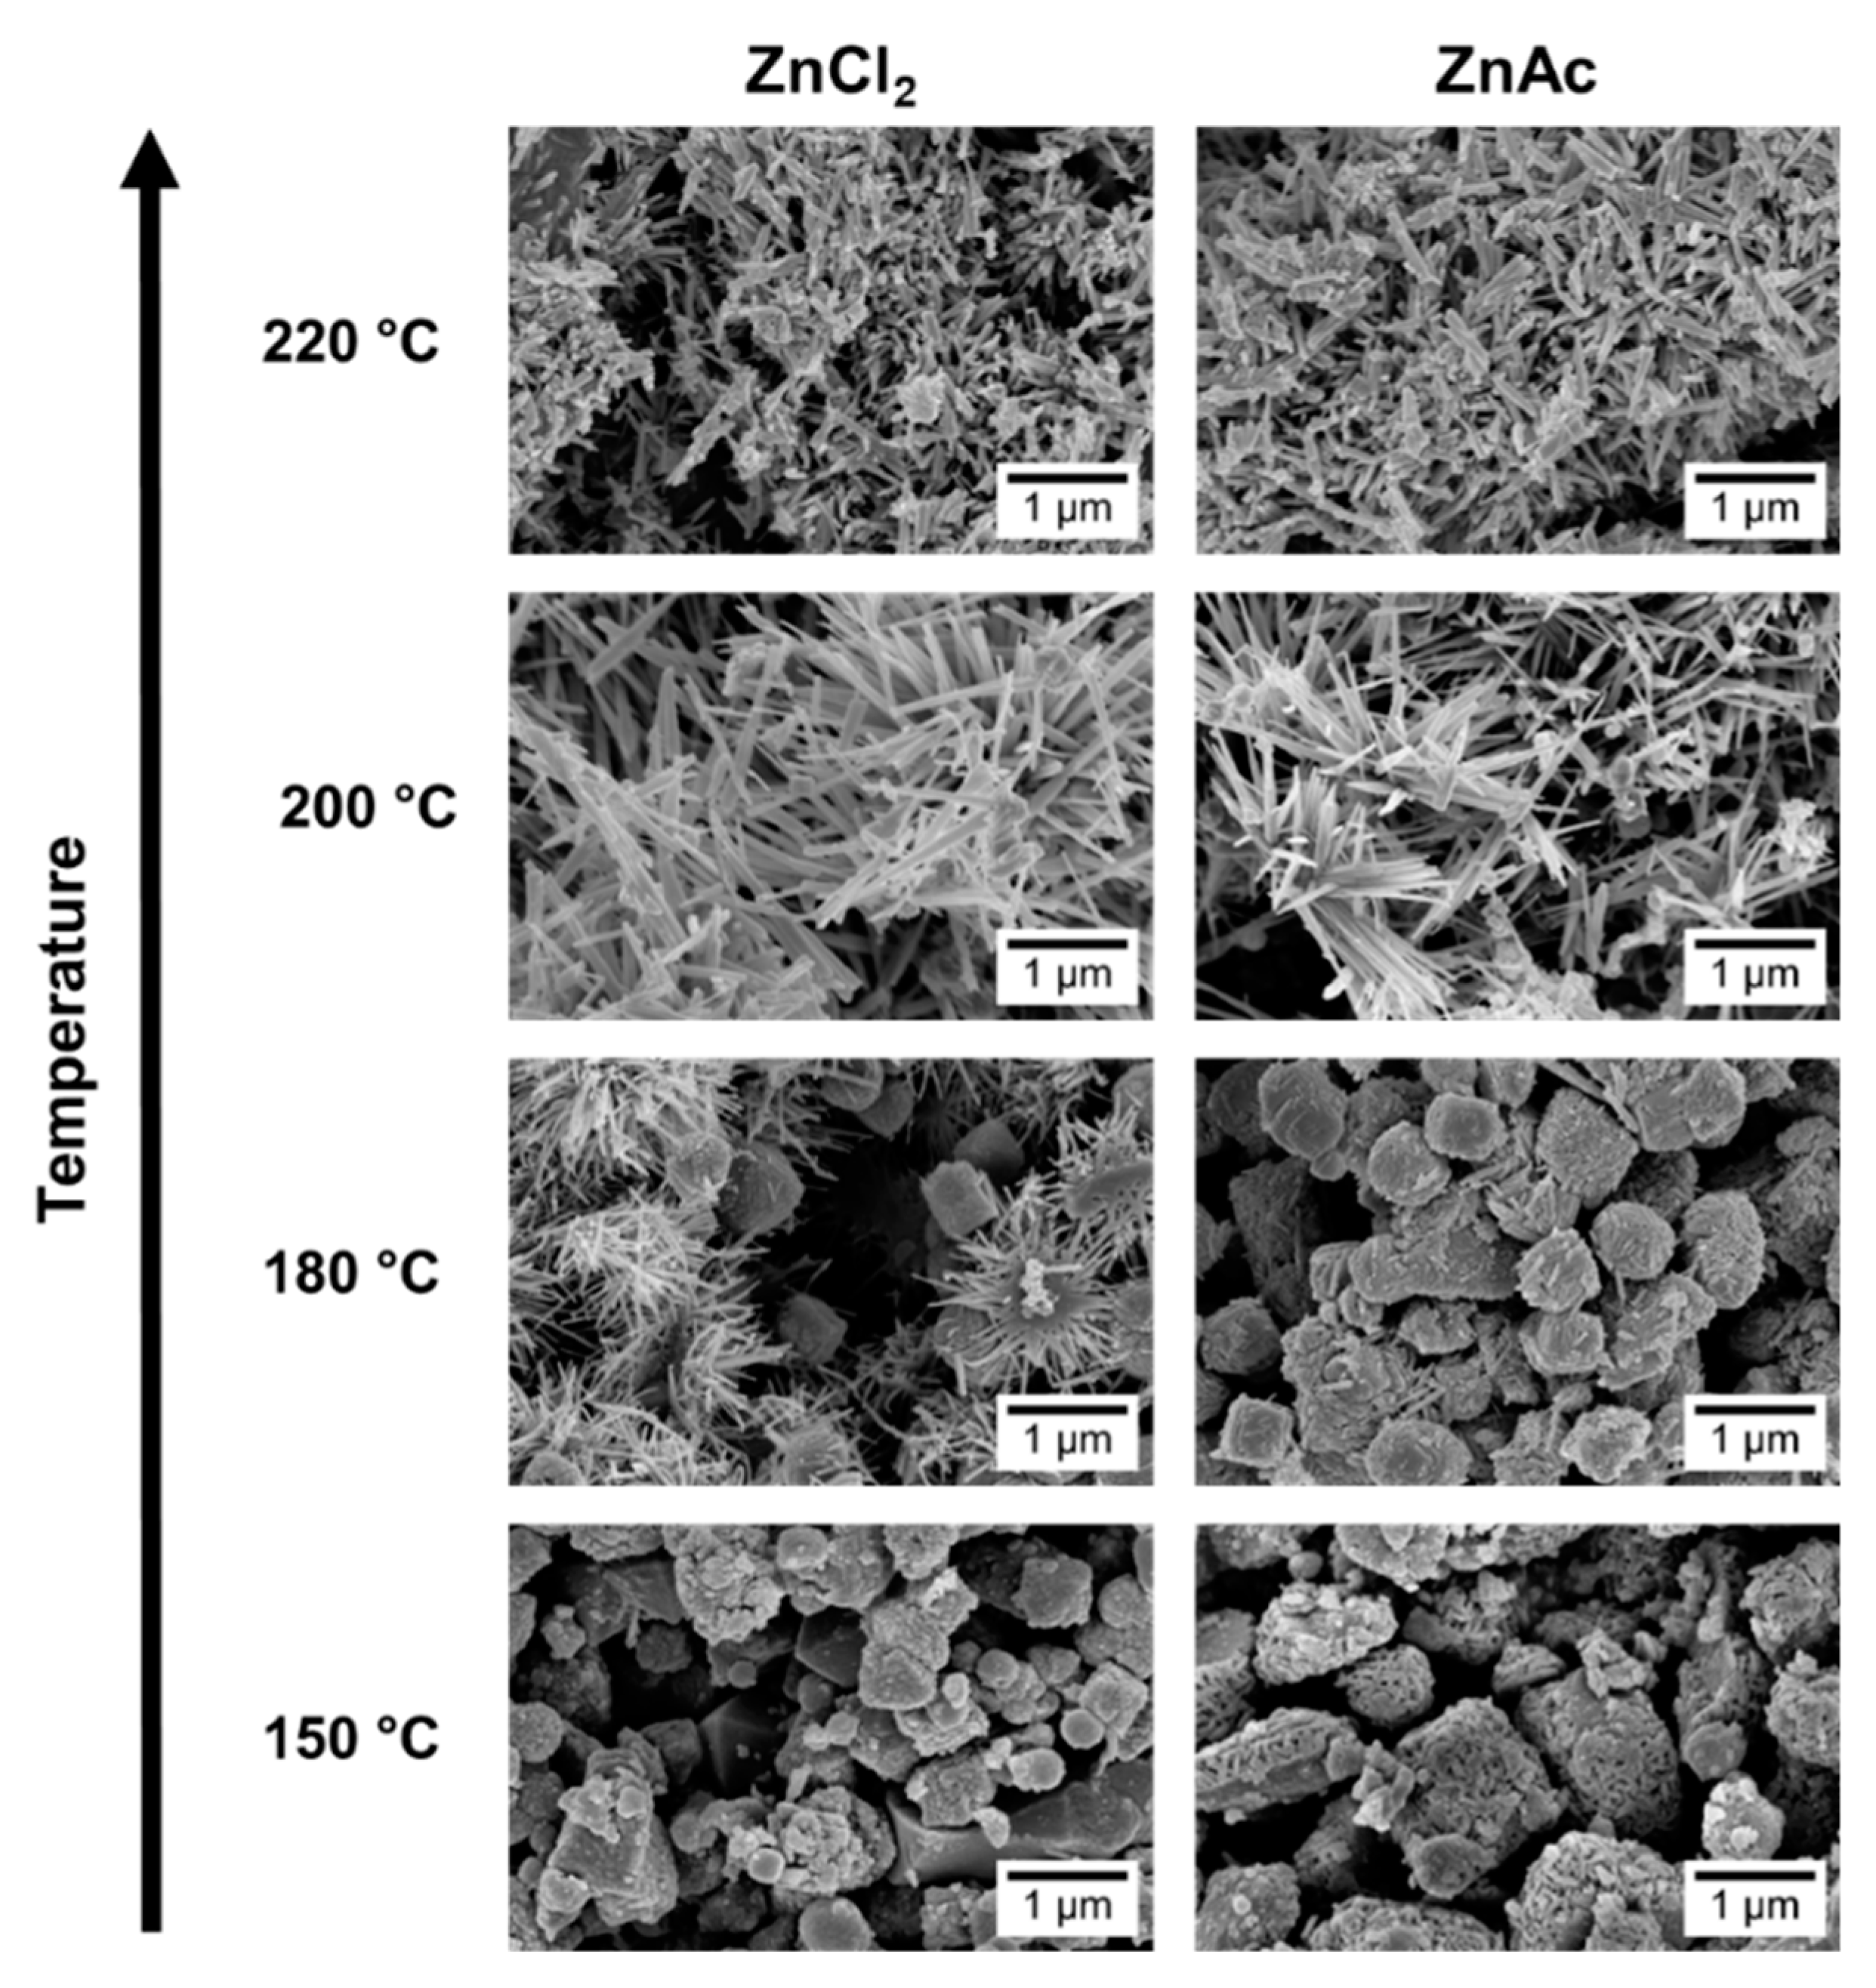
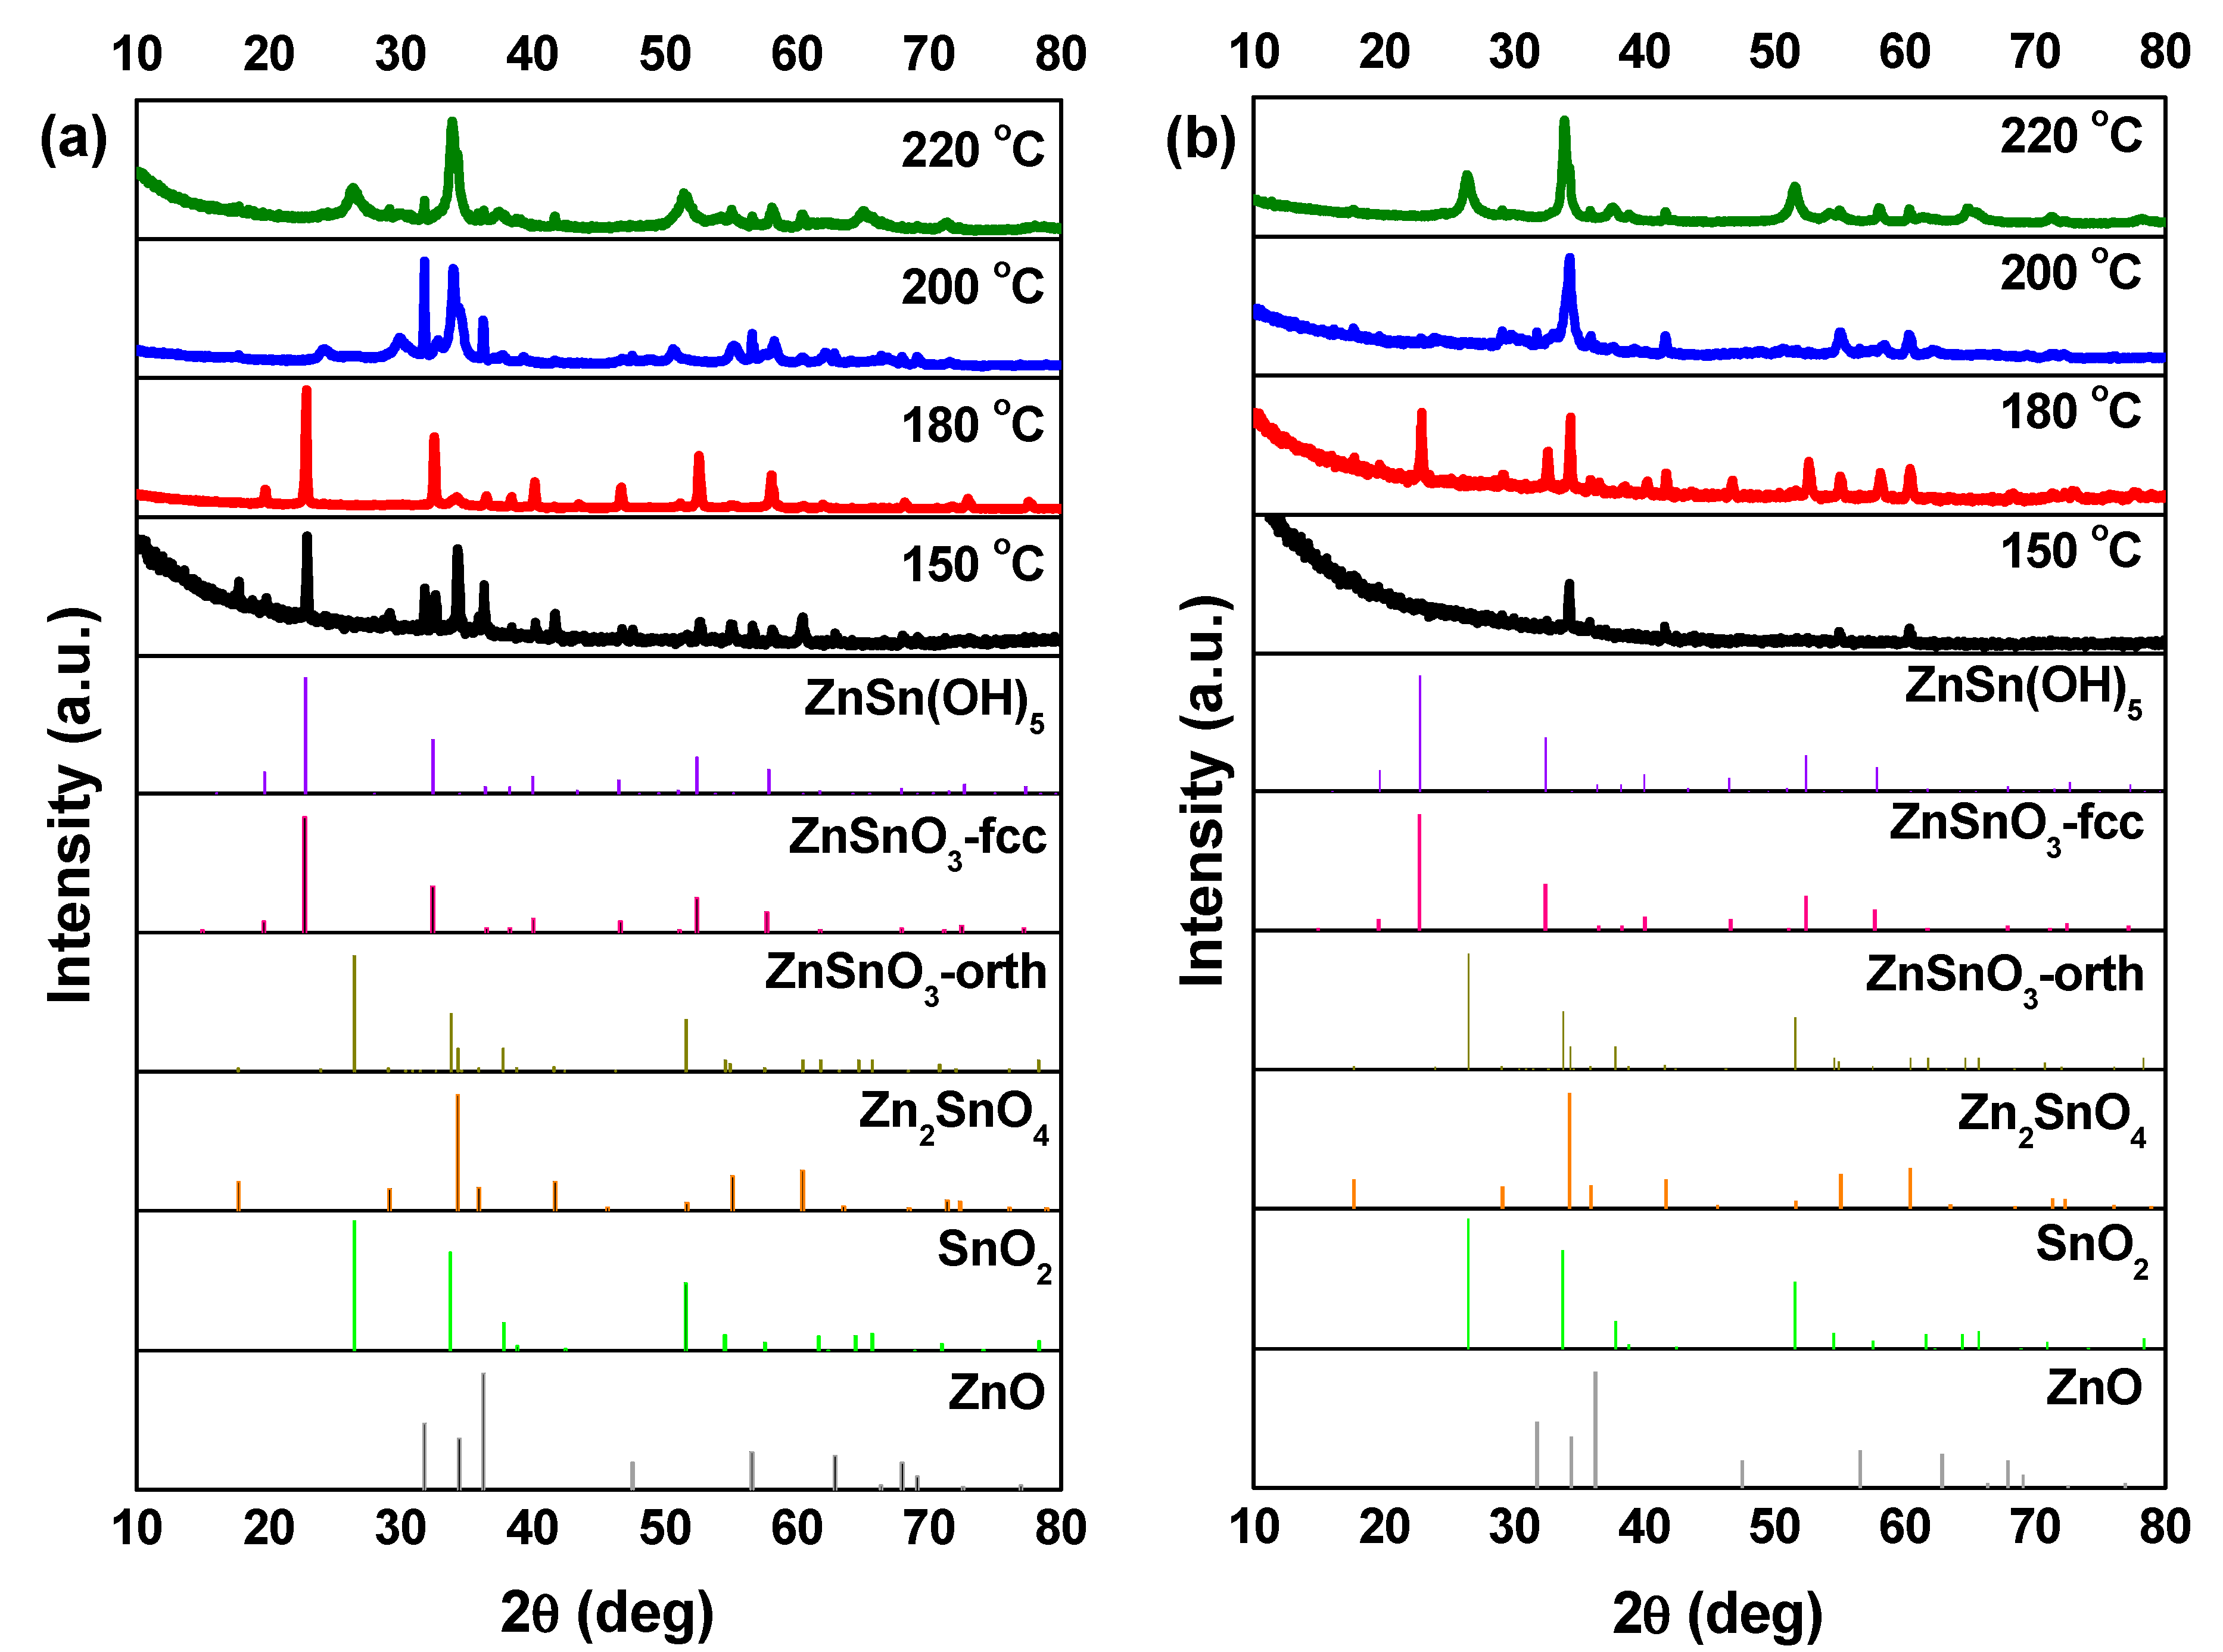
3.2. Synthesis Temperature
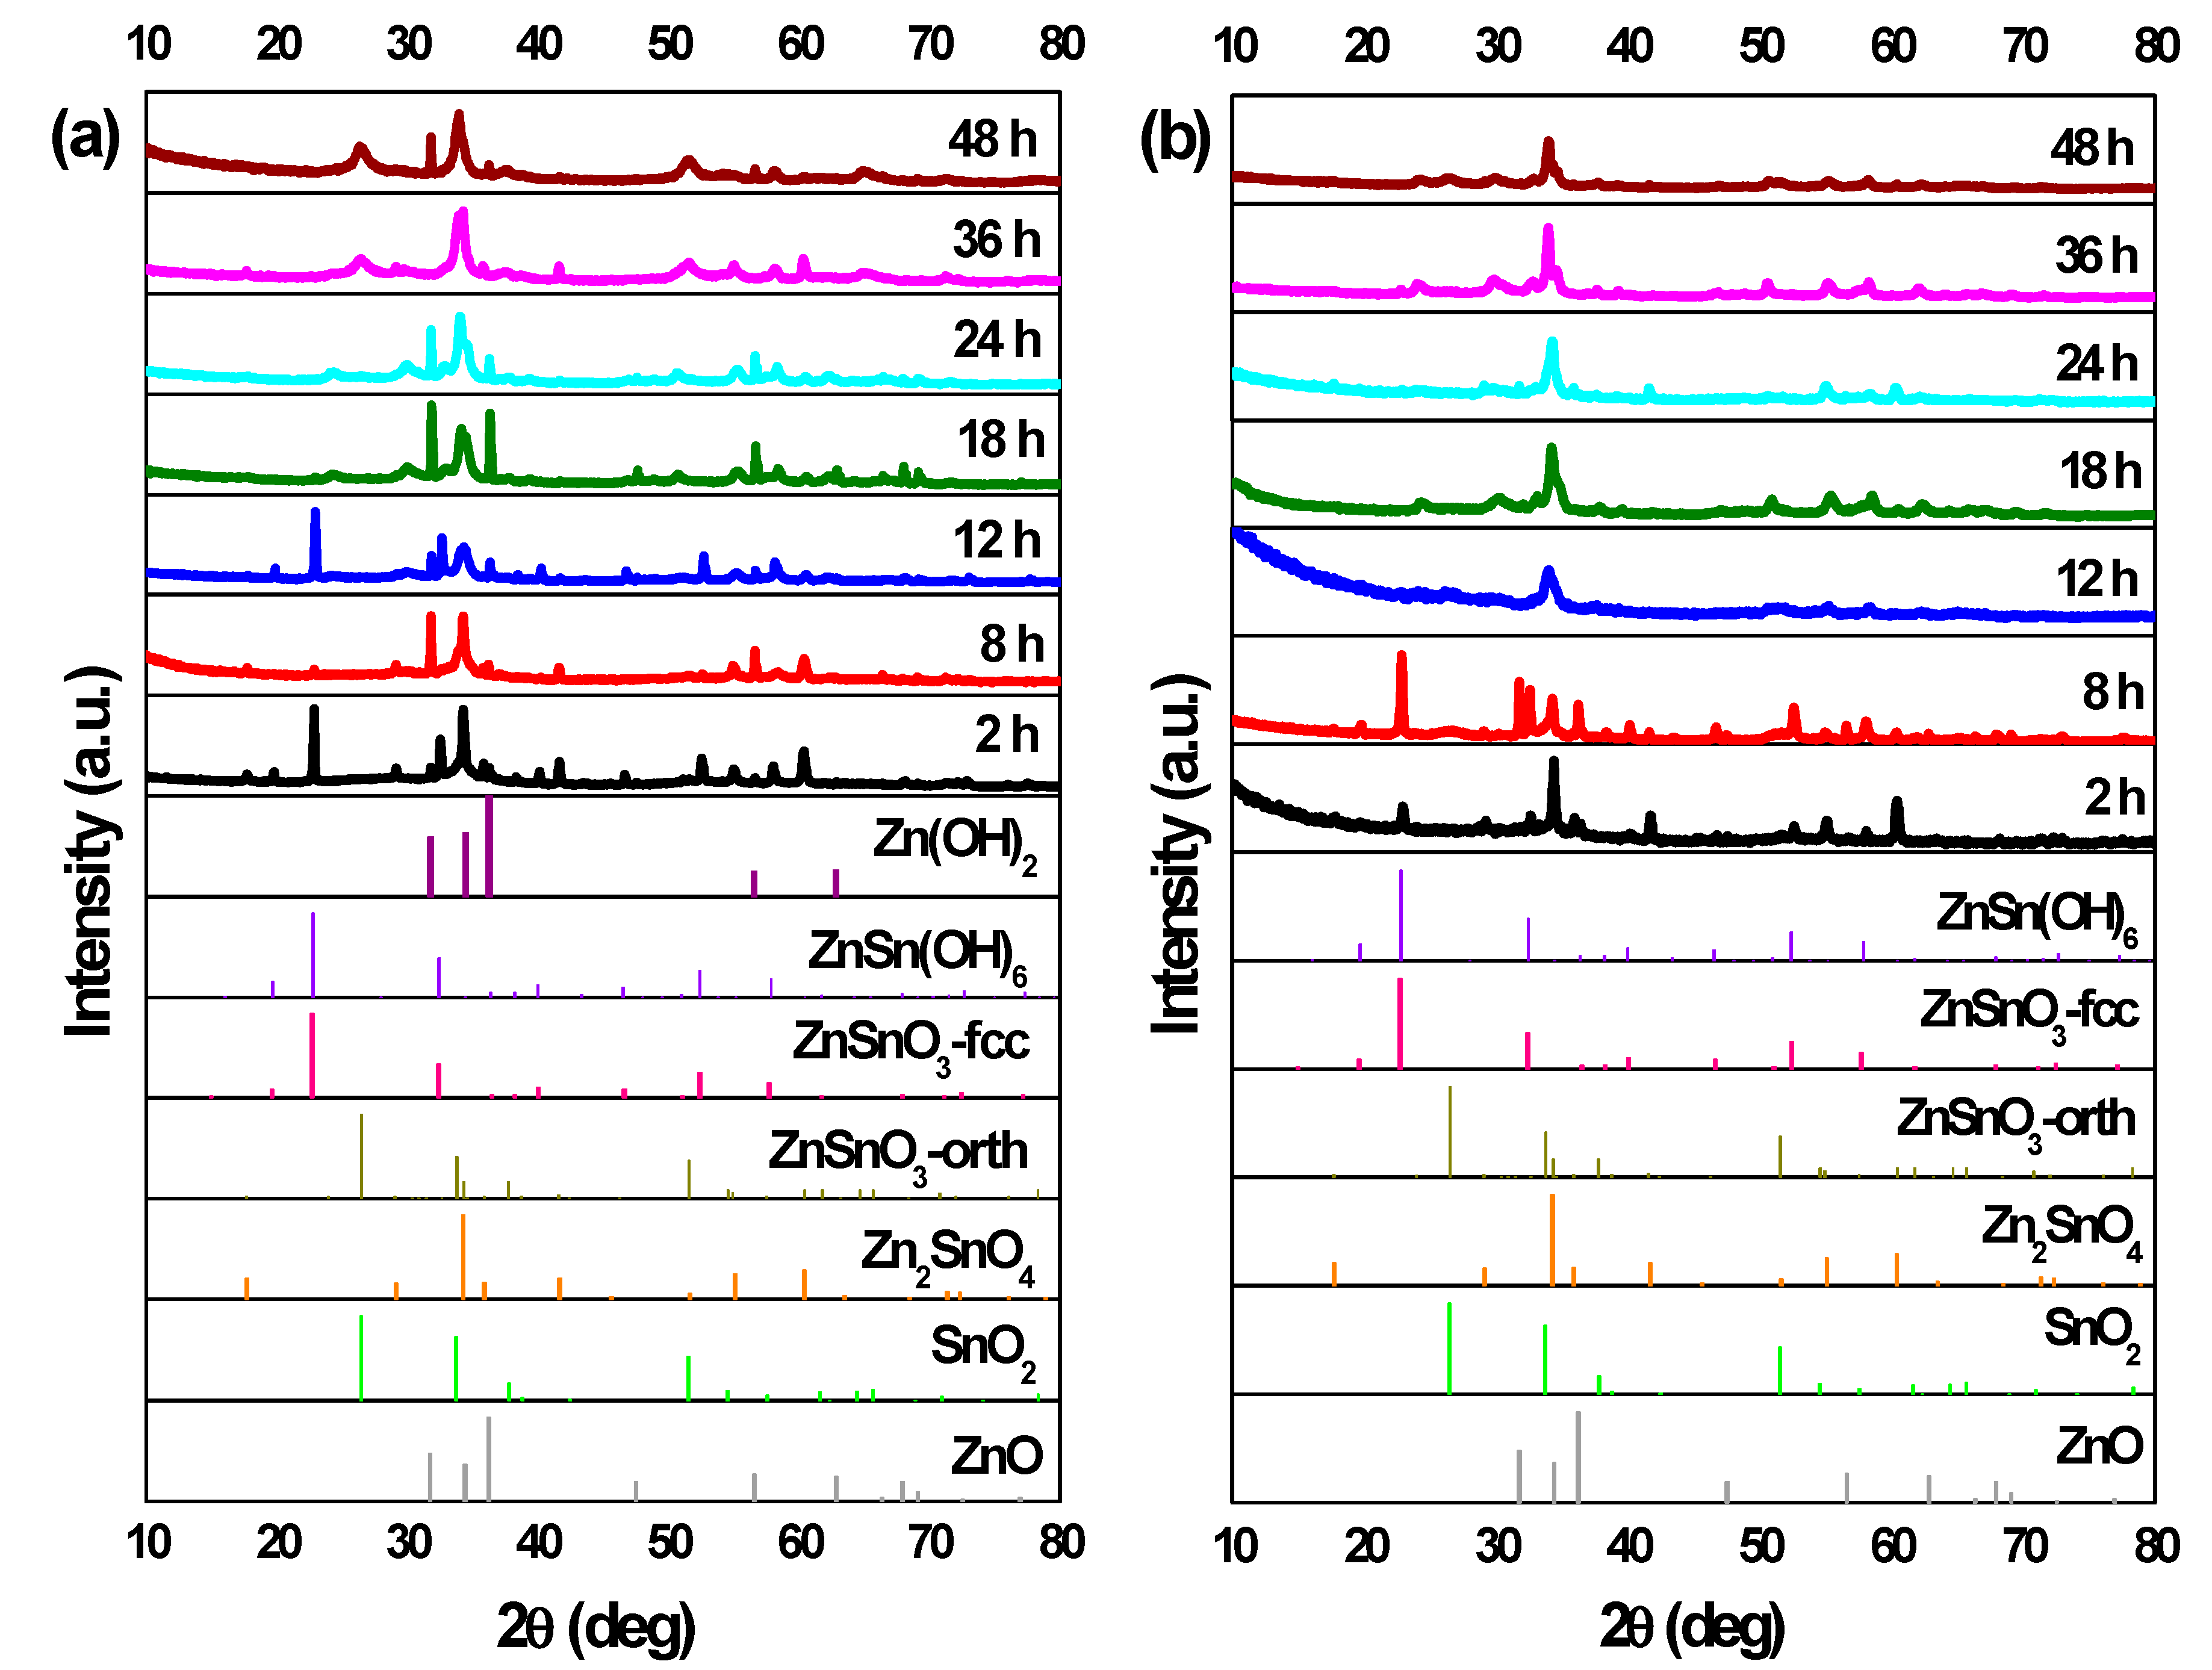
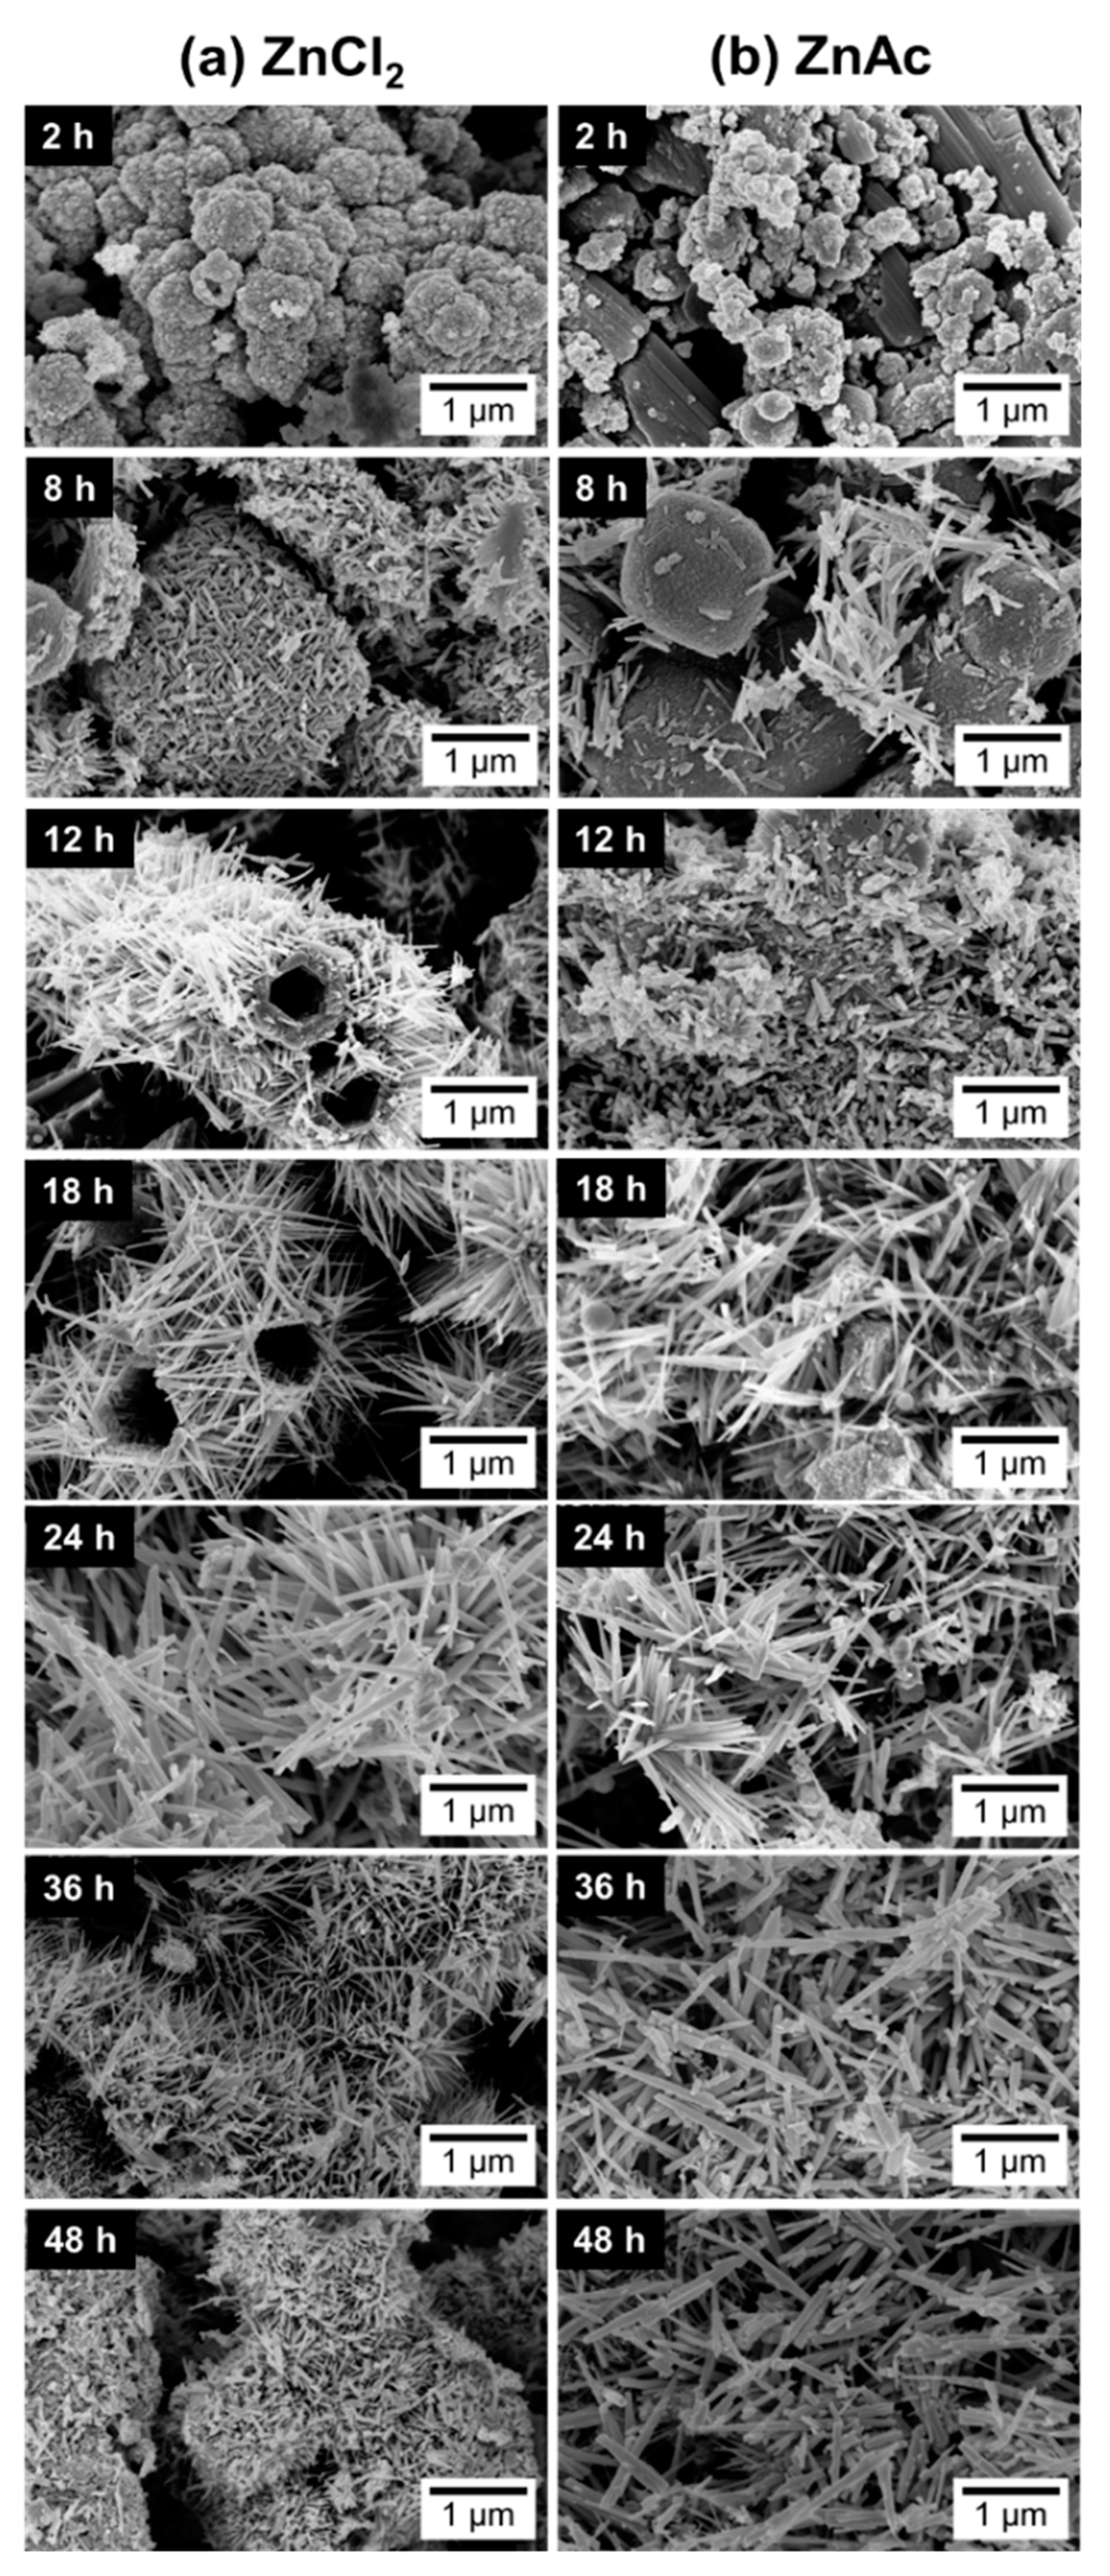
To understand the growth mechanisms of ZTO nanostructures, one needs to have in mind the chemical reaction processes. Based on different reports, the ZnSnO3 nanostructures formation follows the equations below [14,63,68]:
Zn2+ + Sn4+ + 6OH → ZnSn(OH)6,
ZnSn(OH)6 → ZnSnO3 + 3H2O.
Regarding Zn2SnO4, its formation can be represented by the following equations together with Equation (1):
Zn2+ + 4OH → Zn(OH)42−,
ZnSn(OH)6 + Zn(OH)42− → Zn2SnO4 + 4H2O + 2OH
ZnSnO3 can have the fcc or the orthorhombic structures, and these two different structures present different heat of formation and total energies. Gou et al. presented these values for the different possible structures of ZnSnO3 [61]. On the other hand, it is already well-known that the ZnSnO3 phase is metastable [12,13] and according, for example, to the study reported by Bora et al. this phase suffers a decomposition into the thermodynamically stable phases Zn2SnO4 and SnO2 at temperatures higher than 500 °C [67]. This decomposition can be represented by the following equation:
2ZnSnO3 → Zn2SnO4 + SnO2.
However, it is clear that above atmospheric pressure, as in the case of the hydrothermal method, and depending of the reaction mixture, the temperature at which the decomposition occurs can change.
In order to investigate the effect of temperature in the specific conditions of our syntheses, four different temperatures were used: 150 °C, 180 °C, 200 °C, and 220 °C, while maintaining all the other conditions and keeping the volume of the solution mixture at 15 mL.
SEM images, in Figure 3, show that at 150 °C, mainly nanoparticles are obtained. In the XRD pattern (Figure 4) a mixture of phases (ZnSn(OH)6 and Zn2SnO4 and/or ZnSnO3) can be observed using ZnCl2, while when using ZnAc, only Zn2SnO4 is identified. Raman analysis (Figure S4) is in agreement with these results, showing the peak at 603 cm−1, characteristic of ZnSn(OH)6 (only for ZnCl2) and the characteristics peaks of ZTO for both Zn sources (538 cm−1 and 676 cm−1). It is important to refer that the 603 cm−1 vibrational band is not only a characteristic peak of ZnSn(OH)6, but also of fcc-ZnSnO3 [67] that could also be present in these samples. However, FTIR analysis supports the ZnSn(OH)6 hypothesis by showing OH groups for wavenumbers above 3000 cm−1 (Figure S5a), corresponding to ZnSn(OH)6. In EDS analysis, shown in Figure S6, it can be seen that the nanoparticles obtained using ZnAc have the Zn:Sn ratio of 2:1 corresponding to the Zn2SnO4 phase.
Increasing the temperature to 180 °C, some nanowires can be viewed in SEM when using the ZnCl2 precursor (Figure 3), which can be ZnSnO3 according to the XRD (Figure 4a). Still, at this temperature, OH groups are very evident from the FTIR analysis (Figure S5a) for both zinc precursors, with XRD showing predominantly the ZnSn(OH)6 phase, an intermediate stage of the ZnSnO3 formation. Zeng et al. also showed that for temperatures lower than 200 °C ZnSn(OH)6 is the predominant phase [49]. Nevertheless, XRD also shows that other phases are present (Figure 4). In fact, EDS (Figure S7) and Raman (Figure S4) confirm this by showing a reasonable amount of Zn2SnO4 octahedrons, especially when using ZnAc as precursor. It means that, as already discussed, at these lower temperatures, and consequently lower pressures, the formation of the thermodynamically more stable Zn2SnO4 nanoparticles is promoted. The lower solubility of ZnAc in ethylenediamine, when compared to ZnCl2, can explain why a higher mixture of phases is seen for this case.
Moreover, in Figure S5a,b, FTIR spectra of both precursors for 150 °C and 180 °C presents several peaks in the range of 1250 to 500 cm−1. The origin of these peaks can be associated to residual reagents in the final product (see Figure S8 in supporting information) [69], which means that when using temperatures lower than 200 °C, the reagents are not completely consumed. An exception is seen for synthesis at 150 °C using ZnAc, where these peaks are not present and Zn2SnO4 nanoparticles were obtained, as these are the more stable ZTO nanostructures.
The samples at 200 °C were already described in the previous section and result mainly in ZnSnO3 nanowires. For this temperature, as seen in Figure S5, FTIR analysis confirms that no OH groups are present, meaning that the intermediate phase ZnSn(OH)6 is no longer obtained at this temperature. It should be added that FTIR also shows that all the reagents were completely consumed.
Increasing the temperature to 220 °C leads to the formation of SnO2 and Zn2SnO4 phases, even if the ZnSnO3 nanowires are still predominant. While it is not evident in the XRD pattern, through Raman analysis (Figure S4) their presence is clear since it is possible to observe the 631 cm−1 and 538 cm−1 peaks, characteristic of Sn–O and M–O tetrahedrons bonds, respectively. This result is attributed to the decomposition of ZnSnO3 into SnO2 and Zn2SnO4, due to its metastability. This decomposition has been reported to occur at temperatures above 500 °C [13,61,67]. In the present study, this decomposition occurs at lower temperature due to the high energy levels inherent to the hydrothermal process (high temperature and pressure).
In conclusion, it is clear that for temperatures lower than 200 °C, homogeneous nanowires are not produced as, in accordance to what was observed in the previous section, for lower available energy, the formation of ZnSnO3 is not feasible, and instead the more stable phase Zn2SnO4 is favored (along with the intermediate phase ZnSn(OH)6). Meanwhile, for temperatures around 200 °C, almost only ZnSnO3 nanowires are produced. For higher temperatures (220 °C), no improvements are observed in terms of producing only nanowires, as decomposition of those into the more stable phases starts to occur. This study shows that the temperature to achieve the desired structures must be carefully considered, as it should be high enough to allow the formation of the metastable phase, but not too high to promote the decomposition process.

3.3. Reaction Time

Throughout the reaction time of the synthesis, the ZTO nanostructures undergo a complex evolution. Thus, a careful investigation on the evolution of ZTO morphology and crystallinity was performed for different reaction times (2 h, 8 h, 12 h, 18 h, 24 h, 36 h, and 48 h), for both zinc precursors (ZnCl2 and ZnAc) and using the most favorable conditions as defined in the previous sections (15 mL of volume at 200 °C).
Similar to what was observed with the study of the effect of the temperature, ZnSn(OH)6 appears as an intermediate phase before the formation of the ZnSnO3 or the Zn2SnO4 phases (represented by Equations (1)–(4)).
In Figure 5a,b, the XRD patterns for the structures from synthesis with different reaction times are shown. For 2 h of synthesis, ZnSn(OH)6 can be identified, for both zinc precursors. As already mentioned, this phase can be mistaken with fcc-ZnSnO3 in XRD pattern and also in Raman analysis (Figure S9) where an intense peak at 603 cm−1 is evident. Nonetheless, FTIR analysis in Figure S10 clarifies this by showing the presence of OH groups, confirming the presence of ZnSn(OH)6. Although ZnSn(OH)6 phase is predominant for both Zn sources, when using ZnAc, it is also possible to identify Zn2SnO4 by XRD, and when using ZnCl2, Raman analysis indicates ZnSnO3 and/or Zn2SnO4 may be present.
When using ZnCl2, the ZnSn(OH)6 phase appears for synthesis of 2 h, while for synthesis of 8 h or longer, neither OH groups (from the intermediate phase ZnSn(OH)6) nor leftover precursors are observed in FTIR spectra (Figure S10), unlike when using ZnAc, where these are present up to 8 h of synthesis. For 8 h of synthesis, while the nanoparticles are still predominant, some orthorhombic ZnSnO3 nanowires start to be present and, from this reaction time onwards, these nanowires are the predominant structure achieved, with both precursors.
Regarding the use of the ZnCl2, a particular case is observed for the 12 h long synthesis. In this condition, ZnSnO3-fcc also seems to be obtained, mixed with ZnSnO3-orth. The possibility to obtain this type of structures for lower energies was already demonstrated as it is an intermediate phase between ZnSn(OH)6 and ZnSnO3-orth [61]. Also, it is relevant to consider the possibility of formation of Zn(OH)2 due to the presence of Zn(OH)42+, which is an intermediate phase of formation of both Zn2SnO4 and ZnO. In XRD, the phase Zn(OH)2 (that is transformed in Zn(OH)42+) can be mistaken with hexagonal phase ZnO. Also, in EDS mapping (shown in Figure S11), it is possible to observe some nanoparticles with a large Zn signal, that can be attributed either to Zn(OH)2 or to Zn2SnO4. As such, the possibility of having Zn(OH)2 cannot be discarded. This emphasizes the difficulty of obtaining only one phase and one type of ZTO nanostructure using a solution-based method and the demand for a well-controlled synthesis process.
In the case of using the ZnAc precursor, for synthesis of 12 h or longer, the XRD pattern (Figure 5a) seems to be similar (evidencing ZnSnO3 nanowires) with a higher crystallinity for the longer synthesis when compared to 12 h. SEM images (Figure 6) show that longer nanowires are obtained for 36 h or 48 h long synthesis. Table 1 shows the lengths of the nanowires for both precursors, emphasizing this observation. On the other hand, when using ZnCl2, while nanowires’ lengths increase up to around 18 h or 24 h, these start to significantly decrease for longer synthesis (Figure 6, Table 1). It can be observed through XRD data (Figure 5) that when synthesis is 36 h or longer, ZnSnO3 phase transformation into Zn2SnO4 and SnO2 starts to occur, in a similar trend to that seen in the previous section for the increase of temperature beyond 200 °C, causing the diminishing of the nanowires’ length.
It can be induced that, due to the ZnCl2′s higher solubility in ethylenediamine, the evolution of the phases happens faster when this precursor is used. While for ZnCl2, a phase transformation of ZnSnO3 to Zn2SnO4 and SnO2 starts to occur at 36 h, for ZnAc, a pronounced length increase is still observed up to 36 h, supporting the assumption that a slower reaction is taking place when using ZnAc precursor. While this results in an increased synthesis time to achieve longer nanowires, these are significantly longer (more than 2x) than when using ZnCl2. Nevertheless, for 48 h, there is a small deterioration in terms of nanowire length and homogeneity of the nanostructures’ phases, thus 36 h is the optimal reaction time for the conditions studied.
In summary, in Figure 6, one can clearly visualize the large dependency of the nanostructures’ growth with the increase of reaction time. For both precursors, it is clear that at least 12 h are necessary to start producing predominantly ZnSnO3 nanowires, being that only after 24 h this production starts being homogeneous. It is also possible to observe that, similarly to what was concluded with previous studies on the influence of the chemical parameters [50], the ZTO nanostructures obtained using ZnAc are generally smaller than those obtained using ZnCl2, for synthesis up to 24 h. When using ZnAc, the ZTO growth is slower so the higher dimensions are obtained for longer reaction times (36 h and 48 h), for which the nanowires reach higher dimensions than that those obtained with ZnCl2. This difference in the optimal reaction time can be attributed to the lower solubility of ZnAc when compared with ZnCl2 in the solvent ethylenediamine. This also leads to a constant presence of SnO2 for the syntheses with ZnAc, while when using ZnCl2, ZnO is constantly observed. This study shows that if longer nanowires are desired, ZnAc is the most suitable precursor, while if faster processing is desired, the most suitable precursor is ZnCl2.

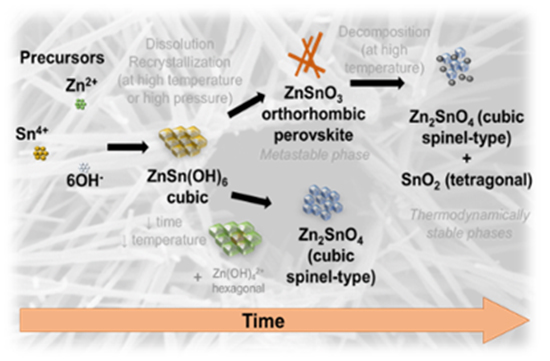
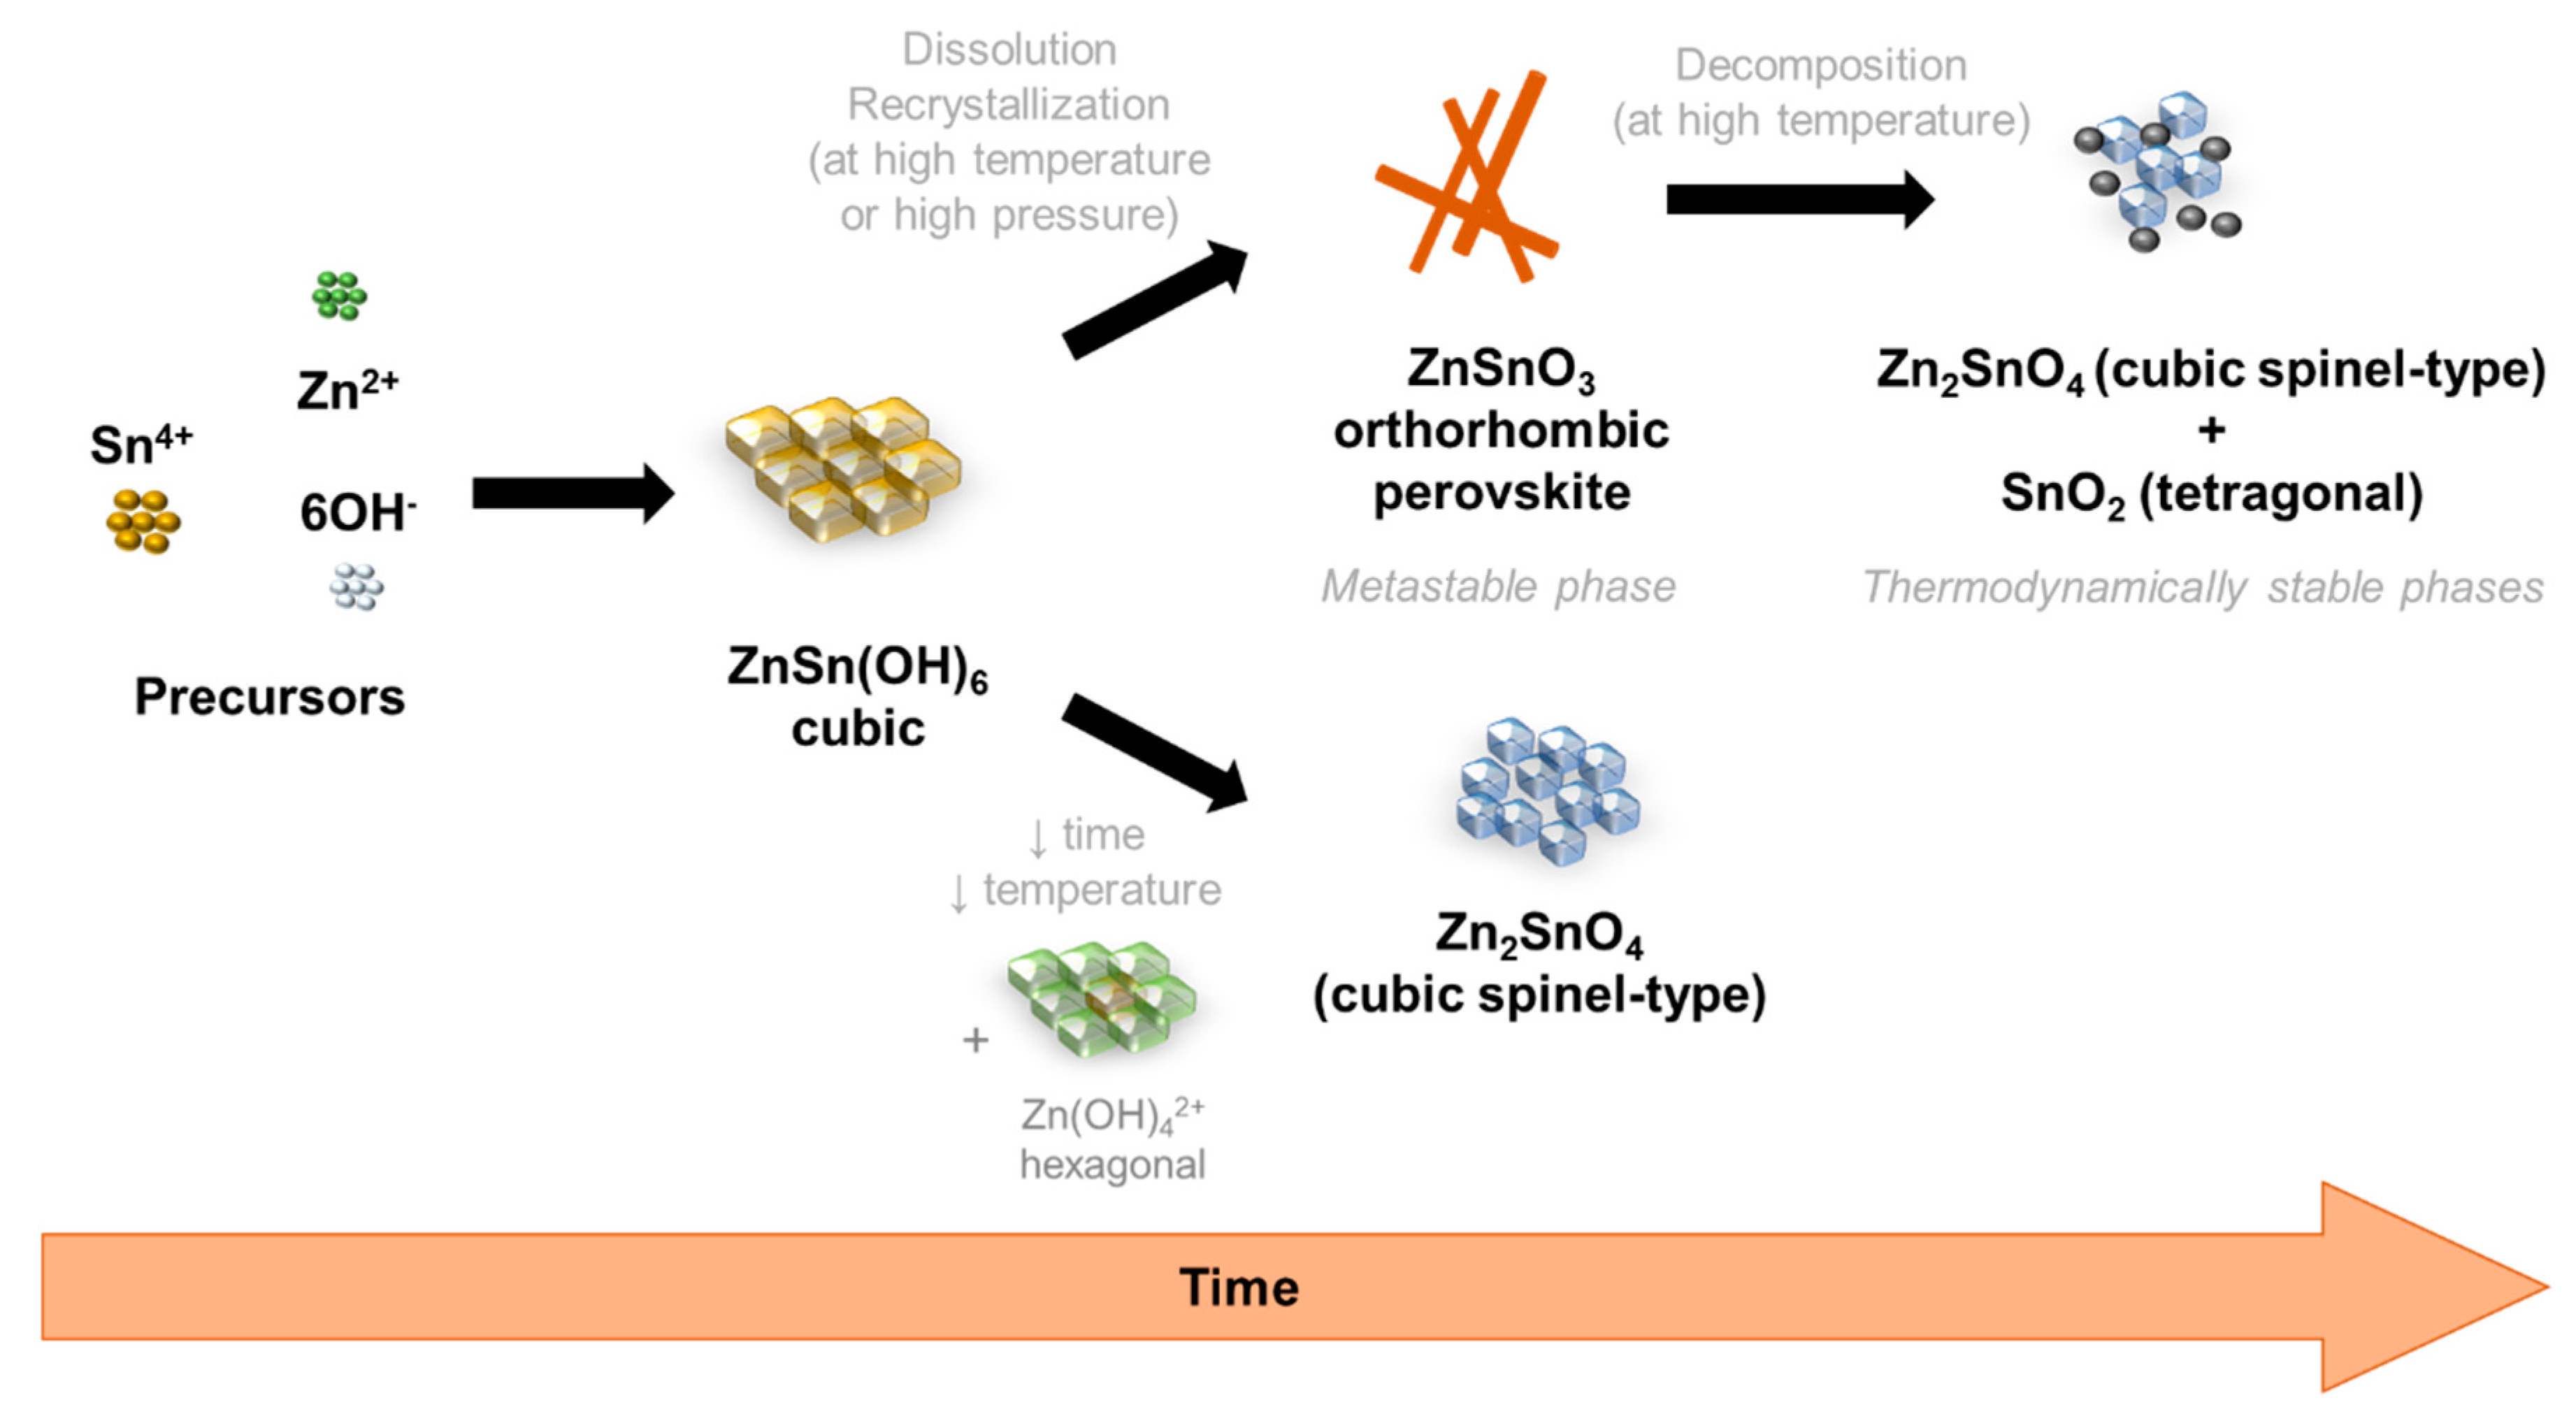
3.4. Growth Mechanism of ZnSnO3 Nanowires

Throughout the reaction time one of the main challenges in nanomaterials synthesis is to understand how the nanostructures grow, i.e., what are the mechanisms behind the formation of each phase and of each type of nanostructures. Obtaining only one phase and one shape is not an easy task, particularly for the Zn:Sn:O system due to its ternary composition, as evident throughout this manuscript. In the specific case of ZnSnO3 nanowires formation, the metastability of this phase adds even more complexity into understanding it properly. Gou et al. showed the influence of pressure and temperature in the enthalpy energy of different ZTO phases, including ZnSnO3 cubic perovskite, concluding that the formation of this phase is not favorable under ambient conditions and can only be obtained under high pressure and temperature [61]. However, under those conditions, this phase tends to decompose into Zn2SnO4 and SnO2 [70]. Therefore, a very specific tailoring of the synthesis parameters is necessary when aiming to achieve proper structures of this metastable phase.
Owing to the careful optimization of the chemico-physical parameters performed here, it is possible to observe an evolution of the nanostructures, and its respective phase, with the increase of reaction time and increase of total energy available in the reaction. Although the aim was to achieve ZnSnO3 nanowires, Zn2SnO4 nanostructures were also obtained, mainly for very short synthesis or for synthesis with lower temperatures or volumes, showing that this phase is achieved with lower available energy. These trends are represented in the Figure 7.

4. Conclusions

Due to its complexity, the synthesis of multicomponent oxide nanostructures requires an appropriate understanding of the influence of each synthesis’ parameters and the growth mechanism itself. In this work, a detailed study on the influence of physical parameters on the hydrothermal synthesis of ZnSnO3 nanowires is reported. Specifically, the effect of reaction mixture volume, synthesis temperature and reaction time were studied. The available energy in the reaction revealed to be one of the determinant factors on the final products. As already reported in the literature, the metastable ZnSnO3 requires high pressures/energy conditions to be obtained. It was found that independently of the Zn source, ZTO nanostructures had the same time-dependence growth mechanisms, although with different time spans.
While previous reports have shown the degradation of the metastable ZnSnO3 structures at temperatures above 500 °C, the present work demonstrates that owing to the high energy of the hydrothermal process, this decomposition can occur at considerably lower temperatures (24 h at 220 °C) and/or longer reaction times (36 h at 200 °C). This highlights the advantages of hydrothermal processes to obtain metastable multicomponent nanostructures such as ZnSnO3 at low temperatures but also the importance of properly controlling and understanding all the synthesis parameters to achieve the desired structures. With ZnSnO3 finding application as a piezoelectric material, catalyst, active material in gas sensors, resistive switching memories, batteries, and others, we expected this work to have a significant impact in the future of nanotechnology as it describes the synthesis of ZnSnO3 nanowires without either direct growth in substrates or production by vapor phase methods (high temperatures). This new approach brings higher flexibility to the different applications, allowing a higher degree of freedom for integration on different substrates while avoiding contamination from the seed-layer material.

Supplementary Materials

The following are available online at https://www.mdpi.com/2079-4991/9/7/1002/s1, Figures S1, S4, and S9: Raman spectroscopy of the samples related to the studies of volume, temperature, and reaction time, respectively. Figures S2, S3, S6, S7, and S11: SEM images and EDS element analysis, which is used to assist in phases identification of each structure. Figures S5, S8, and S10: FTIR reaction time, synthesis temperature, and all reagents used in the syntheses, respectively.

Author Contributions

Experiments designed, and fabrication/characterization of the nanowires, A.R.; data analysis and manuscript preparation, A.R. and J.M.; supervision of the work and revision of the concept, structure, and content of the different versions of the manuscript until its final form, P.B. and R.B.; funding for the fabrication and characterization facilities and reviewed the final versions of the manuscript, R.M., E.F., and P.B.

Funding

This work is funded by National Funds through FCT - Portuguese Foundation for Science and Technology, Reference UID/CTM/50025/2019 and FCT/MCTES, as well as the doctoral grants research numbers SFRH/BD/131836/2017 and SFRH/BD/122286/2016. This work also received funding from the European Community’s H2020 program under grant agreement No. 716510 (ERC-2016-STG TREND) and No. 685758 (1D-Neon).

Conflicts of Interest

The authors declare no conflict of interest.

References

  1. Schmidt-Mende, L.; MacManus-Driscoll, J.L. ZnO—Nanostructures, defects, and devices. Mater. Today 2007, 10, 40–48. [Google Scholar] [CrossRef]
  2. Kołodziejczak-Radzimska, A.; Jesionowski, T. Zinc Oxide—From synthesis to application: A review. Materials 2014, 7, 2833–2881. [Google Scholar] [CrossRef] [PubMed]
  3. Pimentel, A.; Rodrigues, J.; Duarte, P.; Nunes, D.; Costa, F.M.; Monteiro, T.; Martins, R.; Fortunato, E. Effect of solvents on ZnO nanostructures synthesized by solvothermal method assisted by microwave radiation: A photocatalytic study. J. Mater. Sci. 2015, 50, 5777–5787. [Google Scholar] [CrossRef]
  4. Pimentel, A.; Ferreira, S.; Nunes, D.; Calmeiro, T.; Martins, R.; Fortunato, E. Microwave synthesized ZnO nanorod arrays for UV sensors: A seed layer annealing temperature study. Materials 2016, 9, 299. [Google Scholar] [CrossRef] [PubMed]
  5. Pimentel, A.; Samouco, A.; Nunes, D.; Araújo, A.; Martins, R.; Fortunato, E. Ultra-fast microwave synthesis of ZnO nanorods on cellulose substrates for UV sensor applications. Materials 2017, 10, 1308. [Google Scholar] [CrossRef]
  6. Kiazadeh, A.; Gomes, H.L.; Barquinha, P.; Martins, J.; Rovisco, A.; Pinto, J.V.; Martins, R.; Fortunato, E. Improving positive and negative bias illumination stress stability in parylene passivated IGZO transistors. Appl. Phys. Lett. 2016, 109, 051606. [Google Scholar] [CrossRef]
  7. Bahubalindruni, P.G.; Martins, J.; Santa, A.; Tavares, V.; Martins, R.; Fortunato, E.; Barquinha, P. High-Gain transimpedance amplifier for flexible radiation dosimetry using ingazno tfts. IEEE J. Electron Devices Soc. 2018, 6, 760–765. [Google Scholar] [CrossRef]
  8. Ide, K.; Nomura, K.; Hosono, H.; Kamiya, T. Electronic defects in amorphous oxide semiconductors: A review. Phys. Status Solidi Appl. Mater. Sci. 2019, 1800372, 1–28. [Google Scholar] [CrossRef]
  9. Mancini, L.; Sala, S.; Recchioni, M.; Benini, L.; Goralczyk, M.; Pennington, D. Potential of life cycle assessment for supporting the management of critical raw materials. Int. J. Life Cycle Assess. 2015, 20, 100–116. [Google Scholar] [CrossRef]
  10. Fernandes, C.; Santa, A.; Santos, Â.; Bahubalindruni, P.; Deuermeier, J.; Martins, R.; Fortunato, E.; Barquinha, P. A sustainable approach to flexible electronics with zinc-tin oxide thin-film transistors. Adv. Electron. Mater. 2018, 4, 1800032. [Google Scholar] [CrossRef]
  11. Salgueiro, D.; Kiazadeh, A.; Branquinho, R.; Santos, L.; Barquinha, P.; Martins, R.; Fortunato, E. Solution based zinc tin oxide TFTs: The dual role of the organic solvent. J. Phys. D Appl. Phys. 2017, 50, 065106. [Google Scholar] [CrossRef]
  12. Sun, S.; Liang, S. Morphological zinc stannate: Synthesis, fundamental properties and applications. J. Mater. Chem. A 2017, 5, 20534–20560. [Google Scholar] [CrossRef]
  13. Baruah, S.; Dutta, J. Zinc stannate nanostructures: Hydrothermal synthesis. Sci. Technol. Adv. Mater. 2011, 12, 013004. [Google Scholar] [CrossRef] [PubMed]
  14. Guo, R.; Guo, Y.; Duan, H.; Li, H.; Liu, H. Synthesis of orthorhombic perovskite-type ZnSnO3 single-crystal nanoplates and their application in energy harvesting. ACS Appl. Mater. Interfaces 2017, 9, 8271–8279. [Google Scholar] [CrossRef] [PubMed]
  15. Wu, J.M.; Chen, C.-Y.; Zhang, Y.; Chen, K.-H.; Yang, Y.; Hu, Y.; He, J.-H.; Wang, Z.L. Ultrahigh sensitive piezotronic strain sensors based on a ZnSnO3 nanowire/microwire. ACS Nano 2012, 6, 4369–4374. [Google Scholar] [CrossRef] [PubMed]
  16. Men, H.; Gao, P.; Zhou, B.; Chen, Y.; Zhu, C.; Xiao, G.; Wang, L.; Zhang, M. Fast synthesis of ultra-thin ZnSnO3 nanorods with high ethanol sensing properties. Chem. Commun. 2010, 46, 7581. [Google Scholar] [CrossRef] [PubMed]
  17. Lehnen, T.; Zopes, D.; Mathur, S. Phase-selective microwave synthesis and inkjet printing applications of Zn2SnO4 (ZTO) quantum dots. J. Mater. Chem. 2012, 22, 17732. [Google Scholar] [CrossRef]
  18. Lo, M.-K.; Lee, S.-Y.; Chang, K.-S. Study of ZnSnO3-nanowire piezophotocatalyst using two-step hydrothermal synthesis. J. Phys. Chem. C 2015, 119, 5218–5224. [Google Scholar] [CrossRef]
  19. Mao, Y.; Park, T.-J.; Wong, S.S. Synthesis of classes of ternary metal oxide nanostructures. Chem. Commun. 2005, 5721–5735. [Google Scholar] [CrossRef]
  20. Choi, K.H.; Siddiqui, G.U.; Yang, B.; Mustafa, M. Synthesis of ZnSnO3 nanocubes and thin film fabrication of (ZnSnO3/PMMA) composite through electrospray deposition. J. Mater. Sci. Mater. Electron. 2015, 26, 5690–5696. [Google Scholar] [CrossRef]
  21. Li, Z.; Zhou, Y.; Bao, C.; Xue, G.; Zhang, J.; Liu, J.; Yu, T.; Zou, Z. Vertically building Zn2SnO4 nanowire arrays on stainless steel mesh toward fabrication of large-area, flexible dye-sensitized solar cells. Nanoscale 2012, 4, 3490–3494. [Google Scholar] [CrossRef] [PubMed]
  22. Kim, S.; Kim, H.; Janes, D.B.; Ju, S. Interface studies of N2 plasma-treated ZnSnO nanowire transistors using low-frequency noise measurements. Nanotechnology 2013, 24, 305201. [Google Scholar] [CrossRef] [PubMed]
  23. Nakayama, M.; Nogami, M.; Yoshida, M.; Katsumata, T.; Inaguma, Y. First-principles studies on novel polar oxide ZnSnO3; pressure-induced phase transition and electric properties. Adv. Mater. 2010, 22, 2579–2582. [Google Scholar] [CrossRef] [PubMed]
  24. Dal Corso, A.; Posternak, M.; Resta, R.; Baldereschi, A. Ab initio study of piezoelectricity and spontaneous polarization in ZnO. Phys. Rev. B 1994, 50, 10715–10721. [Google Scholar] [CrossRef] [PubMed]
  25. Datta, A.; Mukherjee, D.; Kons, C.; Witanachchi, S.; Mukherjee, P. Evidence of superior ferroelectricity in structurally welded ZnSnO3 nanowire arrays. Small 2014, 10, 4093–4099. [Google Scholar] [PubMed]
  26. Miyauchi, M.; Liu, Z.; Zhao, Z.-G.; Anandan, S.; Hara, K. Single crystalline zinc stannate nanoparticles for efficient photo-electrochemical devices. Chem. Commun. 2010, 46, 1529–1531. [Google Scholar] [CrossRef] [PubMed] [Green Version]
  27. Lei, M.; Sheng, Y.; Wan, L.; Bi, K.; Huang, K.; Jia, R.; Liu, J.; Wang, Y. A novel self-catalytic route to zinc stannate nanowires and cathodoluminescence and electrical transport properties of a single nanowire. J. Alloy. Compd. 2016, 657, 394–399. [Google Scholar] [CrossRef]
  28. Hwang, J.K.; Cho, S.; Dang, J.M.; Kwak, E.B.; Song, K.; Moon, J.; Sung, M.M. Direct nanoprinting by liquid-bridge-mediated nanotransfer moulding. Nat. Nanotechnol. 2010, 5, 742–748. [Google Scholar] [CrossRef]
  29. Lim, T.; Kim, H.; Meyyappan, M.; Ju, S. Photostable Zn2SnO4 nanowire transistors for transparent displays. ACS Nano 2012, 6, 4912–4920. [Google Scholar] [CrossRef]
  30. Siddiqui, G.U.; Rehman, M.M.; Choi, K.H. Enhanced resistive switching in all-printed, hybrid and flexible memory device based on perovskite ZnSnO3 via PVOH polymer. Polymer 2016, 100, 102–110. [Google Scholar] [CrossRef]
  31. Yang, Y.J.; Rehman, M.M.; Siddiqui, G.U.; Na, K.H.; Choi, K.H. Effect of adding a polymer and varying device size on the resistive switching characteristics of perovskite nanocubes heterojunction. Curr. Appl. Phys. 2017, 17, 1733–1741. [Google Scholar] [CrossRef]
  32. Wu, J.M.; Chen, K.-H.; Zhang, Y.; Wang, Z.L. A self-powered piezotronic strain sensor based on single ZnSnO3 microbelts. RSC Adv. 2013, 3, 25184. [Google Scholar] [CrossRef]
  33. Lee, K.Y.; Kim, D.; Lee, J.H.; Kim, T.Y.; Gupta, M.K.; Kim, S.W. Unidirectional high-power generation via stress-induced dipole alignment from ZnSnO3 nanocubes/polymer hybrid piezoelectric nanogenerator. Adv. Funct. Mater. 2014, 24, 37–43. [Google Scholar] [CrossRef]
  34. Wang, G.; Xi, Y.; Xuan, H.; Liu, R.; Chen, X.; Cheng, L. Hybrid nanogenerators based on triboelectrification of a dielectric composite made of lead-free ZnSnO3 nanocubes. Nano Energy 2015, 18, 28–36. [Google Scholar] [CrossRef]
  35. Wu, J.M.; Xu, C.; Zhang, Y.; Yang, Y.; Zhou, Y.; Wang, Z.L. Flexible and transparent nanogenerators based on a composite of lead-free ZnSnO3 triangular-belts. Adv. Mater. 2012, 24, 6094–6099. [Google Scholar] [CrossRef] [PubMed]
  36. Wu, J.M.; Xu, C.; Zhang, Y.; Wang, Z.L. Lead-free nanogenerator made from single ZnSnO3 microbelt. ACS Nano 2012, 6, 4335–4340. [Google Scholar] [CrossRef] [PubMed]
  37. Fu, X.; Wang, X.; Long, J.; Ding, Z.; Yan, T.; Zhang, G.; Zhang, Z.; Lin, H.; Fu, X. Hydrothermal synthesis, characterization, and photocatalytic properties of Zn2SnO4. J. Solid State Chem. 2009, 182, 517–524. [Google Scholar] [CrossRef]
  38. Khan, M.N.; Jaisai, M.; Dutta, J. Photocatalytic inactivation of Escherichia coli using zinc stannate nanostructures under visible light. Adv. Mater. Res. 2015, 1131, 203–209. [Google Scholar] [CrossRef]
  39. Zhao, Q.; Ju, D.; Song, X.; Deng, X.; Ding, M.; Xu, X.; Zeng, H. Polyhedral Zn2SnO4: Synthesis, enhanced gas sensing and photocatalytic performance. Sens. Actuators B Chem. 2016, 229, 627–634. [Google Scholar] [CrossRef]
  40. Wang, Y.-T.; Chang, K.-S. Piezopotential-induced schottky behavior of Zn1−xSnO3 nanowire arrays and piezophotocatalytic applications. J. Am. Ceram. Soc. 2016, 99, 2593–2600. [Google Scholar] [CrossRef]
  41. Biswas, A.; Saha, S.; Jana, N.R. ZnSnO3 nanoparticle-based piezocatalysts for ultrasound-assisted degradation of organic pollutants. ACS Appl. Nano Mater. 2019, 2, 1120–1128. [Google Scholar] [CrossRef]
  42. Chen, Z.; Cao, M.; Hu, C. Novel Zn2SnO4 hierarchical nanostructures and their gas sensing properties toward ethanol. J. Phys. Chem. C 2011, 115, 5522–5529. [Google Scholar] [CrossRef]
  43. Singh, R.; Yadav, A.K.; Gautam, C. Synthesis and humidity sensing investigations of nanostructured ZnSnO3. J. Sens. Technol. 2011, 1, 116–124. [Google Scholar] [CrossRef]
  44. Tharsika, T.; Haseeb, A.S.M.A.; Akbar, S.A.; Sabri, M.F.M.; Wong, Y.H. Gas sensing properties of zinc stannate (Zn2SnO4) nanowires prepared by carbon assisted thermal evaporation process. J. Alloys Compd. 2015, 618, 455–462. [Google Scholar] [CrossRef]
  45. Pang, C.; Yan, B.; Liao, L.; Liu, B.; Zheng, Z.; Wu, T.; Sun, H.; Yu, T. Synthesis, characterization and opto-electrical properties of ternary Zn2SnO4 nanowires. Nanotechnology 2010, 21, 465706. [Google Scholar] [CrossRef] [PubMed]
  46. Chen, D.; Liu, Z.; Liang, B.; Wang, X.; Shen, G. Transparent metal oxide nanowire transistors. Nanoscale 2012, 4, 3001–3012. [Google Scholar] [CrossRef] [PubMed]
  47. Shankar, K.S.; Raychaudhuri, A.K. Fabrication of nanowires of multicomponent oxides: Review of recent advances. Mater. Sci. Eng. C 2005, 25, 738–751. [Google Scholar] [CrossRef]
  48. Ji, X.; Huang, X.; Liu, J.; Jiang, J.; Li, X.; Ding, R.; Hu, Y.; Wu, F.; Li, Q. Hydrothermal synthesis of novel Zn2SnO4 octahedron microstructures assembled with hexagon nanoplates. J. Alloys Compd. 2010, 503, L21–L25. [Google Scholar] [CrossRef]
  49. Zeng, J.; Xin, M.; Li, K.; Wang, H.; Yan, H.; Zhang, W. Transformation process and photocatalytic activities of hydrothermally synthesized Zn2SnO4 nanocrystals. J. Phys. Chem. C 2008, 112, 4159–4167. [Google Scholar] [CrossRef]
  50. Rovisco, A.; Branquinho, R.; Martins, J.; Oliveira, M.J.; Nunes, D.; Fortunato, E.; Martins, R.; Barquinha, P. Seed-layer free zinc tin oxide tailored nanostructures for nanoelectronic applications: Effect of chemical parameters. ACS Appl. Nano Mater. 2018, 1, 3986–3997. [Google Scholar] [CrossRef]
  51. Su, B.; Wu, Y.; Jiang, L. The art of aligning one-dimensional (1D) nanostructures. Chem. Soc. Rev. 2012, 41, 7832. [Google Scholar] [CrossRef] [PubMed]
  52. Christian, B.; Volk, J.; Lukàcs, I.E.; Sautieff, E.; Sturm, C.; Graillot, A.; Dauksevicius, R.; O’Reilly, E.; Ambacher, O.; Lebedev, V. Piezo-force and vibration analysis of ZnO nanowire arrays for sensor application. Procedia Eng. 2016, 168, 1192–1195. [Google Scholar] [CrossRef]
  53. Fu, Y.; Nie, Y.; Zhao, Y.; Wang, P.; Xing, L.; Zhang, Y.; Xue, X. Detecting Liquefied Petroleum Gas (LPG) at room temperature using ZnSnO3ZnO nanowire piezo-nanogenerator as self-powered gas sensor. ACS Appl. Mater. Interfaces 2015, 7, 10482–10490. [Google Scholar] [CrossRef] [PubMed]
  54. Xue, X.Y.; Chen, Y.J.; Wang, Y.G.; Wang, T.H. Synthesis and ethanol sensing properties of ZnSnO3 nanowires. Appl. Phys. Lett. 2005, 86, 1–3. [Google Scholar] [CrossRef]
  55. Wang, L.; Zhou, T.; Zhang, R.; Lou, Z.; Deng, J.; Zhang, T. Comparison of toluene sensing performances of zinc stannate with different morphology-based gas sensors. Sens. Actuators B Chem. 2016, 227, 448–455. [Google Scholar] [CrossRef]
  56. Zhang, T.; Zhang, T.; Zhang, R.; Deng, J.; Lu, G.; Wang, L. Highly sensitive sensing platform based on ZnSnO3 hollow cubes for detection of ethanol. Appl. Surf. Sci. 2017, 400, 262–268. [Google Scholar]
  57. Najam Khan, M.; Al-Hinai, M.; Al-Hinai, A.; Dutta, J. Visible light photocatalysis of mixed phase zinc stannate/zinc oxide nanostructures precipitated at room temperature in aqueous media. Ceram. Int. 2014, 40, 8743–8752. [Google Scholar] [CrossRef]
  58. Mali, S.S.; Su Shim, C.; Kook Hong, C. Highly porous Zinc Stannate (Zn2SnO4) nanofibers scaffold photoelectrodes for efficient methyl ammonium halide perovskite solar cells. Sci. Rep. 2015, 5, 11424. [Google Scholar] [CrossRef] [PubMed]
  59. Siddiqui, G.U.; Rehman, M.M.; Choi, K.H. Resistive switching phenomena induced by the heterostructure composite of ZnSnO3 nanocubes interspersed ZnO nanowires. J. Mater. Chem. C 2017, 5, 5528–5537. [Google Scholar] [CrossRef]
  60. Cheng, B.; Ouyang, Z.; Chen, C.; Xiao, Y.; Lei, S. Individual Zn2SnO4-sheathed ZnO heterostructure nanowires for efficient resistive switching memory controlled by interface states. Sci. Rep. 2013, 3, 3249. [Google Scholar] [CrossRef] [PubMed]
  61. Gou, H.; Zhang, J.; Li, Z.; Wang, G.; Gao, F.; Ewing, R.C.; Lian, J. Energetic stability, structural transition, and thermodynamic properties of ZnSnO3. Appl. Phys. Lett. 2011, 98, 1–4. [Google Scholar] [CrossRef]
  62. Montenegro, D.N.; Hortelano, V.; Martínez, O.; Martínez-Tomas, M.C.; Sallet, V.; Muñoz-Sanjosé, V.; Jiménez, J. Non-radiative recombination centres in catalyst-free ZnO nanorods grown by atmospheric-metal organic chemical vapour deposition. J. Phys. D Appl. Phys. 2013, 46, 235302. [Google Scholar] [CrossRef]
  63. Chen, Y.; Yu, L.; Li, Q.; Wu, Y.; Li, Q.; Wang, T. An evolution from 3D face-centered-cubic ZnSnO3 nanocubes to 2D orthorhombic ZnSnO3 nanosheets with excellent gas sensing performance. Nanotechnology 2012, 23, 415501. [Google Scholar] [CrossRef] [PubMed]
  64. Song, P.; Wang, Q.; Yang, Z. Biomorphic synthesis of ZnSnO3 hollow fibers for gas sensing application. Sens. Actuators B Chem. 2011, 156, 983–989. [Google Scholar] [CrossRef]
  65. Wang, Y.; Gao, P.; Bao, D.; Wang, L.; Chen, Y.; Zhou, X.; Yang, P.; Sun, S.; Zhang, M. One pot, two phases: Individual orthorhombic and face-centered cubic ZnSnO3 obtained synchronously in one solution. Inorg. Chem. 2014, 53, 12289–12296. [Google Scholar] [CrossRef] [PubMed]
  66. Placke, A.; Kumar, A.; Priya, S. Synthesis and behavior of cetyltrimethyl ammonium bromide stabilized Zn1 + xSnO3 + x (0 ≤ x ≤ 1) nano-crystallites. PLoS ONE 2016, 11, e0156246. [Google Scholar] [CrossRef]
  67. Bora, T.; Al-Hinai, M.H.; Al-Hinai, A.T.; Dutta, J. Phase transformation of metastable ZnSnO3 upon thermal decomposition by in-situ temperature-dependent raman spectroscopy. J. Am. Ceram. Soc. 2015, 98, 4044–4049. [Google Scholar] [CrossRef]
  68. Kumari, V.; Patra, A.K.; Bhaumik, A. Self-assembled ultra-small zinc stannate nanocrystals with mesoscopic voids via a salicylate templating pathway and their photocatalytic properties. RSC Adv. 2014, 4, 13626–13634. [Google Scholar] [CrossRef]
  69. Saafi, I.; Dridi, R.; Mimouni, R.; Amlouk, A.; Yumak, A.; Boubaker, K.; Petkova, P.; Amlouk, M. Microstructural and optical properties of SnO2-ZnSnO3 ceramics. Ceram. Int. 2016, 42, 6273–6281. [Google Scholar] [CrossRef]
  70. Mary Jaculine, M.; Justin Raj, C.; Jerome Das, S. Hydrothermal synthesis of highly crystalline Zn2SnO4 nanoflowers and their optical properties. J. Alloys Compd. 2013, 577, 131–137. [Google Scholar] [CrossRef]
Figure 1. XRD patterns when using (a) ZnCl2 precursor (with 2:1 Zn:Sn ratio) and (b) ZnAc precursor (with 1:1 Zn:Sn ratio), for different solution mixture volumes (7.5 mL, 11 mL, and 15 mL). Identification following ICDD card 00-028-1486 (ZnSnO3-orth, deleted), 00-024-1470 (Zn2SnO4), 01-077-0452 (SnO2), and 00-06-1451 (ZnO).
Nanomaterials 09 01002 g001
Figure 2. SEM images of nanostructures obtained for different reaction mixture volumes, 7.5 mL, 11 mL, and 15 mL, using ZnCl2 and ZnAc as zinc precursor.
Nanomaterials 09 01002 g002
Figure 3. SEM images of the nanostructures obtained using the previous best conditions (15 mL) for each zinc precursor (ZnCl2 and ZnAc) at different temperatures: 150 °C, 180 °C, 200 °C, and 220 °C.
Nanomaterials 09 01002 g003
Figure 4. XRD patterns when using (a) ZnCl2 precursor (with 2:1 Zn:Sn ratio) and (b) ZnAc precursor (with 1:1 Zn:Sn ratio), at different temperatures: 150 °C, 180 °C, 200 °C, and 220 °C. Identification following ICDD card 00-028-1486 (ZnSnO3-orth—deleted), 00-011-0274 (ZnSnO3-fcc), 00-024-1470 (Zn2SnO4), 01-077-0452 (SnO2), and 00-06-1451 (ZnO).
Nanomaterials 09 01002 g004
Figure 5. XRD patterns when using (a) ZnCl2 precursor (with 2:1 Zn:Sn ratio) and (b) ZnAc precursor (with 1:1 Zn:Sn ratio), for different reaction time: 2 h, 8 h, 12 h, 18 h, 24 h, 36 h, and 48 h. Syntheses at 200 °C, using 15 mL of reaction mixture volume. Identification following ICDD cards: 00-028-1486 (ZnSnO3-orth—deleted), 00-011-0274 (ZnSnO3-fcc), 00-024-1470 (Zn2SnO4), 01-077-0452 (SnO2), 00-06-1451 (ZnO), and 00-048-1066 (Zn(OH)2).
Nanomaterials 09 01002 g005
Figure 6. SEM images of the nanostructures obtained by synthesis using ZnCl2 (a) and ZnAc (b) with different reaction time, showing the temporal evolution of the structures produced. Syntheses at 200 °C, using 15 mL of reaction mixture volume.
Nanomaterials 09 01002 g006
Figure 7. Schematic representation of the phase transformations on the hydrothermal synthesis of zinc-tin oxide (ZTO) nanostructures, depending on the energy available in the reaction and the time of synthesis.
Nanomaterials 09 01002 g007
Table 1. Evolution of the average of nanowires’ length with the reaction time.
Reaction Time (h)Nanowires’ Length (nm)
ZnCl2ZnAc
24605 ± 75540 ± 175
36420 ± 1151090 ± 250
48220 ± 35950 ± 190

