Article

Photoelectrocatalytic Hydrogen Generation Enabled by CdS Passivated ZnCuInSe Quantum Dot-Sensitized TiO2 Decorated with Ag Nanoparticles

1
College of Chemistry and Environmental Engineering, Pingdingshan University, Pingdingshan 467000, China
2
State Key Laboratory of Chemo/Biosensing and Chemometrics, Hunan University, Changsha 410082, China
3
College of Chemistry and Molecular Engineering, Zhengzhou University, Zhengzhou 450000, China
*
Authors to whom correspondence should be addressed.
Nanomaterials 2019, 9(3), 393; https://doi.org/10.3390/nano9030393
Submission received: 21 January 2019 / Revised: 28 February 2019 / Accepted: 1 March 2019 / Published: 8 March 2019
(This article belongs to the Special Issue Applications of Quantum Dots)

Abstract

:
Here we present the photoelectrocatalytic hydrogen generation properties of CdS passivated ZnCuInSe (ZCISe) quantum dots (QDs) supported by TiO2 nanowires decorated with Ag nanoparticles. In this configuration, Ag nanoparticles were sandwiched between the photo-electrons collector (TiO2) and photo-sensitizers (ZCISe), and acted as an electron relay speeding up the charge carrier transport. ZCISe and CdS enabled the optical absorption of the photoelectrode ranging from ultraviolet to near infrared region, which significantly enhanced the solar-to-chemical energy conversion efficiency. A photocurrent of 10.5 mA/cm2 and a hydrogen production rate of about 52.9 μmol/h were achieved under simulated sunlight (1.5 AG).

Graphical Abstract

1. Introduction

Hydrogen generation by solar energy water splitting with a semiconductor photocatalyst is an interesting way to use renewable resources [1,2,3]. The solar-to-chemical energy conversion efficiency for a given photocatalyst is heavily dependent on light absorption and the rate between charge carriers separation (or migration to the surface) and electron-hole recombination [4,5,6,7], with an ideal semiconductor photocatalyst that presents high absorption and charge carriers separation. Hence, many semiconductor photocatalytic materials have been exploited for sustainable development. TiO2 is still the most widely used semiconductor due to its chemical stability, low cost, and good catalytic activity. For instance, Minero studied the relationship between light absorption and degradation rate in four TiO2 specimens, which was helpful for the degradation of formic acid at a low concentration [8]. TiO2 was also employed by Emeline to research the effects of light intensity and phenol concentration on the degradation [9]. Lasa researched plenty of work on photocatalysis and concluded that TiO2 photocatalysis also depended on the crystal structure of TiO2, cocatalyst, substrates, and sacrificial agents [10]. Using the sol-gel method, Rusinque and co-worker prepared mesoporous TiO2 for photocatalysis and hydrogen production reaching up to 210 cm3 STP (standard temperature and pressure) when using the 1.00 wt%-Pd on TiO2 [11]. However, TiO2 can only absorb the UV light due to wide bandgap, therefore limiting the overall efficiency [12,13]. In order to extend its light absorption into the visible light region, a narrow bandgap semiconductor combined with TiO2 has been used to form a heterostructure [14]. I-III-VI2 group QDs, such as CuInS2, CuInSe2, AgInS2, AgInSe2, etc., displayed narrow band gap, small self-absorption, large coefficient, and luminescence of the near-infrared wavelength region, and they have been successfully utilized in photocatalysis [15]. To adjust the light-harvesting ability and efficiency, various doped QDs were developed, such as Zn-Cu-In-Se, CuInSexS2−x, and Cu-In-Ga-Se [16,17,18]. Zhong’s group doped CuInSe (CISe) QDs with the Zn ion, and successfully located the absorption spectra at a near-infrared region, demonstrating a PCE (photoelectric conversion efficiency) of 11.6% [18]. Subsequently, efficiency was further enhanced to 12% using the nitrogen-doped mesoporous carbon counter electrode in ZnCuInSe (ZCISe) QDs sensitized solar cells [19]. Inspired by such remarkable performance in photo-electricity conversion, we improved the photocatalytic H2 generation efficiency in a photo-electrochemical cell by placing the relatively less novel silver nanoparticles (Ag NPs) between the photo-electrons collector of one-dimensional TiO2 nanowires and the photo-sensitizers of CdS passivated ZCISe QDs. In such a configuration, Ag NPs can not only efficiently reserve the photo-generated hot electrons and reduce charge recombination, thereby enhancing photocatalytic activity [20], but also work with engineered optical and catalytic properties to activate and speed up steady-state photocatalytic reactions [21].

2. Experimental Section

2.1. Chemicals

Se powder (200 mesh, 99.99%), copper chloride (CuCl, 99.998%), Oleylamine (OAm, 80%–90%), 1-Dodecanethiol (DDT, 98%), and 1-octadecene (ODE, 90%) were purchased from Aladdin. Indium(III) chloride tetrahydrate (InCl3.4H2O, 99.99%) were received from Energy Chemical. Zinc chloride (ZnCl2, 99.9%) was obtained from Alfa Aesar (Zhengzhou, China). All chemicals were used as received without further processing. Deionized water with a resistance of 18.3 MΩ·cm was used in the experiment.

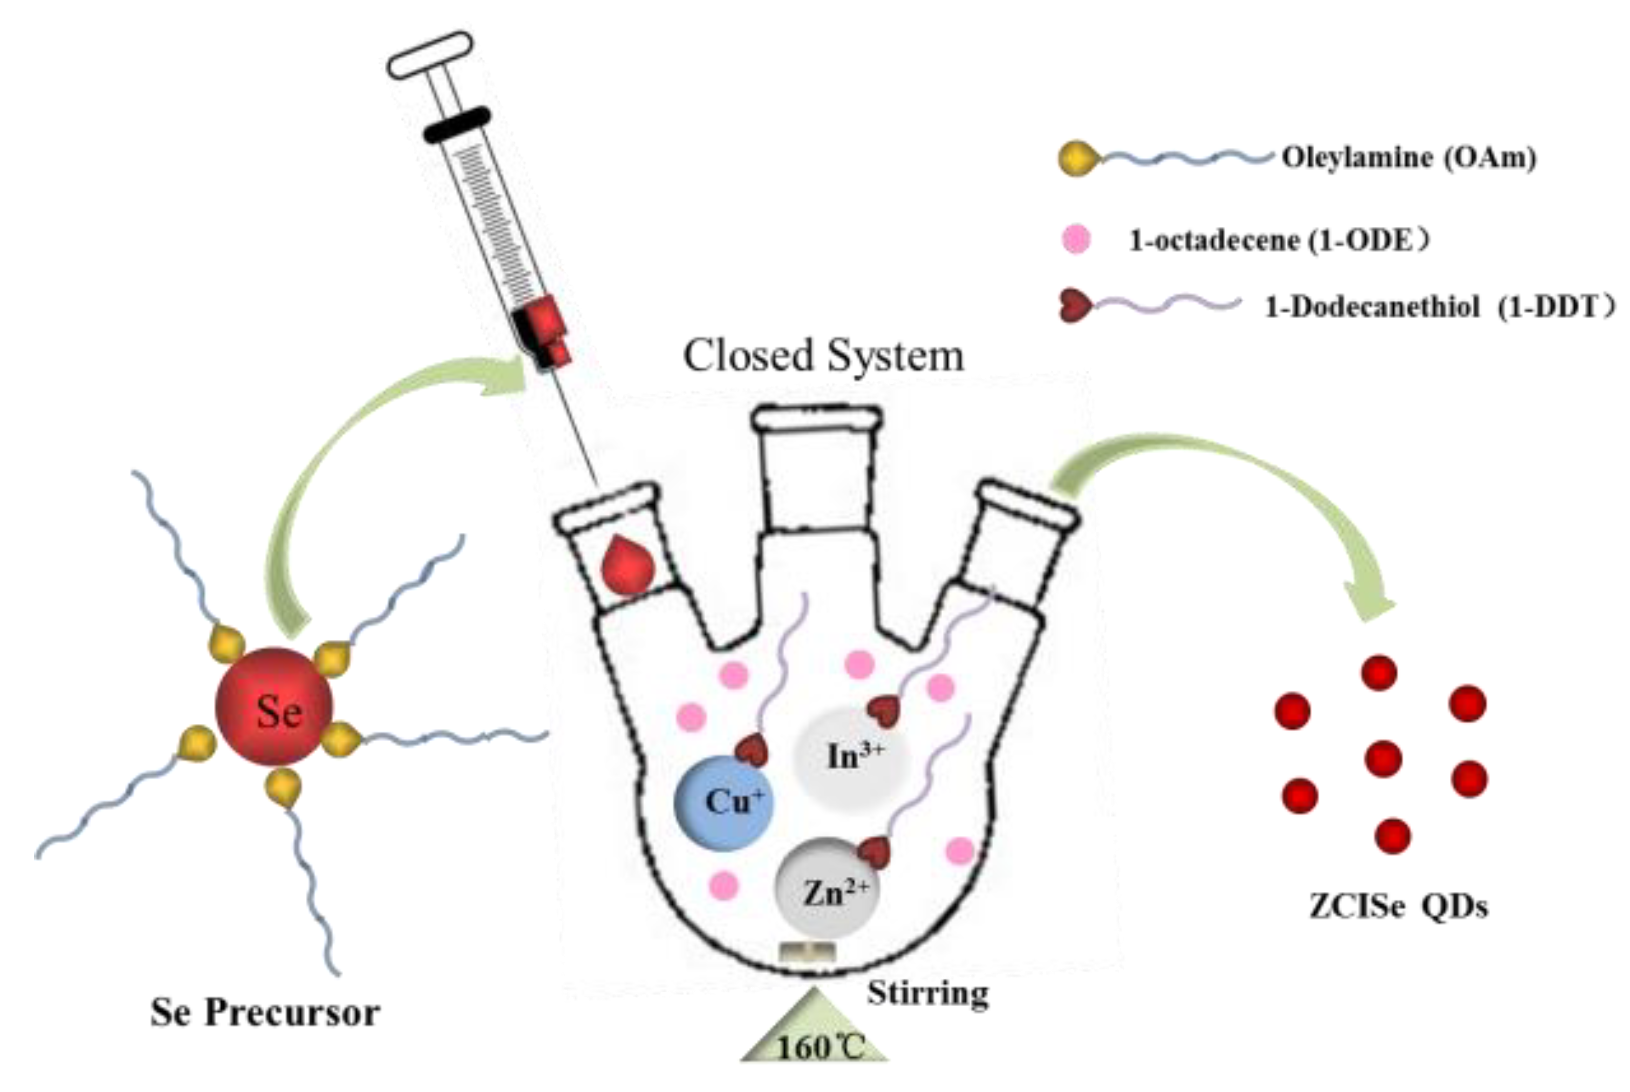
2.2. Preparation of ZCISe QDs

The ZCISe QDs were prepared by a hot-injection technique [18]. A mixture containing 3 mL DDT, 1 mL ODE, and 5 mL OAm was added to a 20 mL three-neck flask containing ZnCl2 (0.05 mmol), CuCl (0.03 mmol), and InCl3.4H2O (0.1 mmol) under a nitrogen atmosphere. The mixture was heated to 160 °C at a rate of 15 °C/min. Then, the Se (Se powder, 0.3 mmol) precursor solution with 0.1 mL OAm and 1 mL DDT, was injected into the flask. After remaining at 160 °C for a definite amount of time (10 min, 20 min, 30 min), the mixture was cooled in an ice bath. After 20 min, the nanocrystals were precipitated with excess ethanol and centrifuged at 6000 rpm for 5 min. Then, the supernatant was discarded, and the precipitate was redispersed with 3 mL dichloromethane. After centrifugation at 10,000 rpm for 10 min, the supernatant was collected and stored at 4 °C.

2.3. Decoration of Ag NPs on TiO2 Nanowires

TiO2 nanowires were synthesized based on our previous method [22]. For the decoration of Ag NPs, TiO2 nanowires were immersed in 0.002 M AgNO3 aqueous solution and exposed to ultraviolet light at different times (5 min, 10 min, 15 min, 20 min, 25 min) [23]. Then, the Ag NPs loaded on the TiO2 nanowires were washed with ultrapure water three times.

2.4. Loading ZCISe QDs on TiO2/Ag

ZCISe QDs were decorated on the TiO2/Ag nanowires by dropping 20 μL ZCISe QD solution in CCl3 onto the nanowires, and then dried in an oven at 50 °C. This process can be repeated several times to get the optimal loading of ZCISe QDs. Finally, the electrode was annealed at 450 °C in an N2 flow for 30 min to improve the crystalline and stability.

2.5. Fabrication of TiO2/Ag/ZCISe/CdS Nanocomposite

CdS NPs were deposited on the TiO2/Ag/ZCISe composite with a successive ionic layer adsorption and reaction (SILAR) method to decrease the surface defects of the ZCISe QDs. In brief, 0.05 M cadmium nitrate in ethanol was used as cation source, and 0.05 M sodium sulfide in methanol/water (1/1) was used as anion source. The TiO2/Ag/ZCISe nanocomposite was immersed in Cd precursor for one minute followed by flushing with ethanol, and then immersed in sodium sulfide precursor for another minute followed by rinsing with methanol. This counted as one SILAR cycle. For the present work, this process was repeated for 5 cycles.

2.6. Characterization

UV-vis absorption measurements were obtained on a Shimadzu-NIR-2550 spectrophotometer (Guangzhou, China). Photoluminescence (PL) spectra were recorded on a Hitachi F-7000 fluorescence spectrophotometer (Hitachi High-Tech, Tokyo, Japan). The structure of the ZCISe QDs was identified via an X-ray diffractometer (XRD) on a D8 advance (Bruker, AXS, Madison, WI, USA) with Cu–Ka radiation. The morphology of the sample was characterized by scanning electron microscopy (SU8010, Hitachi, Hong Kong, China) and transmission electron microscopy (Tecnai G2 F20 S-Twin, FEI, Hillsboro, OR, USA). Elemental analysis was carried out on an energy disperse X-ray spectrometer (EDX) fitted with TEM. The performances were measured with a CHI electrochemical workstation (CHI660E, Shanghai Chenhua Instrument Co. Ltd., Shanghai, China). The light source was a 300 W Xe lamp equipped with a band pass filter at 500 nm with a bandwidth (full width at half maximum) of 15 nm to remove IR and UV radiations, and a cutoff filter for eliminating radiation below 800 nm, respectively.

2.7. Photoelectrochemical Performance and Hydrogen Generation Test

The photoelectrochemical test was carried out in a standard three-electrode system composed of an Ag/AgCl reference, a Pt sheet counter electrode, and samples of the working electrode in an electrolyte containing 0.35 M Na2SO3 and 0.24 M Na2S, which was purged with N2 for 30 min prior to measurements. The incident light from a 300 W Xe lamp was filtered to match the AM 1.5 G spectrum. The hydrogen production test was essentially the same as the material’s performance test, except the electrolyte was replaced with pure water. The amount of hydrogen gas generated during 6 h of irradiation was collected in a home-made device [24].

3. Results and Discussion

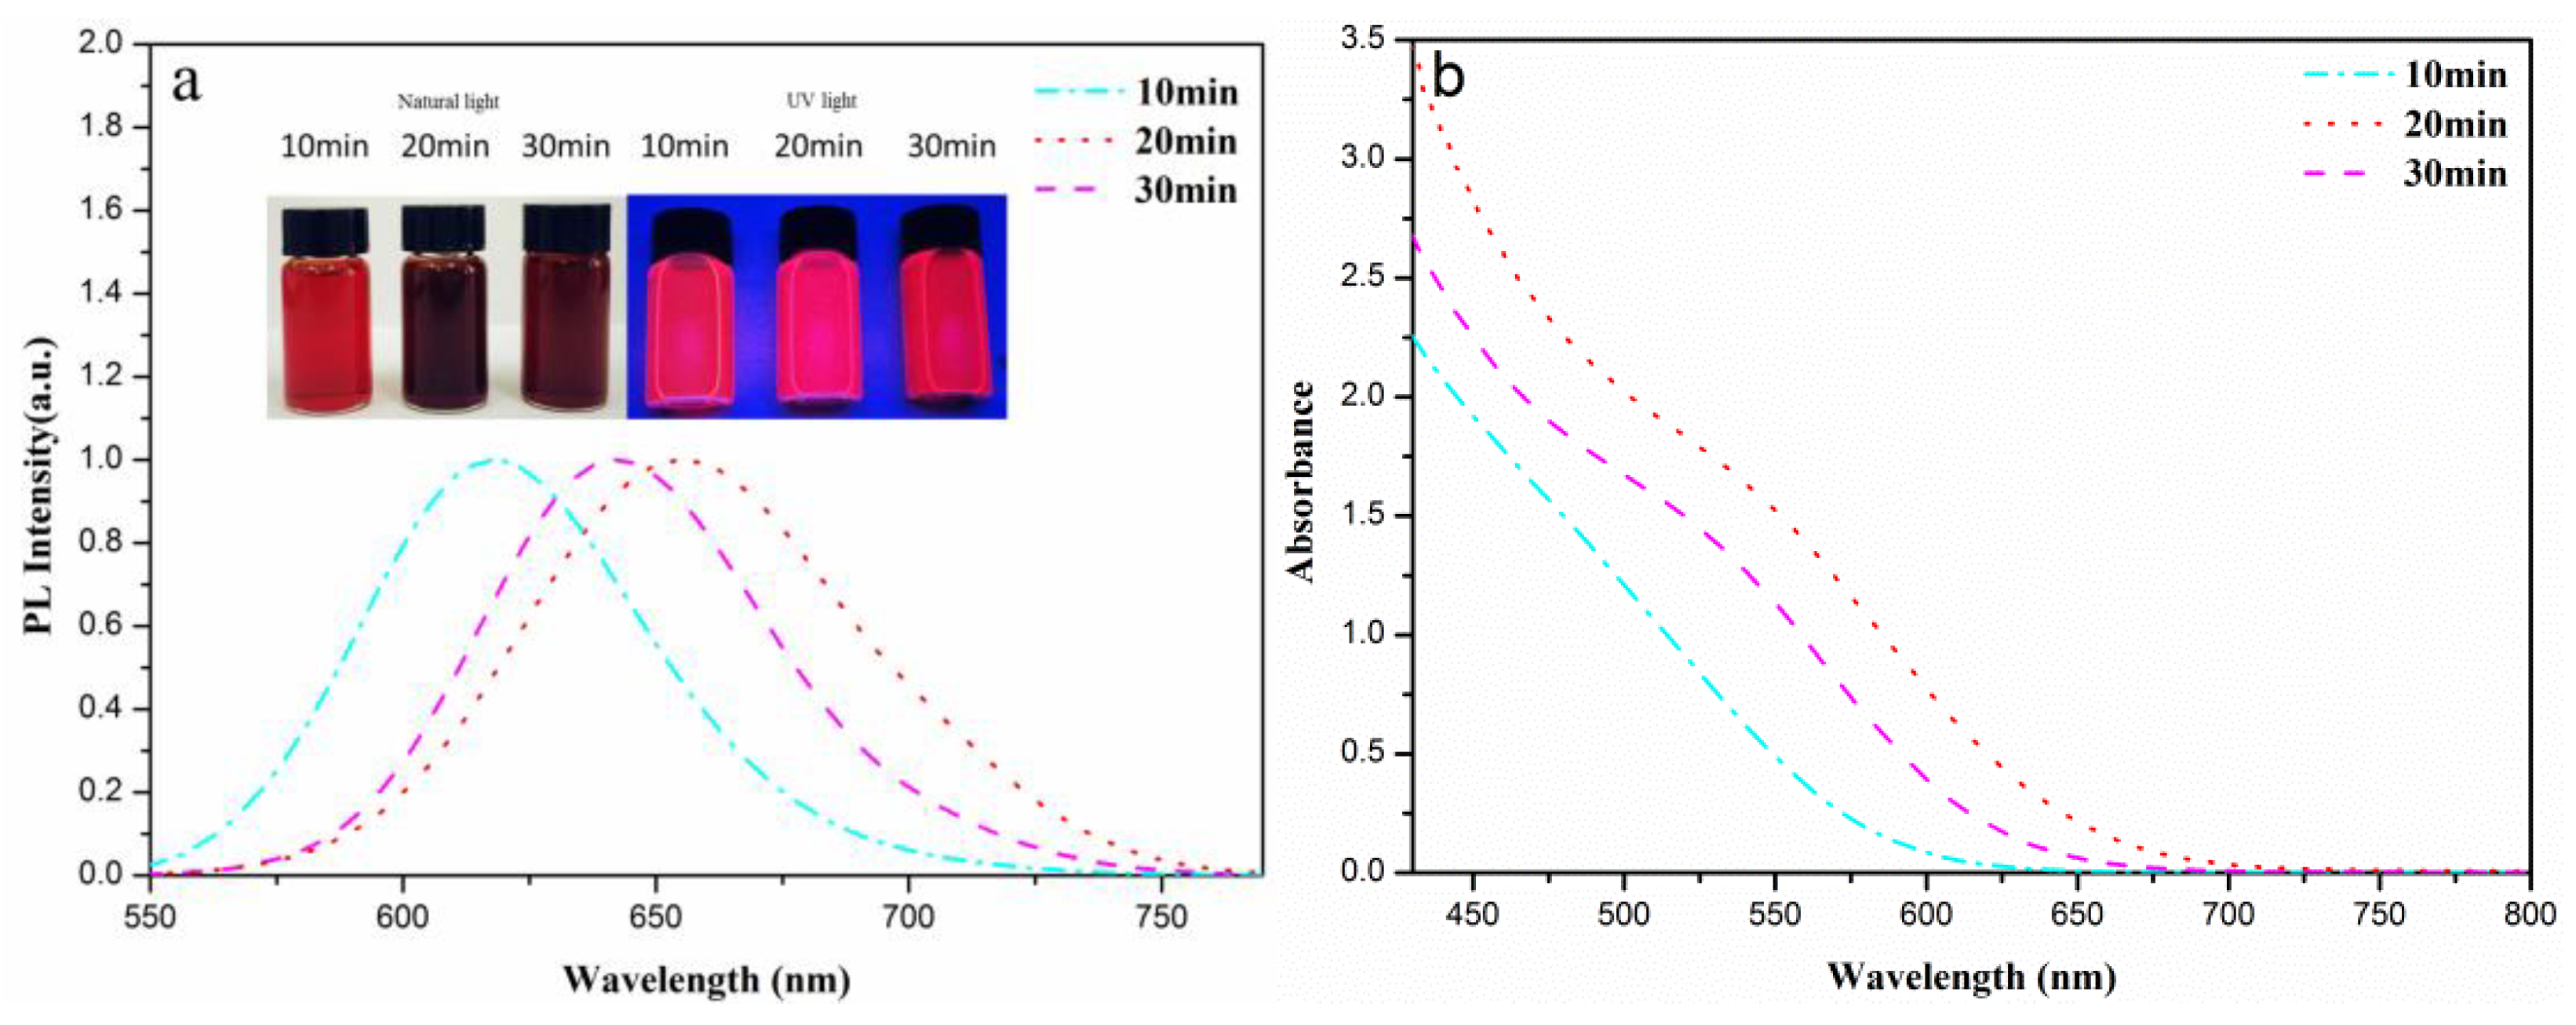
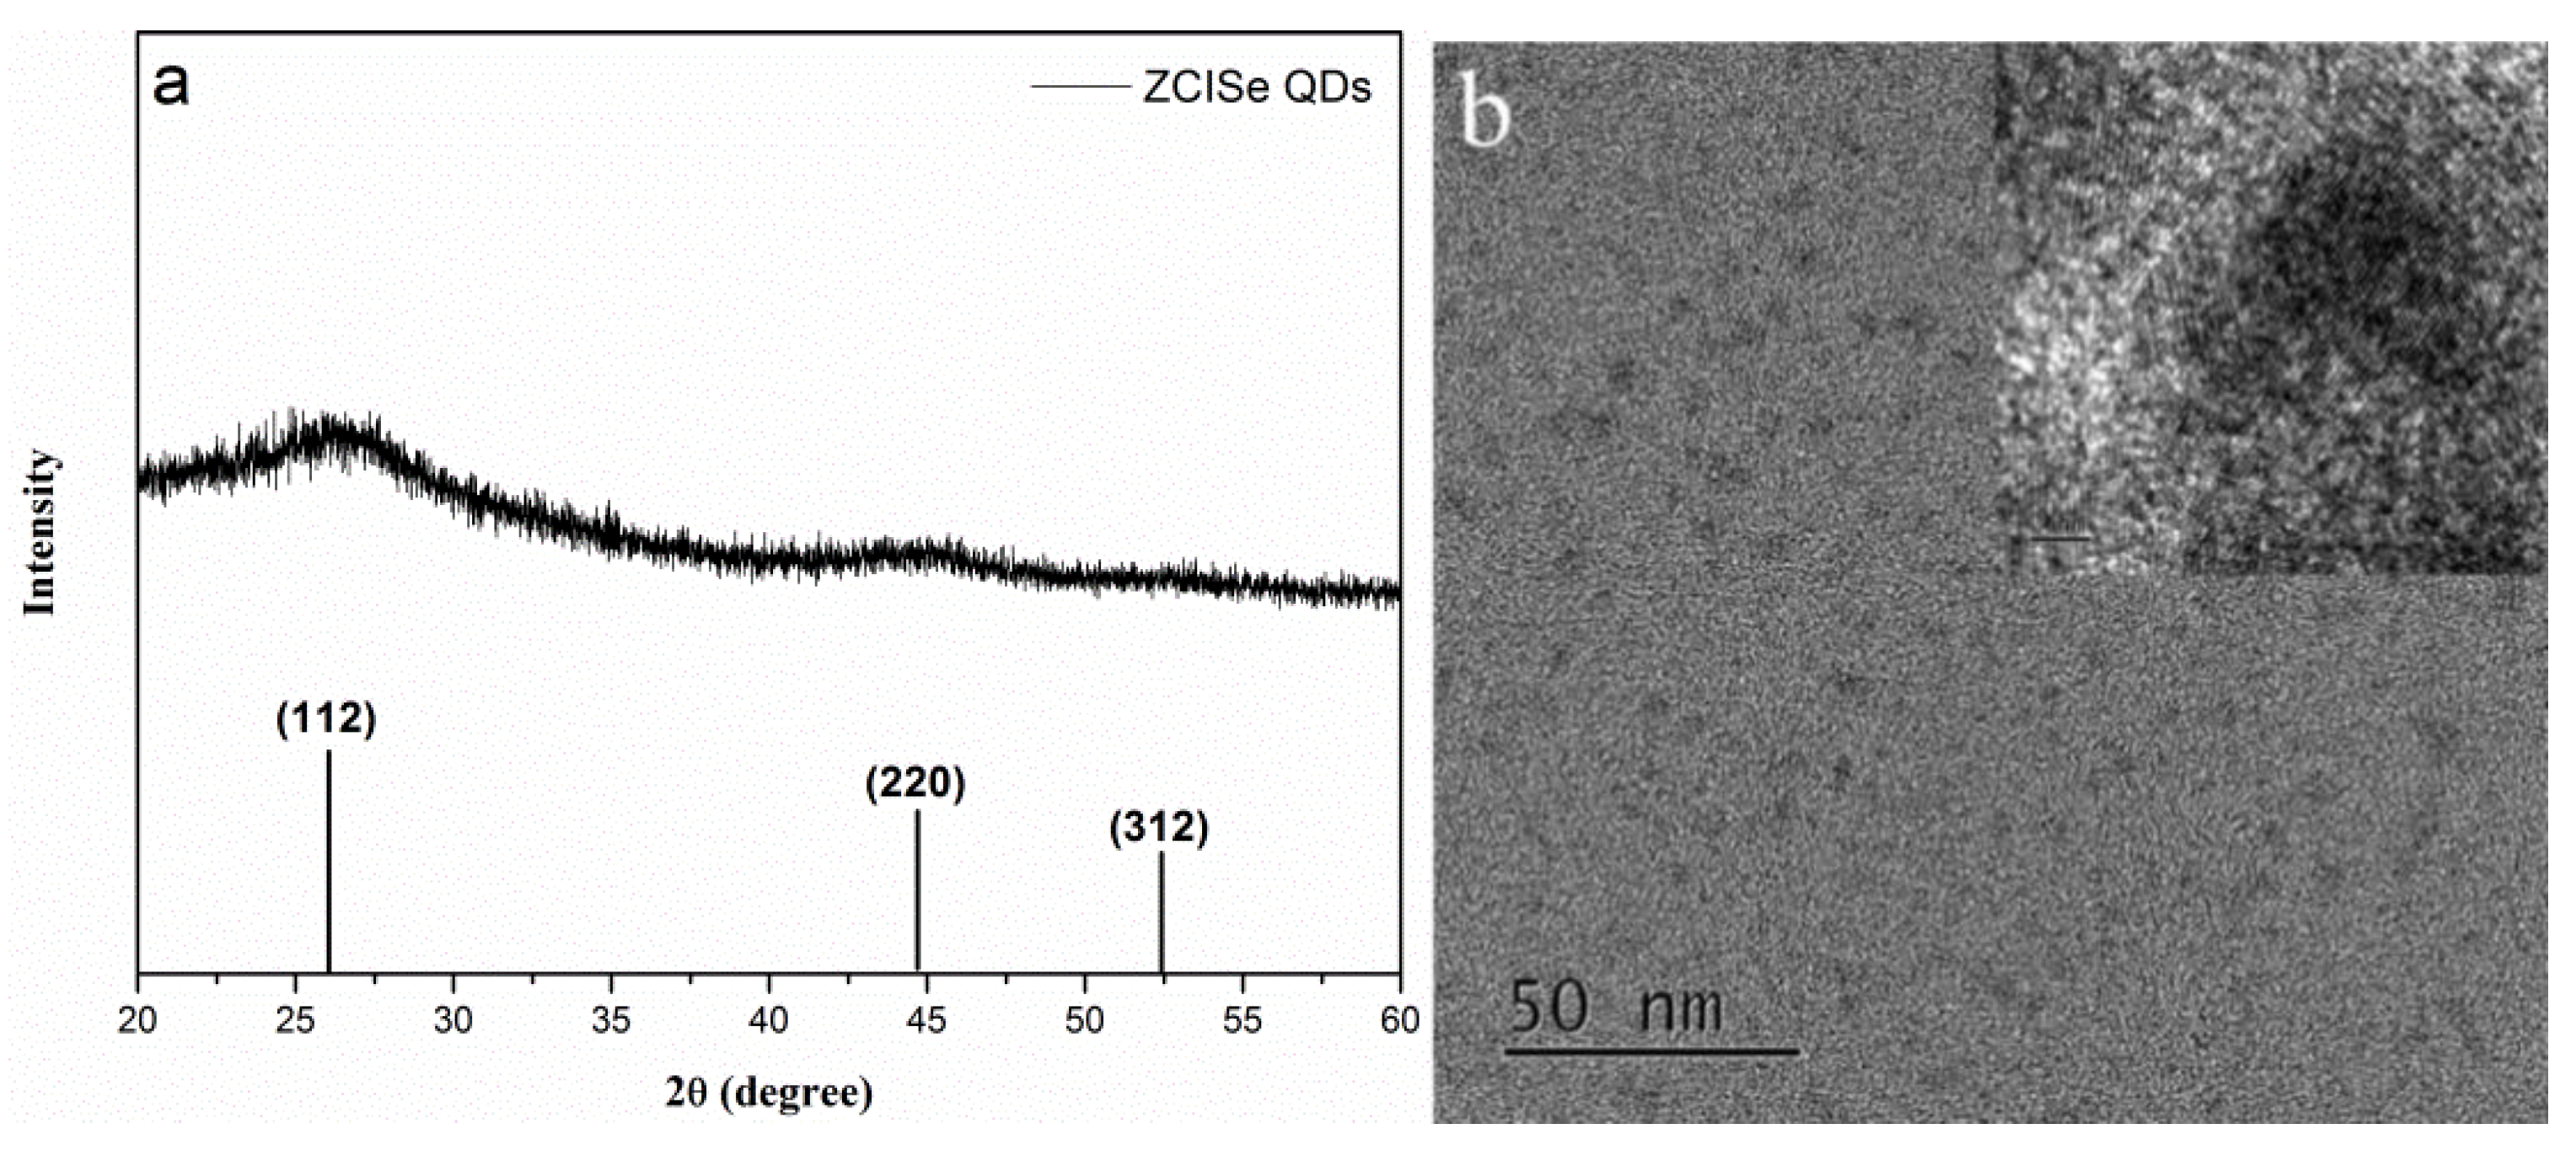
3.1. Characterization of ZCISe QDs

An injection route was used to synthesize the Zn-Cu-In-Se QDs (Scheme 1). Firstly, zinc, copper, and indium chlorides were solubilized in ODE using OAm, which prevented slow nucleation and rapid aggregation of the resulting materials, and DDT reduced the colloidal stability of the QDs particularly at high temperatures as ligands. Additionally, the presence of DDT was critical to the synthesis. According to the theory of Hard–Soft–Acids–Base, the reactive Cu+ ion, a soft acid, is preferentially complexed by dodecanethiol, a soft base [25,26]. After degassing, the solution was heated under nitrogen. Then we observed the change of solution from turbid to clear and finally to light yellow, which indicated the metal chloride was dissolved. Meanwhile, Se powder was solubilized in OAm and DDT ligands. After injecting the Se precursor into the flask, the color of the solution changed to black red immediately. As the reaction time increased, it first turned bright red and then turned black, which indicated nanocrystal nucleation.
Figure 1 shows the PL emission and UV-Vis absorption spectra of ZCISe QDs with different reaction times at 160 °C, with the corresponding PL emission photographs shown in the inset of Figure 1a. The PL emission underwent a red shift with the increase of reaction time to 20 min, and the largest absorption edge at about 670 nm. Meanwhile, the QDs with the reaction time of 20 min had the best absorption. Here we used ZCISe QDs with 20 min reaction time as the model QDs in the following experiments.
The XRD pattern of ZCISe QDs prepared with 20 min reaction time is shown in Figure 2a. The diffraction peaks at 2θ of 26.77°, 44.43°, and 54.64° are assigned to the (112), (220), and (312) crystal planes of the chalcopyrite (tetragonal) ZCISe QDs (JCPDS 00-051-1221), respectively. The wider peaks represent the small size of ZCISe QDs. Meanwhile, the transmission electron microscopy (TEM) images (Figure 2b) and high-resolution electron microscopy (HRTEM) (inset of Figure 2b), show that the ZCISe QDs are identical with an average particle size of 4.1 ± 0.3 nm. The homogeneous size distribution in the TEM observation is consistent with the distinct excitonic peak observed in the absorption spectra (Figure 1b) and calculated size from XRD.

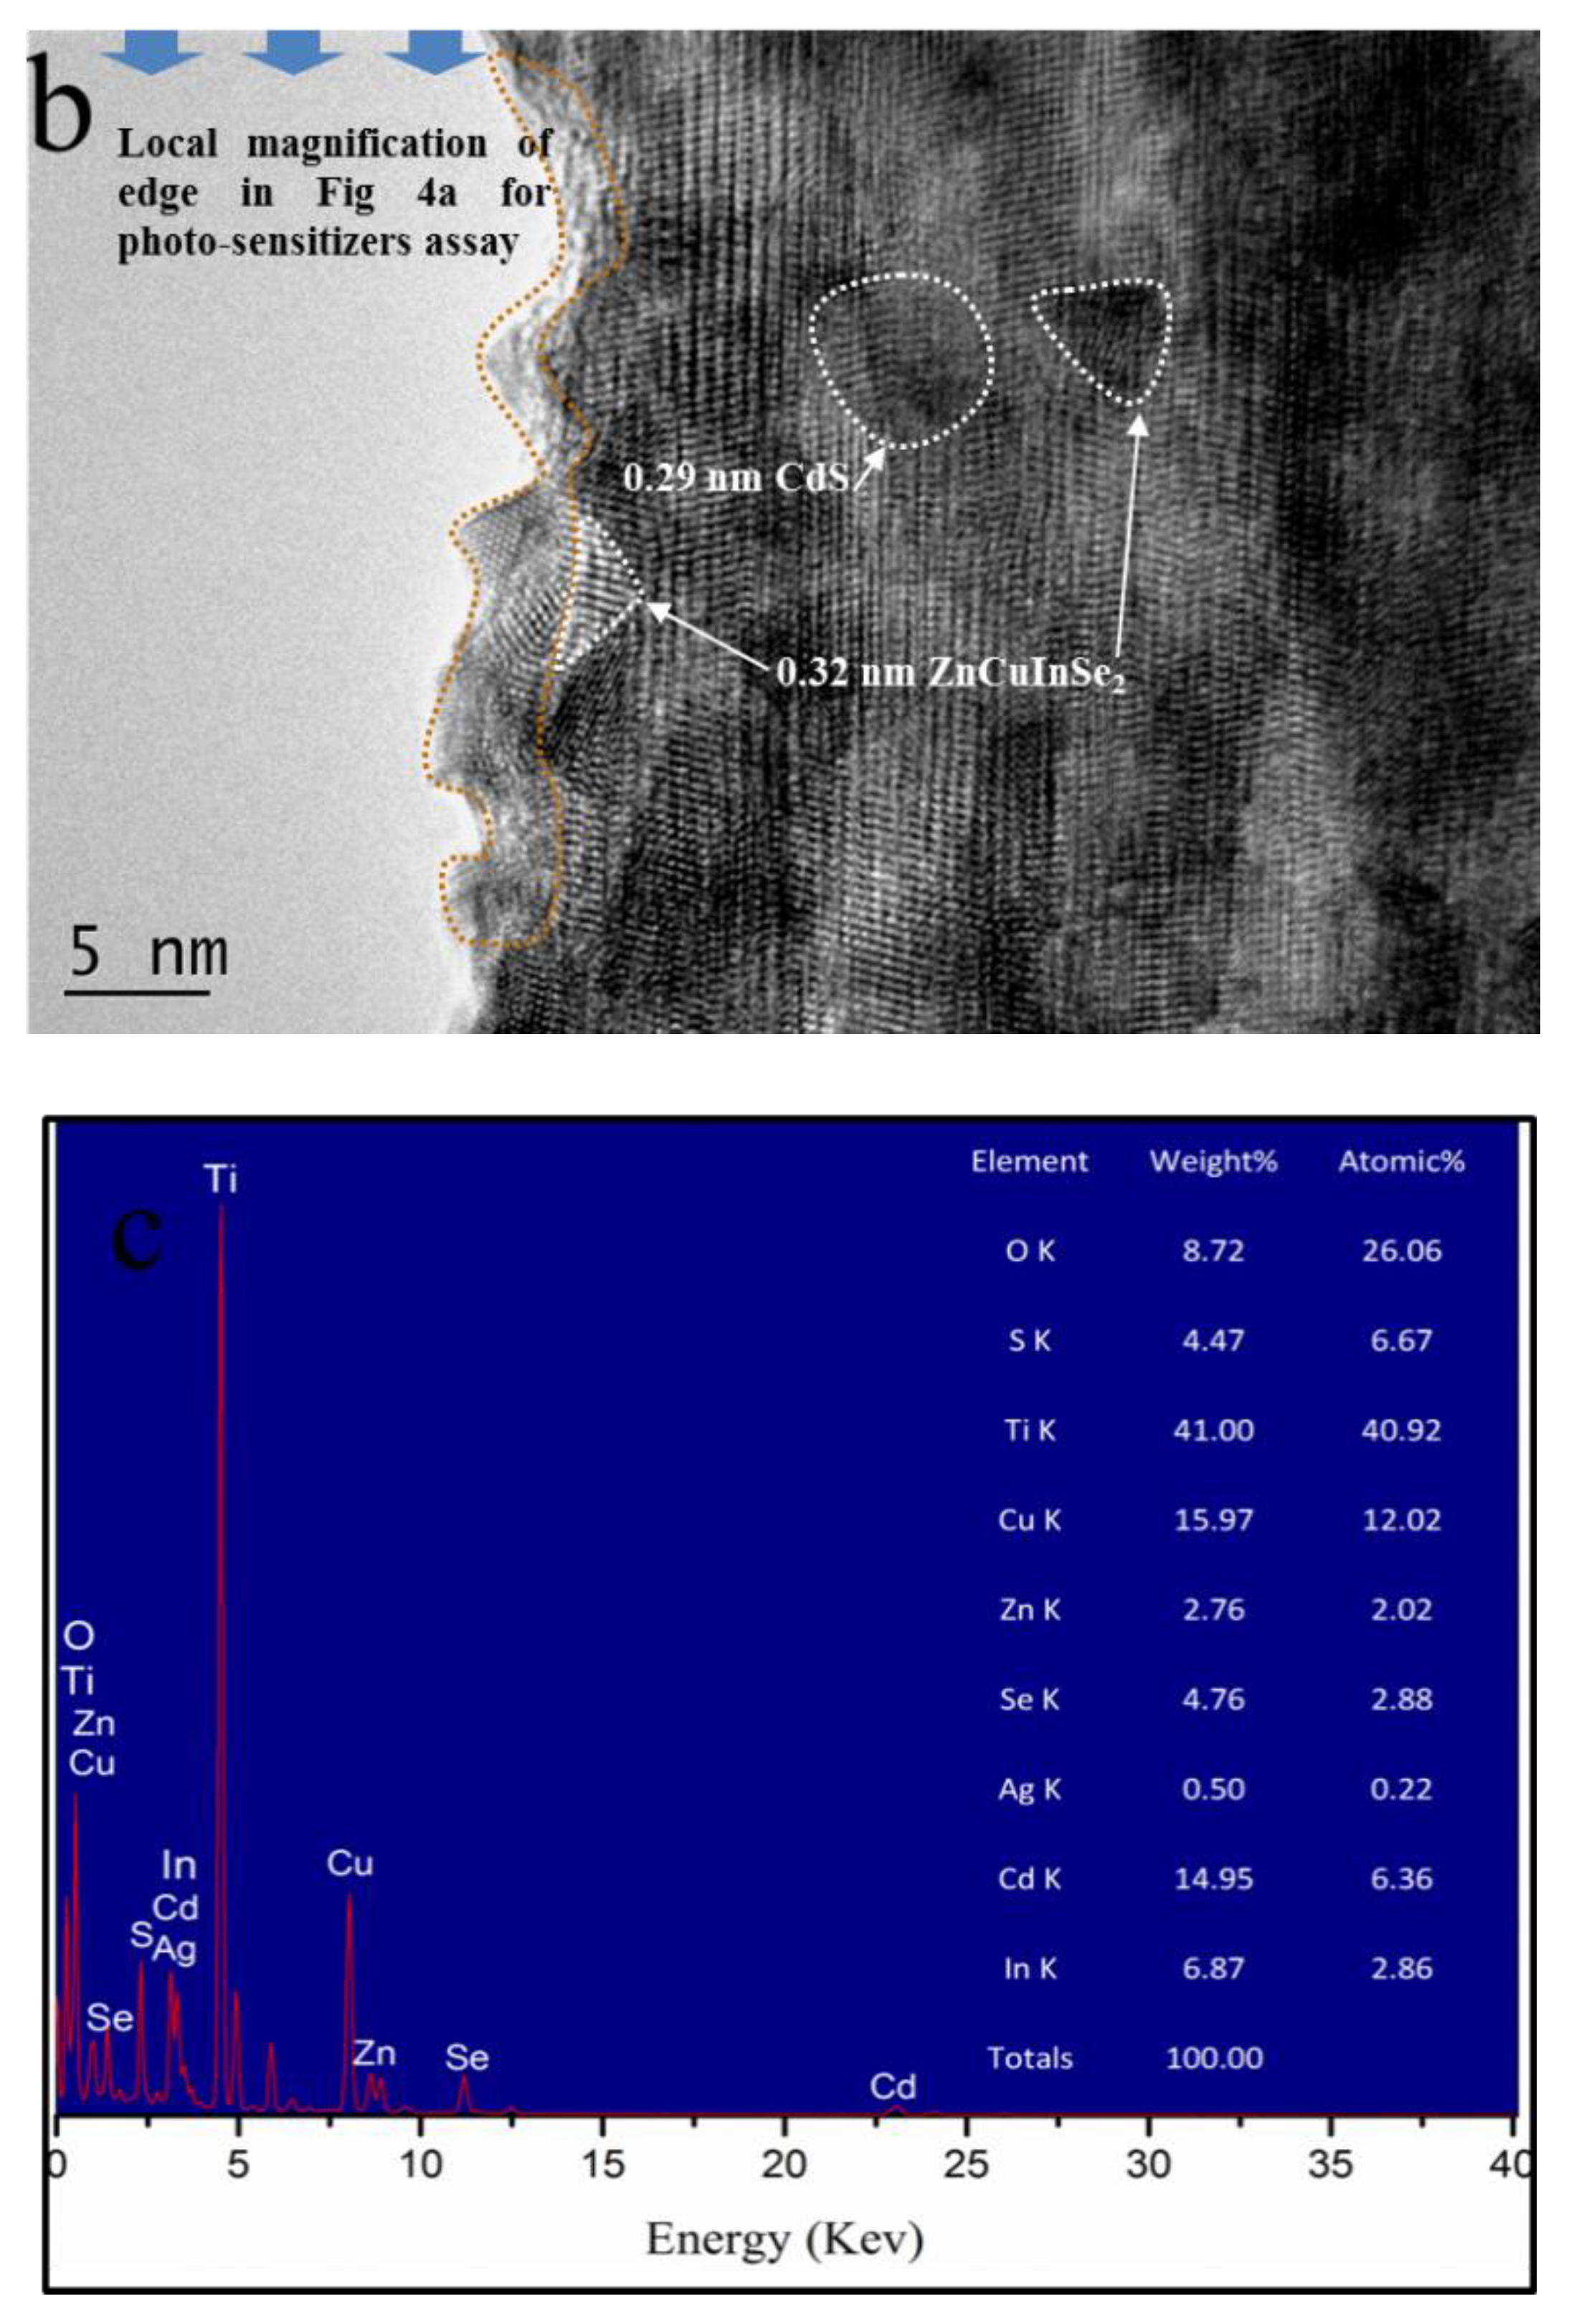
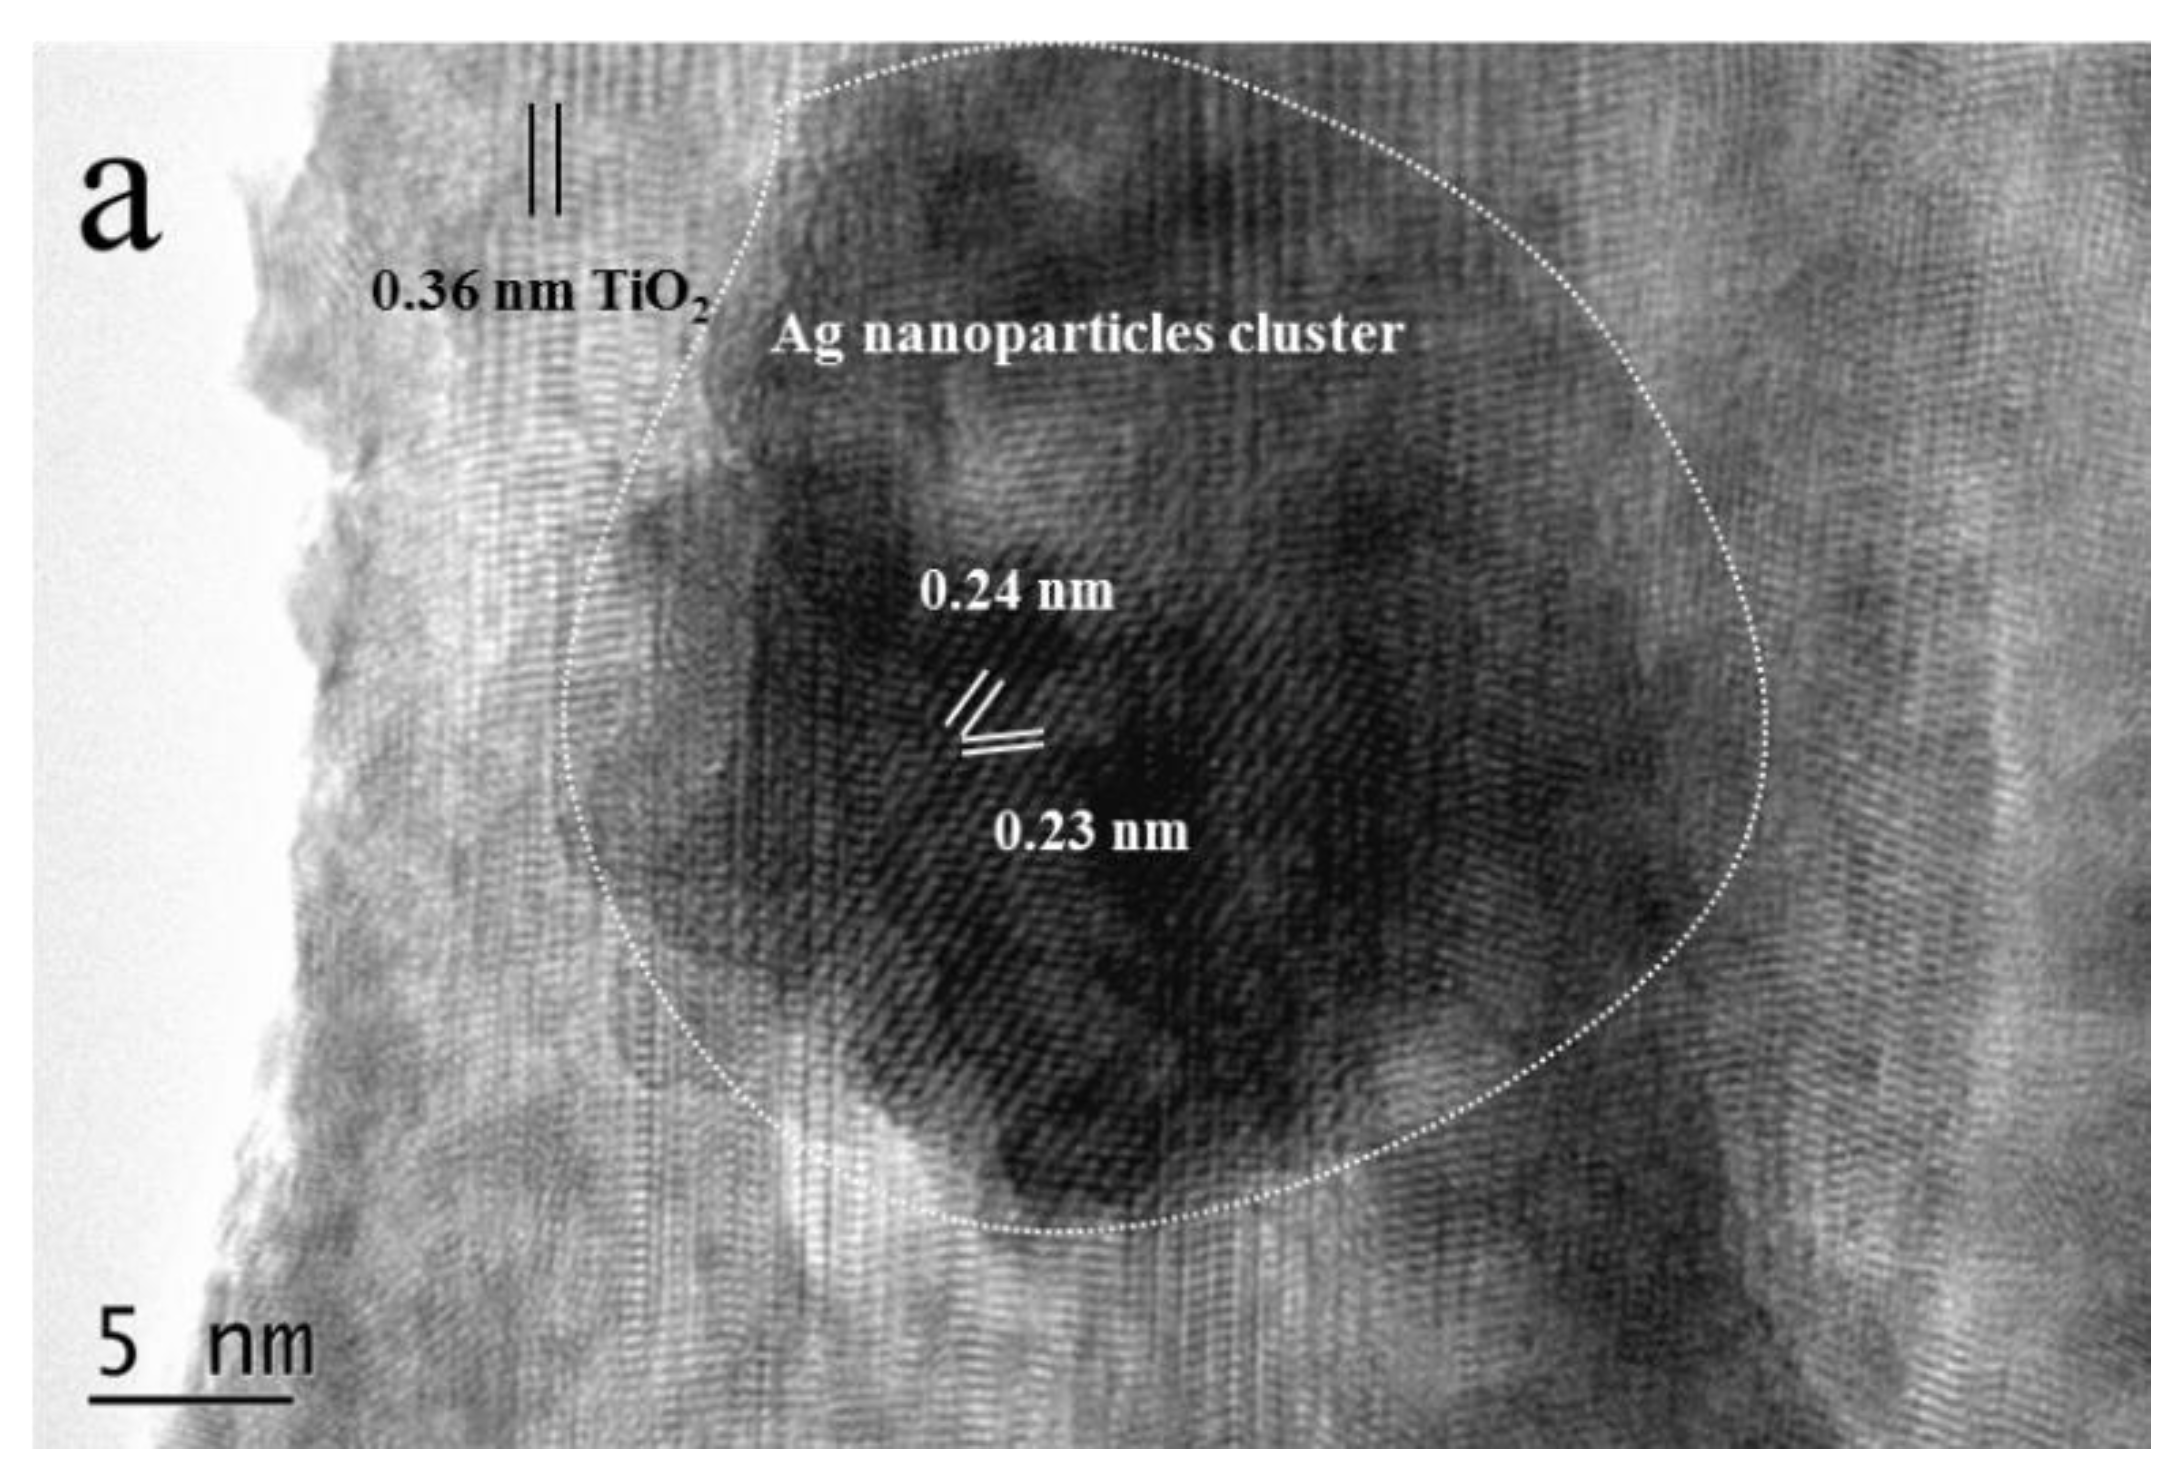
3.2. Characterization of TiO2/Ag/ZCISe/CdS Nanocomposite

The TiO2 nanowires are a smooth porous network with the top loosely arranged with an average diameter and length corresponding to 40 nm and 3 μm, respectively, as shown in Figure 3a. High magnification of the TiO2 nanowires is shown in the inset of Figure 3a. After subsequently assembling with Ag NPs (Figure 3b) and ZCISe QDs (Figure 3c), lots of tiny particles anchor onto the TiO2 nanowires which consequently turn rough. Figure 3d represents the SEM image of TiO2/Ag/ZCISe/CdS. One can see that TiO2/Ag/ZCISe are almost completely coated by a thin CdS layer without the naked TiO2 surface, which can greatly decrease the surface defects that are related to the charge carriers’ recombination.
The HRTEM images in Figure 4a,b show that the Ag nanoparticles, ZCISe QDs, and CdS nanoparticles are tightly grown on the surface of the TiO2 nanowires. The HRTEM image with clear lattice spaces of TiO2, Ag, ZCISe, and CdS displays high crystallinity of the as-synthesized TiO2/Ag/ZCISe/CdS composite in Figure 4b. The EDS spectrum of Figure 4c shows the characteristic peaks of O, S, Ti, Cu, Zn, Se, Ag, Cd, and In elements.

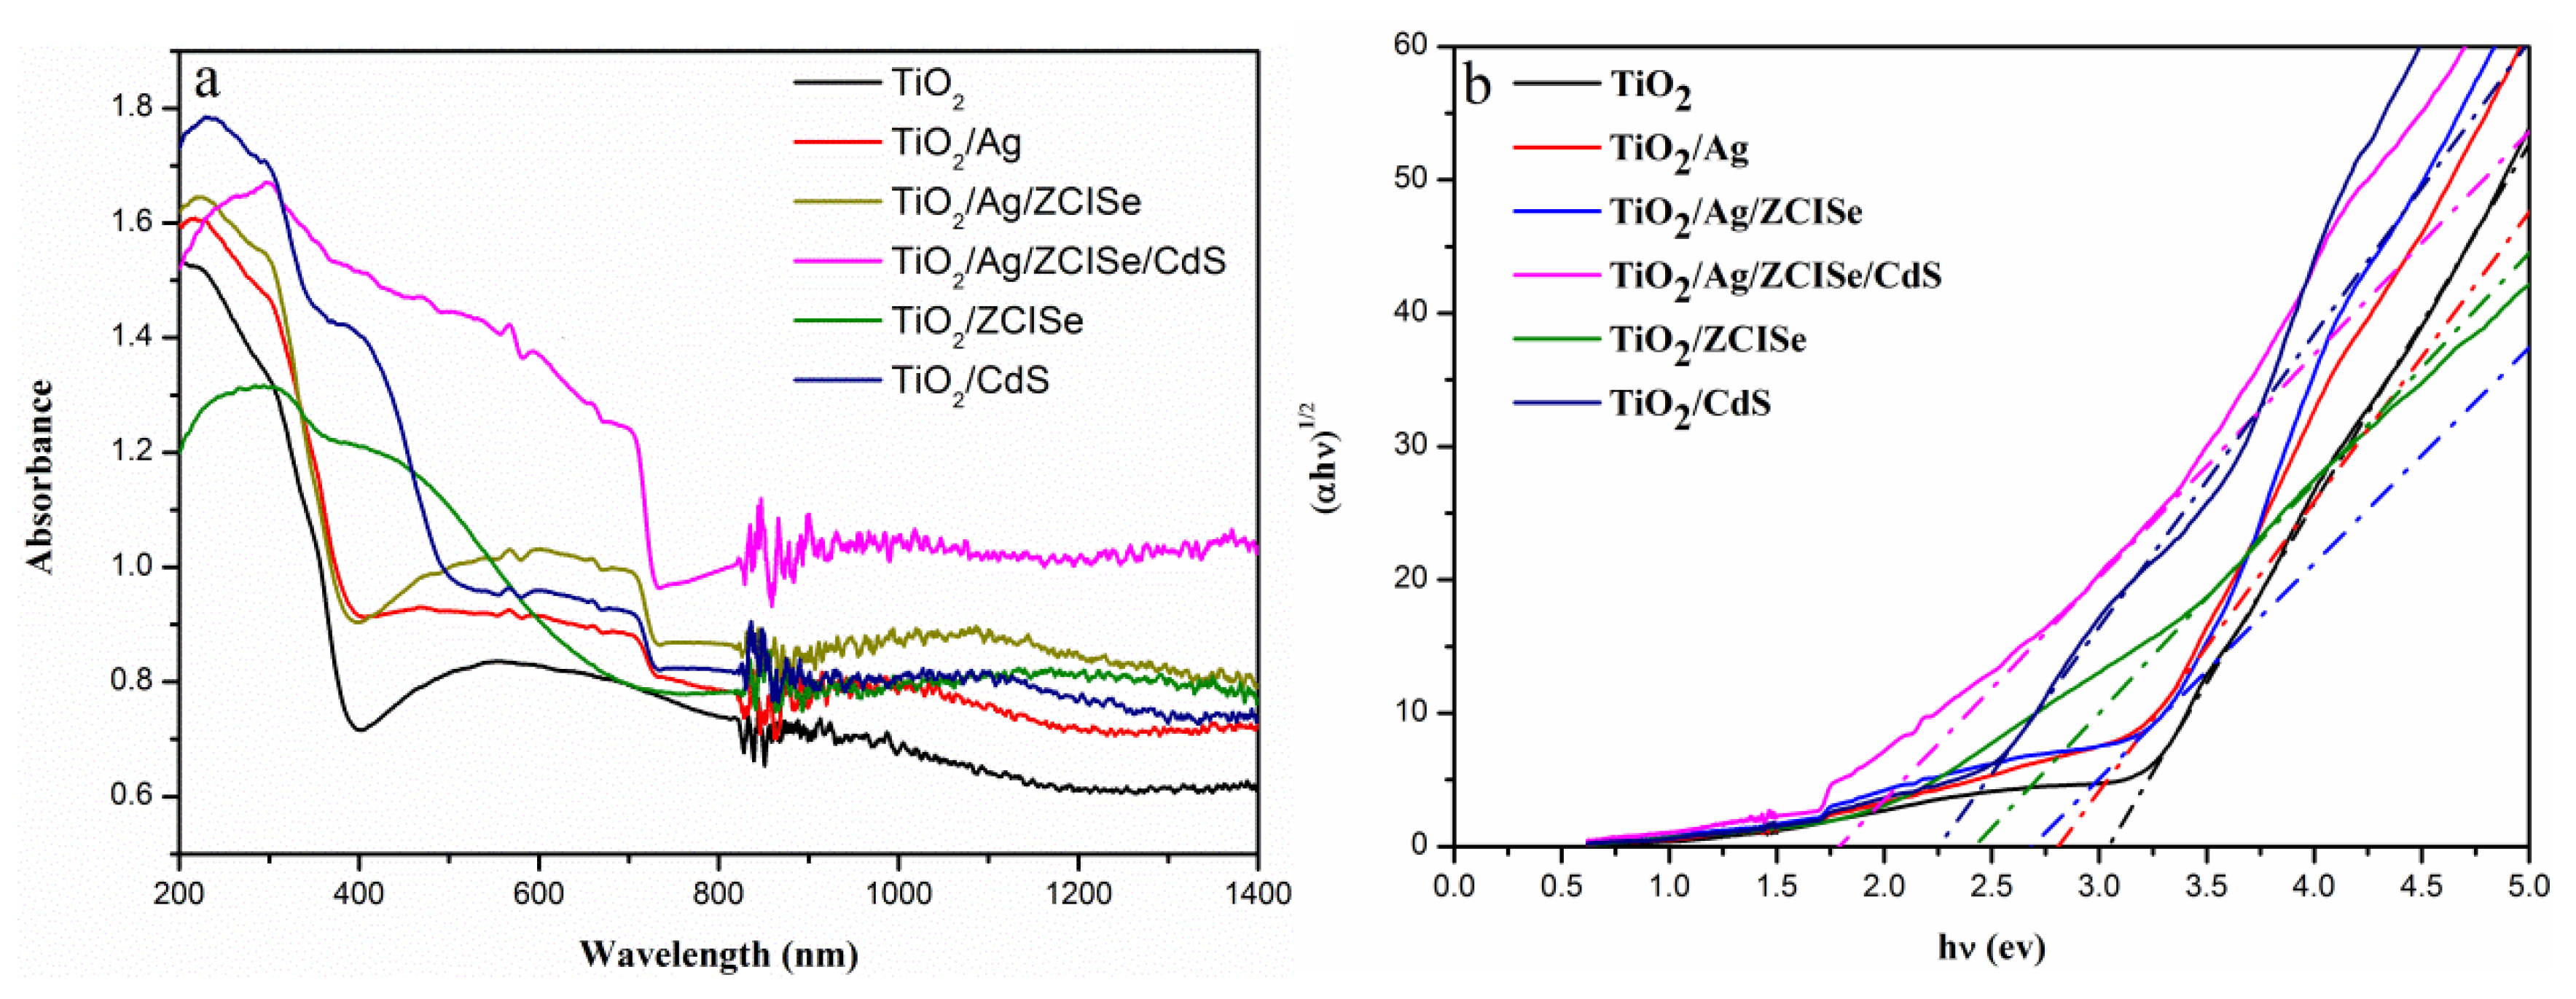
3.3. Optical Absorption

Figure 5a shows the UV-vis spectra of the TiO2 nanowires, TiO2/Ag, TiO2/Ag/ZCISe, and TiO2/Ag/ZCISe/CdS. After the sensitization of ZCISe QDs, the absorption spectrum of the TiO2 nanowires was significantly enhanced. The TiO2/Ag/ZCISe/CdS electrode exhibited red-shift absorption at a wavelength range between 680 and 1000 nm. The surface passivation can enhance the absorption spectra towards long wavelength region compared with those of pure TiO2 and TiO2/Ag/ZCISe. This red-shift may indicate that the QDs charge carriers wave functions tunnel into the surrounding of the CdS shell. UV-Vis spectra were also measured to reveal the band gaps of the as-prepared samples, using Tauc relation [27,28],
(αhν)1/2 = A(hν − Eg)
where α is the light absorption coefficient, A is a constant, h is the Planck’s constant, ν is light frequency, and Eg is the band gap energy. The optical band gaps of TiO2/Ag/ZCISe/CdS, TiO2/Ag/ZCISe, and TiO2/Ag correspond to 1.75 eV, 2.7 eV, and 2.8 eV in Figure 5b.

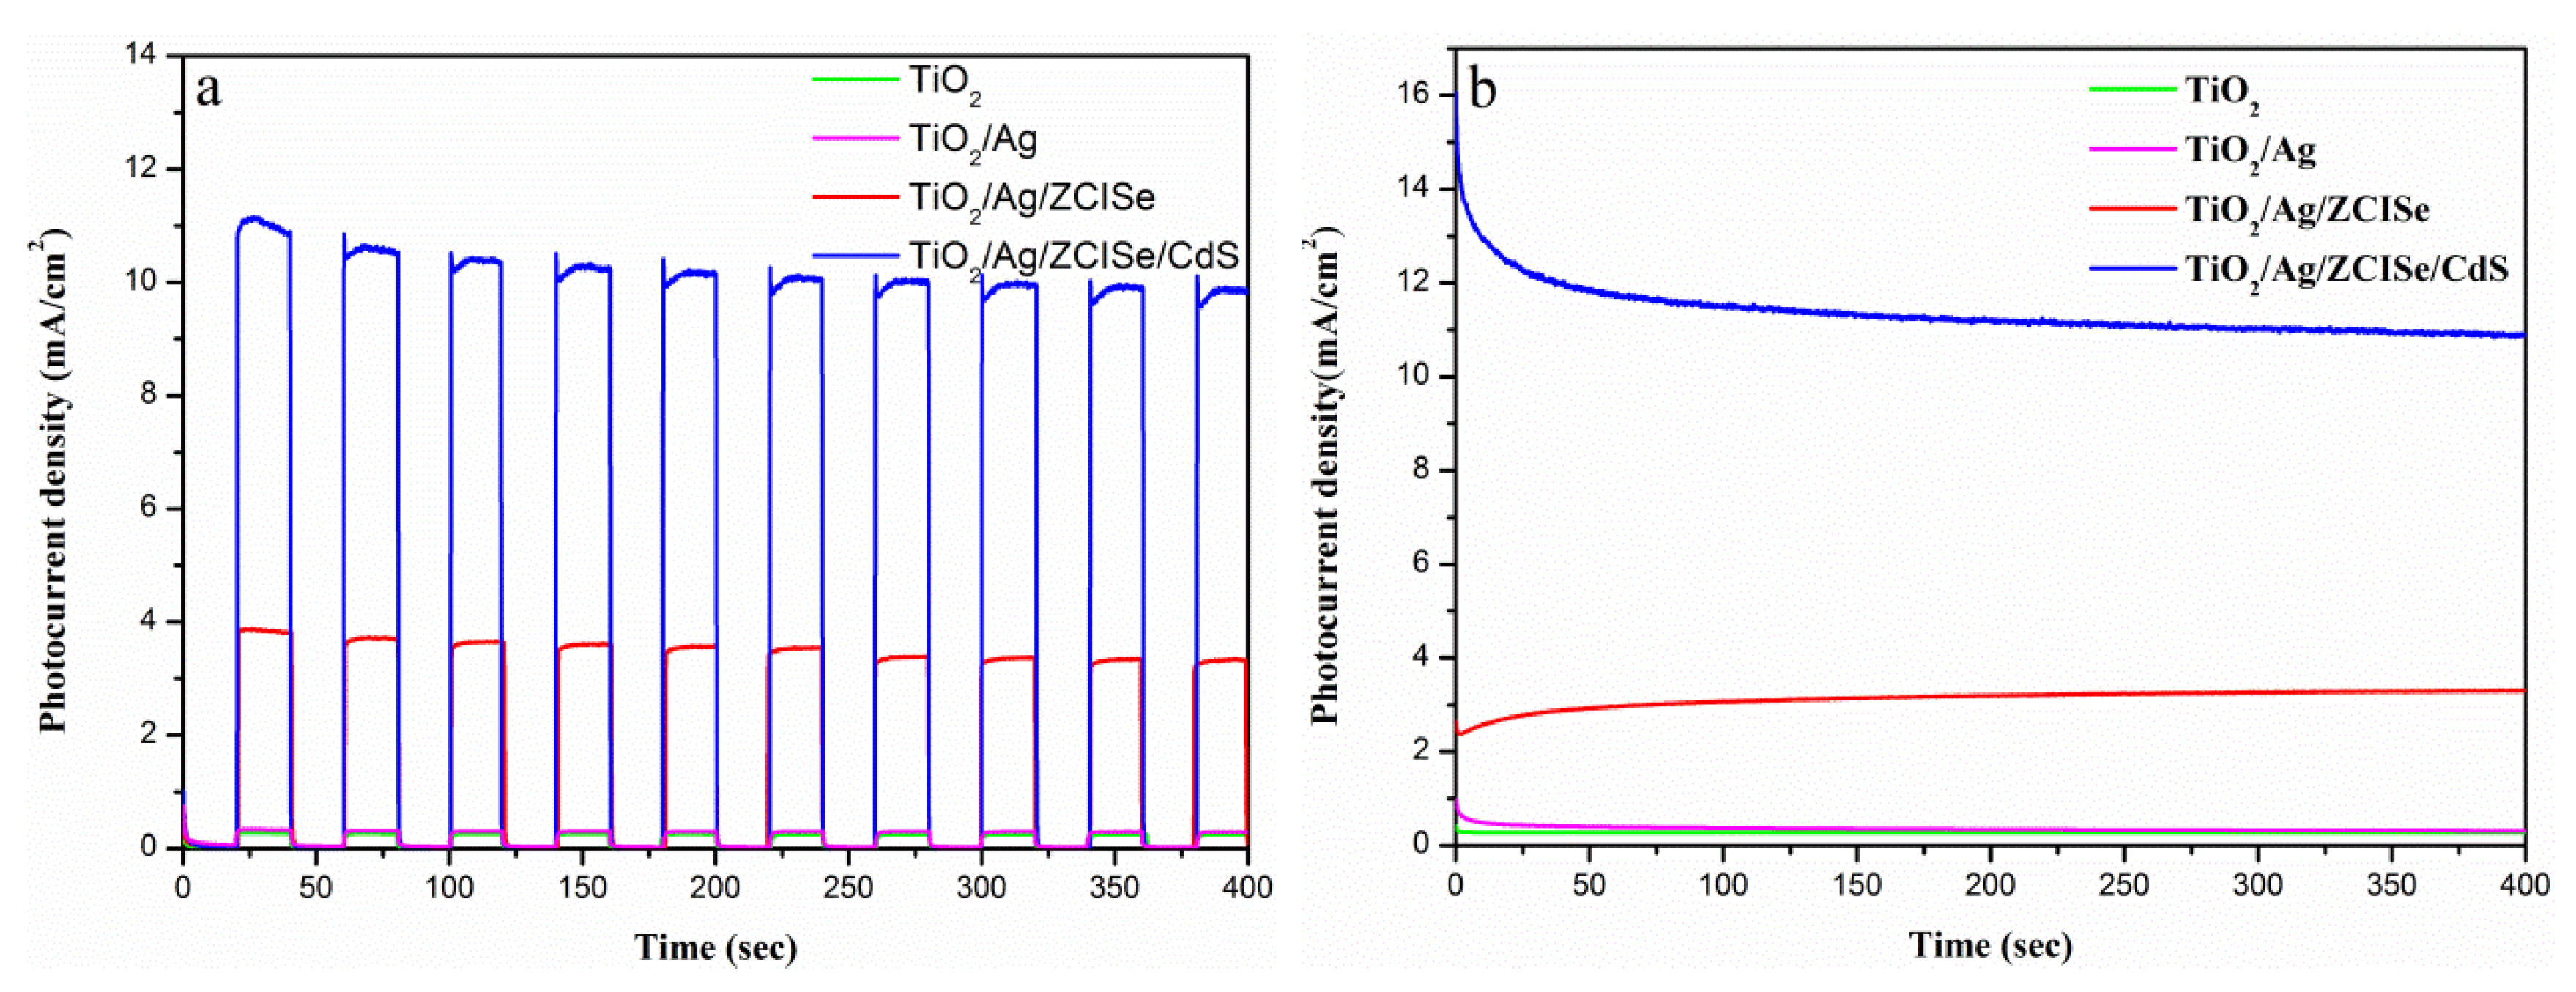
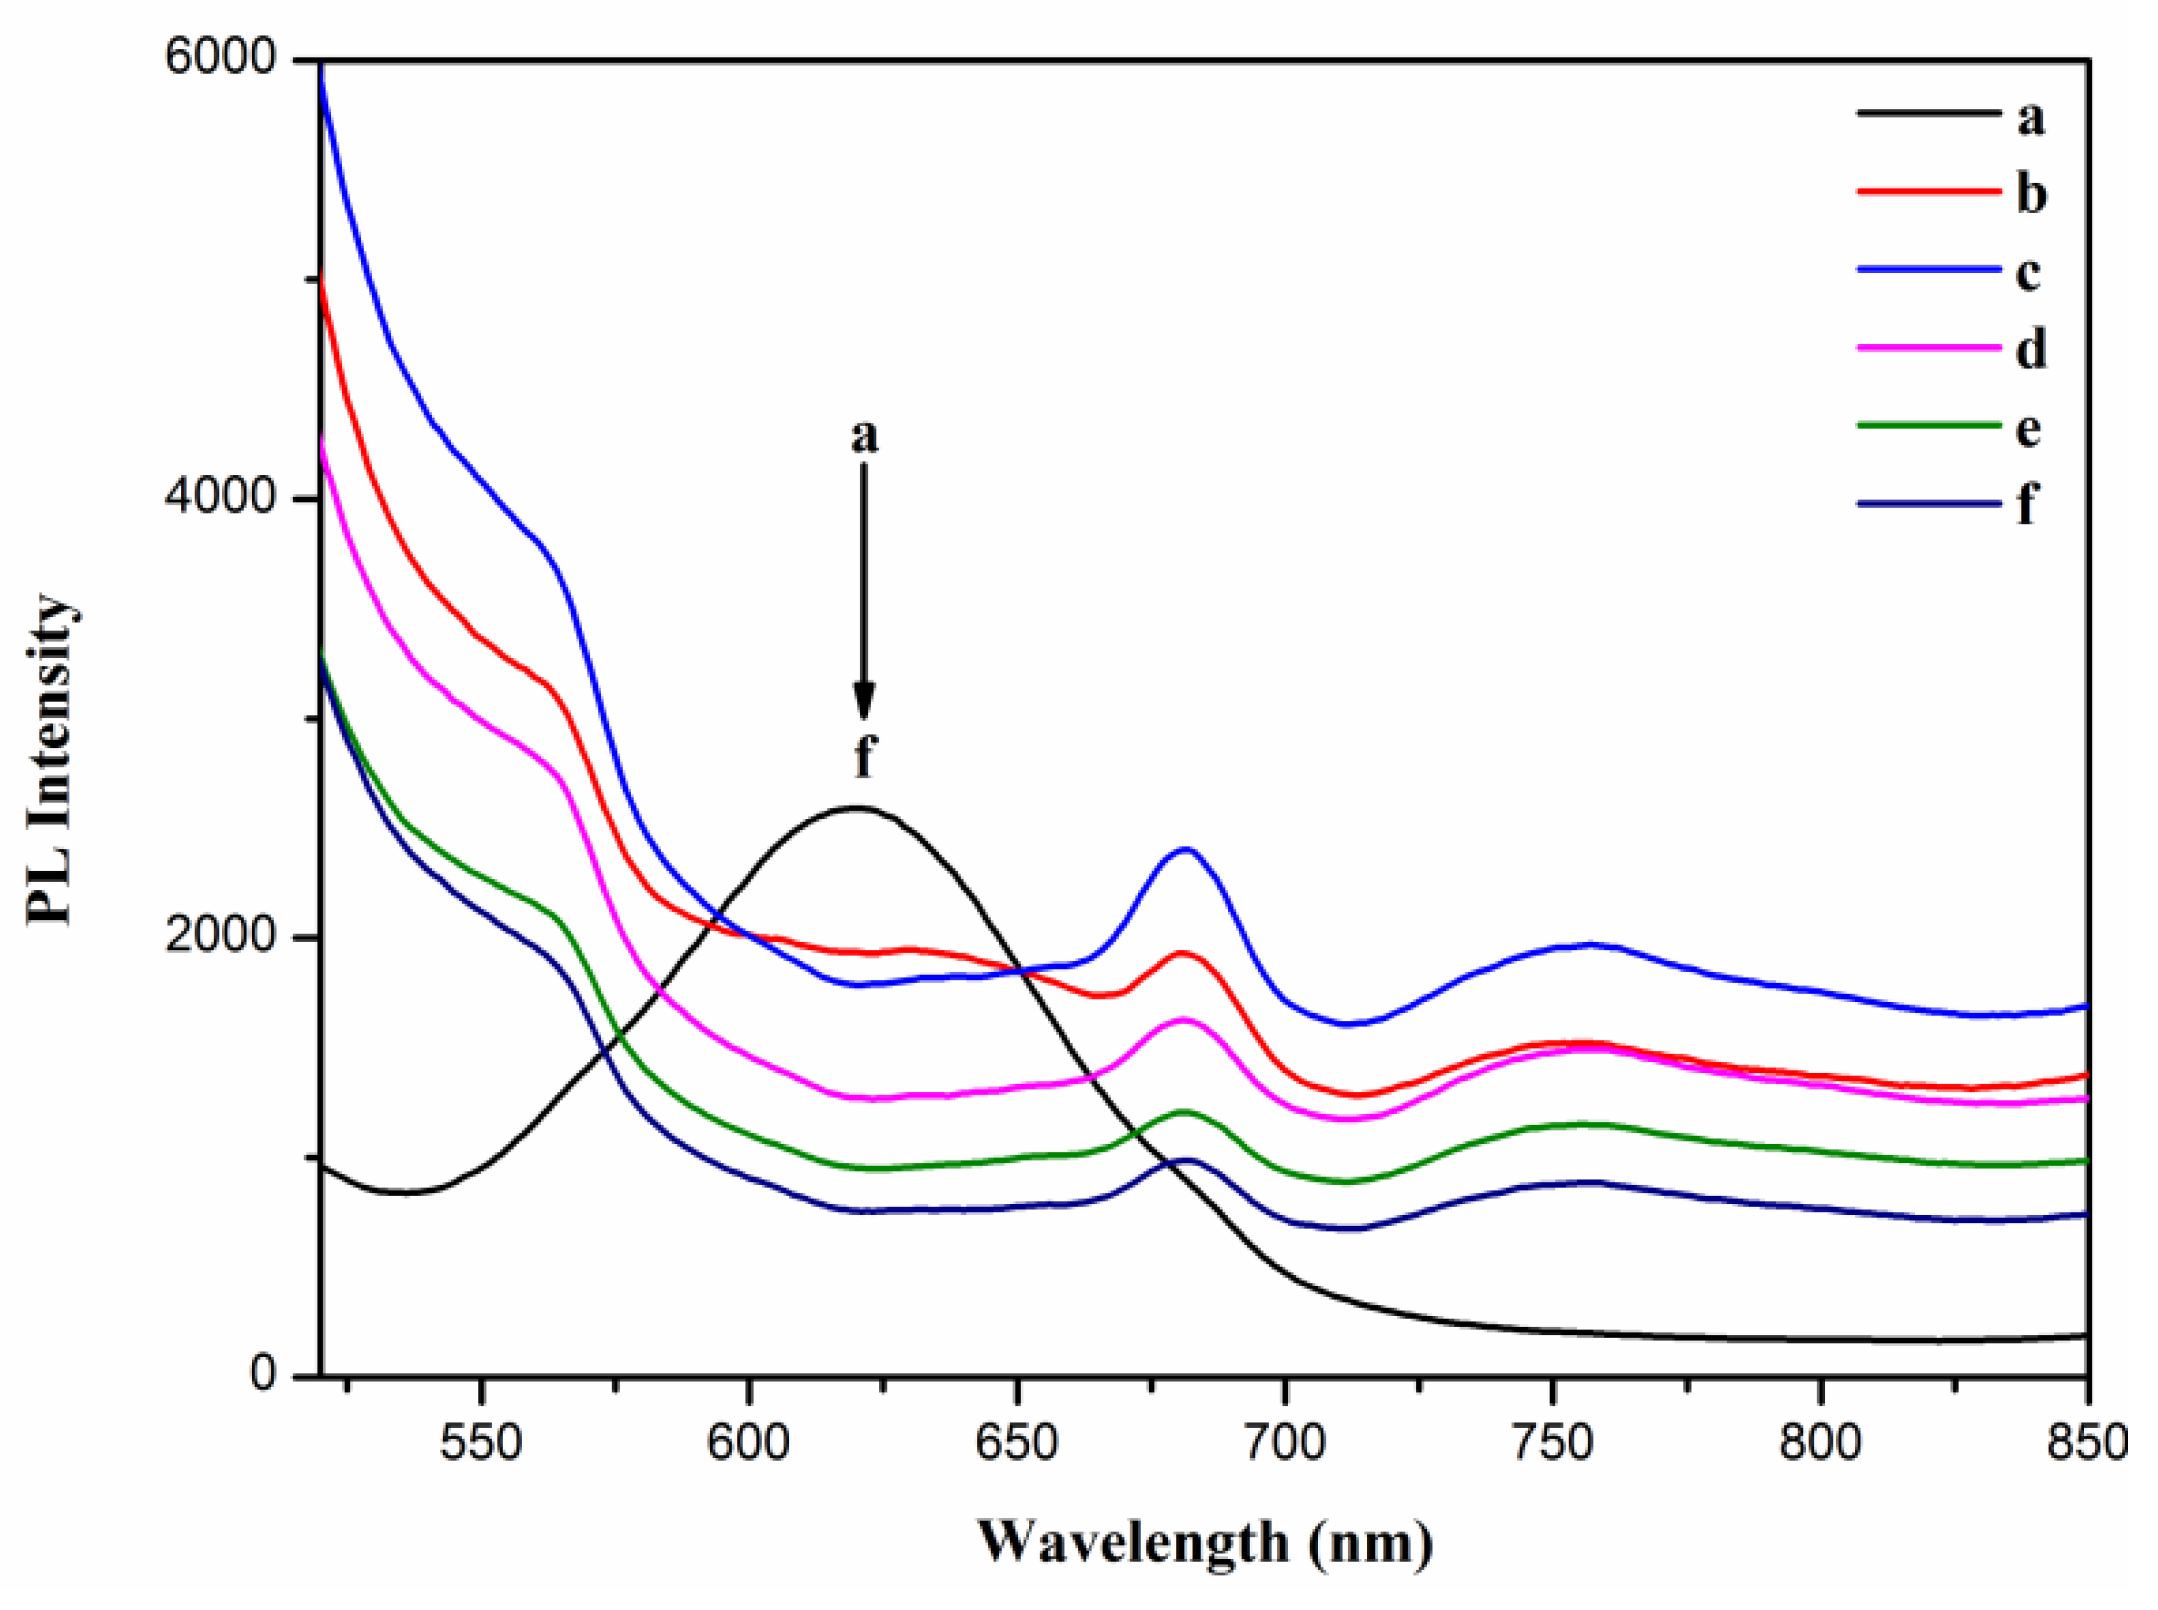
3.4. Electrochemical Characterization

A three-electrode system was used to determine the photocurrent density of different electrodes. It is well known that the optimized photoreduction deposition time of Ag nanoparticles benefit to enhance the photocurrent density. The photocurrent densities of TiO2/Ag monotonically increased with the increasing of Ag loading content corresponding to the reaction time, whereas the photocurrent density sharply decreased as the reaction time reached 20 min. Fifteen minutes was chosen for the single-step photoreduction deposition time to improve the photoelectrochemical properties as shown in Figure S1A. Notably, by characterizing the SEM images of TiO2/Ag with different deposition times (Figure S2, Detailed Analysis), the obtained results were consistent with the change trend of the photocurrent density. In addition, the amount of ZCISe QDs and CdS for the photocurrent density also played a key role in the proposed photoelectrode. The photocurrent density of TiO2/Ag/ZCISe and TiO2/Ag/ZCISe/CdS increased and then decreased with the increase in the quantity of ZCISe and the number of layers covered by CdS (Figure S1B,C). Due to the excessive load which interfered with the absorption of light by the photoelectrodes, the optimal quantity and the number of cycles were 1 mL and 5 times, respectively. Figure 6a,b shows the I-t curves of TiO2, TiO2/Ag, TiO2/Ag/ZCISe, and TiO2/Ag/ZCISe/CdS ptotoelectrodes. It can be seen that the photocurrent density of TiO2/Ag displayed a small increase compared with the pristine TiO2 nanowires. After loading the ZCISe QDs, the photocurrent density increased about 10 times, reaching 3.66 mA/cm2. Further loading the CdS shell, the photocurrent density increased about 2.8 times more than TiO2/Ag/ZCISe, reaching 10.5 mA/cm2. In order to determine the function of each part in the proposed photoelectrode, the photocurrent densities of different modified photoelectrodes were measured under chopped illumination of AM 1.5 G light with a cutoff filter and a band pass filter for obtaining the different wavelength as shown in Table S1. Under the visible light (500 nm ± 15 nm), ZCISe, Ag/ZCISe, and CdS modified TiO2 exhibited the largest photocurrent densities. TiO2/ZCISe and TiO2/Ag/ZCISe also had a non-negligible response in the IR region, indicating the role of ZCISe QDs in absorbing IR. However, due to the lower intensity of IR light, the obtained photocurrent density were less than the above results. After connecting the parts together, the proposed photoelectrode showed an excellent photoelectrochemical performance in accordance with the UV-vis spectra (Figure 5).

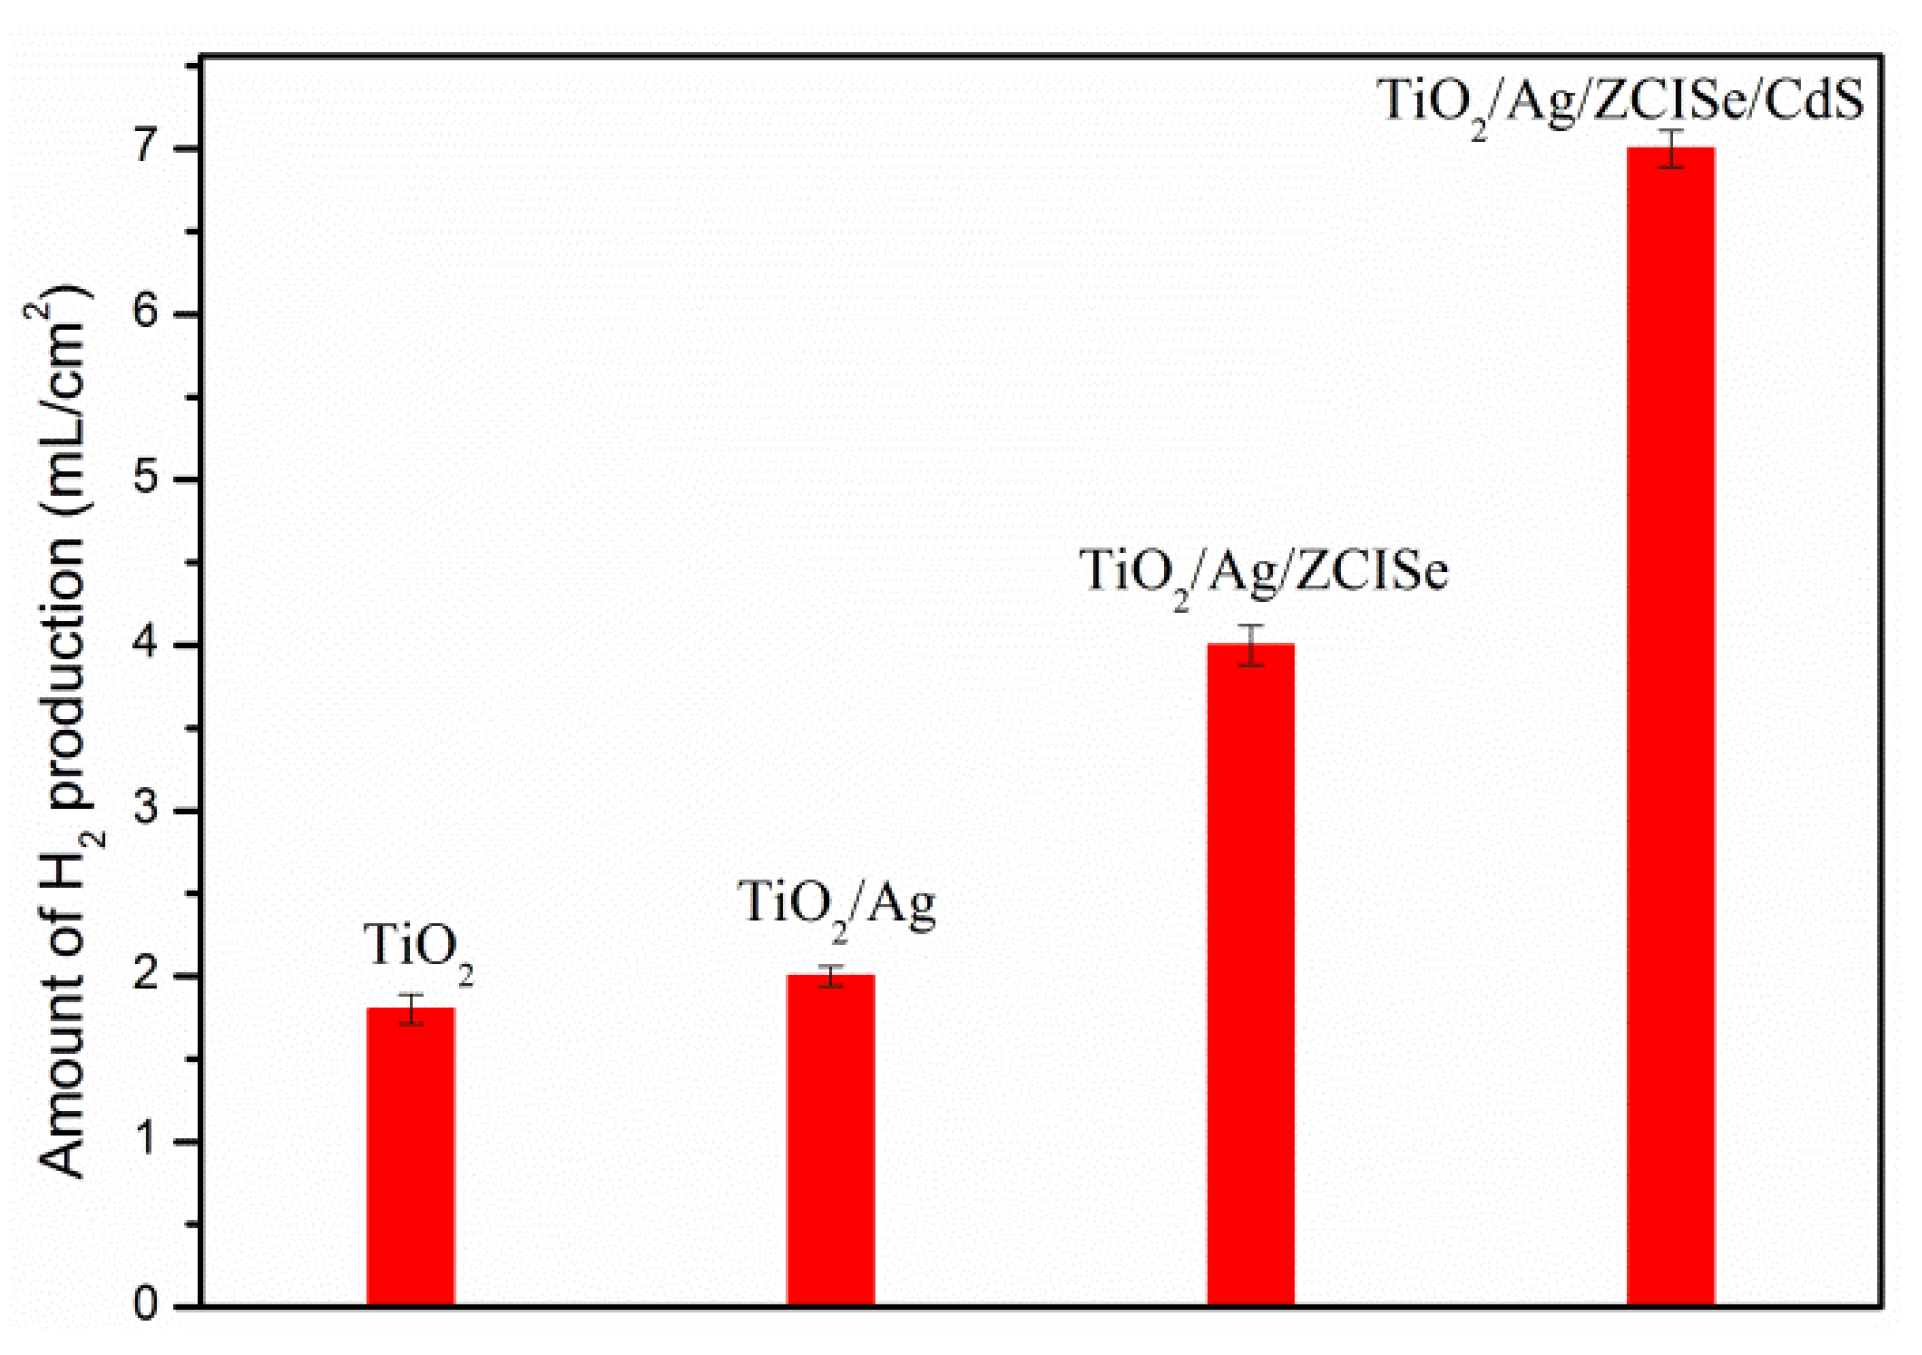
3.5. Photocatalytic Performance of Hydrogen Generation

The photocatalytic activities of the as-prepared TiO2, TiO2/Ag, TiO2/Ag/ZCISe, and TiO2/Ag/ZCISe/CdS photoelectrodes were evaluated by hydrogen production under high-power xenon lamp irradiation. As shown in Figure 7, after 6 h irradiation by the xenon lamps, the H2 yields by the different photoelectrodes were about 1.8, 2, 4, and 7 mL, respectively. Notably, the related photocatalytic rate constant of hydrogen evolution by TiO2/Ag/ZCISe/CdS reached 52.9 μmol/h, which was approximately 3.88 times of that by the photoelectrode of pure TiO2 nanowires. This is due to the sensitization of ZCISe QDs which broadens the light absorption range of the TiO2/Ag/ZCISe/CdS electrode, increases the separation efficiency of electrons-holes, and generates more electrons. The CdS passivates the surface of the QDs and inhibits the recombination of electron holes. In addition, the decoration of Ag NPs promoted the transmission of electrons and enhanced the photocatalytic activity.

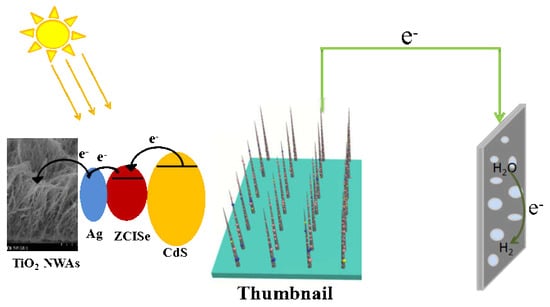
3.6. Mechanism of Charge Transfer in TiO2/Ag/ZCISe/CdS

Based on the photoelectric characterization of composite electrode and hydrogen production performance, the mechanism of charge transfer in TiO2/Ag/ZCISe/CdS was discussed using PL emission spectra as shown in Figure 8. When ZCISe QDs were loaded onto TiO2 nanowires, a distinct quenching of the emission was observed when compared with the composite structure of FTO/ZCISe(FTO, The SnO2 transparent conductive glass of doped F.), which demonstrated deactivation of the excited ZCISe via electron transfer to the TiO2. In the same way, electrons can be transferred from CdS NPs to ZCISe QDs and then to TiO2 nanowires by comparing FTO/ZCISe/CdS and TiO2/ZCISe/CdS. Moreover, the emission further significantly quenched when Ag NPs were decorated between TiO2 nanowires and ZCISe to form the TiO2/Ag/ZCISe sandwich, suggesting that pronounced charge separation occurred within the TiO2/Ag/ZCISe. The PL quenching of the composite agrees with an initial expectation of high efficient charge carriers transport pathway.
On the basis of the results and discussion above, the schematic diagram and photocatalytic mechanism for the TiO2/Ag/ZCIS/CdS photoelectrode is proposed and schematically exhibited in Scheme 2. Under solar irradiation, CdS, ZCISe QDs, and TiO2 absorbed the light and excited. Electron-hole pairs are generated on CdS/ZCISe QDs, and the electrons are quickly transferred into the conduction band of TiO2 nanowires through Ag NPs. Then, electrons interact with H2O to produce hydrogen.

4. Conclusions

In summary, oil-soluble ZCISe QDs were prepared by a simple hot-injection method, and a promising strategy with enhanced photocatalytic efficiency of CdS NPs, ZCISe QDs, and Ag NPs-based sandwich electrode configuration is present. The excellent architecture of TiO2/Ag/ZCISe/CdS showed good light-harvesting behavior and notably promoted photocatalytic hydrogen production rate of about 52.9 μmol/h. It is believed that the positive effect between Ag, ZCISe, and CdS as the components of co-catalyst on the photocatalytic hydrogen production activity, efficiently suppress charges recombination, improve interfacial charge transfer, and eventually provide good photocatalytic reaction centers.

Supplementary Materials

The following are available online at https://www.mdpi.com/2079-4991/9/3/393/s1, Figure S1: The dependence of photocurrent on the loaded Ag nanoparticals, ZCISe and CdS amount which is represented by the ultraviolet light exposure time (A), the amount of dropwise (B) and the number of soak (C) of the corresponding electrode, Figure S2: SEM images of TiO2/Ag with photoreduction deposition time of 5 min (A,A1), 10 min (B,B1), 15min (C,C1), 20 min (D,D1) and 25 min (E,E1) with different magnification, Table S1: Photocurrent density of different modified photoelectrode under three condition.

Author Contributions

W.L. and Q.C. supervised the work and revised the manuscript; H.G. performed the experiment, date analysis, and wrote the manuscript; L.Y. and K.C. did supplemental experiment; P.S. designed the experiment and discussed the results.

Funding

This research was funded by the National Natural Science Foundation of China (Grant Nos. 21605090, 21874038), Key Scientific Research Program of the Higher Education Institutions of Henan Province (17A150044, 18A150043), Scientific Research Foundation for High-level Talents of Pingdingshan University (PXY-BSQD2016008, PXY-BSQD2016007), and Training Programme Foundation for the National Project of Pingdingshan University (PXY-PYJJ2016003).

Conflicts of Interest

The authors declare no conflict of interest.

References

  1. Gratzel, M. Photoelectrochemical cells. Nature 2001, 414, 338–344. [Google Scholar] [CrossRef] [PubMed]
  2. Townsend, T.K.; Browning, N.D.; Osterloh, F.E. Overall photocatalytic water splitting with NiOx–SrTiO3—A revised mechanism. Energy Environ. Sci. 2012, 5, 9543. [Google Scholar] [CrossRef]
  3. Katz, M.J.; Riha, S.C.; Jeong, N.C. Toward solar fuels: Water splitting with sunlight and “rust”? Chem. Rev. 2012, 256, 2521–2529. [Google Scholar] [CrossRef]
  4. Jasieniak, J.; Smith, L.; Embden, J.; Mulvaney, P. Re-examination of the Size-Dependent Absorption Properties of CdSe Quantum Dots. J. Phys. Chem. 2009, 113, 19468. [Google Scholar] [CrossRef]
  5. Yu, W.W.; Qu, L.H.; Guo, W.Z.; Peng, X.G. Experimental Determination of the Extinction Coefficient of CdTe, CdSe, and CdS Nanocrystals. Chem. Mater. 2003, 15, 2854–2860. [Google Scholar] [CrossRef]
  6. Vogel, R.; Pohl, K.; Weller, H. Sensitization of highly porous, polycrystalline TiO2 electrodes by quantum sized CdS. Chem. Phys. Lett. 1990, 174, 241–246. [Google Scholar] [CrossRef]
  7. Wu, N.Q.; Wang, J.; Tafen, D.N.; Wang, H.; Zheng, J.-J.; Lewis, J.P.; Liu, X.; Leonard, S.S.; Manivannan, A. Shape-Enhanced Photocatalytic Activity of Single-Crystalline Anatase TiO2 (101) Nanobelts. J. Am. Chem. Soc. 2010, 132, 6679–6685. [Google Scholar] [CrossRef]
  8. Calza, P.; Minella, M.; Demarchis, L.; Sordello, F.; Minero, C. Photocatalytic rate dependence on lightabsorption properties of different TiO2 specimens. Catal. Today 2018. [Google Scholar] [CrossRef]
  9. Emeline, A.V.; Ryabchuk, V.; Serpone, N. Factors affecting the efficiency of a photocatalyzed process in aqueous metal-oxide dispersions Prospect of distinguishing between two kinetic models. J. Photochem. Photobiol. Chem. 2000, 133, 89–97. [Google Scholar] [CrossRef]
  10. Pellegrino, F.; Sordello, F.; Minella, M.; Minero, C.; Maurino, V. The Role of Surface Texture on the Photocatalytic H2 Production on TiO2. Catalysts 2019, 9, 32. [Google Scholar] [CrossRef]
  11. Rusinque, B.; Escobedo, S.; Lasa, H. Photocatalytic Hydrogen Production Under Near-UV Using Pd-Doped Mesoporous TiO2 and Ethanol as Organic Scavenger. Catalysts 2019, 9, 33. [Google Scholar] [CrossRef]
  12. Wang, J.; Tafen, D.N.; Lewis, J.P.; Hong, Z.; Manivannan, A.; Zhi, M.; Li, M.; Wu, N. Origin of Photocatalytic Activity of Nitrogen-Doped TiO2 Nanobelts. J. Am. Chem. Soc. 2009, 131, 12290–12297. [Google Scholar] [CrossRef] [PubMed]
  13. Meng, F.; Hong, Z.; Wu, N.Q.; Arndt, J.; Li, M.; Zhi, M.; Yang, F. Visible light photocatalytic activity of nitrogen-doped La2Ti2O7 nanosheets originating from band gap narrowing. Nano Res. 2012, 5, 213–221. [Google Scholar] [CrossRef]
  14. Vogel, R.; Hoyer, P.; Weller, H. Quantum-Sized PbS, CdS, Ag2S, Sb2S3, and Bi2S3 Particles as Sensitizers for Various Nanoporous Wide-Bandgap Semiconductors. Phys. Chem. 1994, 98, 3183–3188. [Google Scholar] [CrossRef]
  15. Michelle, D.R.; Han, M.-Y. Multinary I-III-VI2 and I-II-IV-VI4 Semiconductor Nanostructures for Photocatalytic Applications. Acc. Chem. Res. 2016, 49, 511–519. [Google Scholar]
  16. Du, J.; Du, Z.; Zhong, x.; Pan, Z.; Shen, Q.; Sun, J.; Long, D.; Dong, H.; Sun, L.; Zhong, X.; et al. Zn–Cu–In–Se Quantum Dot Solar Cells with a Certified Power Conversion Efficiency of 11.6%. J. Am. Chem. Soc. 2016, 138, 4201–4209. [Google Scholar] [CrossRef]
  17. Peng, W.; Du, J.; Pan, Z. Alloying Strategy in Cu-In-Ga-Se Quantum Dots for High Efficiency Quantum Dot Sensitized Solar Cells. Acs. Appl. Mater. Interfaces 2017, 9, 6. [Google Scholar] [CrossRef]
  18. McDaniel, H.; Koposov, A.Y.; Draguta, S.; Makarov, N.S.; Pietryga, J.M.; Klimov, V.I. Simple yet Versatile Synthesis of CuInSexS2−x Quantum Dots for Sunlight Harvesting. J. Phys. Chem. 2014, 118, 16987. [Google Scholar] [CrossRef]
  19. Jiao, S.; Du, J.; Zhong, X.; Du, Z.; Long, D.; Jiang, W.; Pan, Z.; Li, Y. Nitrogen-Doped Mesoporous Carbons as Counter Electrodes in Quantum Dot Sensitized Solar Cells with a Conversion Efficiency Exceeding 12%. J. Phys. Chem. Lett. 2017, 8, 559–564. [Google Scholar] [CrossRef]
  20. Hou, W.; Cronin, S.B. A Review of Surface Plasmon Resonance Enhanced Photocatalysis. Adv. Funct. Mater. 2013, 23, 1612–1619. [Google Scholar] [CrossRef]
  21. Christopher, P.; Xin, H.; Marimuthu, A.; Linic, S. Singular characteristics and unique chemical bond activation mechanisms of photocatalytic reactions on plasmonic nanostructures. Nat. Mater. 2012, 11, 1044–1050. [Google Scholar] [CrossRef] [PubMed]
  22. Geng, H.; Du, P.; Sheng, P. Architecting Bi2S3/graphene quantum dots/TiO2 photoelectrodes for aqueous Cr(VI)/methyl orange removal. Mater. Lett. 2018, 214, 146–149. [Google Scholar] [CrossRef]
  23. Pu, Y.; Wang, G.; Chang, K.; Ling, Y.; Lin, Y.-K.; Fitzmorris, B.C.; Liu, C.-M.; Lu, X.; Tong, Y.; Zhang, J.Z.; et al. Au Nanostructure-Decorated TiO2 Nanowires Exhibiting Photoactivity Across Entire UV-visible Region for Photoelectrochemical Water Splitting. Nano Lett. 2013, 13, 3817–3823. [Google Scholar] [CrossRef] [PubMed]
  24. Sheng, P.; Li, W.; Tong, X.; Wang, X.; Cai, Q. Development of a high performance hollow CuInSe2 nanospheres-based photoelectrochemical cell for hydrogen evolution. J. Mater. Chem. 2014, 2, 18974–18987. [Google Scholar] [CrossRef]
  25. Cassette, E.; Pons, T.; Bouet, C.; Helle, M.; Bezdetnaya, L.; Marchal, F.; Dubertet, B. Synthesis and Characterization of Near-Infrared Cu−In−Se/ZnS Core/Shell Quantum Dots for In vivo Imaging. Chem. Mater. 2010, 22, 6117–6124. [Google Scholar] [CrossRef]
  26. Yarema, O.; Yarema, M.; Wood, V. Tuning the Composition of Multicomponent Semiconductor Nanocrystals: The Case of I–III–VI Materials. Chem. Mater. 2018, 30, 1446–1461. [Google Scholar] [CrossRef]
  27. Brus, L.E. Electron–electron and electron-hole interactions in small semiconductor crystallites: The size dependence of the lowest excited electronic state. J. Chem. Phys. 1984, 80, 4403–4409. [Google Scholar] [CrossRef]
  28. Hassanien, A.S.; Akl, A.A. Influence of composition on optical and dispersion parameters of thermally evaporated non-crystalline Cd50S50−xSex thin films. J. Alloys Compd. 2015, 648, 280–290. [Google Scholar] [CrossRef]
Scheme 1. The synthesis schematic diagram of ZCISe QDs.
Nanomaterials 09 00393 sch001
Figure 1. (a) Photoluminescence (PL) emission and (b) UV-vis absorption spectra of ZCISe QDs. The inset of panel (a) shows the digital photographs of the corresponding QDs under natural light and UV light illumination (365 nm).
Nanomaterials 09 00393 g001
Figure 2. (a) XRD, (b) TEM and HRTEM (inset of (b)) images of the ZCISe QDs.
Nanomaterials 09 00393 g002
Figure 3. The SEM images of TiO2 nanowire arrays (a), TiO2/Ag (b), TiO2/Ag/ZCISe (c) and TiO2/Ag/ZCISe/CdS (d).
Nanomaterials 09 00393 g003
Figure 4. (a) HRTEM, (b) Local magnification and (c) EDS images of TiO2/Ag/ZCISe/CdS.
Nanomaterials 09 00393 g004aNanomaterials 09 00393 g004b
Figure 5. (a) UV-Vis spectra of TiO2, TiO2/Ag, TiO2/ZCISe, TiO2/CdS, TiO2/Ag/ZCISe, and TiO2/Ag/ZCISe/CdS composite structure, (b) the Tauc plots of different samples.
Nanomaterials 09 00393 g005
Figure 6. The photocurrent density of electrodes under intermittent (a) and successive (b) simulated sunlight irradiation.
Nanomaterials 09 00393 g006
Figure 7. Hydrogen production of different materials.
Nanomaterials 09 00393 g007
Figure 8. PL spectrum of (a) FTO/ZCISe, (b) TiO2/ZCISe, (c) FTO/ZCISe/CdS, (d) TiO2/ZCISe/CdS, (e) TiO2/Ag/ ZCISe, (f) TiO2/Ag/ZCISe/ CdS.
Nanomaterials 09 00393 g008
Scheme 2. Schematic diagram of TiO2/Ag/ZCISe/CdS photoelectrode and its mechanism of photocatalytic hydrogen production.
Nanomaterials 09 00393 sch002

