Article

Engineering Surface and Optical Properties of TiO2-Coated Electrospun PVDF Nanofibers Via Controllable Self-Assembly

1
College of Civil Engineering, Guangzhou University, Guangzhou 510006, China
2
College of Chemical Engineering, Guangdong University of Petrochemical Technology, Maoming 525000, China
*
Author to whom correspondence should be addressed.
Nanomaterials 2018, 8(9), 741; https://doi.org/10.3390/nano8090741
Submission received: 21 August 2018 / Revised: 11 September 2018 / Accepted: 14 September 2018 / Published: 19 September 2018

Abstract

:
Understanding the effect of a porous TiO2 nanolayer on the optical scattering and absorption through electrospun fibers is of great importance for the design and development of advanced optical extinction materials. Based on electrospinning and controllable self-assembly techniques, pure electrospun poly(vinylidene fluoride) (PVDF) fibers and TiO2-coated ones with different self-assembly cycles were prepared. The effect of TiO2 self-assembly cycles on surface parameters, e.g., thickness, assembled content, and porosity of the TiO2 nanolayer were determined by scanning electron microscopy, thermogravimetric analysis, and Fourier transform infrared spectroscopy. With an increase in the self-assembly cycles, the TiO2-coated electrospun PVDF fibers presented rougher surfaces and greater average diameters. According to the characterized surface parameters, the effects of the controllable self-assembly on the optical refractive index, absorption index, and infrared extinction were investigated to increase the optical properties of electrospun PVDF fibers. The results indicated that an increase of almost 120–130 cm−1 in infrared extinction could be achieved through the controllable self-assembly with only 5.7 wt. % assembled TiO2 content. This is highly efficient when compared with other coating modes. We believe that this study could give some positive guidance in the design of TiO2-coated electrospun fibers for improving their surface and optical properties.

1. Introduction

Fibrous materials, given their excellent optical extinction capacity, have drawn growing attention in both academic [1,2] and industrial areas [3], and mainly include commonly used fibers and electrospun fibers [4]. Electrospun fibers have remarkable characteristics such as a fairly large surface-to-volume ratio, high porosity, low density, and excellent flexibility [5,6]. In general, electrospun fibers can be cataloged into pure organic fibers, pure inorganic fibers, and organic/inorganic hybrids [7] such as poly(vinyl alcohol) (PVA) [8] for organic fibers, carbons [9] for inorganic fibers, and polyacrylonitrile (PAN)/AgCl composite fibers for hybrids [10].
However, electrospun fibers generally exhibit a lower optical extinction capacity than the commonly used fibers because of their much smaller diameters [11]. For instance, Caps et al. [12] studied the influence of the diameter on the infrared extinction of polypropylene fibers and found that the infrared extinction decreased from ~50 to 10 m2·kg−1 as the diameter of polypropylene fibers decreased from 6 to 1 μm. Nanoparticles with excellent capabilities of refraction and absorption (e.g., Al, SiC, TiO2) are generally incorporated into the polymer [13,14,15,16,17] to improve the optical extinction capacity such as electrospun PAN-Ag composites [18]. Among these nanoparticles, nano TiO2 presents remarkable superiorities in a large surface area, an ultrafine size, and a strong interfacial interaction [19]. For instance, the combination of TiO2 nanoparticles and electrospun fibers have exhibited various potential applications in protective clothing systems, photocatalysis, sensors, and electrodes [20,21].
It is obvious that the distribution of nano TiO2 in an electrospun fibrous membrane plays a key role in the increase of optical extinction capacity. There are five typical modes in relation to the distribution of nano TiO2. The first mode is a random or uniform distribution by a directly physical mixture during the preparation process [22]. Our previous study on a random distribution of TiO2 particles showed that the optical extinction capacity could be increased by ~40% with the addition of 10 wt. % TiO2 particles into the fibrous matrix [23]. The second mode is to form a smooth and continuous TiO2 membrane on the surface of electrospun fibers [24]. For instance, Danion et al. coated a TiO2 membrane on the surface of optical fibers and prepared a single-TiO2-coated optical fiber reactor [24]. The results indicated that as the thickness of the TiO2 membrane increased from 0 to ~300 nm, the extinction coefficient was increased by 3000 cm−1 at the axis direction. The third mode is the nanorod coating with a certain diameter and length [25]. Yang et al. prepared TiO2 nanorod coating layers on mullite fibers for infrared opacifier application [26]. They found that the optical properties of mullite fibers could be improved up to 2–4 folds after the coating of TiO2 nanorod layers. The fourth mode is the rice-like geometry of the TiO2 nanoparticles coated on the surface of electrospun fibers. For example, Zhao et al. [27] prepared nylon 6 fibers with a TiO2 rice-like coating and investigated their extinction capacities. The results indicated a high increase of almost 200 cm−1 in the extinction coefficient after the TiO2 rice-like coatings.
Apart from those modes above-mentioned, controllable self-assembly is a particular mode that forms a porous nanolayer of TiO2 nanoparticles coated on the surface of electrospun fibers [28]. Layer-by-layer (LBL) self-assembly has been widely considered as one of the most popular coating techniques that involves the sequential adsorption of oppositely charged materials to construct ultrathin conformal coatings [29]. This coating mode enlarges the scattering and absorptive influences given its porous nanostructure, and thereby could be an efficient strategy to enhance the optical extinction capacity of electrospun fibers. However, as far as we know, knowledge regarding the influence of a porous TiO2 nanolayer on the optical extinction capacity is extremely limited, although this influence can be significant [30].
Therefore, the aim of this paper was to experimentally investigate the engineering surface and optical properties of TiO2-coated electrospun fibers. By taking poly(vinylidene fluoride) (PVDF) fibers as an example of fibrous materials, TiO2-coated electrospun fibers were first prepared by assembling TiO2 on the fiber surface with the techniques of electrospinning and LBL assembling. Next, the effect of the controllable self-assembly on the optical refractive index, absorption index, and infrared extinction were investigated to optimize the optical properties of electrospun fibers. Through a comparative analysis with different coating modes and surface morphologies, the mechanism of the increase in infrared extinction of TiO2-coated electrospun fibers through the controllable self-assembly was revealed.

2. Experimental

2.1. Materials

PVDF particles, ethyl alcohol (EtOH, >99%), and N,N-dimenthyl-formamide (DMF, >98%) were bought from Baishi Co. Ltd., Ningbo, China. Nano TiO2 powder (anatase, diameter of ~7–10 nm, hydrolyzed) was bought from Jingrui New Material Co. Ltd., Xuancheng, China. Polyacrylic acid (PAA, >99%) was purchased from Damao Co. Ltd., Shanghai, China. Hydrochloric acid (HCl, ~37%) was bought from Guanghua Co. Ltd., Guangzhou, China and used by diluting with 10-fold deionized water.

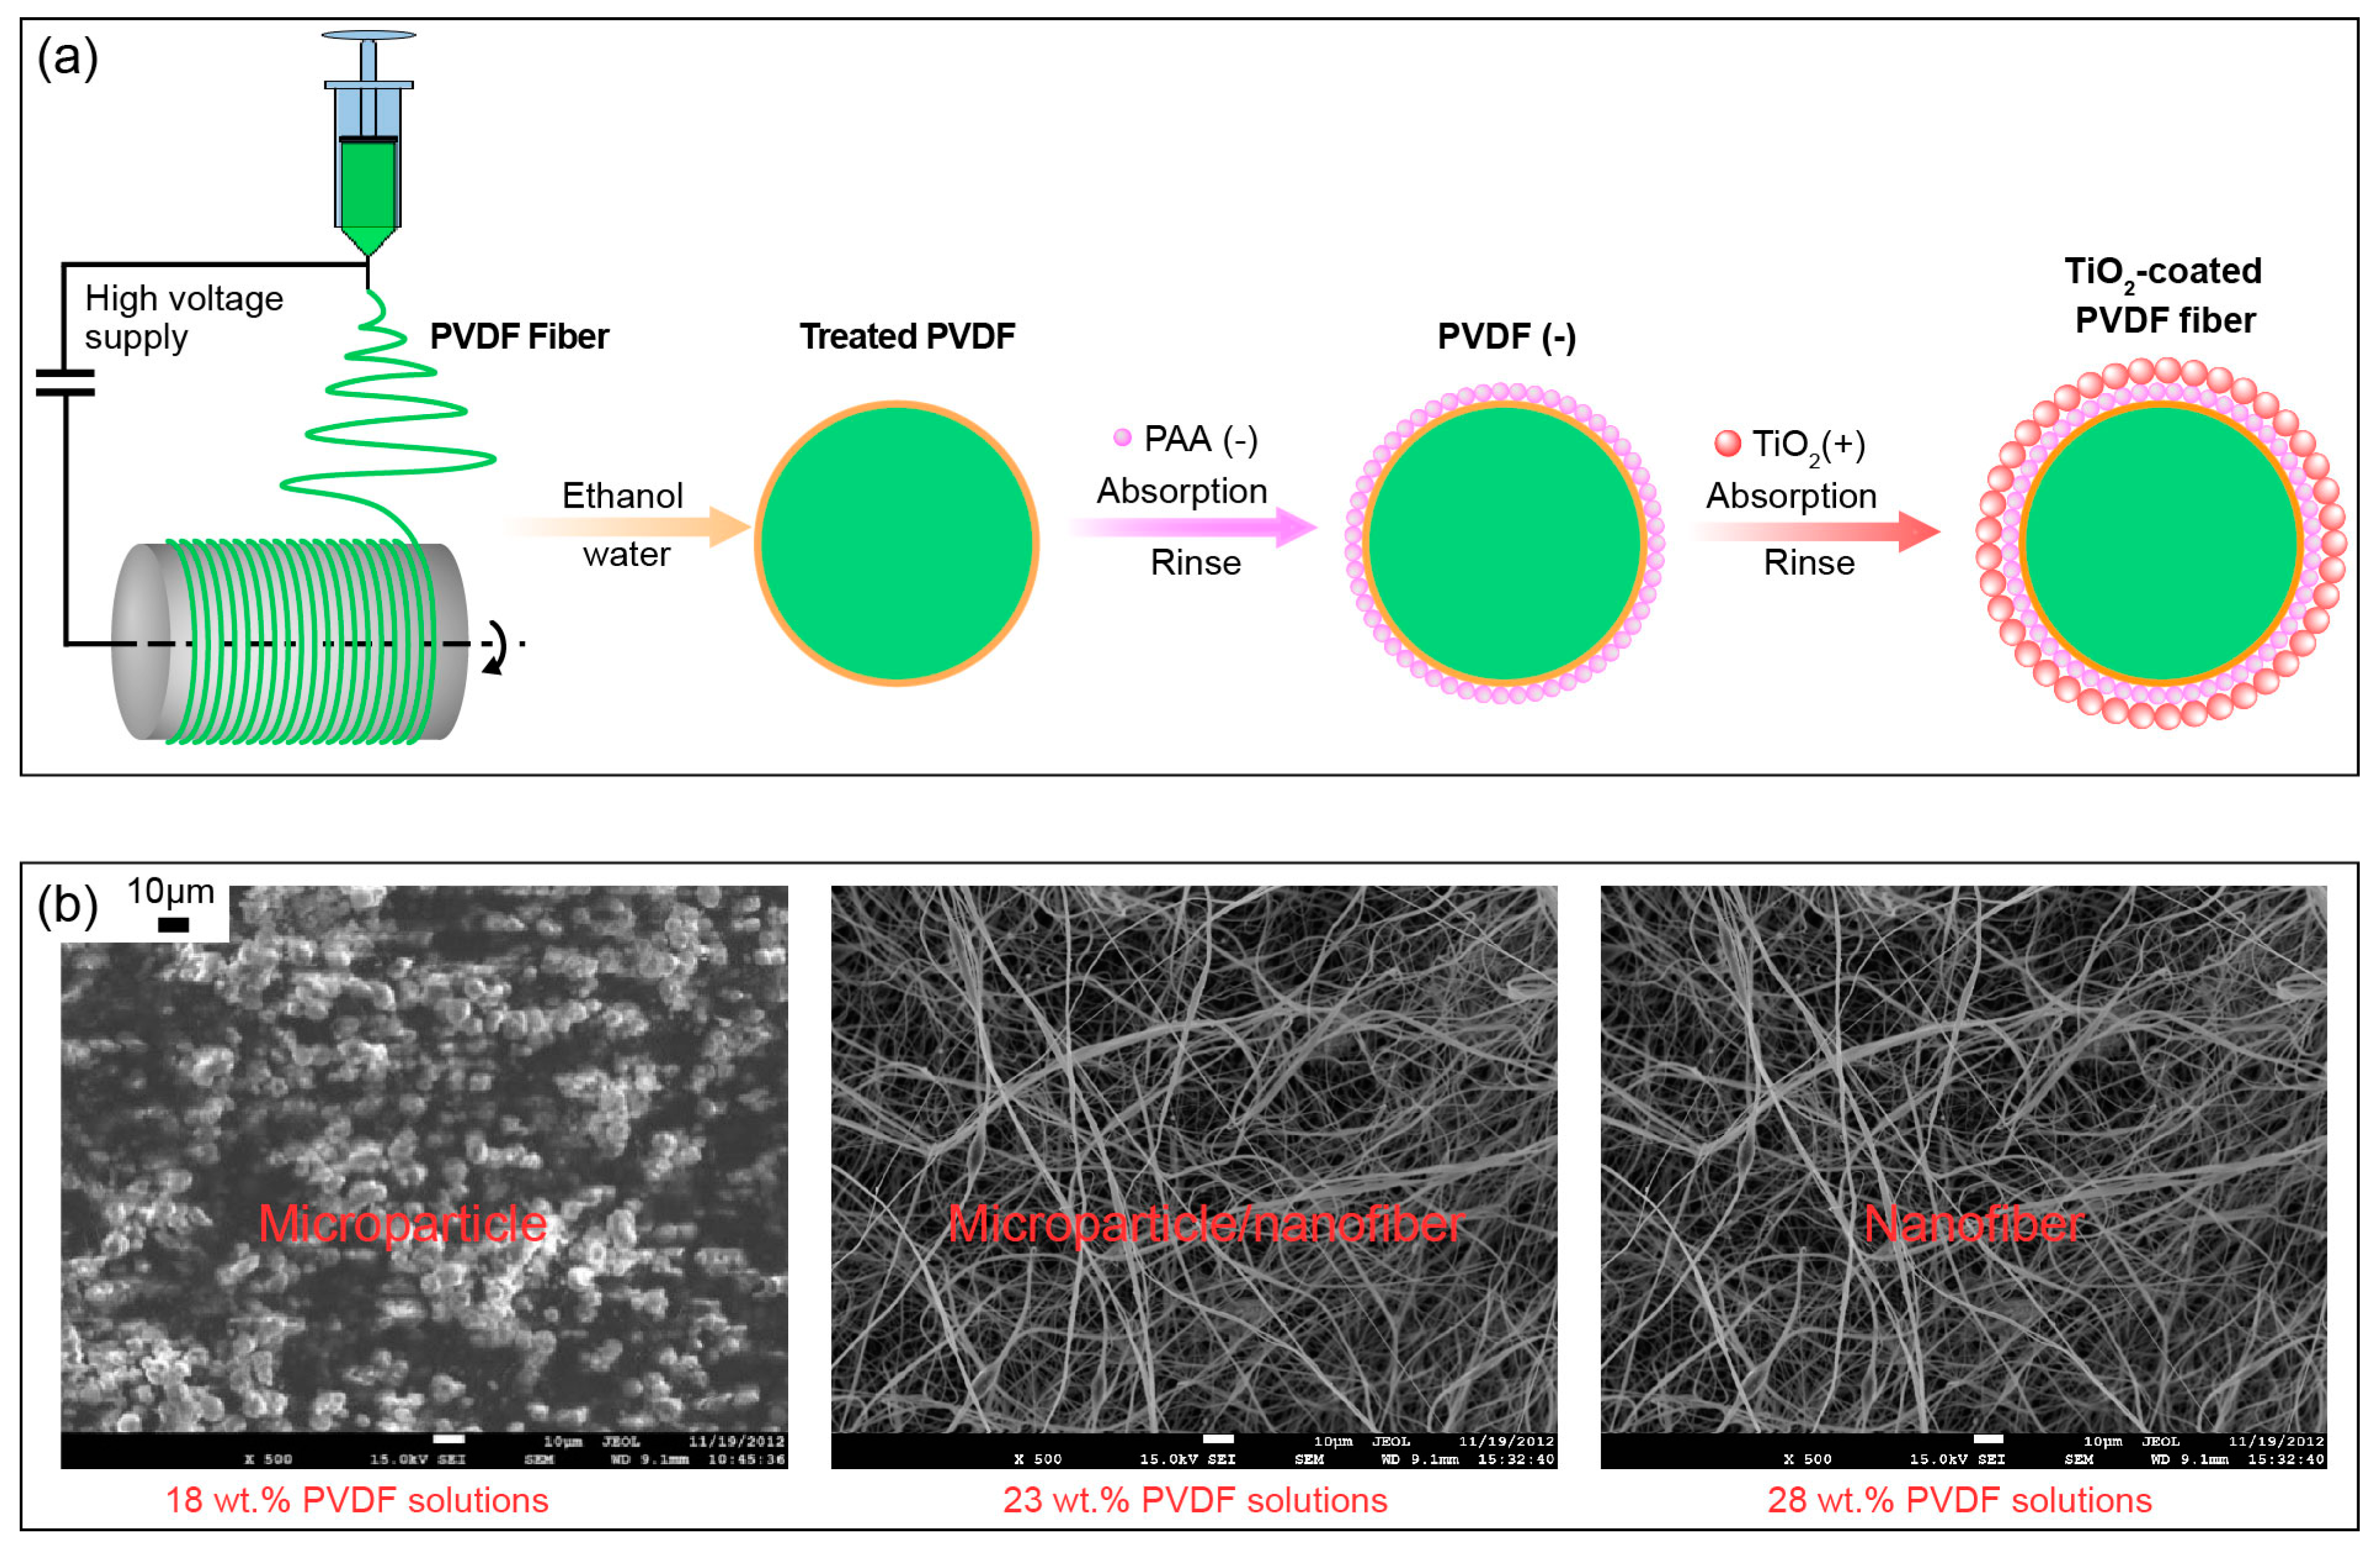
2.2. Preparations of TiO2-Coated Electrospun Fibers

PVDF electrospun fibers were first produced by electrospinning [31]. Next, TiO2-coated electrospun fibers were prepared by using the LBL self-assembly technique [32]. Figure 1 shows the detailed preparation process with the following five steps:
(i) A PVDF solution was magnetically stirred for 0.5 h in a 60 °C water bath, and for another 0.5 h in a 25 °C water bath to cool down.
(ii) The PVDF solution was poured into a syringe in an electrospinning apparatus (Model: NEU), which was made by Kato Tech. Co. Ltd., Sangyo, Japan. The main components for electrospinning included a syringe pump, a DC power, a grounded electrode, a stainless nozzle (with a diameter of 1.0 mm), and a drum collector covered with aluminum foil to collect the electrospun fibers.
(iii) The collected electrospun fibers were dried for 24 h in an oven (model: DGX-9243B, Fuma Lab. Instrum. Co. Ltd., Shanghai, China) at 60 °C. The electrospun PVDF fibers were then treated by soaking in ethanol and replacing with water for 0.5 h to improve the wettability of water on the electrospun PVDF fibers.
(iv) The process of the coating for a porous TiO2 nanolayer on the electrospun PVDF membrane by one self-assembly time was as follows. An anionic PAA solution with a concentration of 10 mol. % in deionized water was prepared. An aqueous dispersion solution with a 0.5 wt. % ratio of TiO2 particles to deionized water was prepared with a pH of 2.5. The wetted electrospun PVDF fibers were immersed into the anionic PAA solution for 15 min and deionized water for three minutes (three times, 1 min/time) in sequence. Next, the PAA-attached electrospun PVDF fibers were soaked in the aqueous dispersion solution of TiO2 for 15 min and deionized water for three minutes (three times, 1 min/time) in sequence.
(v) Step (iv) can be repeated to obtain TiO2-coated electrospun PVDF fibers with different thicknesses of the porous TiO2 nanolayer through controllable self-assembly cycles. In this paper, we prepared four samples in total, i.e., pure electrospun PVDF fibers (abbreviated as PE), TiO2-coated electrospun PVDF fibers with two, four, and six self-assembly cycles (abbreviated as TE#1–TE#3, correspondingly).
It should be noted that the electrospinning parameters (e.g., the solvent, solution composition, distance between needle and target, and voltage) have an influence on the morphology and fiber diameter of electrospun fibers. Compared with some other solvents such as N-methylpyrrolidone and dimethyl sulfoxide, the solvent DMF was considered to create the smallest fiber diameter and highest piezoelectric properties [33]. Furthermore, our previous studies presented the influence of solution composition (18 wt. %, 23 wt. %, and 28 wt. % solution of PVDF particles to DMF) on the morphology and fiber diameter of electrospun PVDF fibers, as shown in Figure 1b [34]. Of the three PVDF solutions, the 28 wt. % showed the optimal one, as its nanofiber was several hundred nanometers in diameter, while it showed microparticles and microparticles/nanofibers for the 18 wt. % and 23 wt. % PVDF solutions. The other optimized settings were 15 cm for the distance between the nozzle and target, and a voltage setting of 15 kV [34,35]. Therefore, the following preparations of TiO2-coated electrospun fibers were based on these optimal electrospinning parameters.

2.3. Characterizations

A JSM-7001F field emission scanning electron microscopy (SEM) from JEOL Ltd., Tokyo, Japan was employed to observe the microstructural morphologies of the samples. All samples were dried for 12 h at 60 °C before characterization.
Nano-measurer (Version V1.2.5) software (Fudan University, Shanghai, China) for particle size distribution calculations was used to measure the diameter distributions of the samples. The average fiber diameter was fitted by the Gaussian distribution.
A thickness gauge bought from Chenlu Co. Ltd., Ningbo, China was employed to measure the thickness of the samples. Five measurements were conducted at different positions of each sample and averaged to obtain an average thickness (Lm).
A BP211D electronic analytical balance bought from Sartorius Co., Aubagne, France was employed to measure the mass (M) of the samples.
A TGA400 thermal gravimetric (TG) analyzer bought from PerkinElmer Inc., Waltham, Mass., USA. was employed to measure the TiO2 content in the TiO2-coated electrospun PVDF fibers. The parameters of the TGA experiment included a heating rate of 10 °C·min−1, a heating temperature from 20 to 800 °C, and a nitrogen flow rate of 50 mL·min−1.
A Fourier transform infrared (FTIR) spectrometer bought from Bruker Co., München, Germany was employed to measure the spectral transmittances ( τ λ ) under a wavenumber range of 400–4000 cm−1. The τ λ is the ratio that an incident intensity passes through a sample. Two measurements were conducted at the front and reverse side of the sample and averaged to determine the τ λ .

3. Results and Discussion

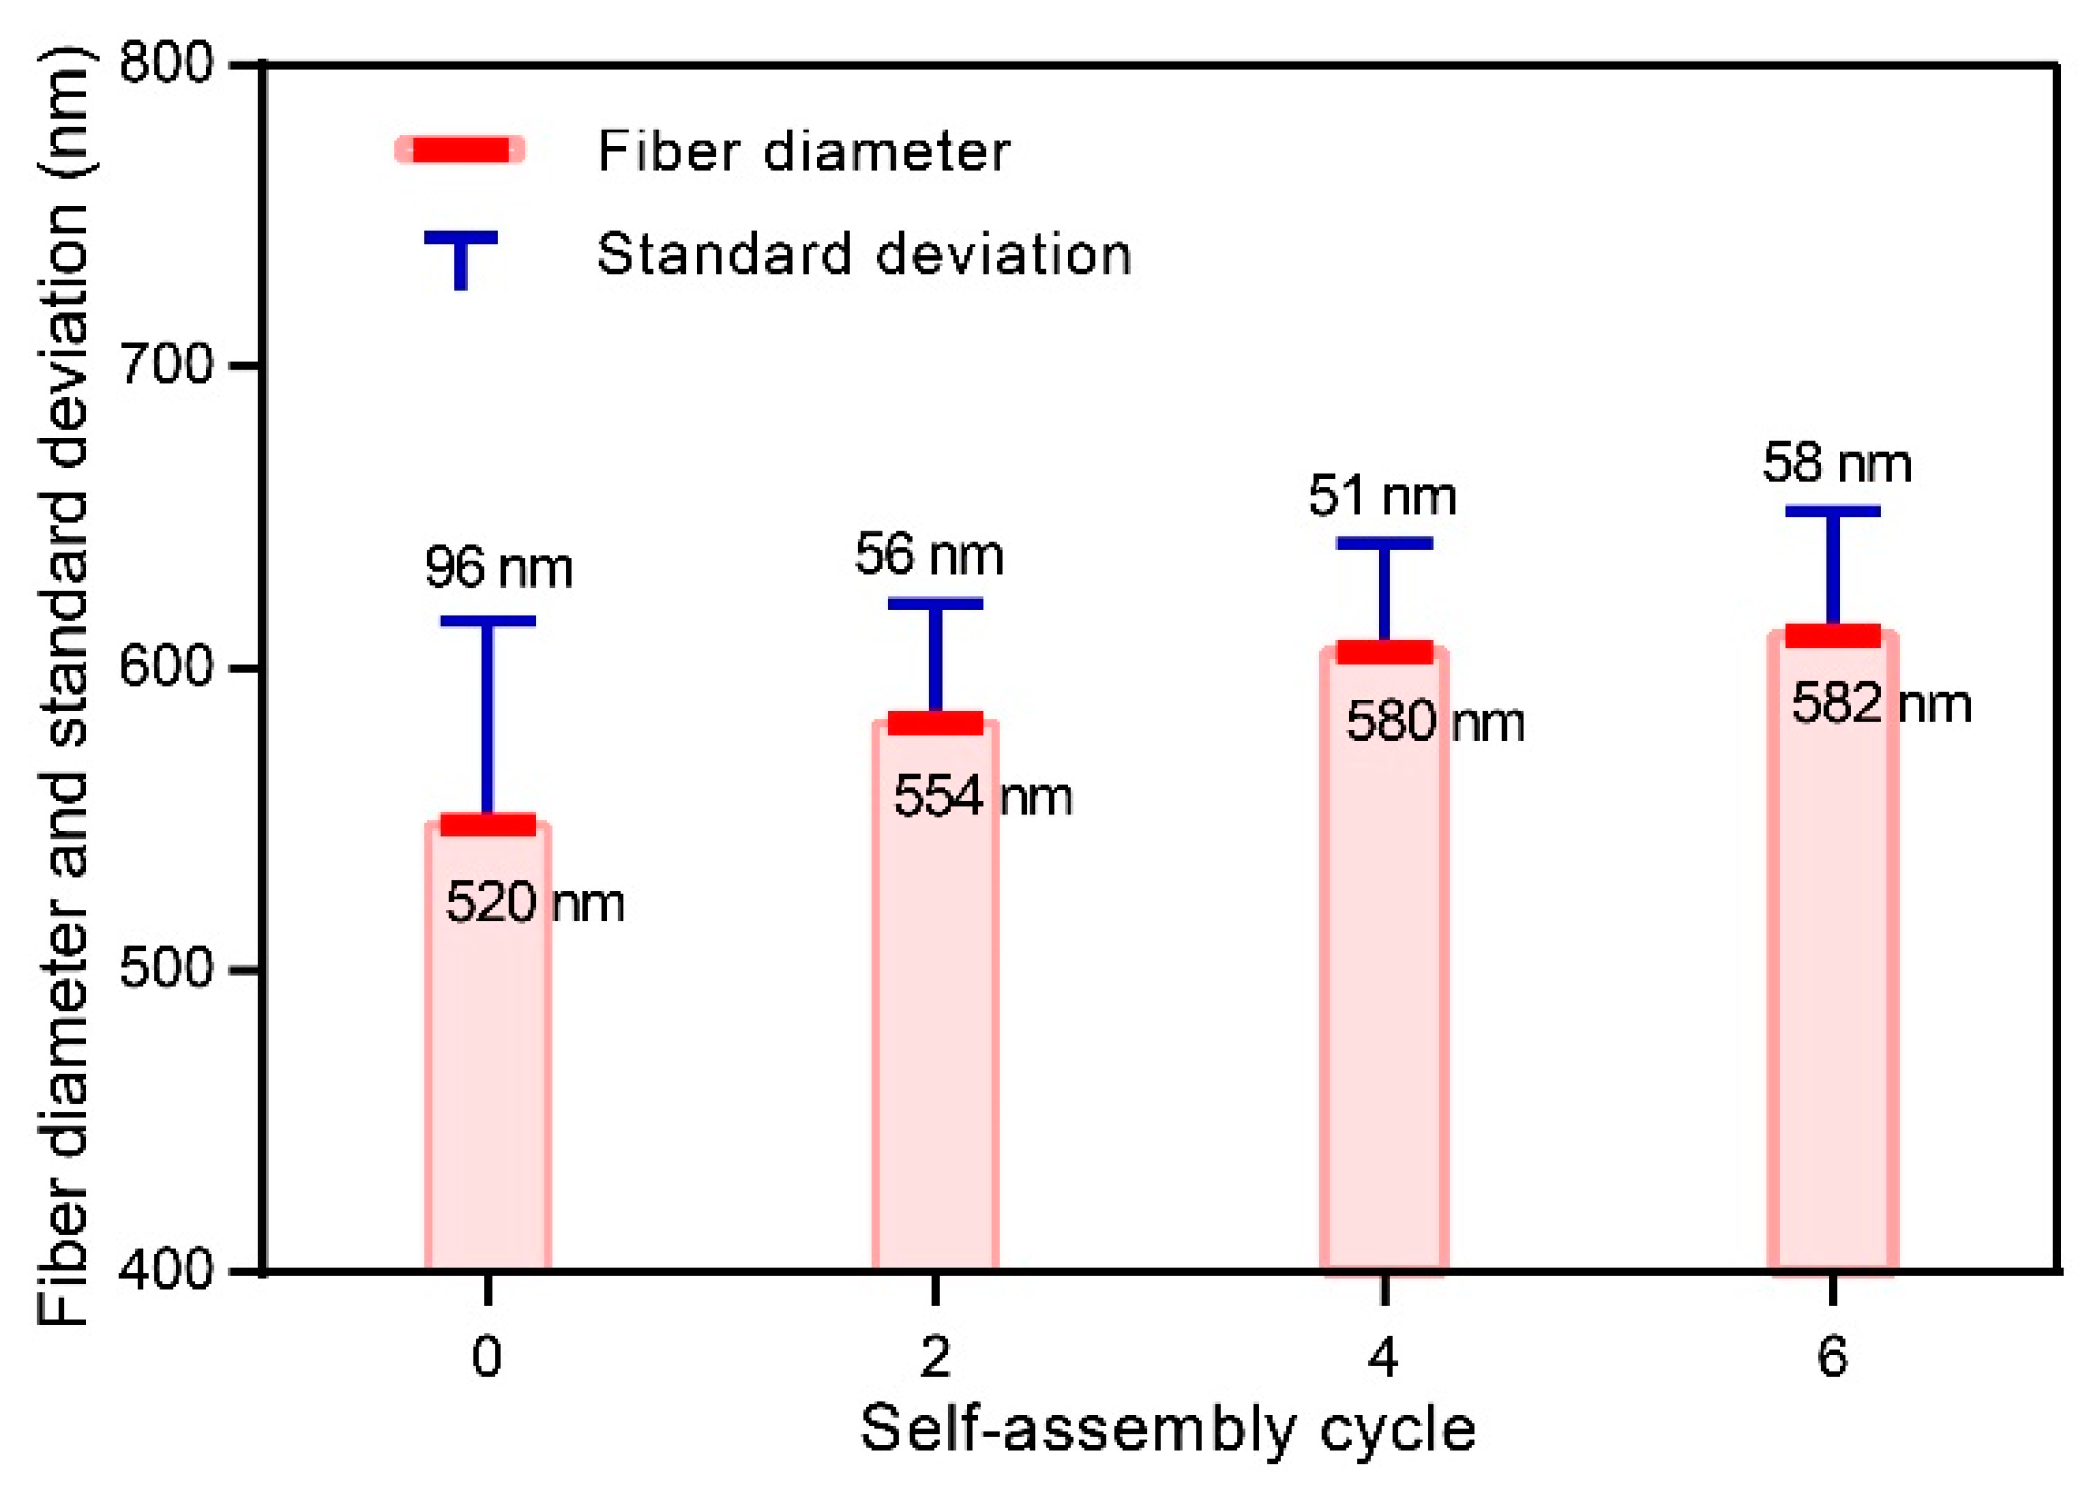
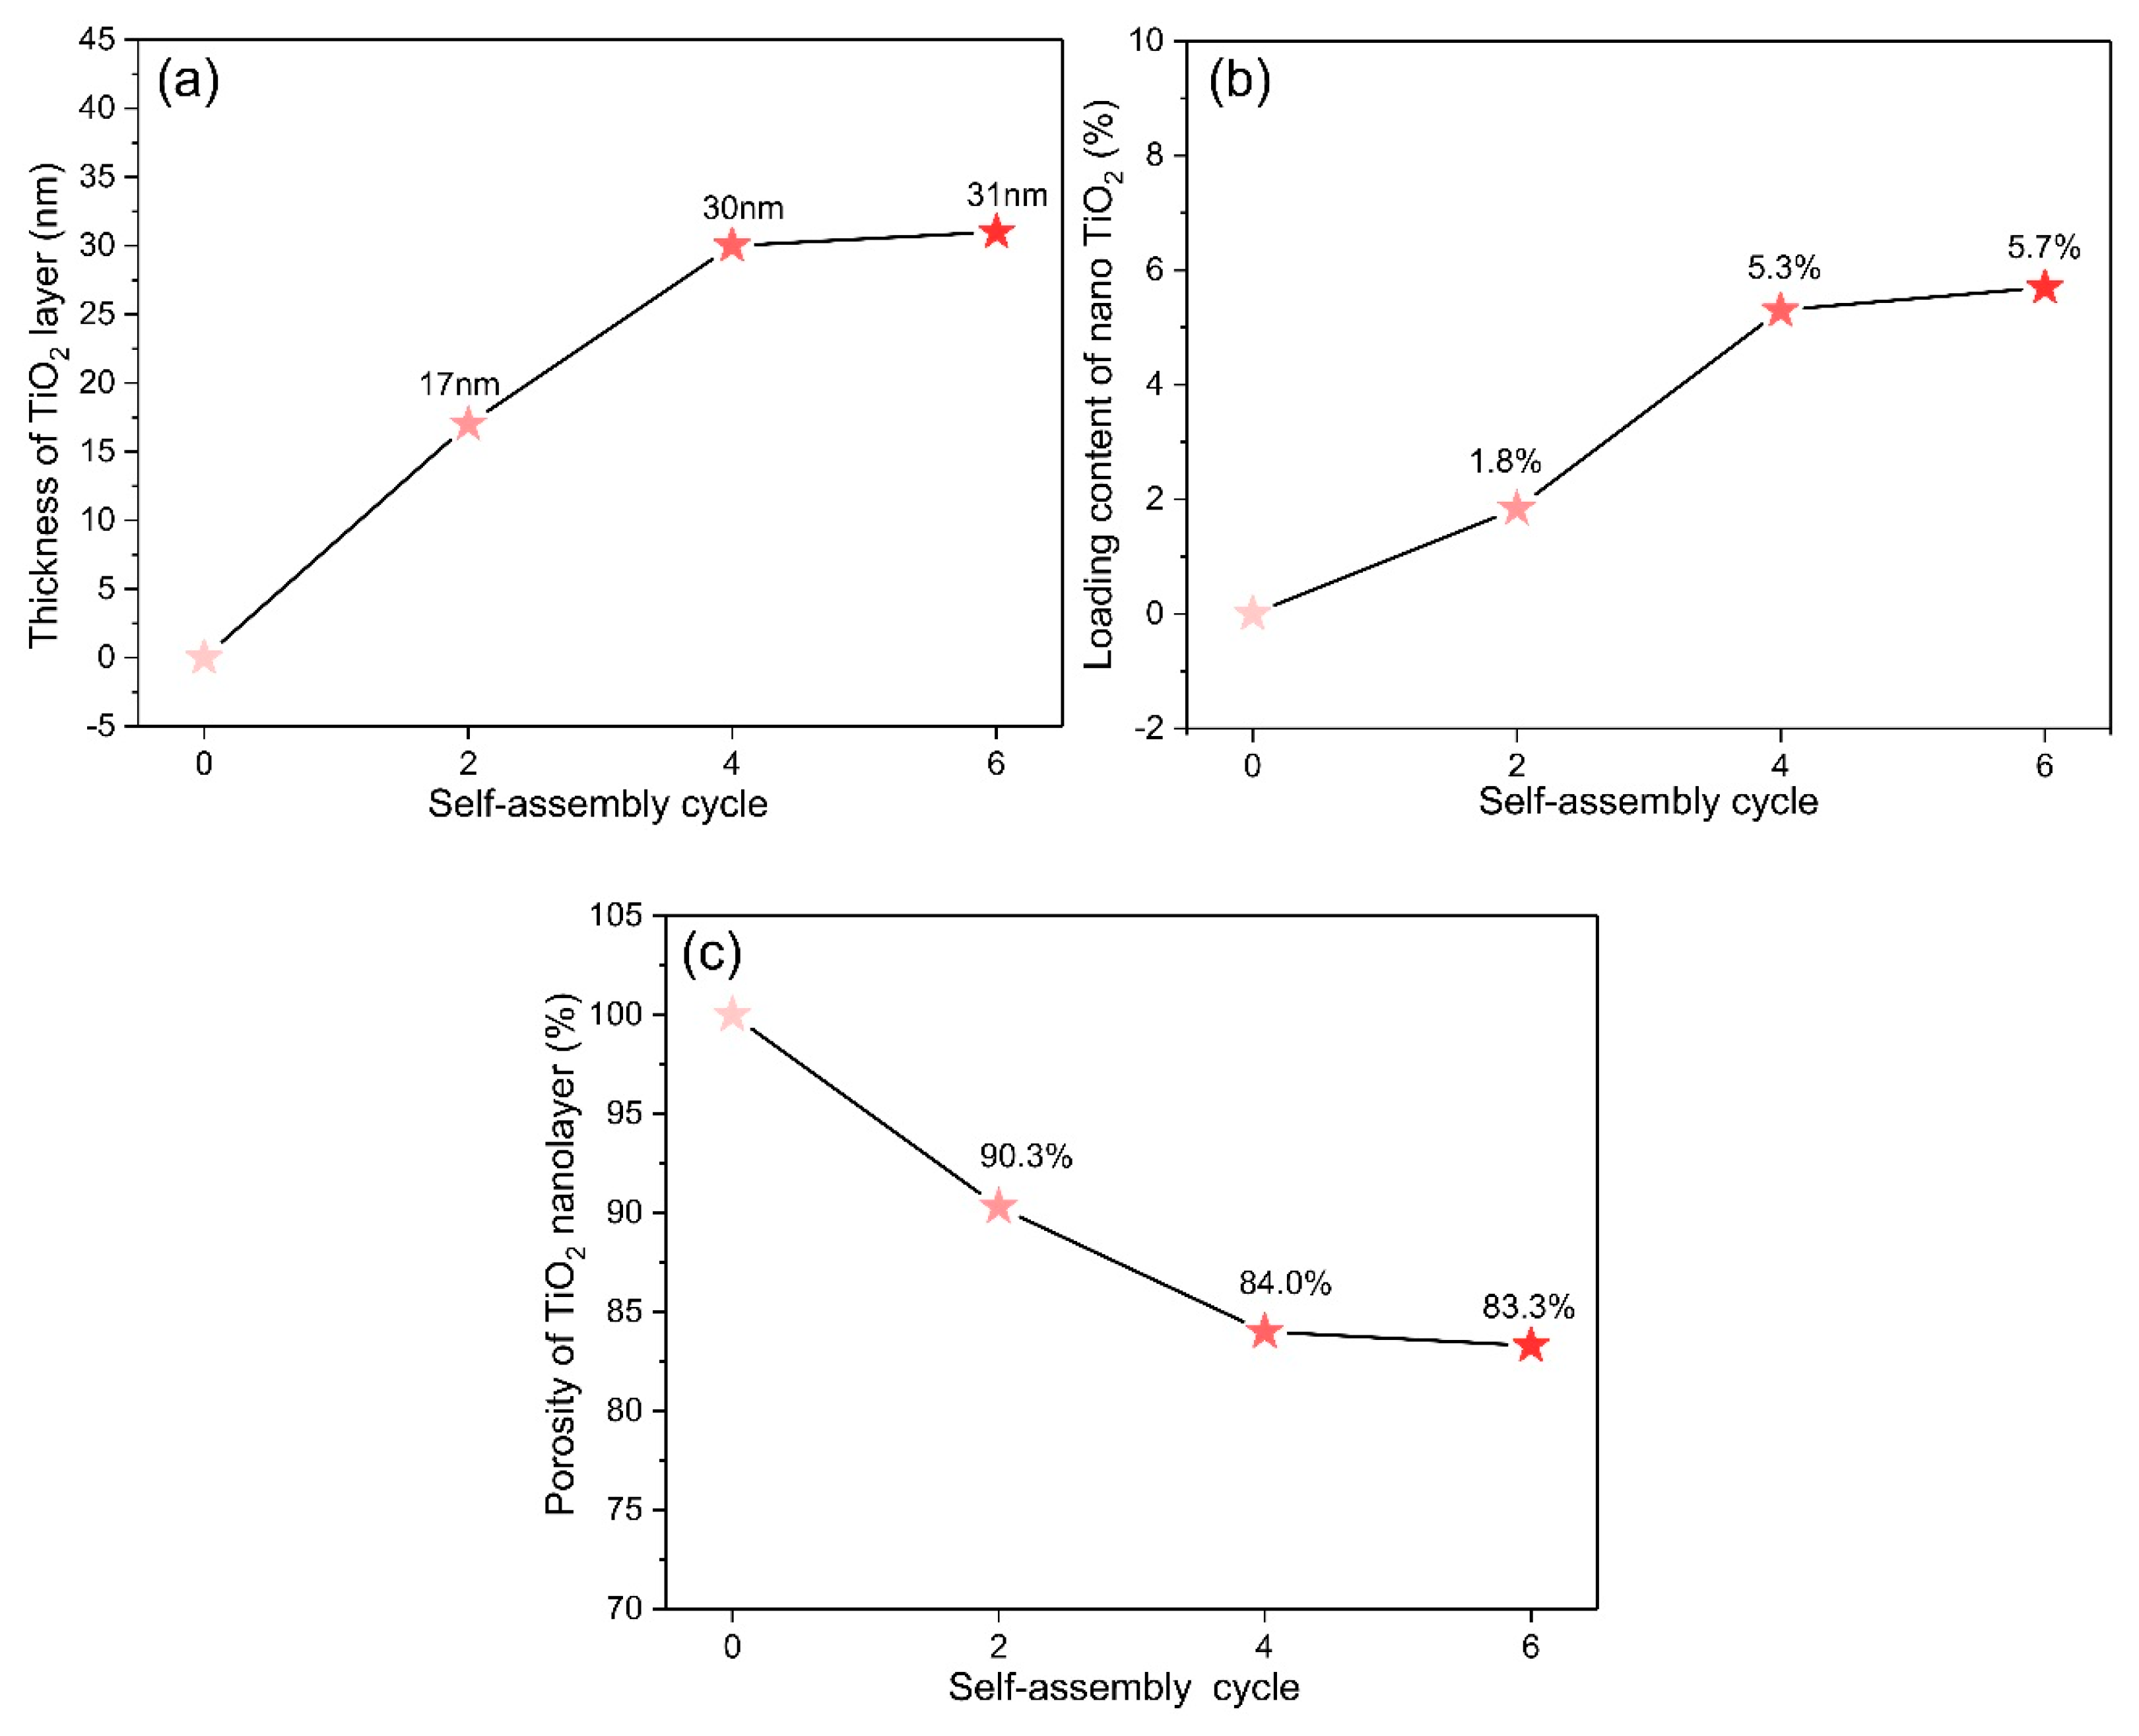
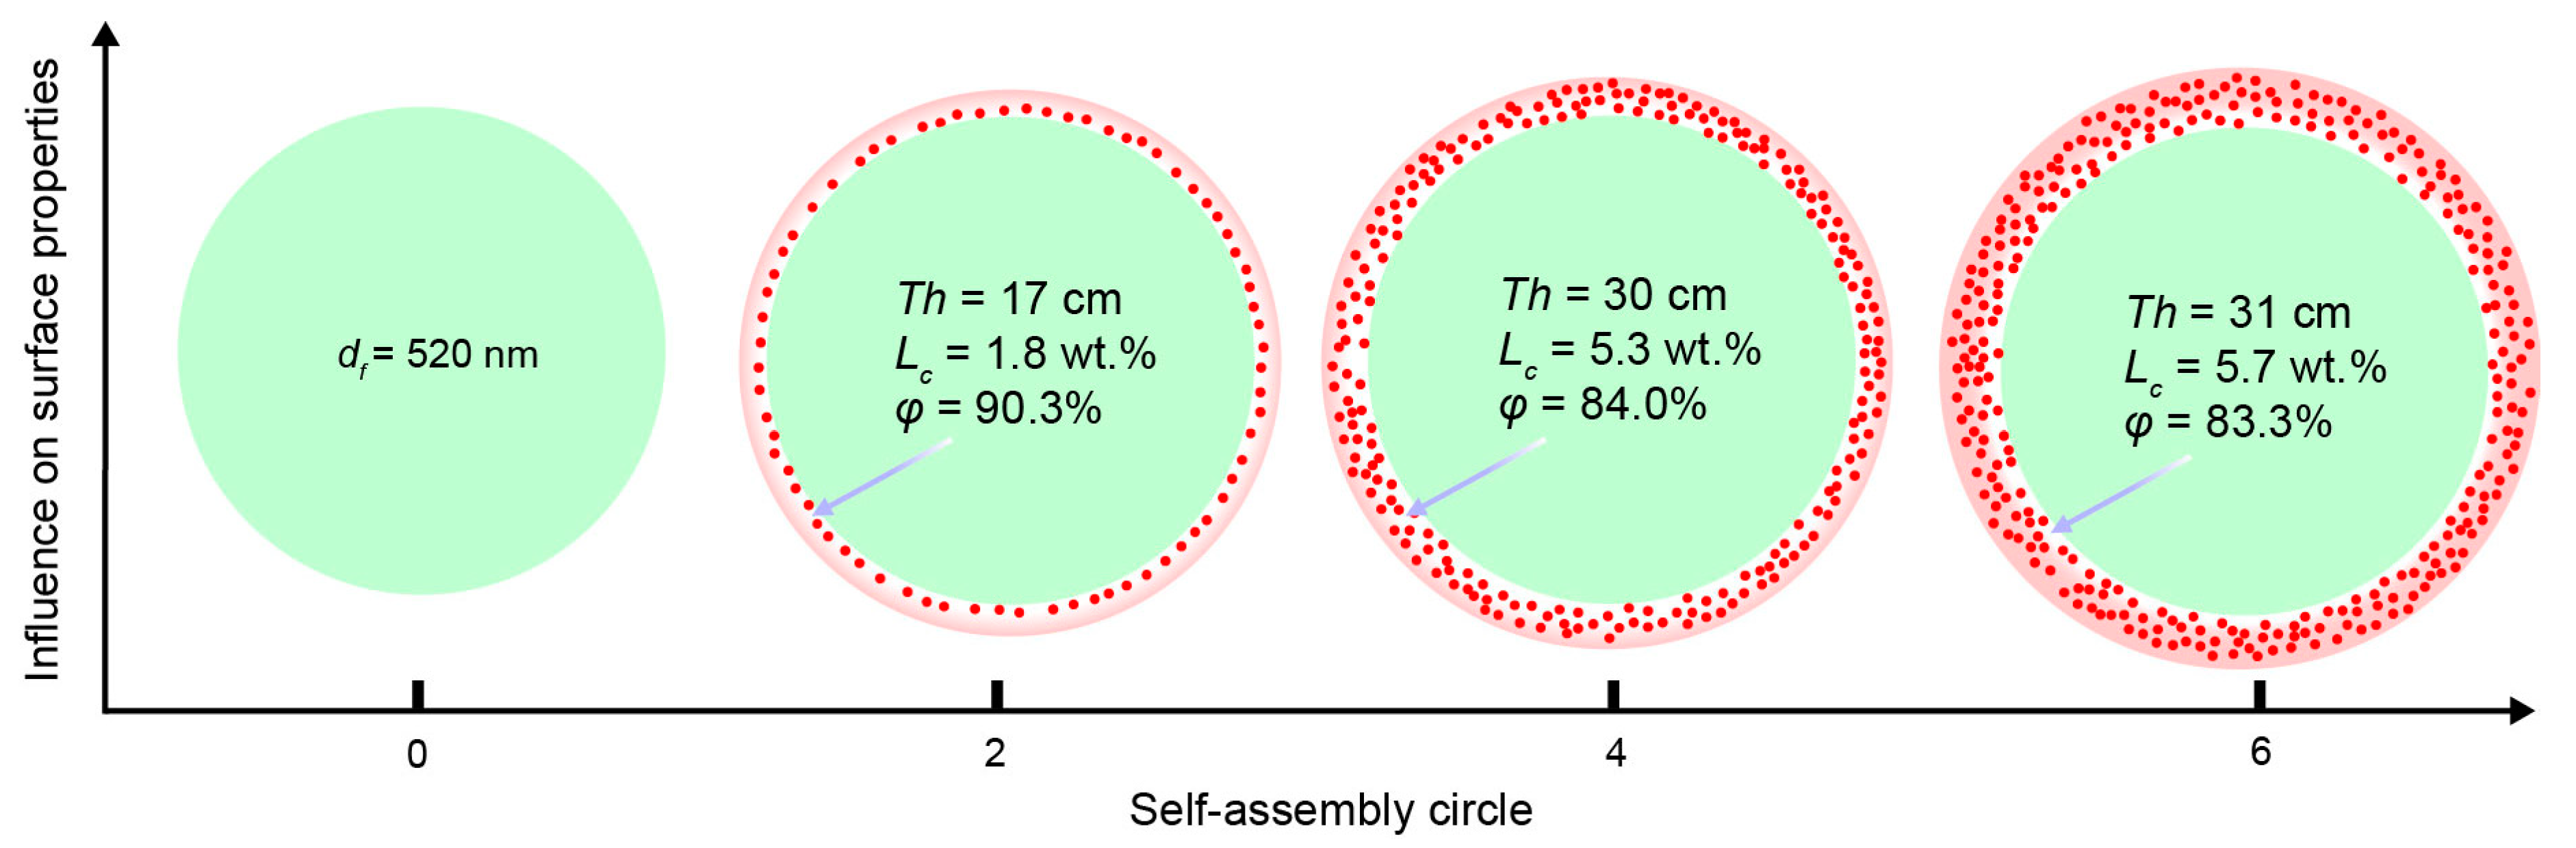
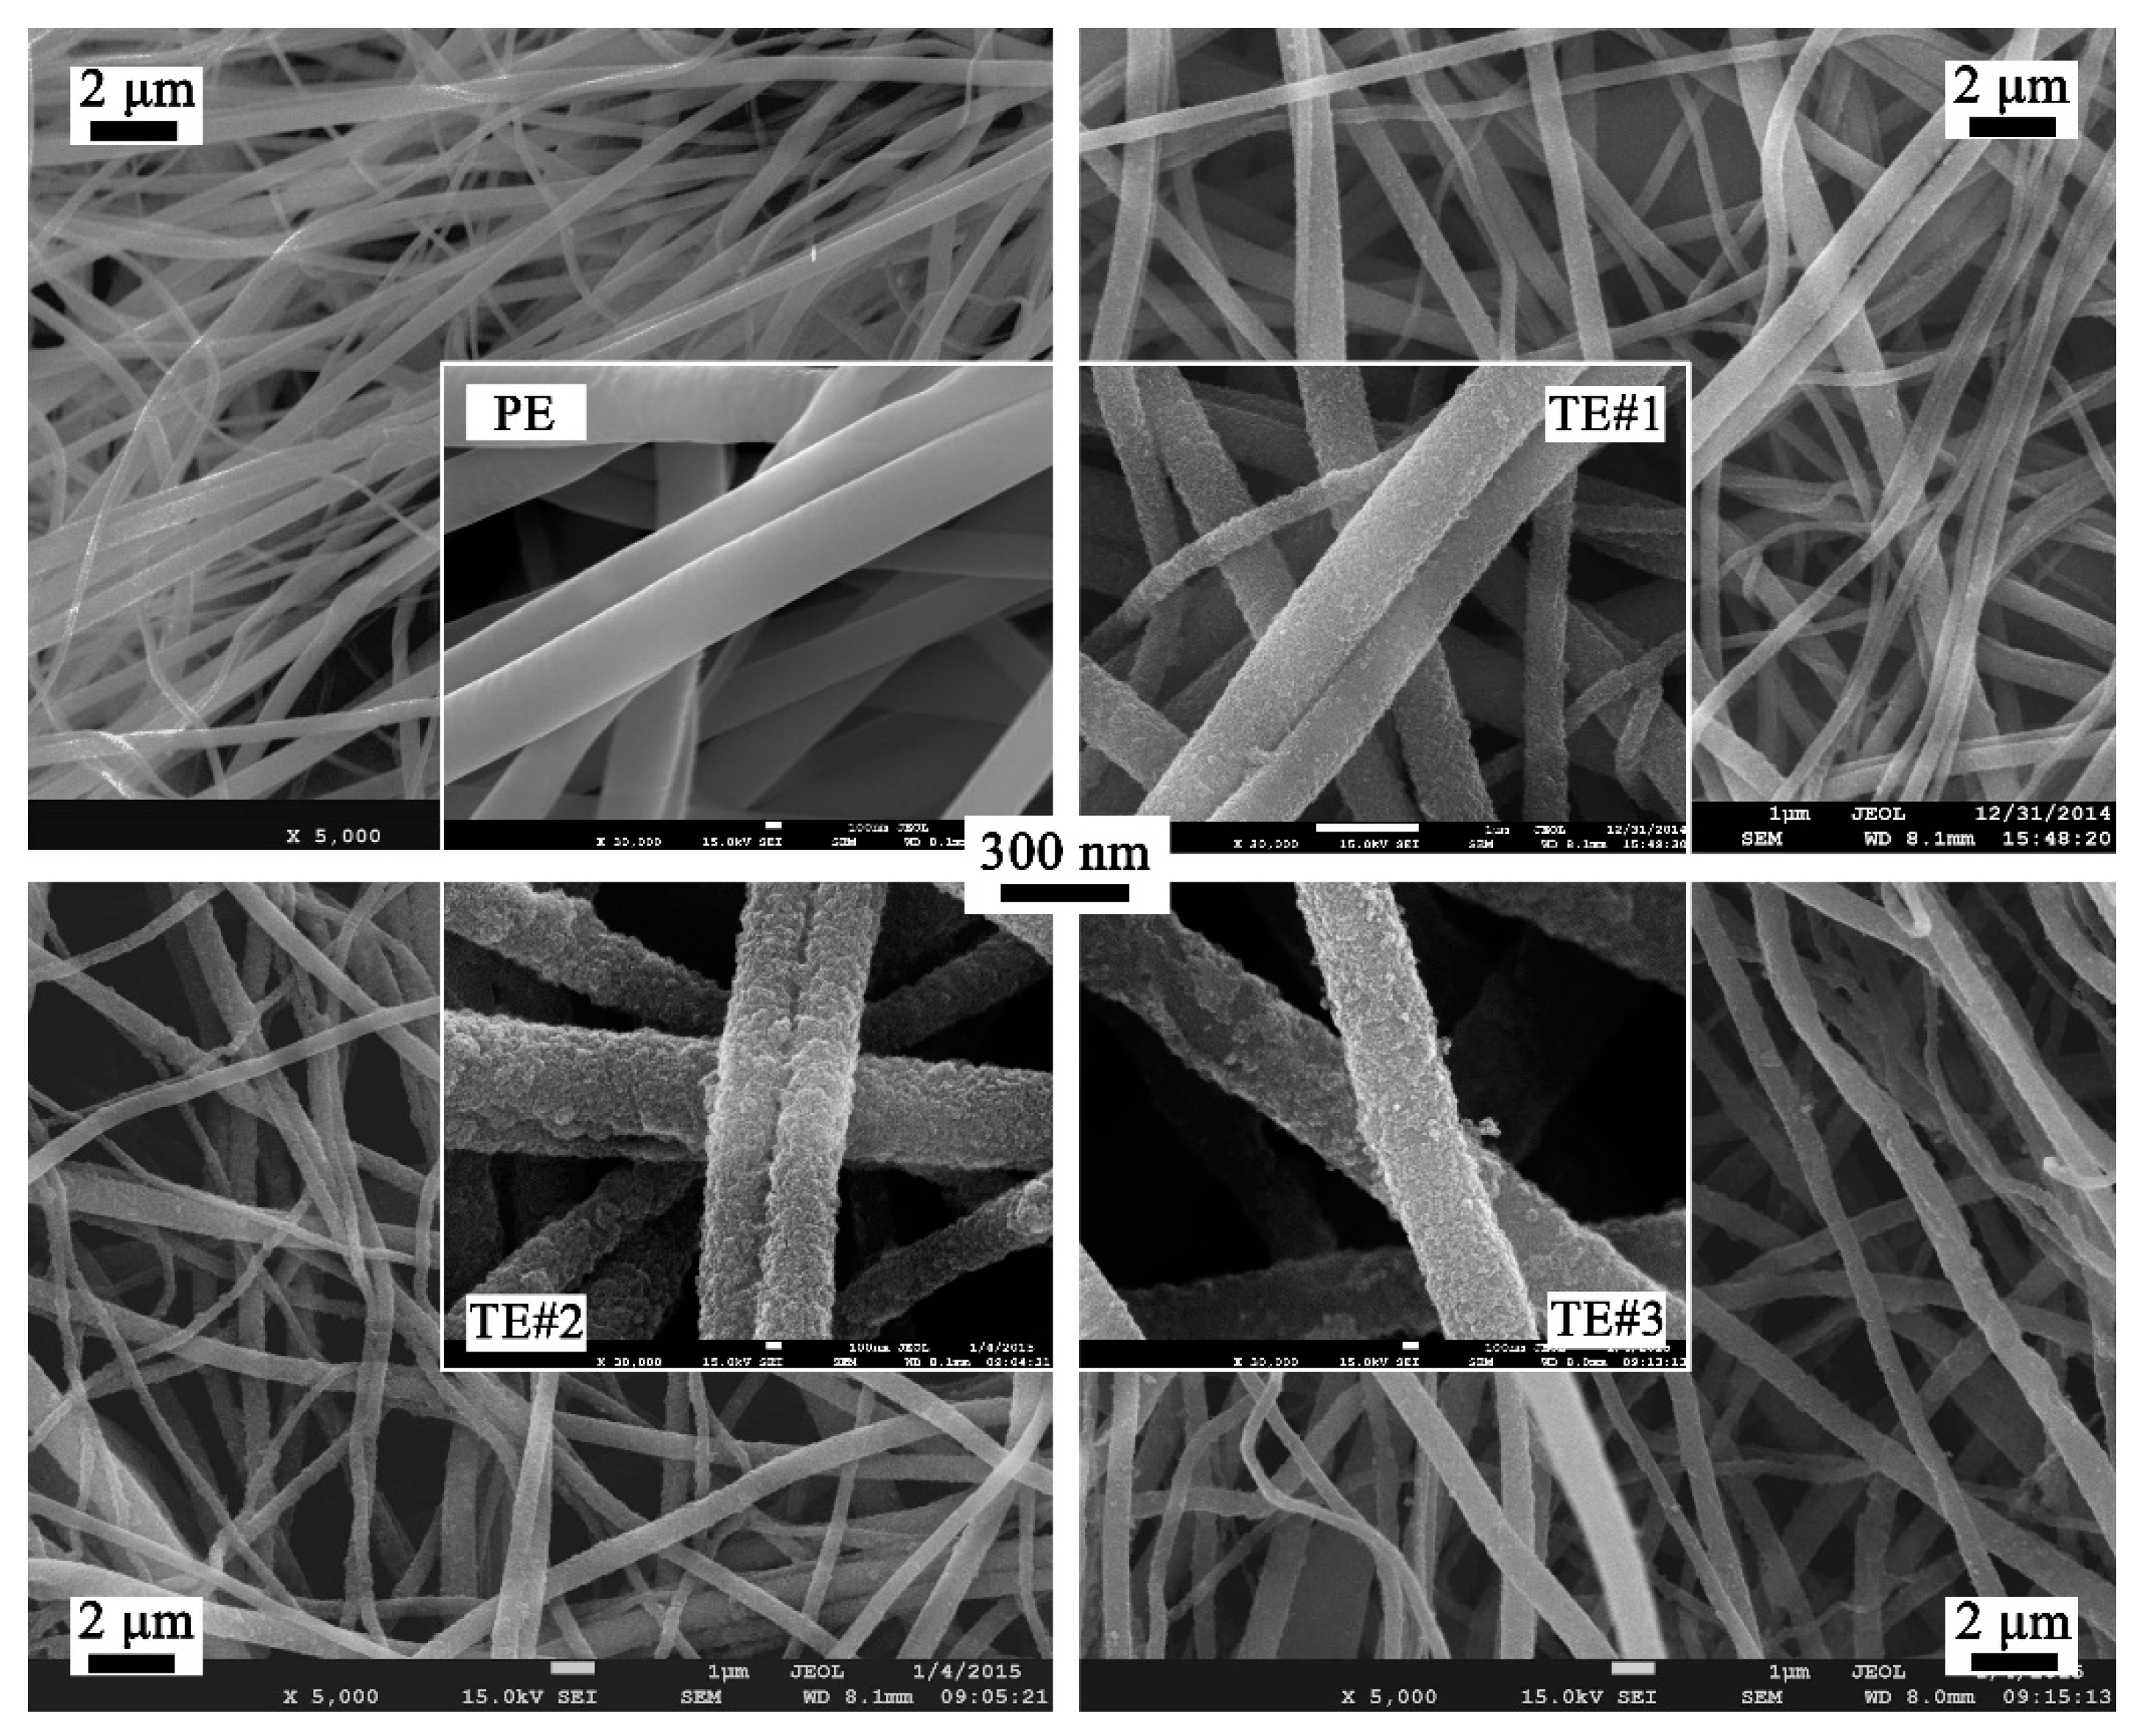
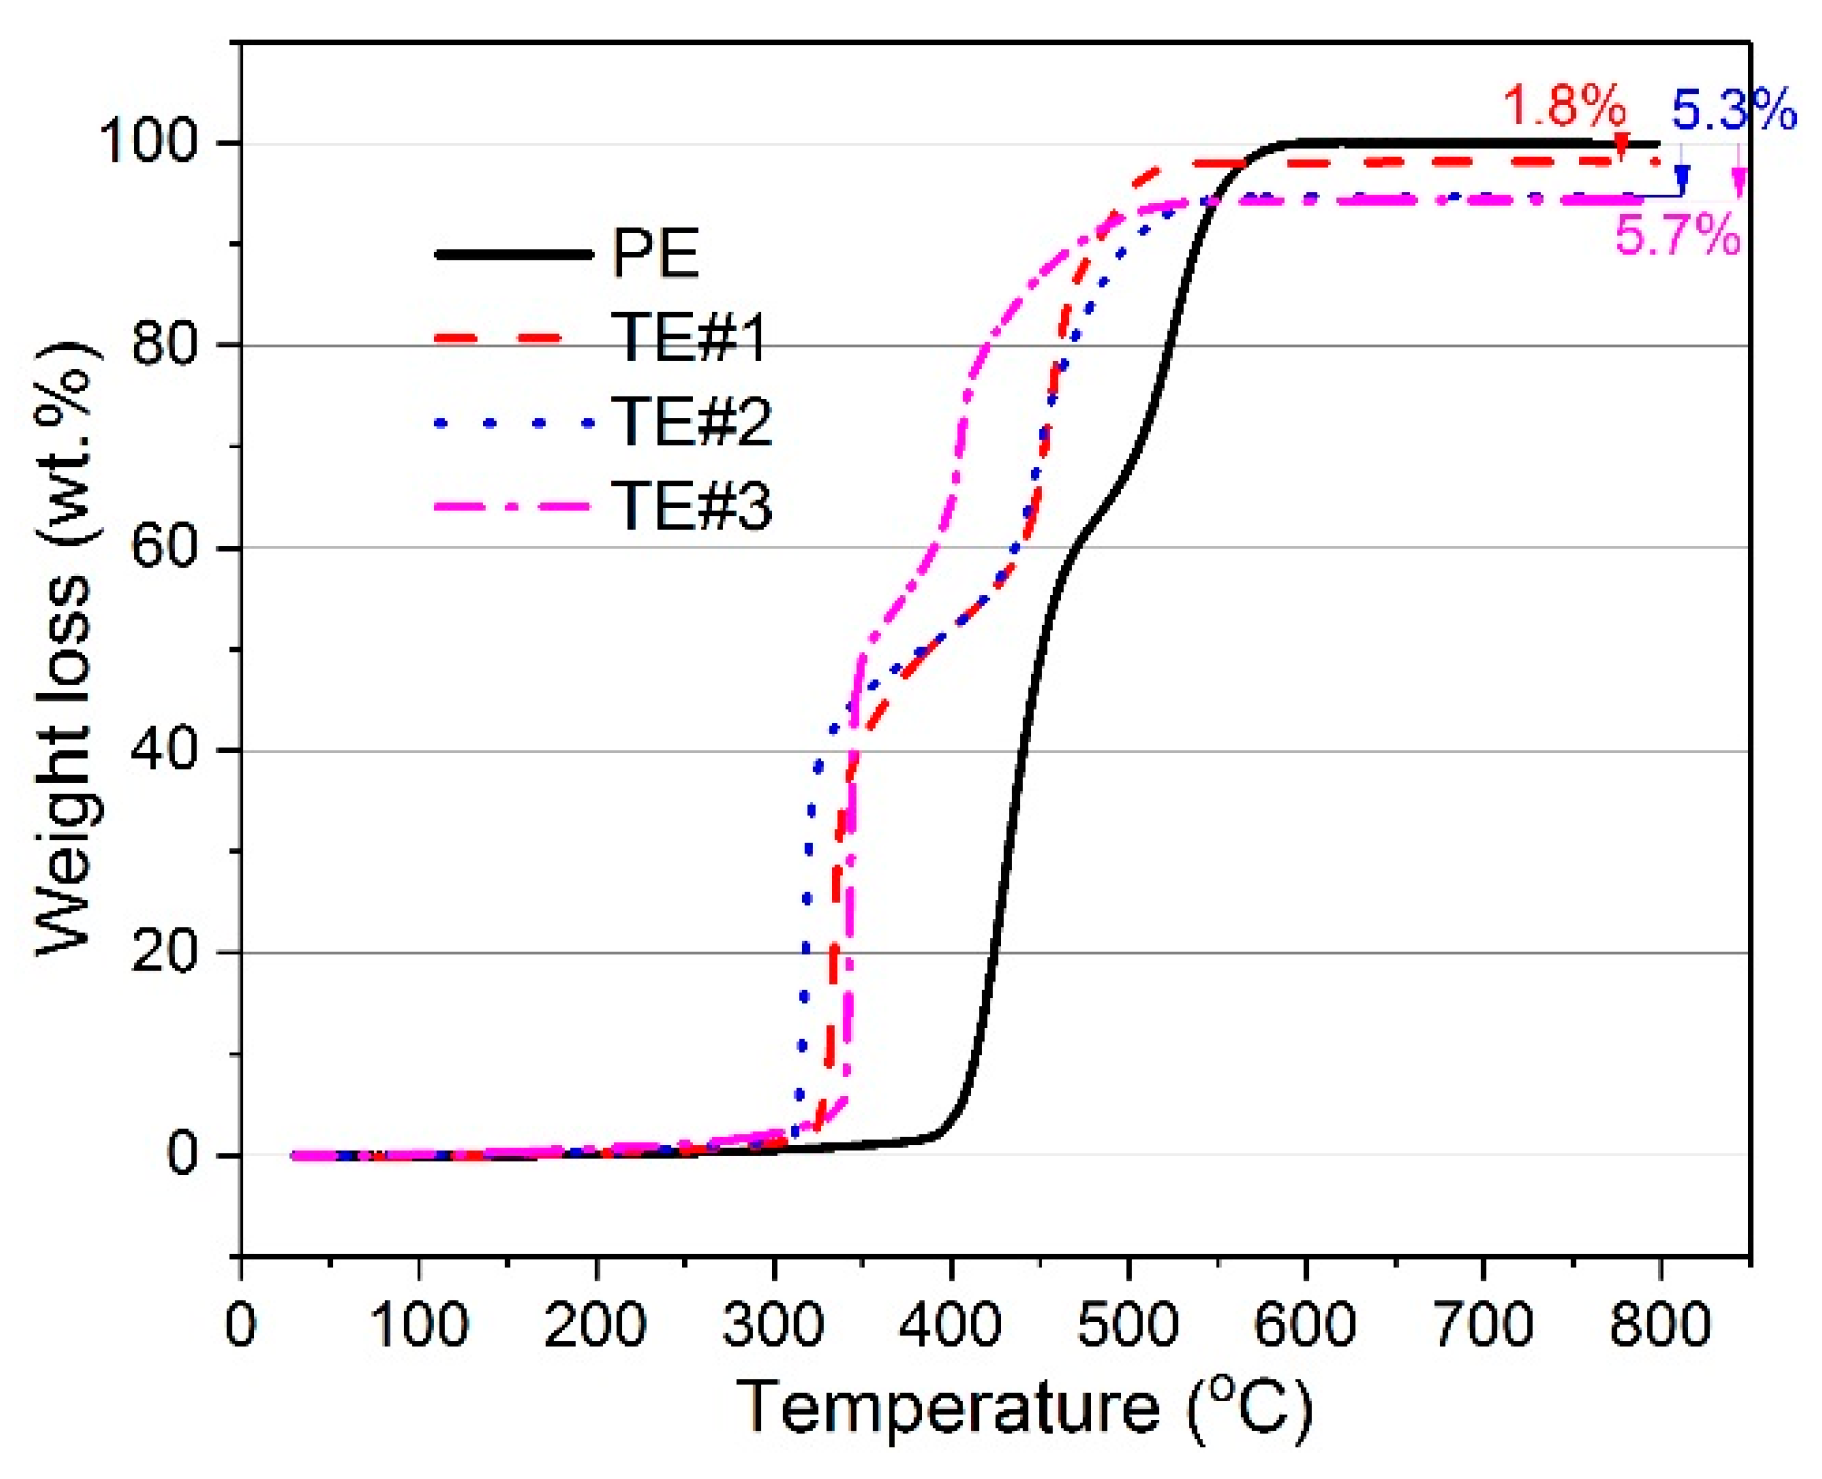
3.1. Surface Properties of TiO2-Coated Electrospun PVDF Fibers

Figure 2 shows the SEM images of PE and TE#1–TE#3 at magnifications of ×5000 and ×30,000. It is notable that the PE exhibited a smooth surface morphology while the surface morphologies of TE#1–TE#3 were rough. This indicates that a TiO2 nanolayer was successfully coated onto the surface of the electrospun PVDF fibers. According to the SEM images, an increasingly roughened surface could also be observed with an increase in the self-assembly cycles. For instance, TE#2 obtained from four self-assembly cycles showed obvious higher surface roughness than the TE#1 obtained from two self-assembly cycles. Moreover, the fibers of all samples were randomly orientated and mostly straight, and presented a long-cylinder shape with nanoscale diameters in the range of ~200–1000 nm.
Based on the SEM images, the diameter distribution could be fitted by using the Gaussian distribution as follows
f ( x ) = 1 2 π σ d exp [ ( x d f ) 2 2 σ d 2 ]
where f ( x ) represents the probability density function; x represents the normal variable; σ d represents the standard deviation of the diameter distribution from the Gaussian distribution, which indicates the uniformity of the diameter distribution of TiO2-coated electrospun fibers; and d f represents the fiber diameter.
The average diameters of PE and TE#1–TE#3 were predicted as 520, 554, 580, and 582 nm, respectively, as shown in Figure 3. With an increase in the self-assembly cycles, the average diameter increased given that more nano TiO2 nanoparticles were coated onto the fiber surface while the increase rate gradually declined.
The standard deviations of the diameter distributions of PE and TE#1–TE#3 were 96, 56, 51, and 58 nm, respectively, as shown in Figure 3. It should be noted that PE had much higher standard deviations of fiber diameter than the other samples because the fiber diameter and its standard deviation are affected by the TiO2 assembling process. With the increase in fiber diameter, the specific surface area of the fibers decreases, which would make it difficult to deposit the nano TiO2 onto the fiber surface. Similarly, Kumar et al. [19] also found that the lower fiber diameter resulted in the higher surface area of the TiO2 nanoparticle layer. Therefore, after the TiO2 self-assembly process, the diameters of TiO2-coated electrospun fibers would get close to the average fiber diameter, which indicates a smaller standard deviation than that of the uncoated fibers (i.e., PE).
The characteristic parameters of the coated TiO2 nanolayer include the thickness ( T h , nm), the assembly content ( L c , %), and the porosity ( φ , %). Based on the fiber diameter of the uncoated fibers, the thickness of the coating layer can be determined by
T h = d f ( n L ) d f ( 0 ) 2
where d f ( n L ) represents the fiber diameter at a self-assembly cycle of n L , then d f ( 0 ) indicates the fiber diameter of the uncoated electrospun fibers.
The thicknesses of the TiO2 nanolayers of TE#1–TE#3 were 17, 30, and 31 nm, respectively, as shown in Figure 4a. It is reasonable that with an increase in the assembly cycles, the thickness of the coating layer increases, as more TiO2 nanoparticles can be coated on the fiber surface. Similar to the increase rate of fiber diameter, first, the thicknesses increase rapidly, then slowly with an increase in the self-assembly cycles.
According to the TGA results, the weight losses of PE and TE#1–TE#3 for various temperature are shown in Figure 5. The assembled TiO2 content of TE#1–TE#3 were measured as 1.8, 5.3 and 5.7 wt. %, respectively, as shown in Figure 4b. It was obvious that with the increase in self-assembled layers of nano TiO2, the assembled content increased. However, the increase of the assembled TiO2 content seemed to be insignificant at only 0.4 wt. % as the self-assembly cycles increased from 4 to 6. This was much smaller than 3.5 wt. % as the self-assembly cycles increased from 2 to 4.
The porosity of the porous TiO2 nanolayer can be calculated by
φ = 1 v t v d
where v t is the volume ratio of TiO2-coated electrospun PVDF fibers to pure electrospun PVDF fiber and v d is the volume ratio of the TiO2 nanolayer to the TiO2-coated electrospun fibers. v d and v t can be calculated, respectively, as follows
v d = d x 2 d i 2 d x 2
ν t = ( m T / m P ) ( ρ P / ρ T ) 1 / ( 1 ν d )
where d x ( x   = 2, 4 and 6) is the diameter of the TiO2-coated electrospun PVDF fibers; d i is the initial diameter of the pure electrospun PVDF fibers; m T / m P is the ratio of TiO2 mass to pure fiber mass; and ρ P / ρ T is the ratio of TiO2 density to pure fiber density. The density of the TiO2 and PVDF fibers were 2.5 and 1.78 g·cm−3, respectively.
The porosity of the TiO2 nanolayer for TE#1–TE#3 was predicted as 90.3%, 84.0%, and 83.3%, respectively, as shown in Figure 4c. It indicates that the TiO2 nanolayer coated on the fiber surface had a porous nanostructure. The porosity decreased with an increase in the self-assembly cycles as further assembly on the coated fibers exerts an influence on its previous coating, as shown in Figure 6. This indicates not only an increase in the thickness perpendicular to the fiber axes, but also an increase in the space density and thereby a decrease in the porosity. This can also be seen from Equations (3)–(5) where v d decreases with an increase in d x while ν t increases with an increase in m T . Apparently, the overall φ decreases with the increase of controllable self-assembly cycles.

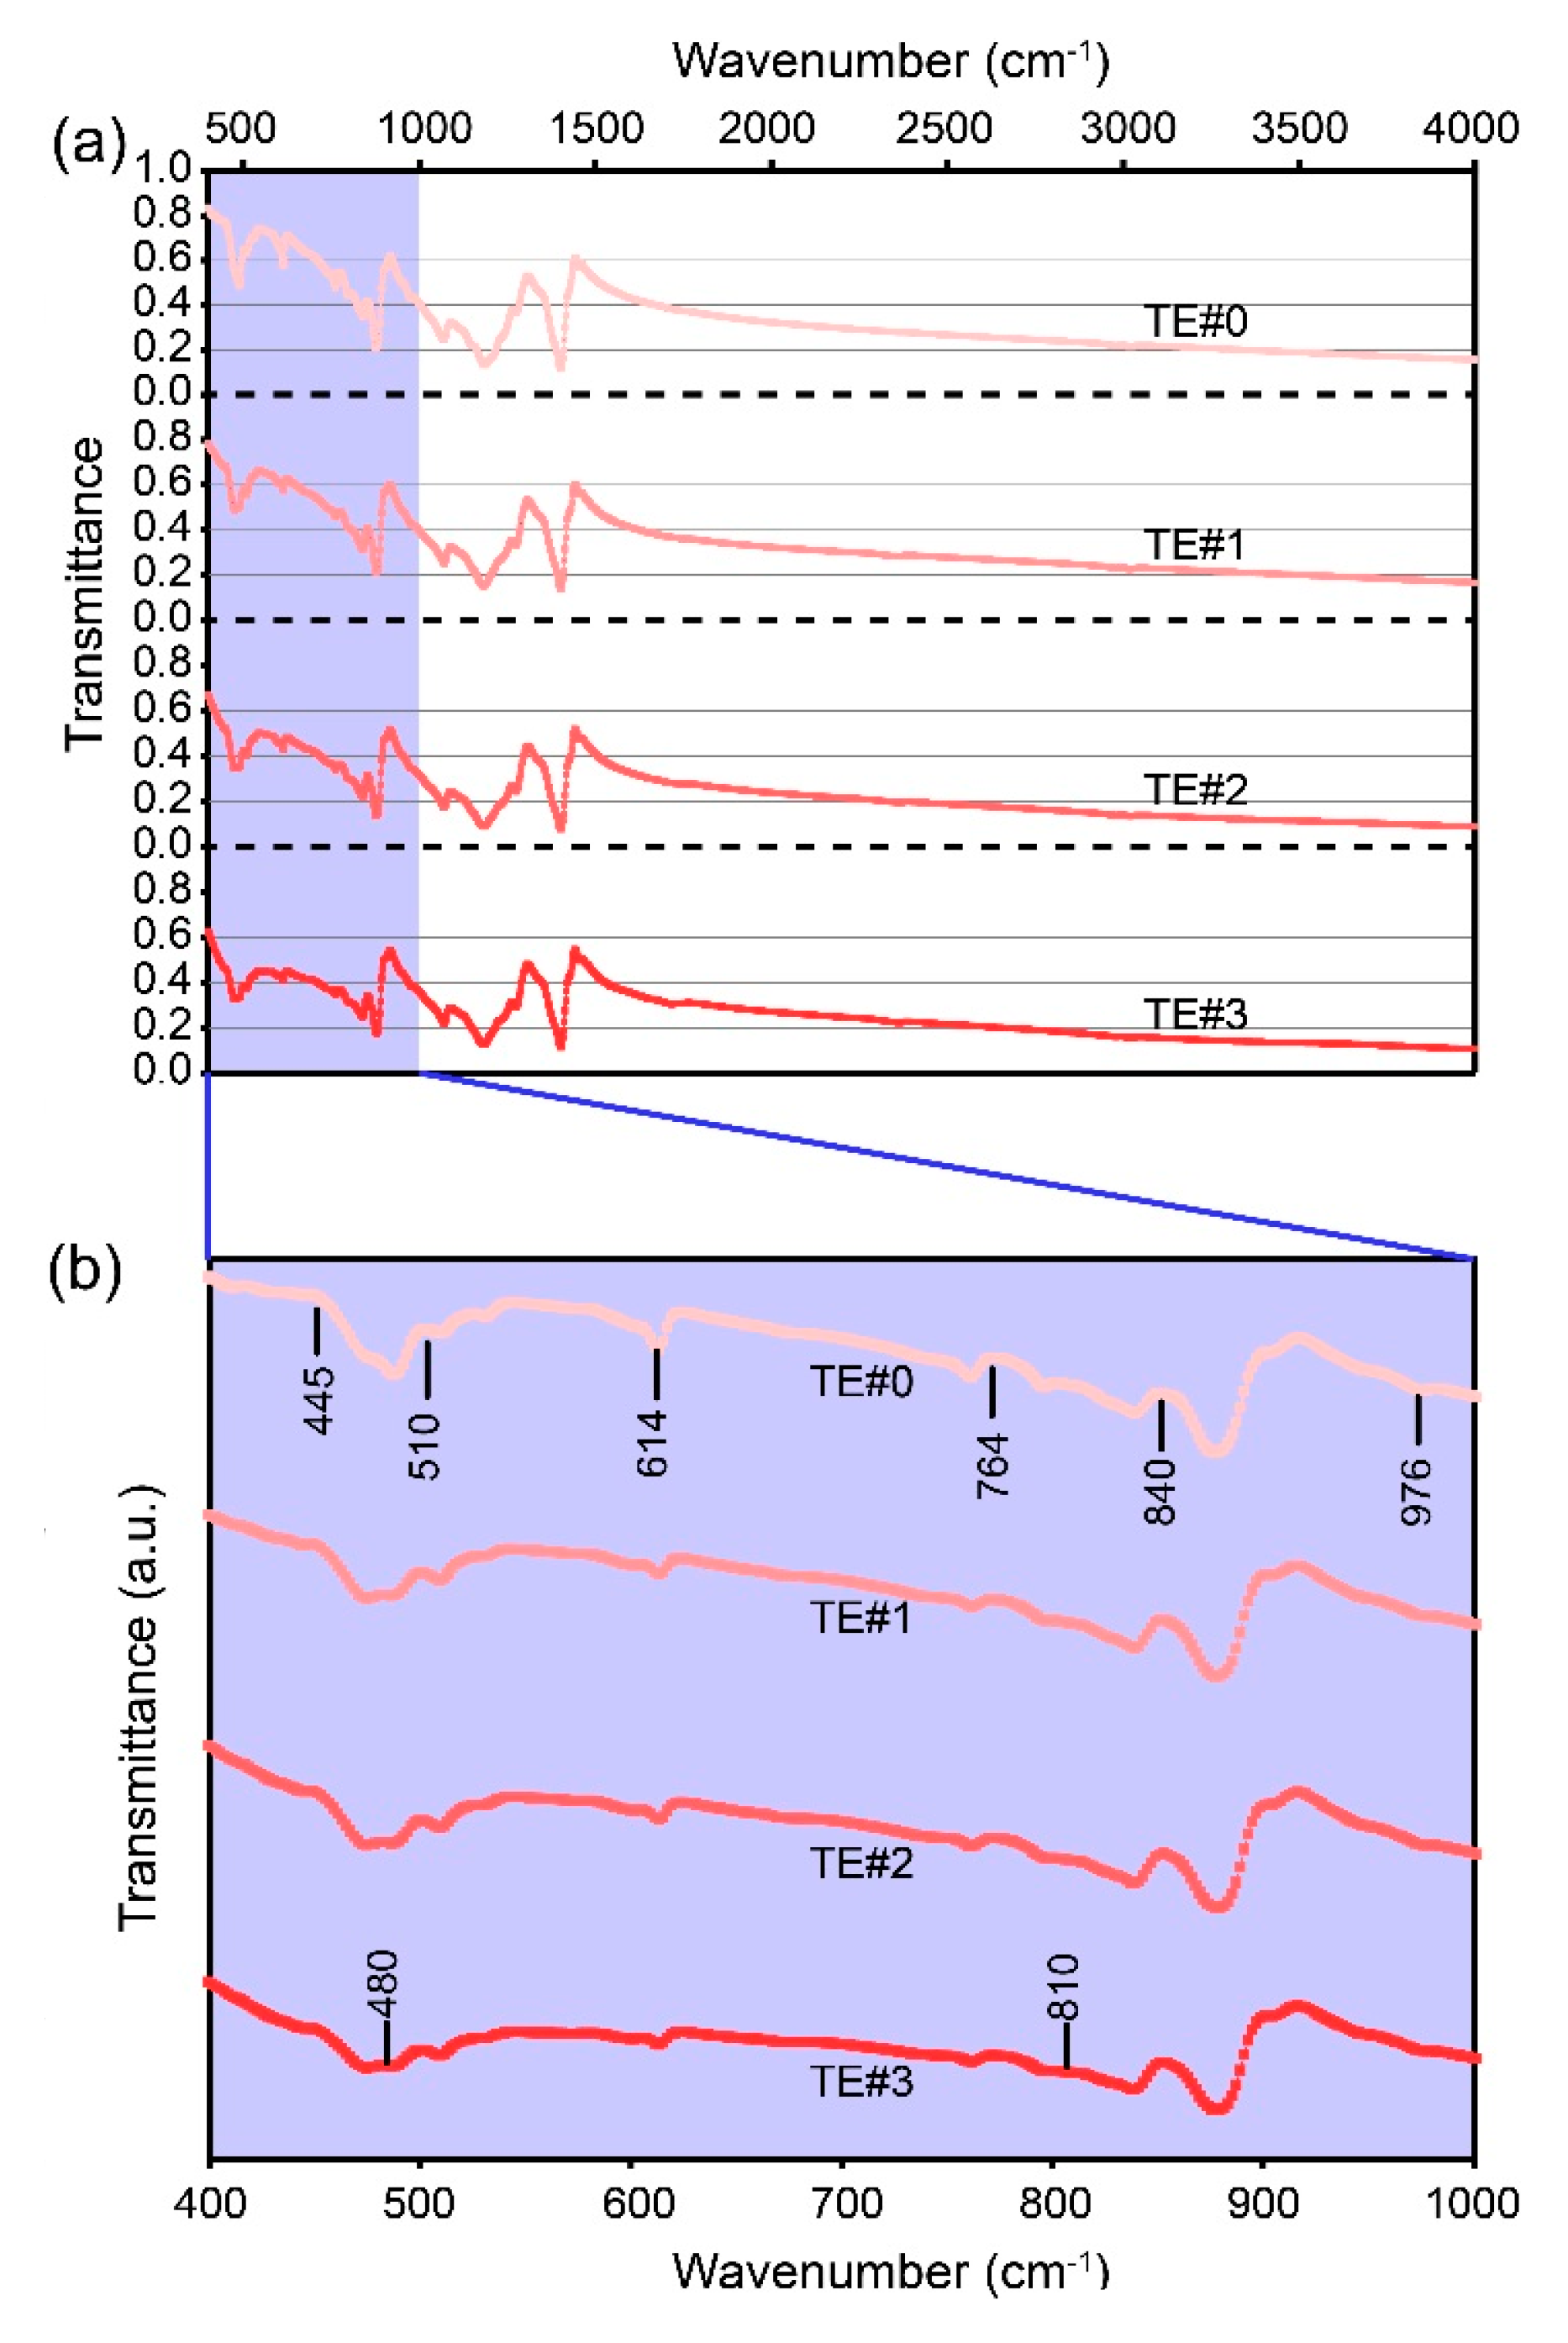
3.2. Optical Scattering and Absorption Property of TiO2-Coated Electrospun Fibers

Figure 7a shows the spectral transmittances of PE and TE#1–TE#3 for various wavenumbers ranging from 400 to 4000 cm−1. It can be seen that the transmittances decreased with an increase in the self-assembly cycles because nano TiO2 has strong absorption and scattering capacities towards infrared light [19]. According to optical theories, the sum of the transmittance, absorption, and scattering ratio is 1. This indicates that the electrospun PVDF fibers possessed a higher absorption ratio and/or refractive ratio after the TiO2 self-assembly process since they presented lower transmittances.
The transmittances of PE and TE#1–TE#3 presented significant fluctuation in the wavenumber range of 400–1000 cm−1, as shown in Figure 7b. Compared with the uncoated electrospun fibers, the TiO2-coated ones presented a slight wave crest. The occurrence of bands at 445, 510, 614, 764, 840, and 976 cm−1 indicated the presence of a mixed α and β PVDF crystalline phase in the electrospun fibers. The occurrence of bands at 480 and 810 cm−1 can be attributed to the nano TiO2.
Based on the measured transmittances ( τ λ ), two equations for predicting the spectral absorption index ( κ λ ) and spectral refractive index ( n λ ) can be expressed by [36,37]
λ π d f R e [ ( a 0 + b 0 ) + 2 n = 1 ( a n + b n ) ] = π d f I n ( τ λ ) 4 L m υ f
n ( λ ) = n i ( λ i ) + 2 ( λ i 2 λ 2 ) π P 0 λ 0 κ ( λ 0 ) ( λ 2 λ 0 2 ) ( λ i 2 λ 0 2 ) d λ 0
where R e represents the real part of a plural; λ represents the wavelength and equals the reciprocal of wavenumber ( σ w , cm−1); a n and b n represent the Lorenz-Mie coefficients [38] that are determined by κ λ and n λ ; L m represents the thickness of the fibrous membrane; λ i represents the reference wavelength (e.g., 0.5 μm). Based on our previous investigation on κ λ and n λ of ultrafine fibers [35], the solution can be ensured to be unique as TiO2-coated electrospun fibers have average diameters of several hundred nanometers.
Table 1 gives the κ λ and n λ of PE and TE#1–TE#3 for wavenumbers ranging from 400 to 4000 cm−1, with a precision of ±0.05. As the self-assembly time increased, the κ λ increased rapidly in the wavenumber range of 400–1200 cm−1 while increased slowly in the wavenumber range of 1600–4000 cm−1 with small change ranges of 0.3–0.55. It should be noted that TE#2 and TE#3 presented nearly comparable values in the wavenumber range between 2000 and 2800 cm−1. This indicates a maximum index for κ λ at these wavenumbers. Therefore, it is an effective strategy to increase the optical κ λ of the TiO2-coated electrospun fibers through controllable self-assembly time.
The change in n λ seems insignificant at wavenumbers of 800–4000 cm−1. For instance, there was only a 0.1 increase in n λ at 1200 cm−1 as the self-assembly cycles increased from zero to six. However, a remarkable difference in n λ could be seen at the wavenumber of 400 cm−1. The n λ value at 400 cm−1 increased from 2.30 for PE to 2.50, 2.75, and 2.85 for TE#1, TE#2, and TE#3, correspondingly. Therefore, at some wavenumbers, the optical n λ of TiO2-coated electrospun fibers can be effectively increased through controllable self-assembly time.
Concerning a coupling optical effect of absorption and scattering of fibrous materials, the extinction factor ( Q λ ) of the TiO2-coated electrospun fibers can be calculated as follows
Q λ = π d f I n ( τ λ ) 4 L m υ f
Table 2 gives the Q λ of PE and TE#1–TE#3 for wavenumbers ranging from 400 to 4000 cm−1, with a precision of ±0.005. It can be observed that at most wavenumbers, the Q λ increased with an increase in self-assembly cycles. This indicates an enhancement in the overall capacity of optical extinction after the TiO2 assembly process. However, at some wavenumbers, there was a maximum in Q λ for TE#2 obtained from four self-assembly cycles. For instance, the Q λ at 1200 cm−1 increased from 0.665 for PE to 0.850 for TE#2, while the corresponding value of TE#3 was 0.820. This was due to a similar decrease of refractive index, as the refractive index decreased from 1.70 of TE#2 to 1.65 of TE#3 at 1200 cm−1 (Table 1). Therefore, after controllable self-assembly, the optical Q λ of TiO2-coated electrospun PVDF fibers was effectively increased.

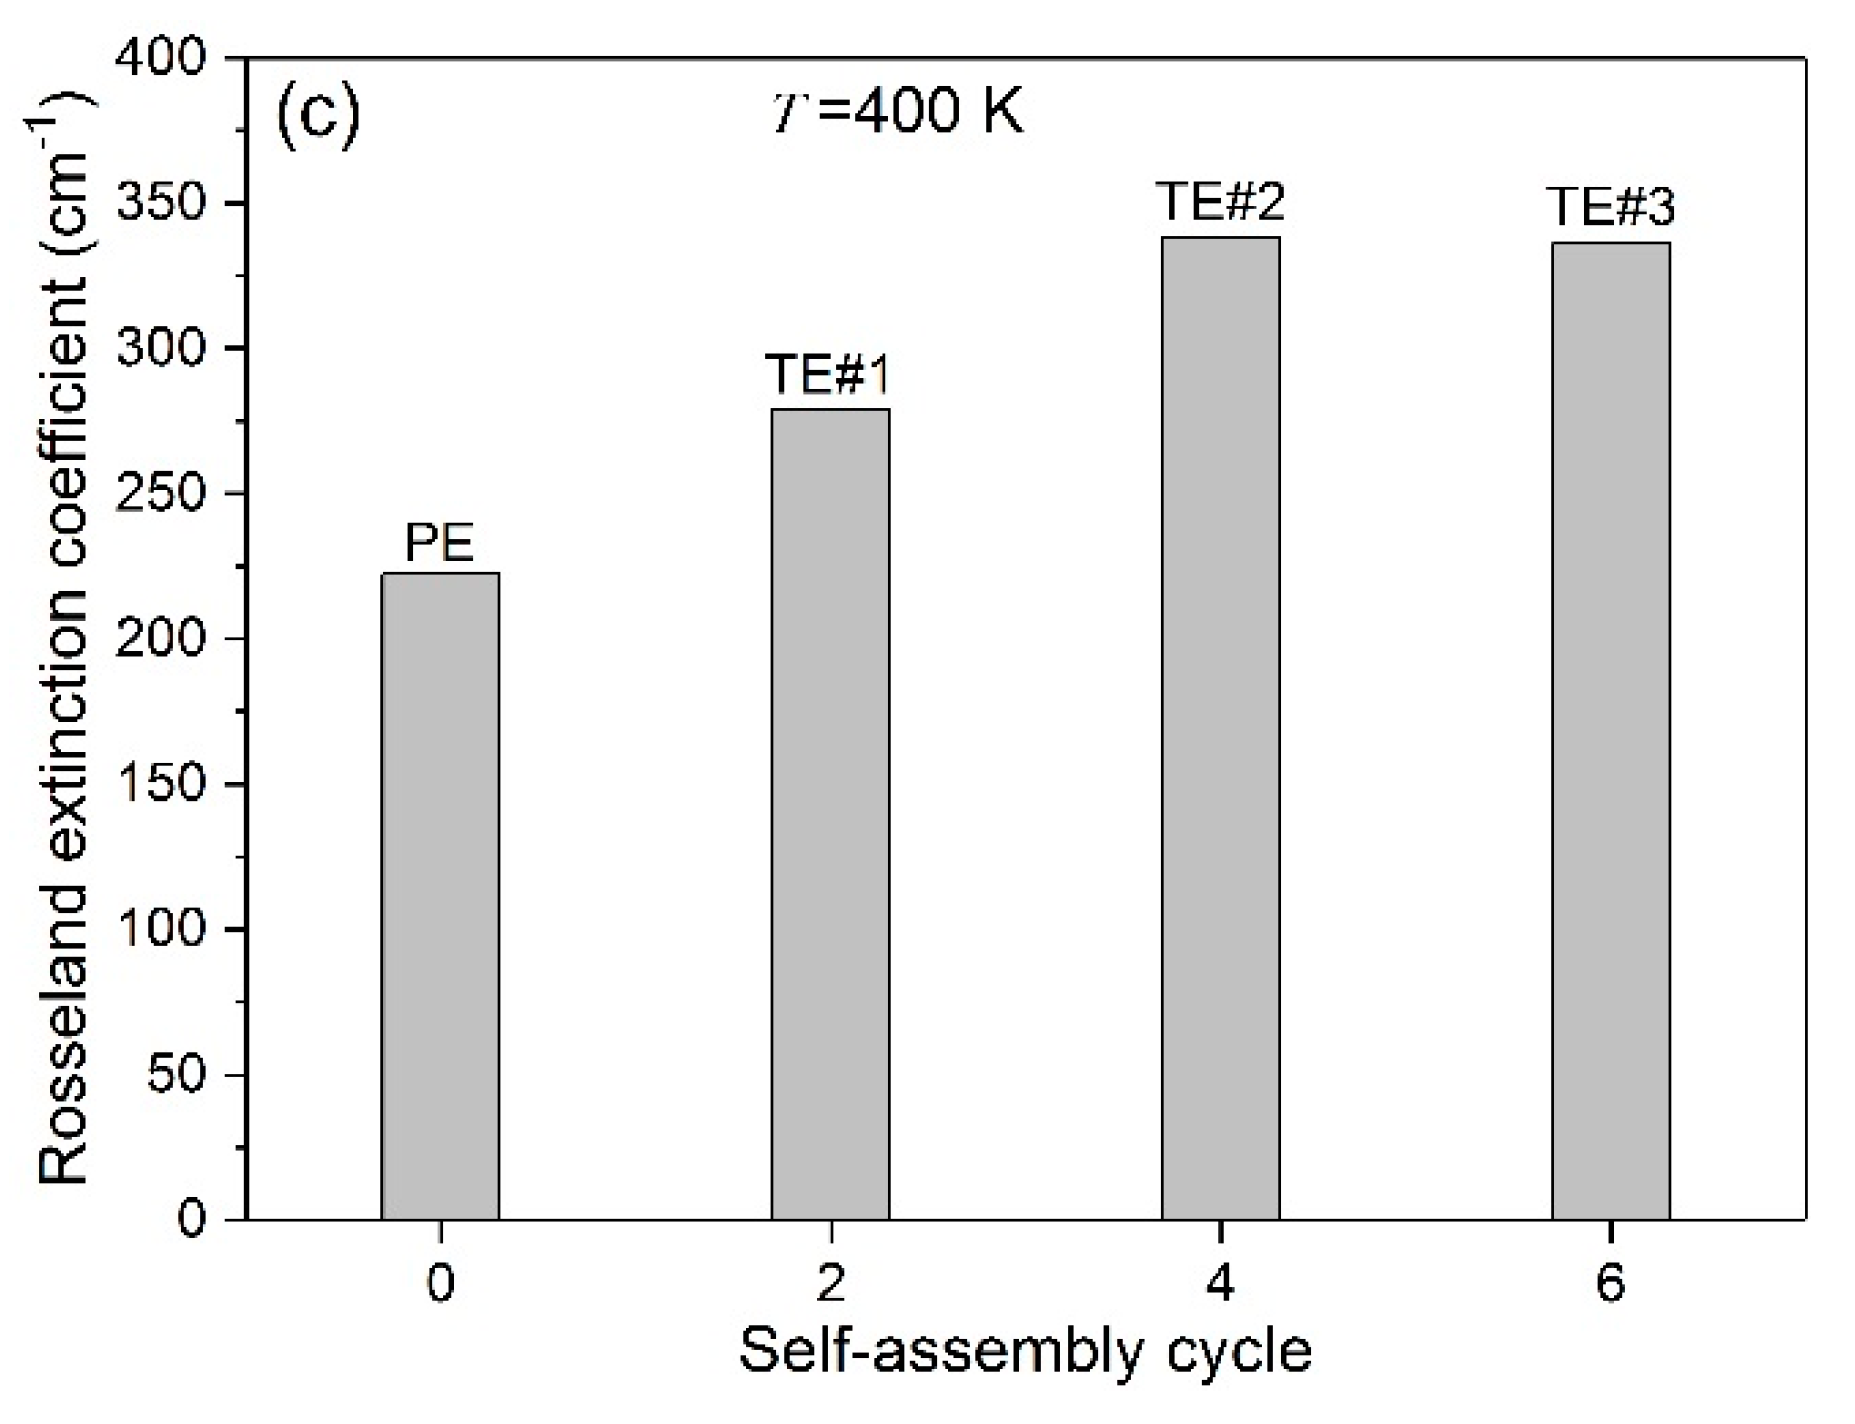
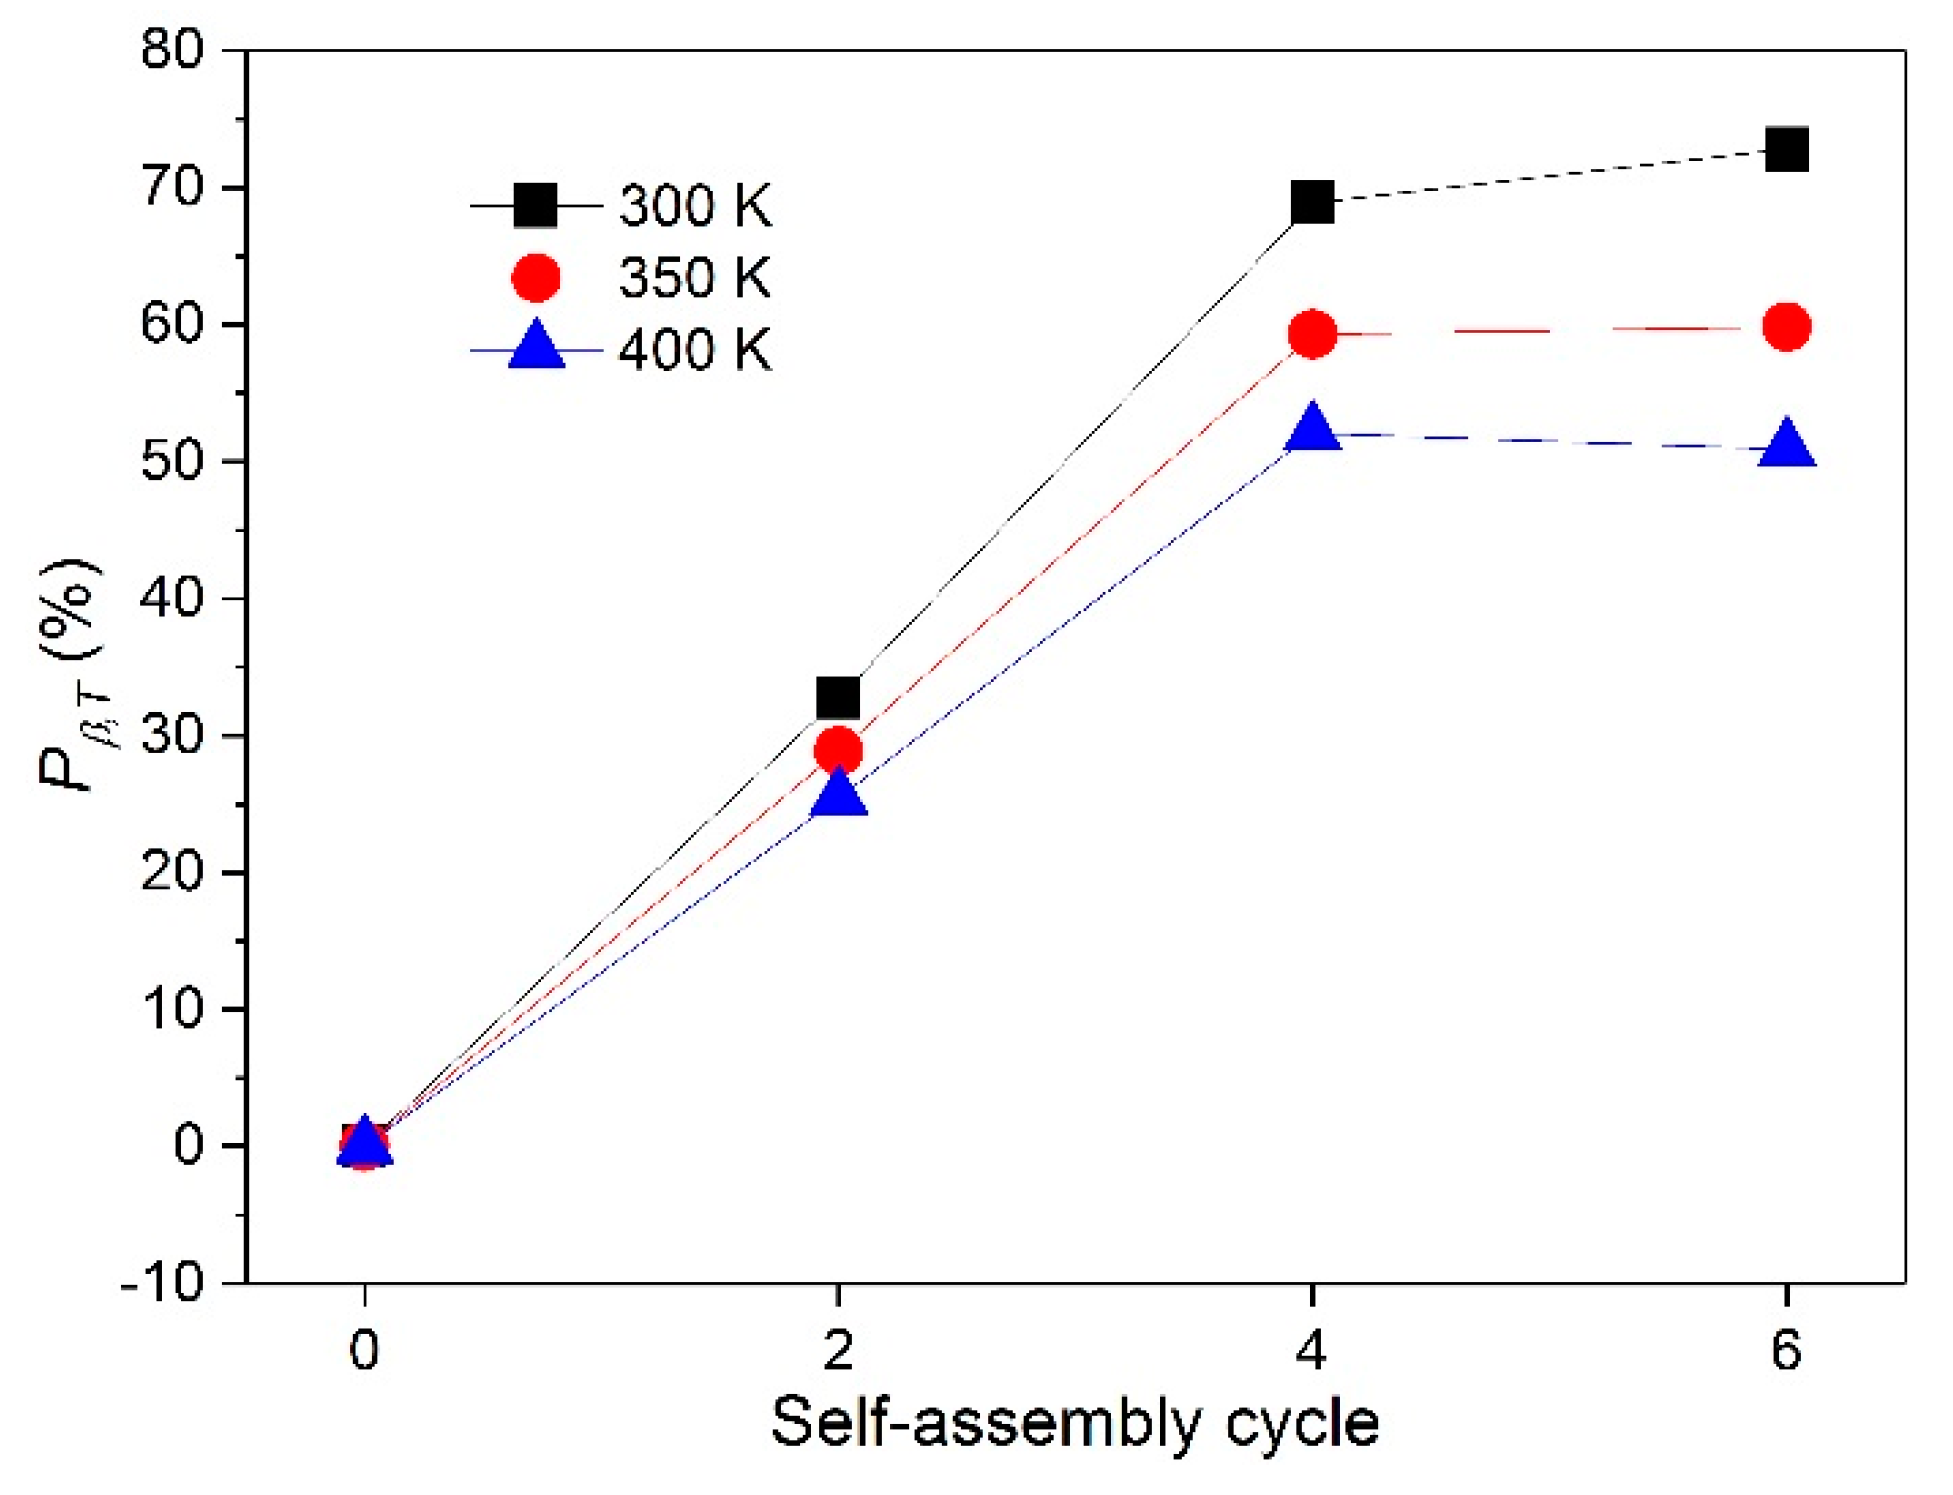
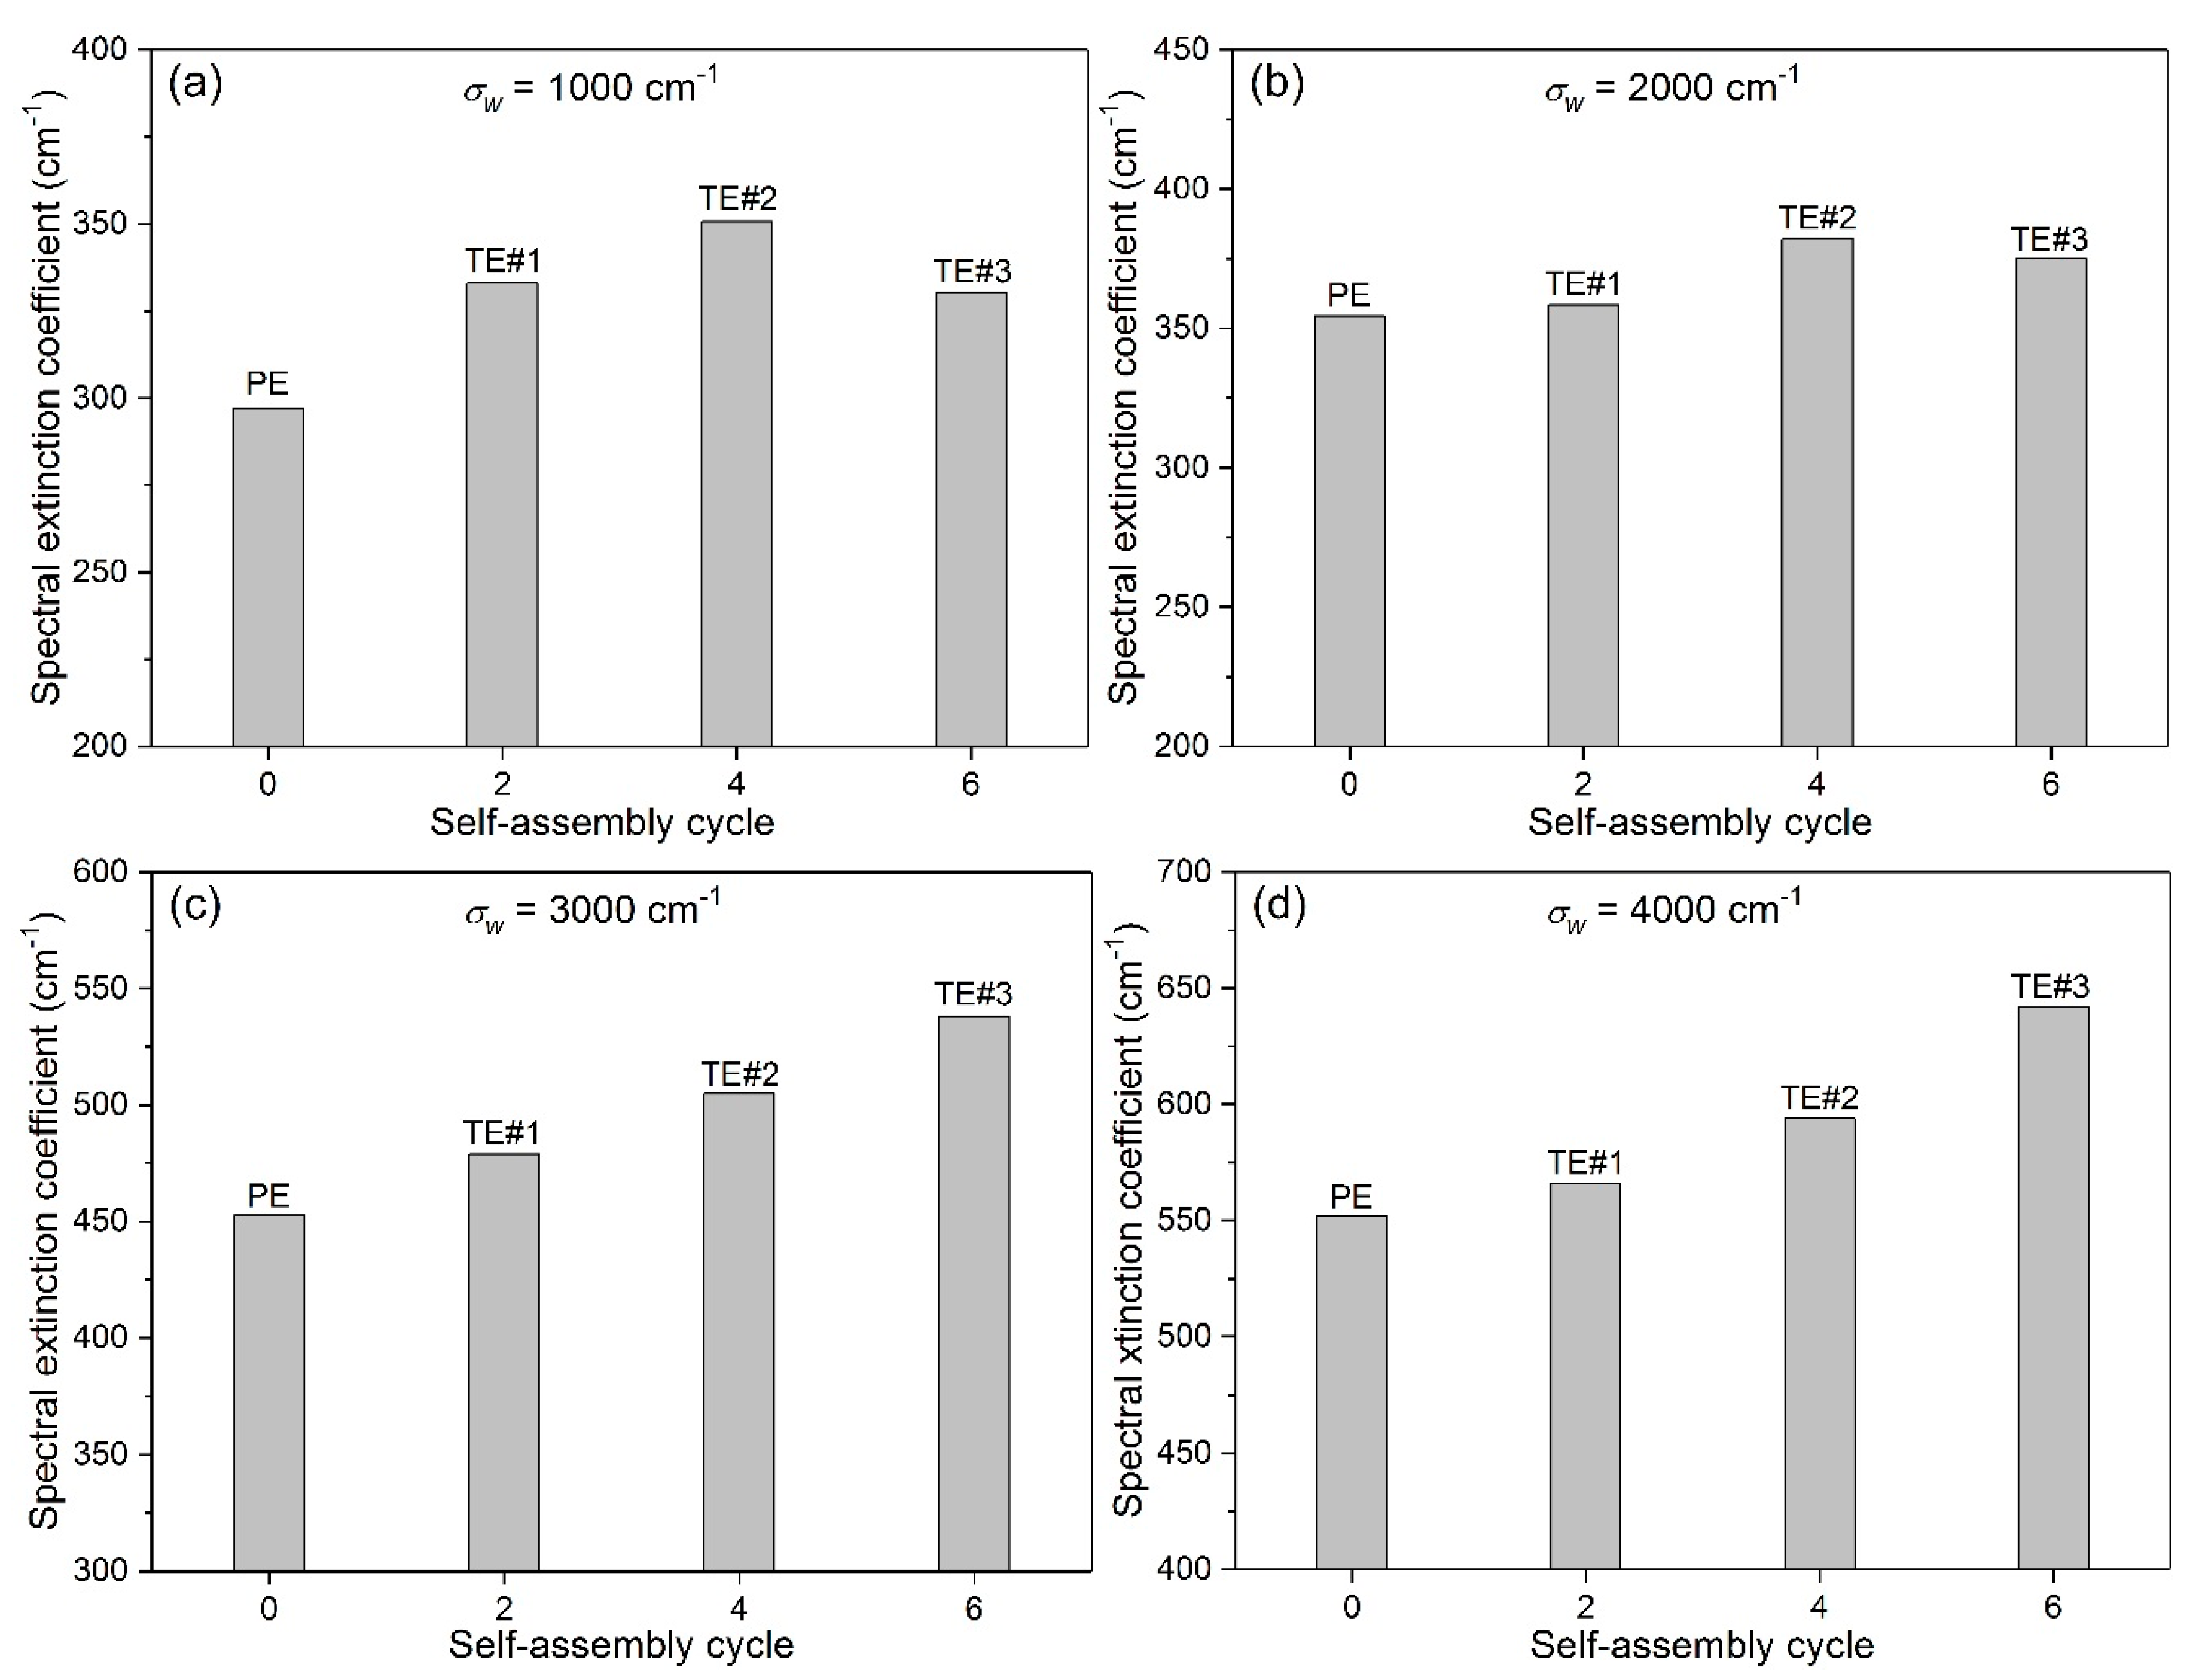
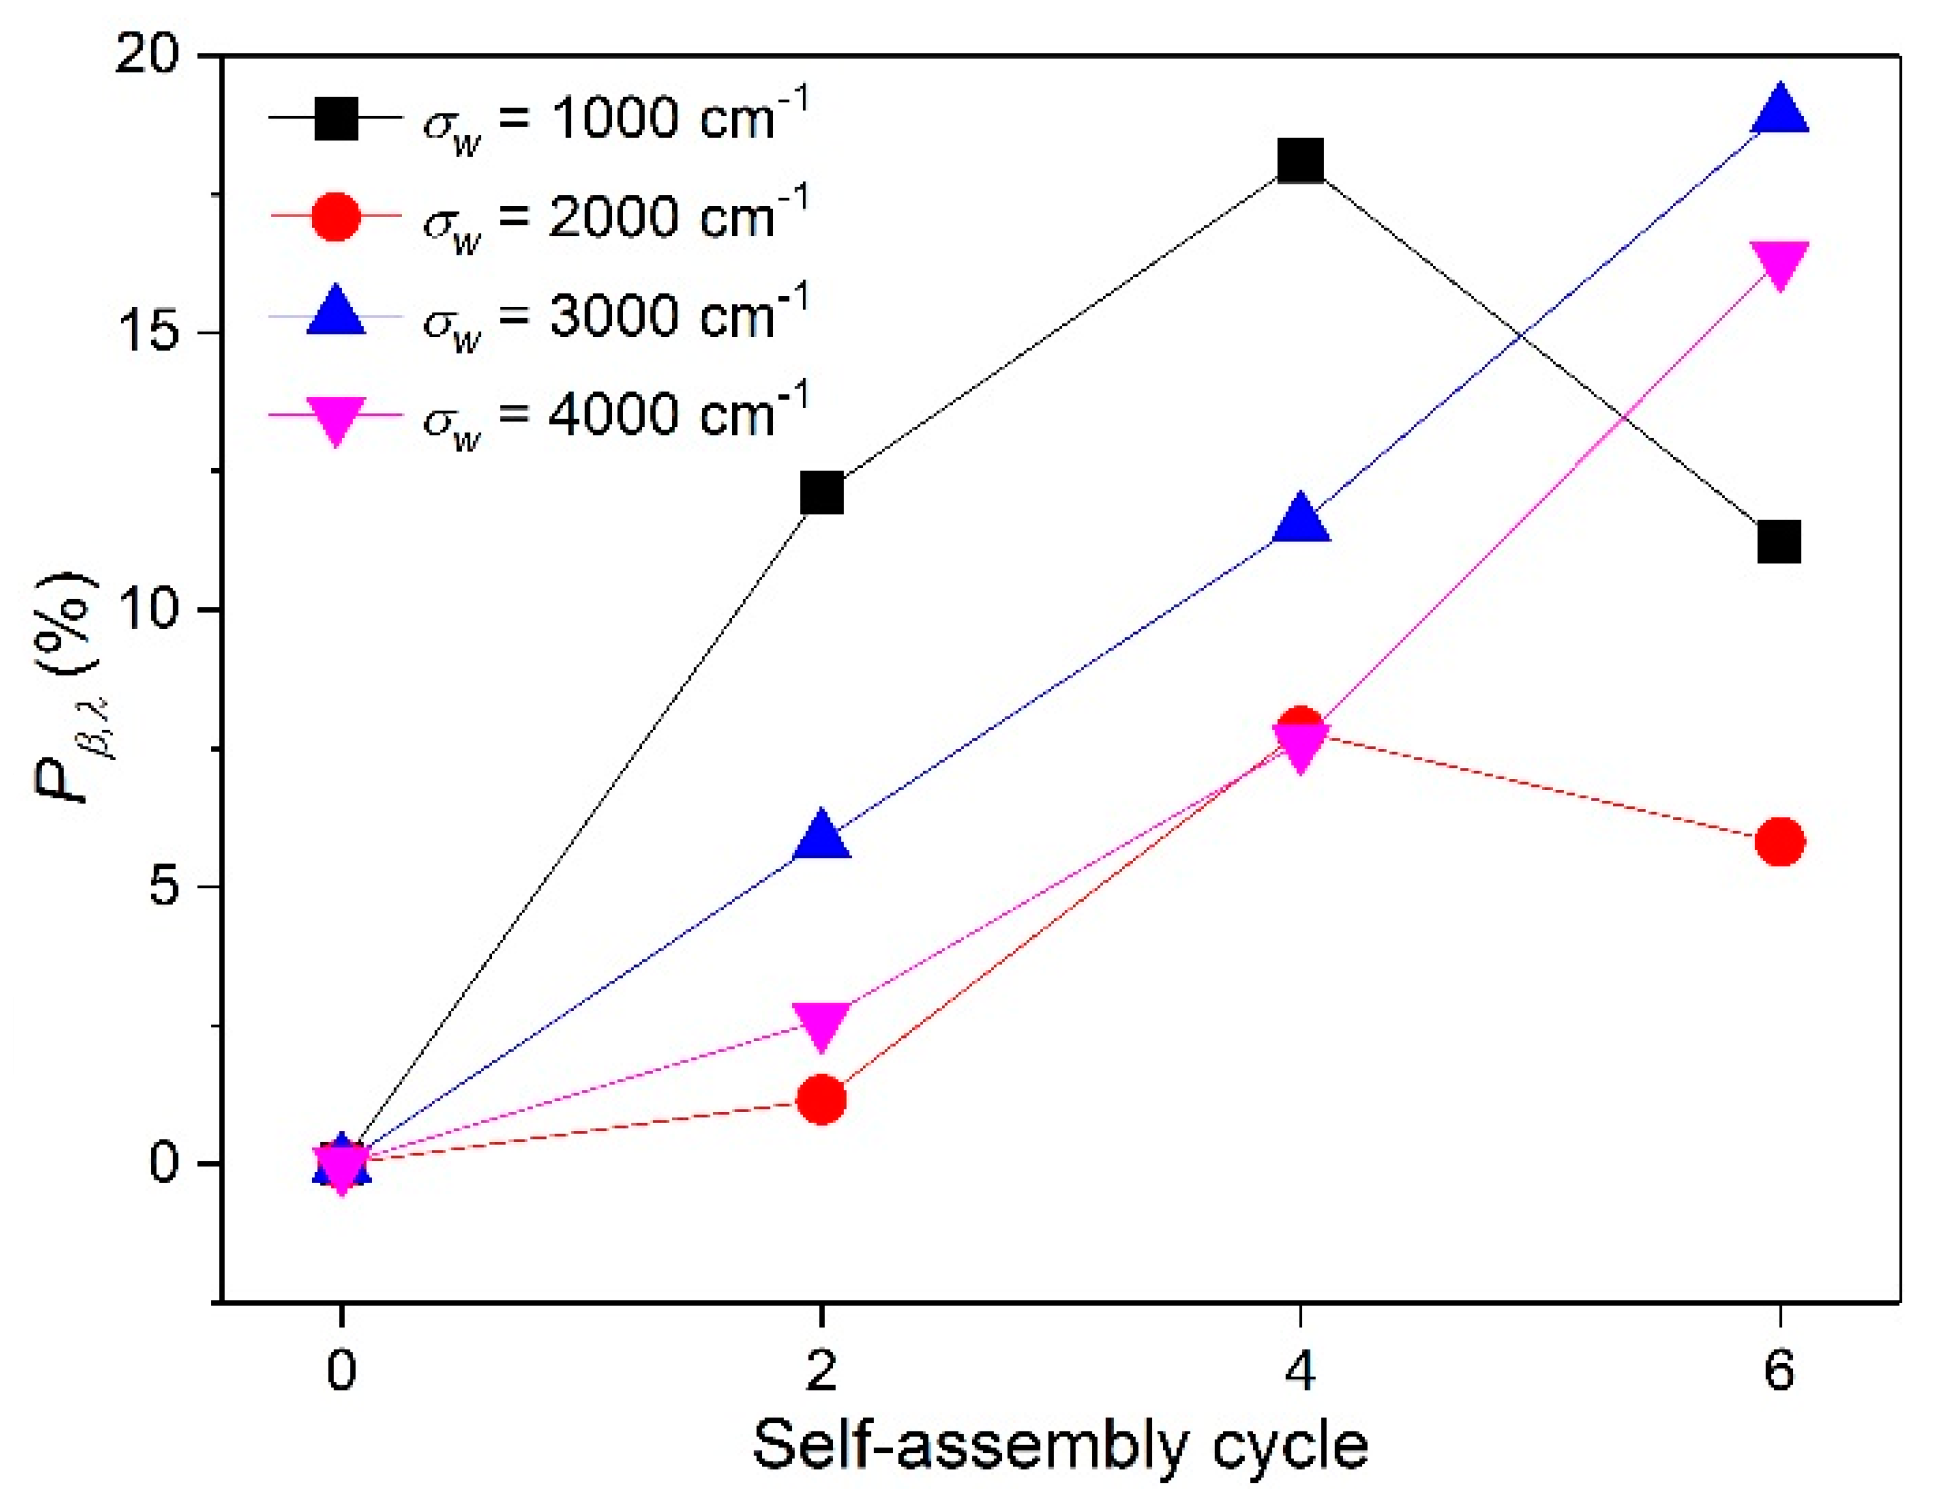
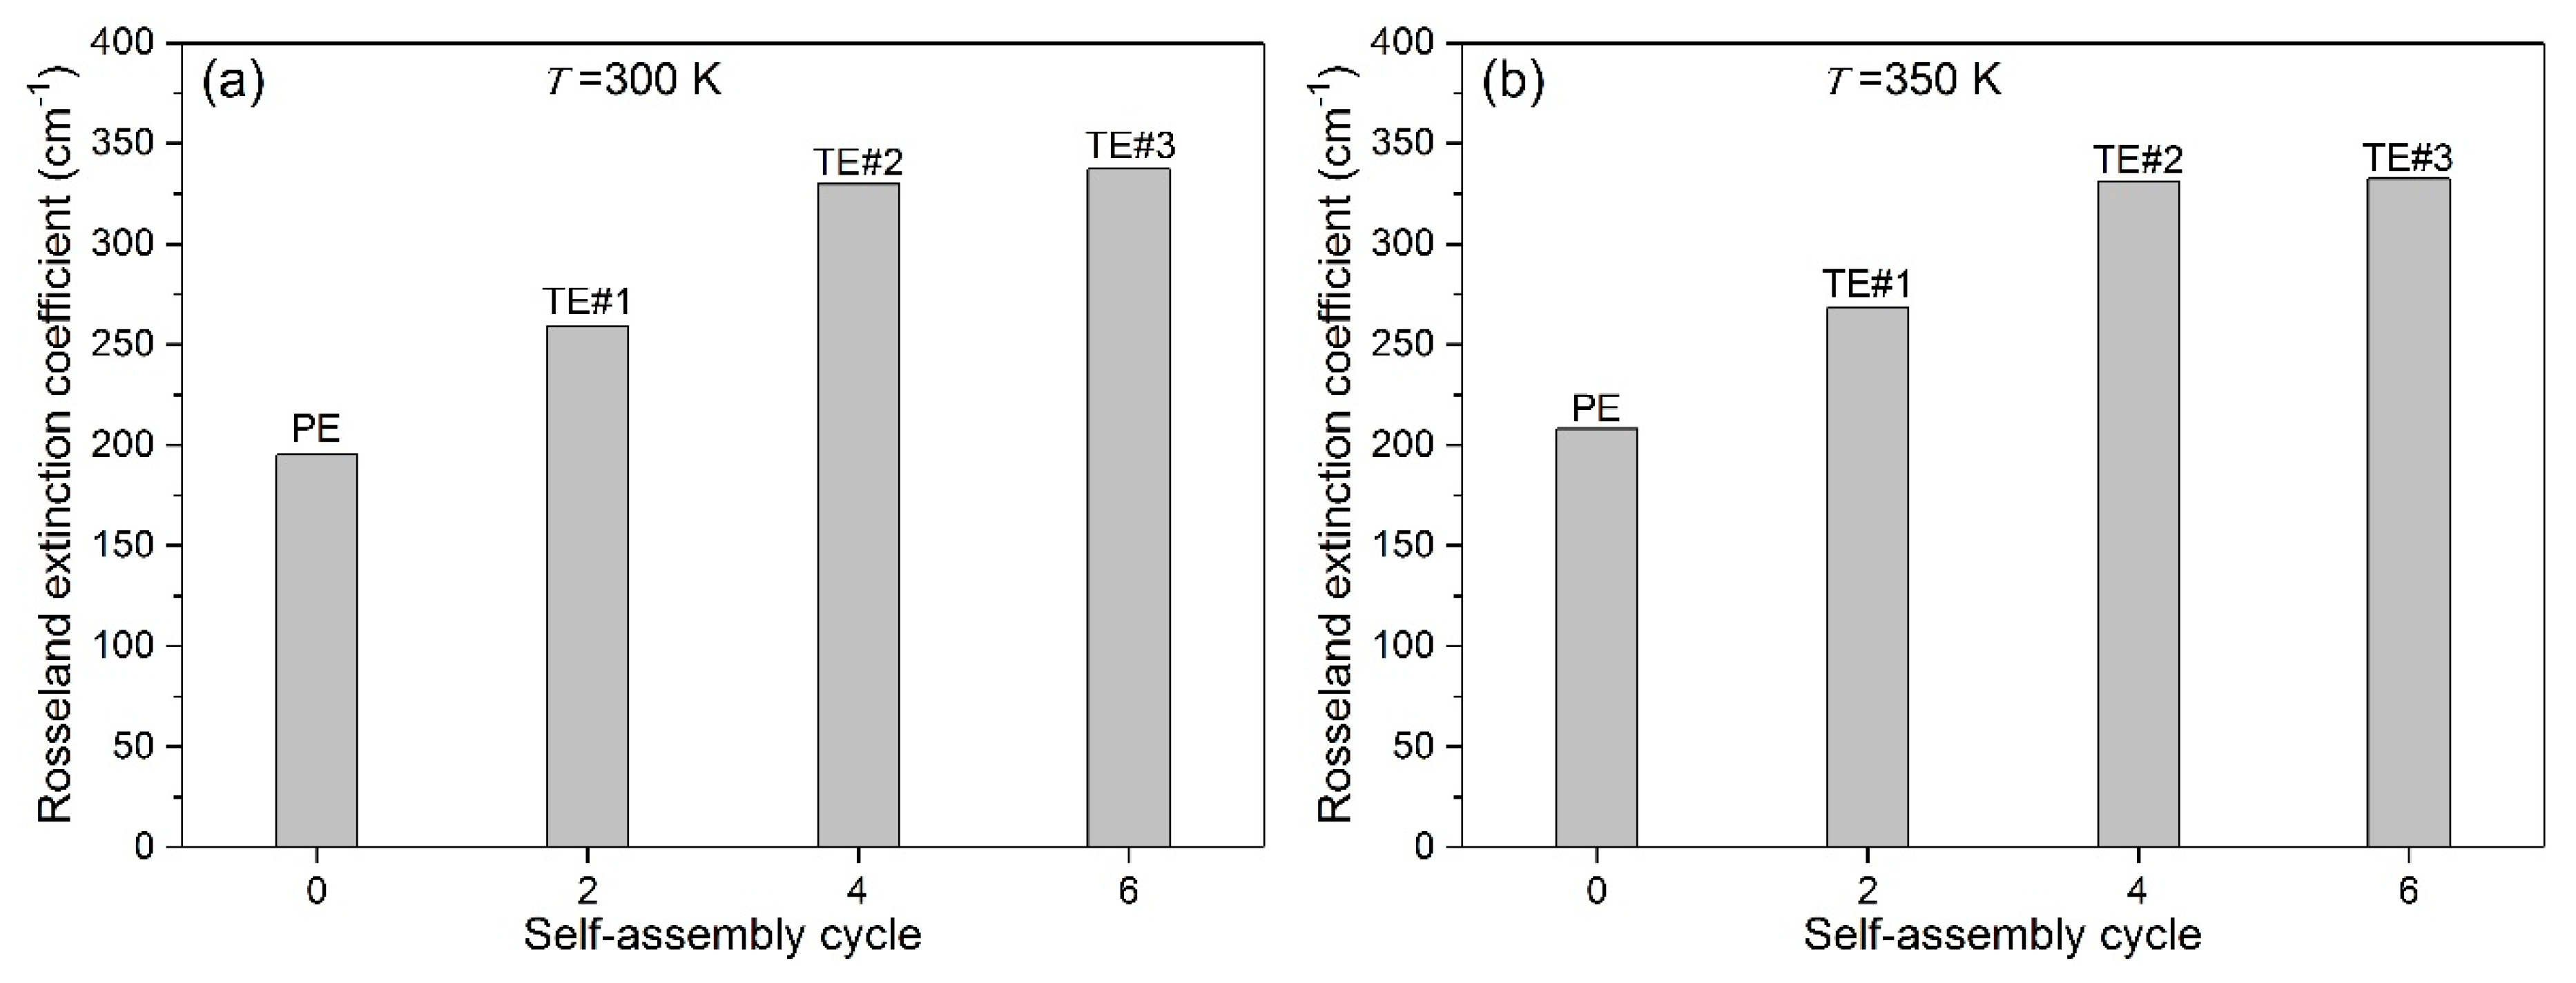
3.3. Controllable Self-Assembly for Increasing Optical Extinction Capacity of TiO2-Coated Electrospun Fibers

With the aim to further predict surface engineering influence by considering the volume and fiber diameter of fibrous membranes concerning infinite cylindrical fibers with an axis vertical to the radiation heat flux, the spectral extinction coefficient ( β λ , cm−1) can be calculated by
β λ = 4 Q λ · v f / π d f
Figure 8a–d show the β λ of PE and TE#1–TE#3 at wavenumbers of 1000, 2000, 3000, 4000 cm−1, respectively. From Figure 8a, it can be observed that with an increase in the self-assembly time, the β λ increased first, then kept stable with a maximum. A similar existence of the maximum β λ with an increase in the self-assembly time could also be seen in Figure 8b. It is possible that with an increase in the self-assembly cycles, the porosity of the TiO2 nanolayer decreases, and thereby decreases the scattering of small particles, resulting in the decline of the overall optical extinction capacity. Furthermore, there was a negative correlation between the β λ value and the fiber diameter based on Equation (9). Obviously, TE#3 had a higher average fiber diameter than TE#2.
The β λ values in Figure 8c,d obviously increased with an increase in the self-assembly time at wavenumbers of 3000 and 4000 cm−1. Therefore, it is an effective strategy to increase the optical β λ of TiO2-coated electrospun fibers through controllable self-assembly time. Moreover, the β λ increased with an increase in the wavenumber. For instance, as the wavenumber increased from 1000 to 4000 cm−1, the β λ value of TE#3 increased from 330 to 640 cm−1, which can be explained by the refractive index at high wavenumbers being presented as much greater than that at low wavenumbers, as shown in Table 1.
Unlike Figure 8c,d, it was found that the β λ values in Figure 8a,b first increased, then decreased with an increase in the self-assembly time. It is possible that as the self-assembly time increased from four to six, the porosity of the TiO2 layer is decreased, which thereby decreased the overall scattering capacity. Another reason may lie in the negative correlation between the β λ value and the fiber diameter based on Equation (9). Obviously, TE#3 had an average fiber diameter that was greater than TE#2.
It should be noted that the β λ values at wavenumbers of 1000 and 2000 cm−1 had different trend from those at 3000 and 4000 cm−1; the former showed a maximum at TE#2 while the latter increased from TE#2 to TE#3. It is likely that the lower wavenumber presents a greater influence on the increase of β λ . This is consistent with the transmittances in Figure 7a, where TE#2 showed even smaller transmittances than TE#2 at lower wavenumbers such as 1000 and 2000 cm−1.
For the purpose of quantitatively evaluating the influence of the self-assembly time on the β λ of the TiO2-coated electrospun fibers, an increment percentage of the spectral extinction coefficient ( P β , λ ) was introduced and calculated by
P β , λ = β λ ( n L ) β λ ( 0 ) β λ ( 0 ) × 100 %
Figure 9 shows the P β , λ for various self-assembly cycles at wavenumbers of 1000, 2000, 3000, and 4000 cm−1, respectively. It was observed that P β , λ increased at most wavenumbers with an increase in the self-assembly time. For instance, these percentages at wavenumbers of 1000, 2000, 3000, and 4000 cm−1 were 18.1%, 7.8%, 11.6%, and 7.6% for TE#2, which were much greater than the 12.1%, 1.2%, 5.8%, and 2.6% for TE#1, respectively. Therefore, the β λ could be effectively enhanced by increasing the self-assembly time.
Considering the spectral extinction coefficient for a wavenumber range of 400–4000 cm−1, an optical parameter that indicates the overall optical enhancement should be introduced such as the Rosseland extinction coefficient ( β T ). The β T represents a recombination of the spectral extinction coefficient by coupling the variations of the wavelength and surrounding temperature, which can be calculated by
β T = ( 0 1 β λ E b λ E b d λ ) 1
where E b represents the emissive power of black body, and E b λ represents the spectral emissive power of black body.
Figure 10a–c show the predicted results of β T for PE and TE#1–TE#3 at temperatures of 300, 350 and 400 K, respectively. It can be observed from Figure 10a that at 300 K, the β T increased rapidly from 195 to 330 cm−1 as the self-assembly time increased from zero to six. In comparison, the β T increased from 205 to 335 cm−1 at 350 K, and from 220 to 340 cm−1 at 400 K. It is worth noting that the β T result was quite different from the spectral extinction coefficient, which may appear to decrease as the self-assembly time increased from four to six at wavenumbers of 1000 and 2000 cm−1 because the β T represents an overall result by integrating all the wavenumbers of 400–4000 cm−1.
It should be noted that the β T increased slightly or even approximately equal for TE#4 and TE#6 at different temperature. This indicates that a maximum enhancement of β T could be obtained with an increase in the self-assembly time. Therefore, controllable self-assembly could be sufficient for the increase in the optical extinction capacity of TiO2-coated electrospun fibers.
With the aim to further evaluate the influence of the self-assembly time on the β T of TiO2-coated electrospun fibers, an increment percentage of the Rosseland extinction coefficient ( P β , T ) was introduced and calculated by
P β , T = β T ( n L ) β T ( 0 ) β T ( 0 ) × 100 %
Figure 11 shows the P β , T for various self-assembly cycles at temperatures of 300, 350, and 400 K. It can be observed that the P β , λ increased rapidly as the self-assembly time increased from zero to four. For instance, these percentages at 300, 350, and 400 K were 69%, 59%, and 52%, respectively, for TE#2, while the corresponding values for TE#1 were only 33%, 29%, and 25%, respectively.
P β , λ increased slightly or even kept stable when the self-assembly time was greater than two. For instance, as the self-assembly cycles increased from four to six, the P β , λ varied from 69%, 59%, and 52% to 72%, 60%, and 51% at 300, 350, and 400 K, respectively. This indicates that a further assembly time from four to six may exert an insignificant influence on the optical property. Overall, through assembling TiO2 nanoparticles, the increment percentage of β T could reach as high as approximately 50–70%.
In order to further compare the influence surface morphologies on the infrared extinction of cylindrical fibers, five surface morphologies for increases in the infrared extinction were summarized in Table 3 and shows that a dense and smooth distribution of TiO2 presented an increase in the infrared extinction capacity with 5000 cm−1 [24], which was greater than that of the random distribution of TiO2 with 17 m2·kg−1 (~17 cm−1) by direct doping [1,39]. This is reasonable because a coating thickness of ~300 nm is a much larger amount than a content 20 wt. %. A TiO2 nanorod is a special doping mode on the fiber surface, however, it only presented an increase of 7.3–10 m2·kg−1 in infrared extinction [26], which was smaller than that of the TiO2 random distribution. It is possible that the TiO2 nanorod was ~200 nm in diameter and 1.5 μm in length, which is inferior to a diameter of 3.5 μm in terms of infrared extinction [22].
It should be noted that the TiO2 rice-like distribution was reported to be a highly efficient coating mode because it highly increased the specific surface area of the coating layer with a TiO2 size of ~30–50 nm [27]. The increase in the infrared extinction could be as high as 195 cm−1. However, this method consumed a large amount of nano TiO2 with a thickness of ~100–200 nm. In comparison, the self-assembly mode consumed a small amount of nano TiO2 to achieve a considerable increase in the infrared extinction capacity of fibers because the coating layer composed of TiO2 with a nano size of ~7–10 nm could be highly porous with a significantly increased specific surface area by self-assembly. For instance, the increase of infrared extinction presented as high as ~120–130 cm−1 by incorporating only 5.7 wt. % of assembled TiO2.
There was a coupling mechanism between coating content, TiO2 size, and TiO2 particle content, which could determine the increase of infrared extinction of the TiO2 surface coating. A greater coating content could be conducive to a greater increase in the infrared extinction. The optimal size of TiO2 particles for maximum infrared extinction is 3.5 μm, and the extinction decreases away from the optimal value [40]. However, the particle content of the porous TiO2 layer seems more likely be neglected according to previous studies [41], which is likely to be due to a lack of a measure to obtain the uncountable TiO2 particles. In fact, the particle number can be reflected by the porosity and specific surface area, and normally a larger particle number contributes to a greater infrared extinction.
Therefore, a high optical extinction of electrospun fiber could be expected through the controllable self-assembly of nano TiO2 with an extremely high porosity and specific surface area. The better optical properties of the TiO2-coated electrospun PVDF fiber obtained from controllable self-assembly in this work can be attributed to a higher increase in the light-scattering and reflecting ability than the other four surface morphologies as above-mentioned.

4. Conclusions

This paper presented the engineering surface and optical properties of TiO2-coated electrospun PVDF fibers through controllable self-assembly. By controlling self-assembly time, four samples, i.e., PE and TE#1–TE#3 with different self-assembly cycles, were experimentally obtained via electrospinning and LBL self-assembly techniques. Based on measurements and characterizations, the surface roughness and the average diameter of TiO2-coated electrospun PVDF fibers increased with an increase in the self-assembly time. Concerning the TiO2 coating layer, with an increase in the self-assembly time, the thickness and the assembled content increased while the porosity decreased. By controlling the self-assembly time, the optical scattering and absorption properties of TiO2-coated PVDF electrospun fibers were effectively increased. Through controllable self-assembly, the infrared extinction could be increased from 205–220 cm−1 for PE to 335–340 cm−1 for TE#3, which accounts for an enhancement of almost 50–75%. We believe that the controllable self-assembly has the potential to be one of the most efficient coating modes to increase the infrared extinction given its achievement of a highly porous coating structure.

Author Contributions

Conceptualization, J.Y. and H.W.; Methodology, F.H.; Software, Y.L.; Validation, J.Y. and Y.L.; Formal Analysis, J.Y. and F.H.; Investigation, J.Y. and Y.W.; Resources, J.Y.; Data Curation, Z.S.; Writing-Original Draft Preparation, J.Y.; Writing-Review & Editing, F.H., H.W. and Y.W.; Visualization, J.Y.; Supervision, H.W. and Z.S.; Project Administration, H.W.; Funding Acquisition, H.W.

Funding

This research was funded by the Guangdong Science and Technology Project (2017A050506058), the Major Research Project of Guangdong Provincial Department of Education (No. 2016KZDXM035), the Innovation Group Project of Guangzhou (No. 1201610010), and the Yangcheng Scholars Project of Guangzhou (1201561560).

Conflicts of Interest

The authors declare no conflict of interest.

References

  1. Wang, M.R.; Pan, N. Predictions of effective physical properties of complex multiphase materials. Mater. Sci. Eng. R Rep. 2008, 63, 1–30. [Google Scholar] [CrossRef]
  2. Tański, T.; Matysiak, W. Synthesis of the novel type of bimodal ceramic nanowires from polymer and composite fibrous mats. Nanomaterials 2018, 8, 179. [Google Scholar] [CrossRef] [PubMed]
  3. Cruz, C.; Cisternas, L.A.; Kraslawski, A. Scaling problems and control technologies in industrial operations: Technology Assessment. Sep. Purif. Technol. 2018, 2017, 20–27. [Google Scholar] [CrossRef]
  4. Akgul, Y.; Polat, Y.; Canbay, E.; Demir, A.; Kilic, A. 20-Nanofibrous Composite Air Filters, Polymer-Based Nanocomposites for Energy and Environmental Applications; Woodhead Publishing: Oxford, UK, 2018; pp. 553–567. [Google Scholar]
  5. Wang, X.F.; Ding, B.; Yu, J.Y.; Wang, M.R. Engineering biomimetic superhydrophobic surfaces of electrospun nanomaterials. Nano Today 2011, 6, 510–530. [Google Scholar] [CrossRef]
  6. Liverani, L.; Boccaccini, A. Versatile production of poly(Epsilon-Caprolactone) fibers by electrospinning using benign solvents. Nanomaterials 2016, 6, 75. [Google Scholar] [CrossRef] [PubMed]
  7. Qiao, Z.; Shen, M.W.; Xiao, Y.C.; Zhu, M.; Mignani, S.; Majoral, J.P.; Shi, X. Organic/inorganic nanohybrids formed using electrospun polymer nanofibers as nanoreactors. Coord. Chem. Rev. 2018, 372, 31–51. [Google Scholar] [CrossRef]
  8. Wu, H.J.; Fan, J.T.; Qin, X.H.; Zhang, G. Thermal radiative properties of electrospun superfine fibrous PVA films. Mater. Lett. 2008, 62, 828–831. [Google Scholar] [CrossRef]
  9. Lee, J.K.Y.; Chen, N.; Peng, S.; Li, L.; Tian, L.; Thakor, N.; Ramakrishna, S. Polymer-based composites by electrospinning: Preparation & functionalization with nanocarbons. Prog. Polym. Sci. 2018, 86, 40–84. [Google Scholar]
  10. Bai, J.; Li, Y.X.; Yang, S.T.; Du, J.S.; Wang, S.G.; Zhang, C.Q.; Yang, Q.B.; Chen, X.S. Synthesis of AgCl/PAN composite nanofibres using an electrospinning method. Nanotechnology 2007, 18, 410–415. [Google Scholar] [CrossRef]
  11. Yang, G.; Li, X.L.; He, Y.; Ma, J.K.; Ni, G.L.; Zhou, S.B. From nano to micro to macro: Electrospun hierarchically structured polymeric fibers for biomedical applications. Prog. Polym. Sci. 2017, 81, 80–113. [Google Scholar] [CrossRef]
  12. Caps, R.; Arduini-Schuster, M.C.; Ebert, H.P.; Fricke, J. Improved thermal radiation extinction in metal coated polypropylen microfibers. Int. J. Heat Mass Transf. 1993, 36, 2789–2794. [Google Scholar] [CrossRef]
  13. Kiran, A.S.K.; Kumar, T.S.S.; Perumal, G.; Sanghavi, R.; Doble, M.; Ramakrishna, S. Dual nanofibrous bioactive coating and antimicrobial surface treatment for infection resistant titanium implants. Prog. Org. Coat. 2018, 121, 112–119. [Google Scholar] [CrossRef]
  14. Yang, J.M.; Wu, H.J.; Wang, M.R.; Liang, Y.Y. Prediction and optimization of radiative thermal properties of nano TiO2 assembled fibrous insulations. Int. J. Heat Mass Transf. 2018, 117, 729–739. [Google Scholar] [CrossRef]
  15. Li, Z.; Ding, S.Q.; Yu, X.; Han, B.G.; Ou, J.P. Multifunctional cementitious composites modified with nano- titanium dioxide: A review. Compos. Part A Appl. Sci. Manuf. 2018, 111, 115–137. [Google Scholar] [CrossRef]
  16. Xu, L.; Jiang, Y.G.; Feng, J.Z.; Feng, J.; Yue, C.W. Infrared-opacified Al2O3-SiO2 aerogel composites reinforced by SiC-coated mullite fibers for thermal insulations. Ceram. Int. 2015, 41, 437–442. [Google Scholar] [CrossRef]
  17. Xu, T.; Jin, W.; Wang, Z.Z.; Cheng, H.Y.; Huang, X.H.; Guo, X.Y.; Ying, Y.; Wu, Y.P.; Wang, F.; Wen, Y.; et al. Electrospun CuO-nanoparticles-modified polycaprolactone @polypyrrole fibers: An application to sensing glucose in saliva. Nanomaterials 2018, 8, 133. [Google Scholar] [CrossRef]
  18. Mahapatra, A.; Garg, N.; Nayak, B.P.; Mishra, B.G.; Hota, G. Studies on the synthesis of electrospun PAN-Ag composite nanofibers for antibacterial application. J. Appl. Polym. Sci. 2012, 124, 1178–1185. [Google Scholar] [CrossRef]
  19. Kumar, A.; Jose, R.; Fujihara, K.; Wang, J.; Ramakrishna, S. Structural and optical properties of electrospun TiO2 nanofibers. Chem. Mater. 2007, 19, 6536–6542. [Google Scholar] [CrossRef]
  20. Shi, H.; He, Y.; Pan, Y.; Di, H.; Zeng, G.; Zhang, L.; Zhang, C. A modified mussel-inspired method to fabricate TiO2 decorated superhydrophilic PVDF membrane for oil/water separation. J. Membr. Sci. 2016, 506, 60–70. [Google Scholar] [CrossRef]
  21. Nunes-Pereira, J.; Costa, C.M.; Lanceros-Méndez, S. Polymer composites and blends for battery separators: State of the art, challenges and future trends. J. Power Source 2015, 281, 378–398. [Google Scholar] [CrossRef]
  22. Kuhn, J.; Gleissner, T.; Arduini-Schuster, M.C.; Korder, S.; Fricke, J. Integration of mineral powders into SiO2 aerogels. J. Non-Cryst. Solids 1995, 186, 291–295. [Google Scholar] [CrossRef]
  23. Yang, J.M.; Wu, H.J.; Huang, G.S.; Liang, Y.Y.; Liao, Y.D. Modeling and coupling effect evaluation of thermal conductivity of ternary opacifier/fiber/aerogel composites for super-thermal insulation. Mater. Des. 2017, 133, 224–236. [Google Scholar] [CrossRef]
  24. Danion, A.; Disdier, J.; Guillard, C.; Abdelmalek, F.; Jaffrezic-Renault, N. Characterization and study of a single- TiO2-coated optical fiber reactor. Appl. Catal. B Environ. 2004, 52, 213–223. [Google Scholar] [CrossRef]
  25. Abdal-Hay, A.; Mousa, H.M.; Khan, A.; Vanegas, P.; Ju, H.L. TiO2 nanorods coated onto nylon 6 nanofibers using hydrothermal treatment with improved mechanical properties. Colloids Surf. A Physicochem. Eng. Asp. 2014, 457, 275–281. [Google Scholar] [CrossRef]
  26. Yang, J.X.; Zhang, Y.W.; Hong, Z.L.; Ma, R.H.; Zhang, D.; Wang, X.T.; Sun, C.C.; Hu, Z.J. Preparations of TiO2 nanocrystal coating layers with various morphologies on Mullite fibers for infrared opacifier application. Thin Solid Films 2012, 520, 2651–2655. [Google Scholar] [CrossRef]
  27. Zhao, P.T.; Fan, J.T. Electrospun nylon 6 fibrous membrane coated with rice-like TiO2 nanoparticles by an ultrasonic-assistance method. J. Membr. Sci. 2010, 355, 91–97. [Google Scholar] [CrossRef]
  28. Grumezescu, A. Fabrication and Self-Assembly of Nanobiomaterials: Applications of Nanobiomaterials; William Andrew: Norwich, NY, USA, 2016. [Google Scholar]
  29. Huang, W.L.; Liu, B.; Chen, Z.P.; Wang, H.J.; Ren, L.; Jiao, J.M.; Zhuang, L.; Luo, J.; Jiang, L.L. Fabrication of magnetic nanofibers by needleless electrospinning from a self-assembling polymer ferrofluid cone array. Nanomaterials 2017, 7, 277. [Google Scholar] [CrossRef] [PubMed]
  30. Lee, J.A.; Krogman, K.C.; Ma, M.; Hill, R.M.; Hammond, P.T.; Rutledge, G.C. Highly reactive multilayer-assembled TiO2 coating on electrospun polymer nanofibers. Adv. Mater. 2009, 21, 1252–1256. [Google Scholar] [CrossRef]
  31. Huang, Z.M.; Zhang, Y.Z.; Kotaki, M.; Ramakrishna, S. A review on polymer nanofibers by electrospinning and their applications in nanocomposites. Compos. Sci. Technol. 2003, 63, 2223–2253. [Google Scholar] [CrossRef]
  32. Huang, H.; Wu, H.; He, F.; Chen, Q. Surface Modification of electrospun poly(vinylidene fluoride) fibrous membrane based on layer-by-layer assembly of TiO2 nanoparticles. J. Nanosci. Nanotechnol. 2017, 17, 443–449. [Google Scholar] [CrossRef] [PubMed]
  33. Gee, S.; Johnson, B.; Smith, A.L. Optimizing electrospinning parameters for piezoelectric PVDF nanofiber membranes. J. Membr. Sci. 2018, 563, 804–812. [Google Scholar] [CrossRef]
  34. Wu, H.J.; Chen, Y.T.; Chen, Q.L.; Ding, Y.F.; Zhou, X.Q.; Gao, H.T. Synthesis of flexible aerogel composites reinforced with electrospun nanofibers and microparticles for thermal insulation. J. Nanomater. 2013, 2013, 375093. [Google Scholar] [CrossRef]
  35. Yang, J.M.; Wu, H.J.; Wang, M.R.; He, S.Q.; Huang, H.K. Prediction and optimization of radiative thermal properties of ultrafine fibrous insulations. Appl. Therm. Eng. 2016, 104, 394–402. [Google Scholar] [CrossRef]
  36. Bohren, C.F.; Huffman, D.R. Absorption and Scattering of Light by Small Particles; John Wiley & Sons: New York, NY, USA, 2008. [Google Scholar]
  37. Kronig, R.D.L. On the theory of dispersion of X-rays. J. Opt. Soc. Am. 1926, 12, 547–556. [Google Scholar] [CrossRef]
  38. Mie, G. Beiträge zur optik trüber medien, speziell kolloidaler metallösungen. Annalen Der Physik 1908, 330, 377–445. [Google Scholar] [CrossRef]
  39. Wang, J.; Kuhn, J.; Lu, X. Monolithic silica aerogel insulation doped with TiO2 powder and ceramic fibers. J. Non-Cryst. Solids 1995, 186, 296–300. [Google Scholar] [CrossRef]
  40. Howell, J.R.; Mengüç, M.P.; Robert, S. Thermal Radiation Heat Transfer, 6th ed.; CRC Press: Boca Raton, FL, USA, 2015. [Google Scholar]
  41. Abdellatif, S.; Sharifi, P.; Kirah, K.; Ghannam, R.; Khalil, A.S.G.; Erni, D.; Marlow, F. Refractive index and scattering of porous TiO2 films. Microporous Mesoporous Mater. 2018, 264, 84–91. [Google Scholar] [CrossRef]
Figure 1. Preparations of TiO2-coated electrospun fibers. (a) Preparation process; (b) Influence of electrospinning parameters [34].
Nanomaterials 08 00741 g001
Figure 2. SEM images of PE and TE#1–TE#3 at magnifications of 5000 and 30,000.
Nanomaterials 08 00741 g002
Figure 3. Fiber diameters and standard deviations of TiO2-coated electrospun fibers with different self-assembly cycles.
Nanomaterials 08 00741 g003
Figure 4. (a) Thickness; (b) assembled content, and (c) porosity of the TiO2-coated electrospun fibers with different self-assembly cycles.
Nanomaterials 08 00741 g004
Figure 5. Weight loss of TiO2-coated electrospun fibers with different self-assembly cycles.
Nanomaterials 08 00741 g005
Figure 6. Assembly process with an increase in self-assembly cycles.
Nanomaterials 08 00741 g006
Figure 7. Transmittances for different self-assembly cycles. (a) At wavenumbers 400–4000 cm−1; (b) 400–1000 cm−1.
Nanomaterials 08 00741 g007
Figure 8. β λ for various self-assembly cycles wavenumbers of (a) 1000 cm−1; (b) 2000 cm−1; (c) 3000 cm−1, and (d) 4000 cm−1.
Nanomaterials 08 00741 g008
Figure 9. Increment percentage of spectral extinction coefficient at different wavenumbers.
Nanomaterials 08 00741 g009
Figure 10. Rosseland mean extinction coefficient for various self-assembly cycles at (a) 300 K; (b) 350 K, and (c) 400 K.
Nanomaterials 08 00741 g010aNanomaterials 08 00741 g010b
Figure 11. Increment percentage of Rosseland extinction coefficient.
Nanomaterials 08 00741 g011
Table 1. κ λ and n λ of PE and TE#1–TE#3 at 400–4000 cm−1.
Wavenumber (cm−1)Absorption Index ( κ λ )Refractive Index ( n λ )
PETE#1TE#2TE#3PETE#1TE#2TE#3
4000.250.300.450.502.302.502.752.85
8000.500.650.750.852.152.252.252.20
12001.151.501.551.601.601.601.701.65
16000.300.400.400.401.601.601.601.60
20000.350.400.450.401.601.551.601.60
24000.350.350.400.401.601.501.551.60
28000.350.350.400.351.551.501.551.60
32000.350.350.400.401.501.501.501.55
36000.350.350.400.451.451.451.451.50
40000.400.400.500.551.401.401.401.40
Table 2. Q λ of PE and TE#1–TE#3 at 400–4000 cm−1.
Wavelength (cm−1)Extinction Factor ( Q λ )
PETE#1TE#2TE#3
4000.0650.1050.1650.195
8000.2900.4050.5050.515
12000.6650.7700.8500.820
16000.3100.4000.4700.455
20000.4550.5200.6000.580
24000.5450.5850.6800.685
28000.6400.6400.7600.785
32000.7000.7250.8650.930
36000.7650.7900.9251.000
40000.8350.8751.0151.150
Table 3. Different surface morphologies for increases in infrared extinction.
Surface Morphology (TiO2)Structure SchematicCoating TechniqueSize of Coating ParticlesCoating Content (or Thickness)Increases in Infrared Extinction
[39] Random. Reproduced with permission from [1] Elsevier, 2008. Nanomaterials 08 00741 i001Direct doping~3.5 μmContent 20 wt. %By 17 m2·kg−1
Dense and low roughness. Reproduced with permission from [24]. Elsevier, 2004. Nanomaterials 08 00741 i002Soaking and dippingNoneThickness ~290–320 nmBy 5000 cm−1 at axis direction
Nanorods. Reproduced with permission from [26]. Elsevier, 2012. Nanomaterials 08 00741 i003Seed-hydrothermal~200 nm in diameter, 1.5 μm in lengthContent ~8.4–21.6 wt. %By ~7.3–10 m2·kg−1
Rice-like. Reproduced with permission from [27]. Elsevier, 2010. Nanomaterials 08 00741 i004Ultrasonic-assistance~30–50 nmThickness ~100–200 nm, large contentBy ~46–195 cm−1
Rough and continuous Nanomaterials 08 00741 i005Self-assembly~7–10 nmThickness 31 nm, content 5.7 wt. %By ~120–130 cm−1

