3.2. Kinetics of Aggregation: Aggregate Size
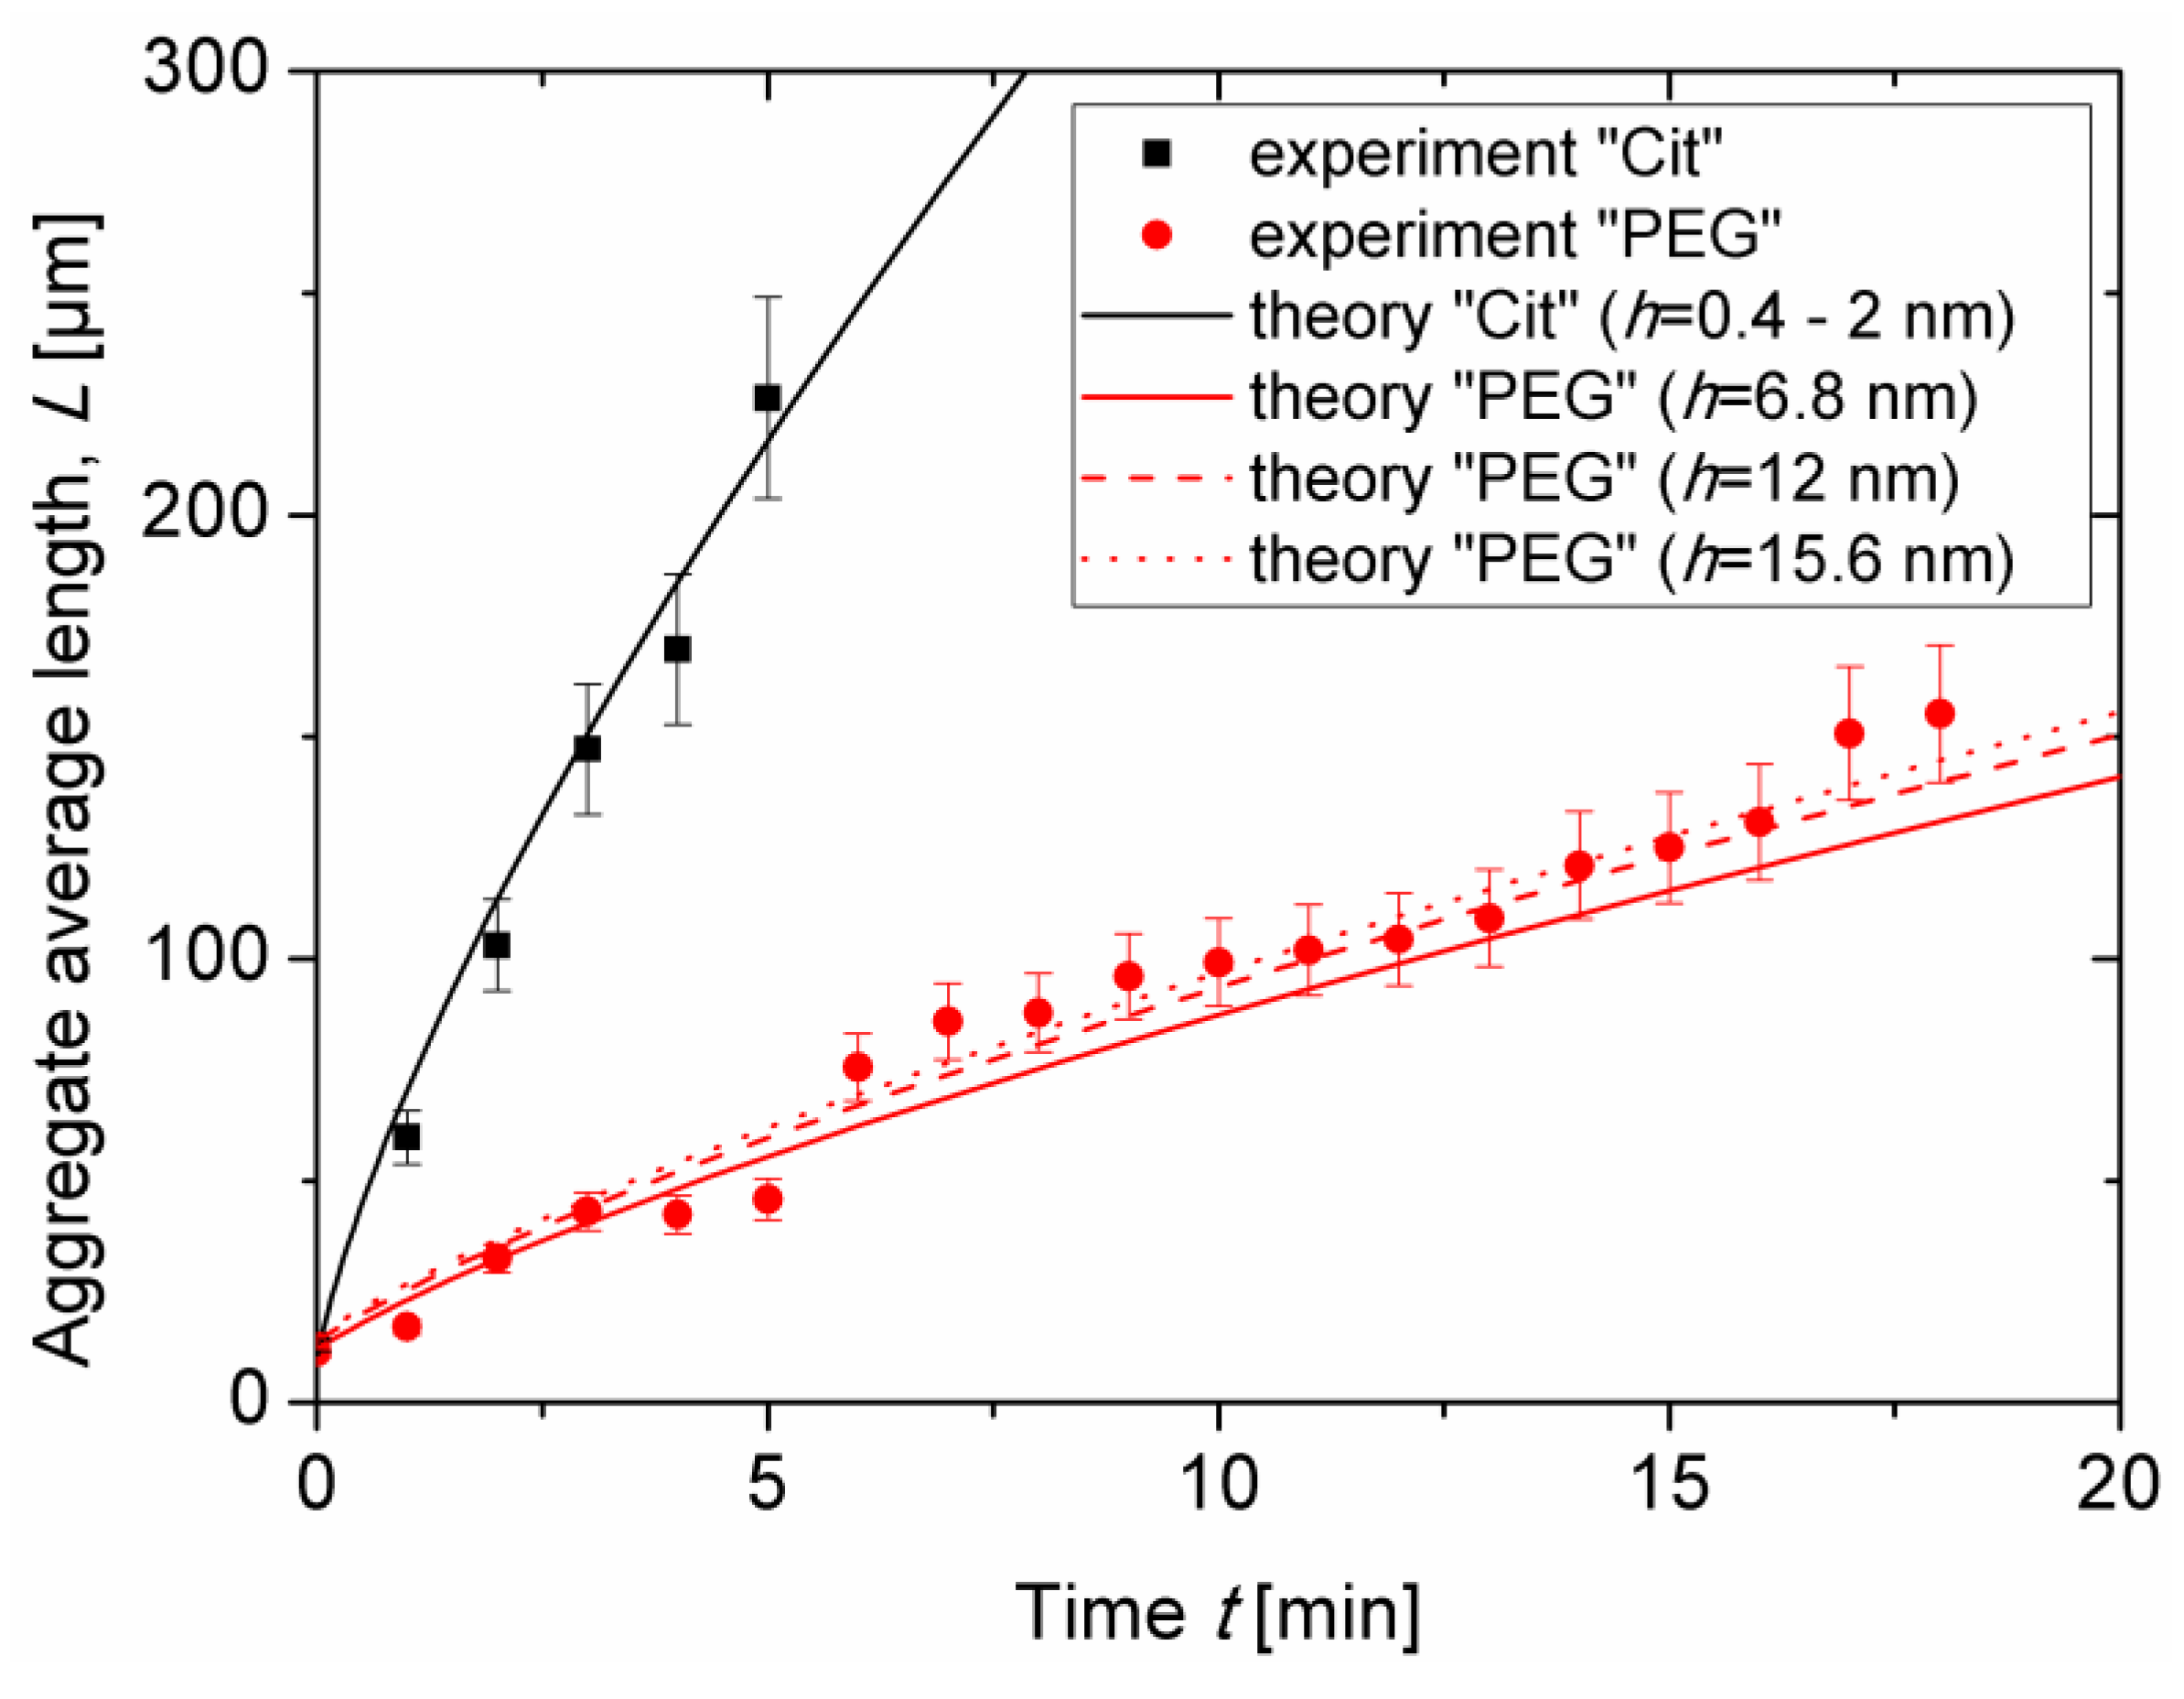
Experimental dependencies of the average aggregate length
L on elapsed time
t are presented as symbols in
Figure 5 for both samples at the same nanoparticle volume fraction
ϕ0 = 0.17 ± 0.03 vol.% and at an applied magnetic field intensity
H0 = 13.5kA/m. As stated in
Section 3.1, the aggregate length continuously grew with time as more and more particles migrated to the aggregates from the surrounding liquid medium. The onset of coalescence of aggregates observed in visualization experiments was accompanied by a slight change of the slope of the experimental
L(
t) curves. This break occurred at
t ≈ 5 min for citrated IONPs and at
t ≈ 12 min for PEGylated IONPs.
Figure 5 also confirms faster aggregation and larger aggregate size for the citrated sample as compared to the PEGylated one. Estimates performed in
Section 2.4 have shown that colloidal interactions between IONPs are short-ranged and non-attractive; they are not expected to cause any significant difference in magnetic field-induced aggregation between the two different samples. Thus, from the first glance, the difference in kinetics of Cit and PEG samples is ascribed to weaker magnetic dipolar interactions of PEGylated IONPs covered by a thicker molecular layer than citrated IONPs. For the better understanding of this effect, we proceed to theoretical evaluation of the
L(
t) dependency by fitting the experimental results with a theoretical model.
Theoretical
L(
t) dependency was derived in a parametric form {
L(
V),
t(
V)} in our recent work [
18] dealing with kinetics of aggregation of intermediate sized (20–100 nm) magnetic nanoparticles, where
V is the aggregate volume at given time
t. Despite the onset of aggregate coalescence at
t ≈ 5 and 12 min for citrated and PEGylated IONPs, respectively, absorption of neighboring nanoparticles by aggregates continued to be the dominant mechanism of aggregation, such that the theoretical model considering only aggregate growth by absorption of individual nanoparticles still provides a rather good fit of the experimental data in the considered range of elapsed time. Adapting the aggregate growth model to the case of IONPs with a nonmagnetic shell of a thickness
δ =
h/2 on their surface, the parametric dependency
L(
t) takes the following form:
where
is the dimensionless aggregate volume at given time
t;
is the dimensionless volume of primary aggregates at
t = 0 (the time is counted from the end of very short nucleation stage corresponding to the beginning of the aggregate growth stage);
is the volume scale;
is the nanoparticle diffusion coefficient (as can be assessed by DLS—
Section 2.2);
is the initial volume fraction of aggregates in the suspension;
,
and
are the values of suspension supersaturation at given time
t, at the beginning of the aggregate growth stage and at the beginning of the initial nucleation stage, respectively;
and
are volume fractions of the metal oxide multicores in the suspension corresponding to the left (dilute phase) and the right (concentrated phase) binodal curves of the field-concentration phase diagram. The value
corresponds to the threshold concentration of appearance of aggregates in the suspension at a given field; this value is available experimentally. The value
is close to the volume fraction
of inorganic multicores inside the aggregates and is estimated assuming random close packing of IONPs within the aggregates taking into account the adsorbed layer thickness:
. Numerical multiplier
K is a logarithmic function of the Langevin parameter
ξ and its expression is given in Ref. [
18]. The Langevin parameter is a characteristic ratio of the energy of interaction of the IONPs with the external magnetic field of intensity
H0 to the thermal agitation energy
kBT and is defined in the present work as:
where
is the spatial average (over all possible orientations) of the nanoparticle magnetic moment projected onto the direction of the external magnetic field
H0. This magnitude should not be confused with the saturation value of the magnetic moment and is obtained at each given magnetic field
H0 from magnetization measurements (
Section 2.3). Approximate expression in the right-hand side of Equation (7) gives about 10% error in
ξ at the considered magnetic field intensity
H0 = 13.5 kA/m. Note that the current expression for
ξ can be reduced to the one used in the original work [
18] if
is replaced by
, where
and
are respectively the magnetic contrast factor and the volume of IONPs. The same remark applies to the definition of the dipolar coupling parameter (Equation (8)) and Mason number (Equation (15)) with respect to the original work [
55], except for the fact that Equation (8) should then be multiplied by 4/3.
Theoretical dependencies (Equations (5), (6)) were fitted to the experimental
L(
t) curves and are shown in
Figure 5 by lines. The best fit was obtained for the following values of two adjustable parameters:
and
. Let us now analyze the effect of the thickness
δ =
h/2 of the adsorbed layer on the
L(
t)-dependency. Firstly, the Langevin parameter depends only on the inorganic diameter of IONPs, which is the same for both types of nanoparticles; the correction factor
K is therefore unaffected by the layer thickness. Secondly, the length scale
~
and the timescale
~
both increase with the organic layer thickness. Third, the supersaturations
∆ and
∆I decrease with the volume fraction
of magnetic multicores in the aggregates and increase with the non-magnetic layer thickness
δ =
h/2 at the fixed nanoparticle inorganic diameter
dI and at the fixed initial supersaturation
∆0. The net effect of the layer thickness on the
L(
t) dependency at fixed
∆0 can be inspected by comparing the solid, dashed, and dotted red lines in
Figure 5 corresponding to theoretical evaluation of the aggregate length for the PEG sample at three estimated values (see
Section 2.4 for details) of the separation distance between particles:
h = 2
δ ≈ 6.8, 12 and 15.6 nm, respectively. The differences between these curves are rather small, so that the effect of the layer thickness on
and on the time and length scales causes minor changes on aggregate growth. Notice that two different estimations of the citrate layer thickness (leading to separation distance
h = 2
δ ≈ 0.4 and 2 nm) provide hardly distinguishable theoretical dependences
L(
t), that are represented by a single black solid line in
Figure 5. Fourth, increasing the organic layer thickness is expected to weaken the magnetic dipolar interactions between IONPs and therefore to shift the phase separation to higher particle concentrations at a given magnetic field strength. This effect is reflected in the model by a decrease of the initial supersaturation
with increasing threshold concentration
of the phase separation. The initial supersaturation is the driving force of aggregation, therefore the
L(
t) curves are shifted downwards with decreasing
∆0, as the non-magnetic layer thickness increases. The value
∆0 was estimated to be
for the sample Cit with
h ≈ 0.4–2 nm and
for the sample PEG at
h ≈ 6.8–15.6 nm. Such a difference in
∆0 values allows reproducing a large difference between experimental
L(
t) curves of the citrated and PEGylated samples. It can therefore be concluded that the main effect of the layer thickness on aggregate growth arises from the shift of aggregation threshold to higher particle concentrations as
h increases.
According to the theory of magnetic field-induced reversible phase separation, the threshold concentration
of the phase separation is a strongly decreasing function of the dipolar coupling parameter [
54], which is conventionally defined as the ratio of the dipole interaction energy between two magnetic nanoparticles at contact to the thermal agitation energy [
27]:
where
r is the distance between particle centers. One can consider the case when the distance
r in Equation (8) is set to either the inorganic (
dI) or the outer (
dO) nanoparticle diameter corresponding to two distinct values of the dipolar coupling parameter:
and
. The following obvious relationship between these both parameters holds:
In the present case of IONPs with an adsorbed surface layer, the parameter
λO is more appropriate for description of the phase separation, however, evaluation of its value is subjected to uncertainties related to estimating the adsorbed layer thickness
δ =
h/2, especially for the PEGylated nanoparticles with
h ranged between 6.8 and 15.6 nm depending on the conformation of the chains (see
Section 2.4). The parameter
λI is defined with a rather good precision because it depends only on the inorganic nanoparticle diameter defined with confidence from TEM pictures (
Section 2.2). This diameter is the same for citrated and PEGylated nanoparticles, therefore, at the same applied magnetic field, the parameter
λI will take the same value for both types of nanoparticles. The values of
λI and
λO evaluated for two intensities
H0 of the applied magnetic field are summarized in
Table 2 along with the values of the Langevin parameter (Equation (7)) and of the nanoparticle spatial average magnetic moment
calculated from the magnetization curves (
Section 2.3). The values of
λO for citrated and PEGylated particles are shown for respectively two and three different values of the separation between particle inorganic surfaces, estimated in
Section 2.4.
As inferred from
Table 2, at a given magnetic field intensity, the values of the parameter
λI are nearly the same for both samples. A slight difference falls within the experimental error of determination by magnetometry of the particle magnetic moment
. On the contrary, at the same magnetic field, the values of
λO are larger by a factor ranging between 1.5 and 4 for the citrated nanoparticles which bear a much thinner citrate layer as compared to the thicker organic layer of the PEGylated nanoparticles. Such a difference in values of
λO is rather substantial and is expected to be at the origin of the considerable shift of the aggregation threshold to lower particle concentrations as
h decreases. This suggests that the dipolar coupling parameter
λO (evaluated taking into account the thickness of the adsorbed layer, Equation (9)) is the major parameter governing the kinetics of nanoparticle aggregation as opposed to the Langevin parameter
ξ (Equation (7)) giving only a logarithmic increase of the aggregation rate as
ξ increases. To get explicitly the effect of
λO on the aggregate growth rate, a
λO–
ϕ phase diagram has to be established in future such that the threshold concentration
ϕ’ should be explicitly expressed through
λO.
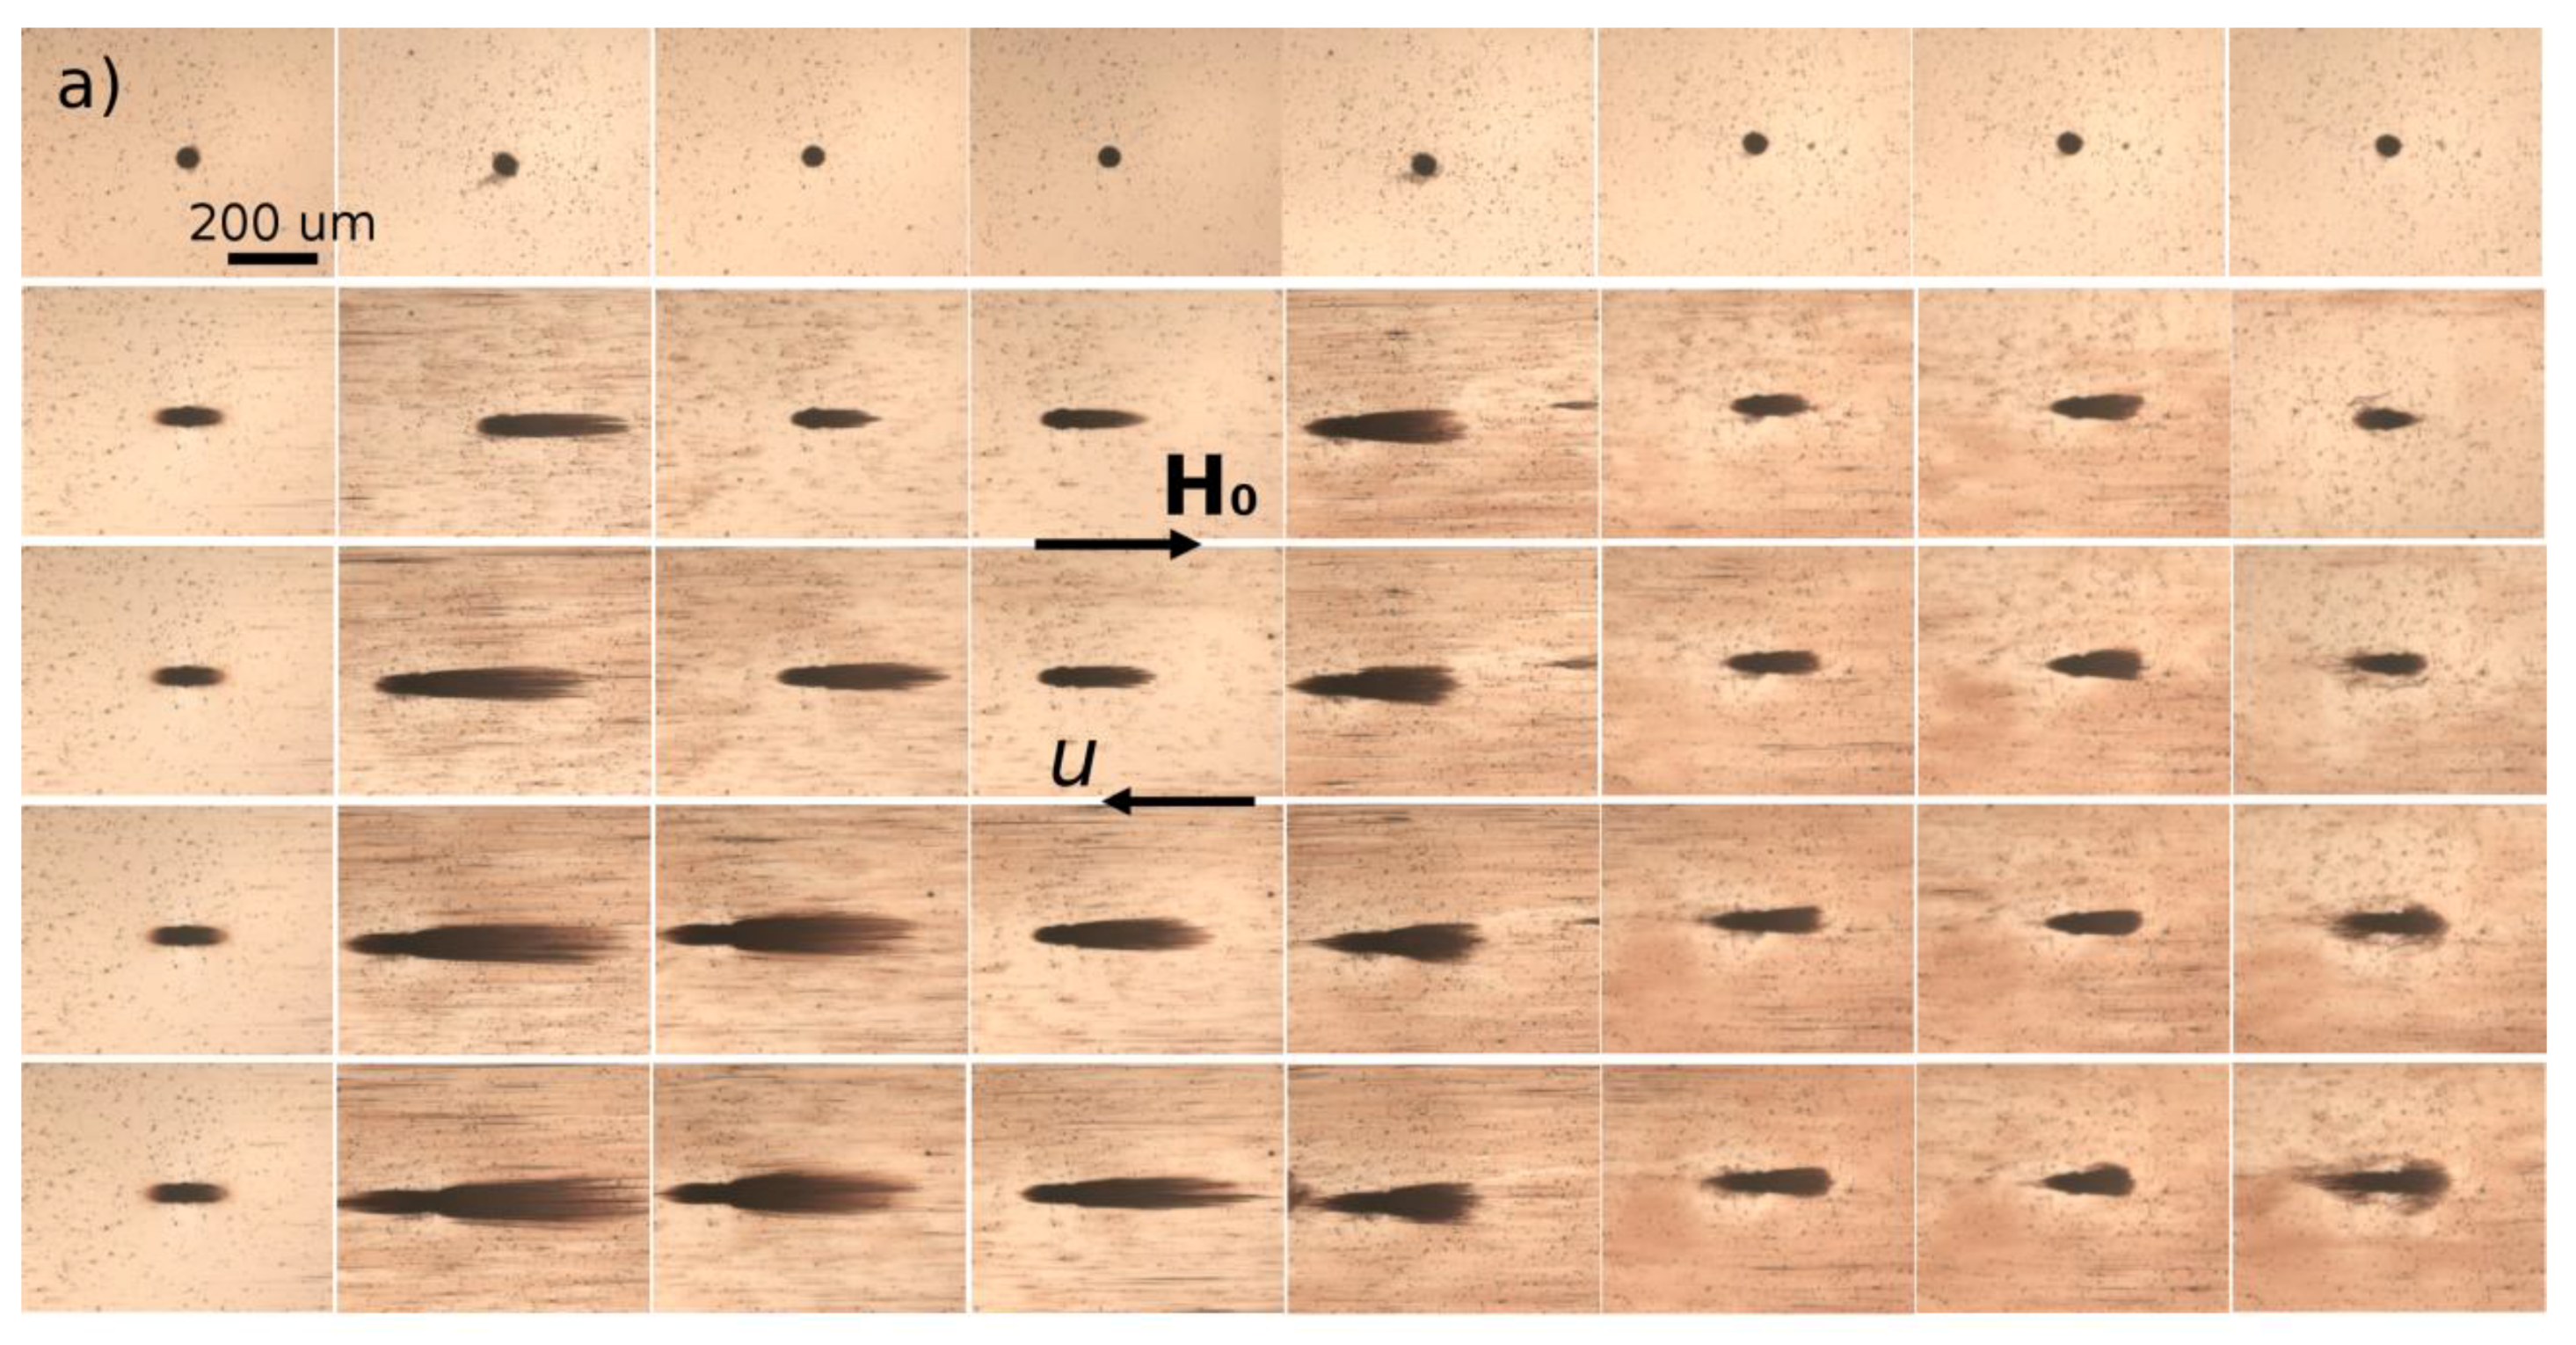
3.3. Magnetic Separation: Visualization Results
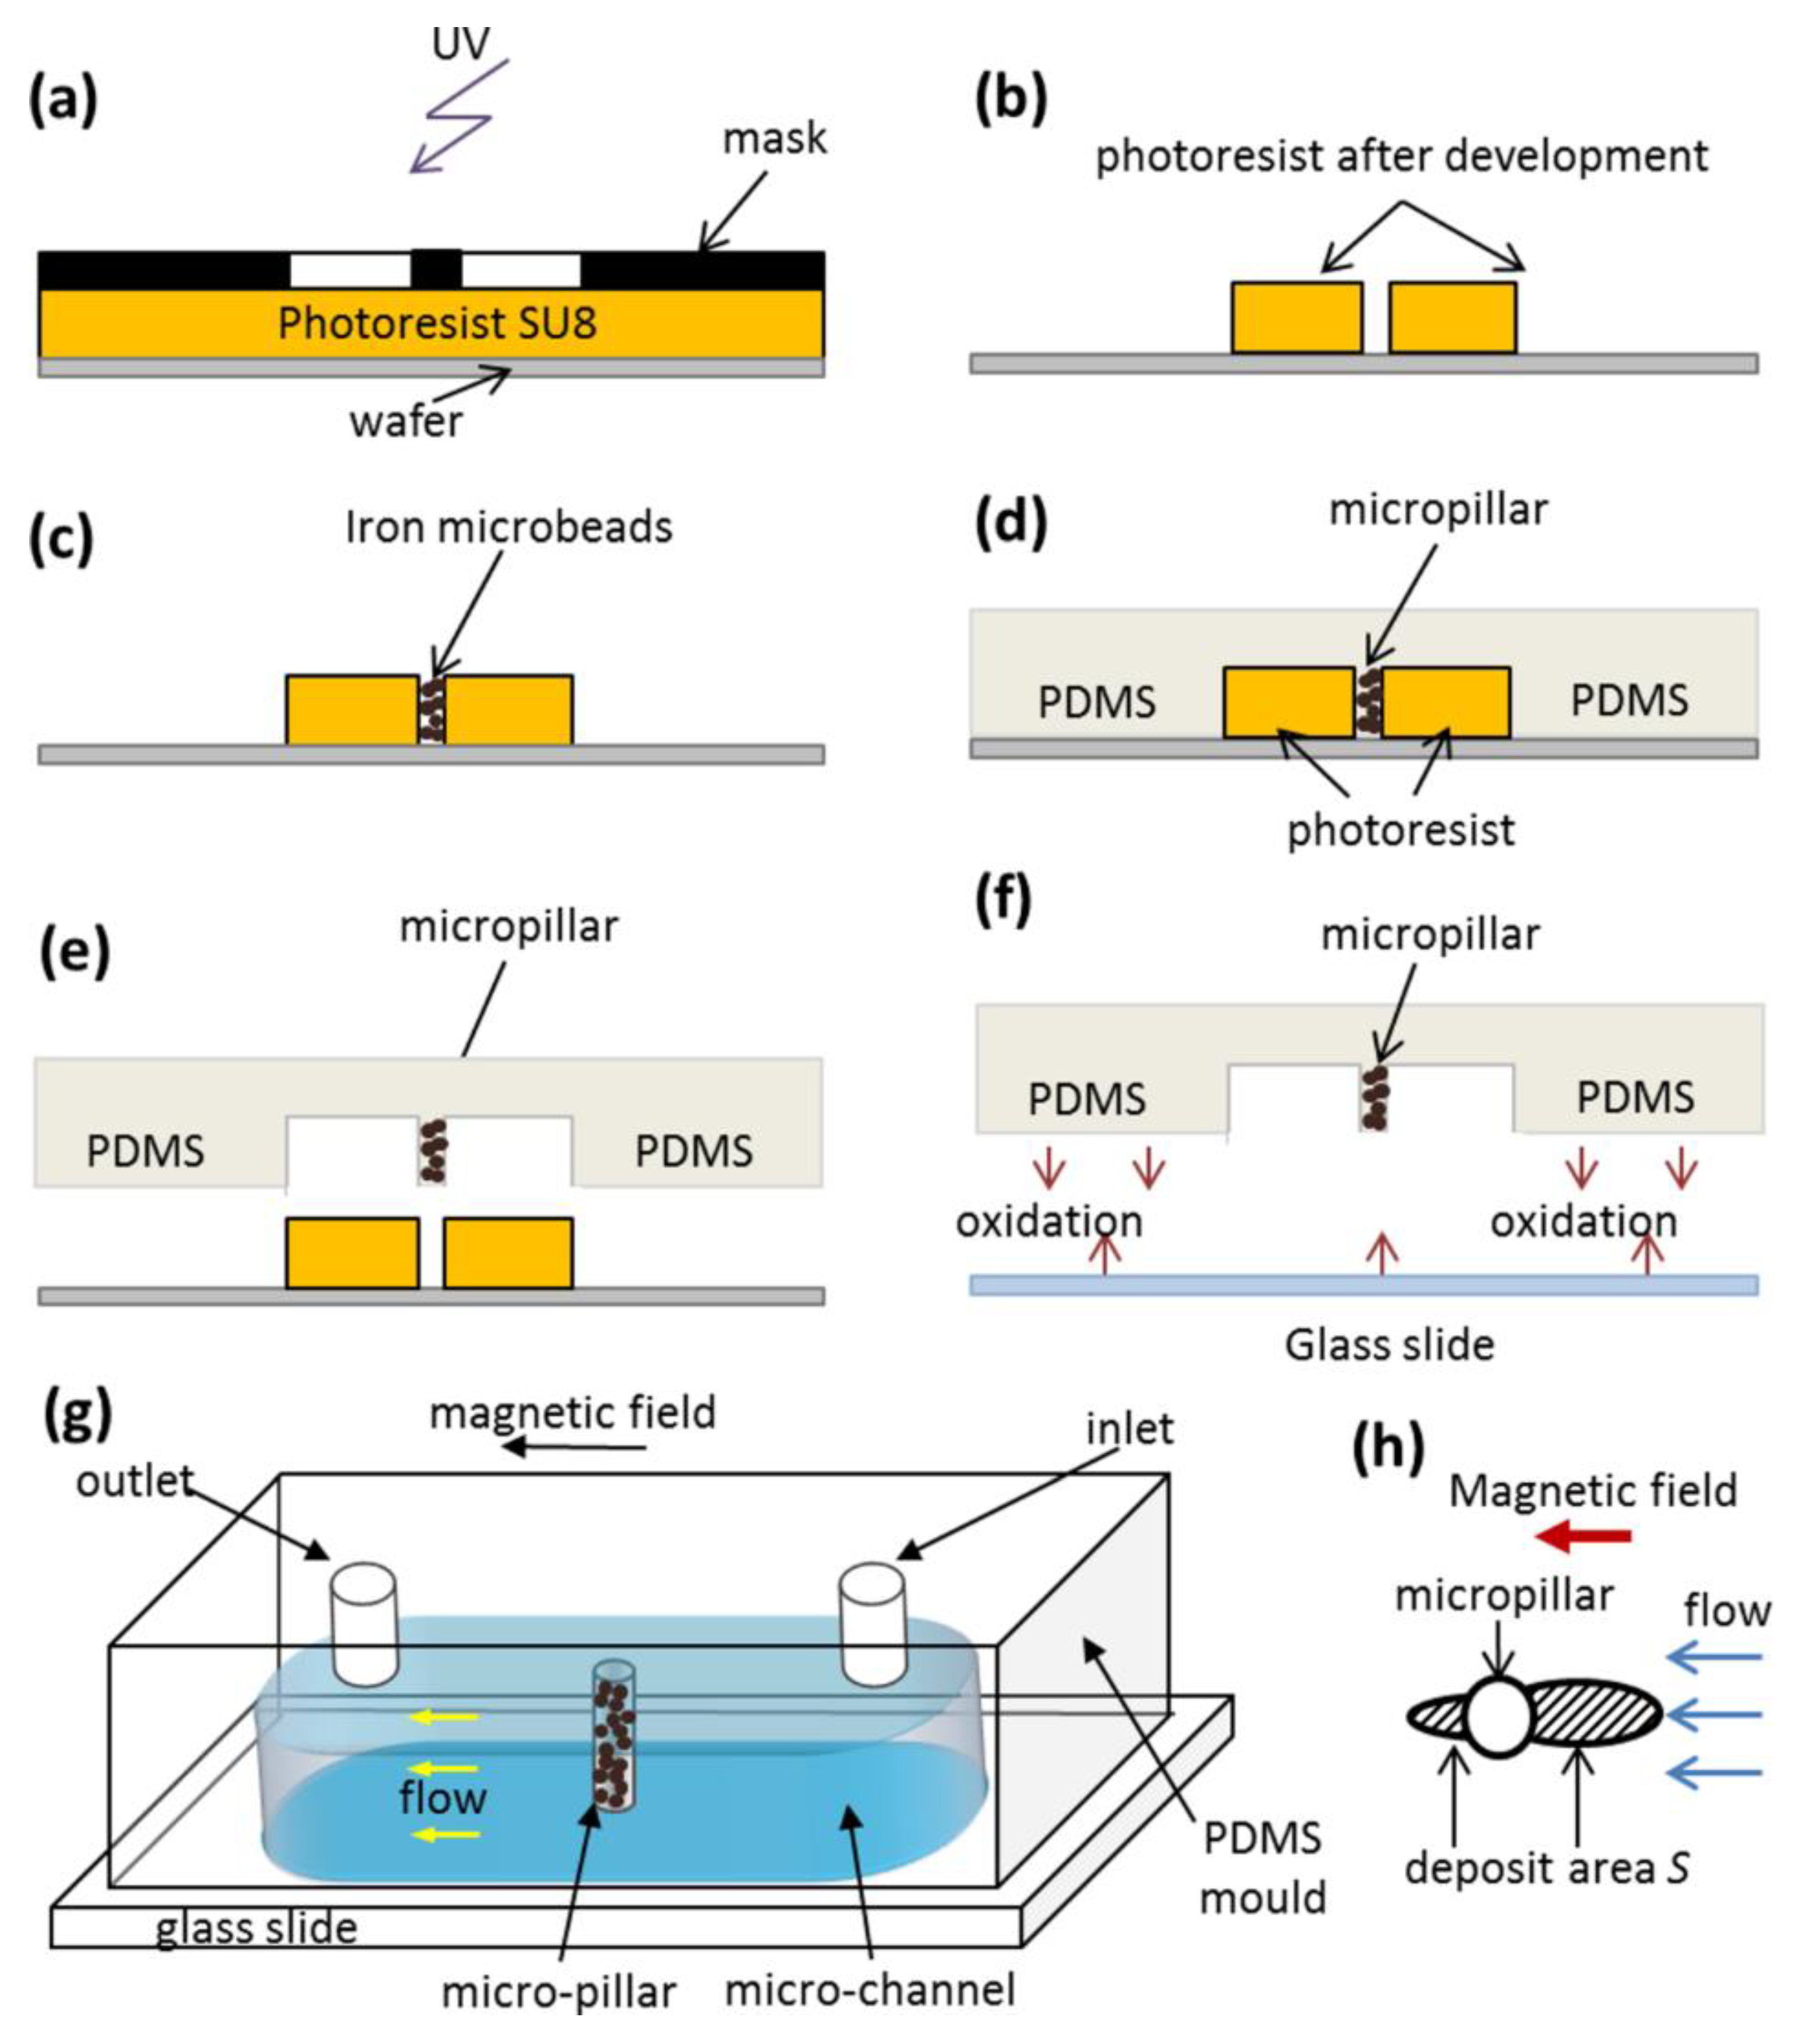
We now have to understand the effect of the adsorbed organic layer thickness on the magnetic separation of multicore IONPs. For this purpose, a dilute suspension of citrated or PEGylated IONPs is circulated at a desired flow rate
Q through a microfluidic PDMS channel containing a single cylindrical micropillar molded in the PDMS with embedded iron microbeads, oriented perpendicularly to the channel walls and spanning the whole channel thickness, as schematically shown in
Figure 3g . The micropillar diameter and height are
dm =
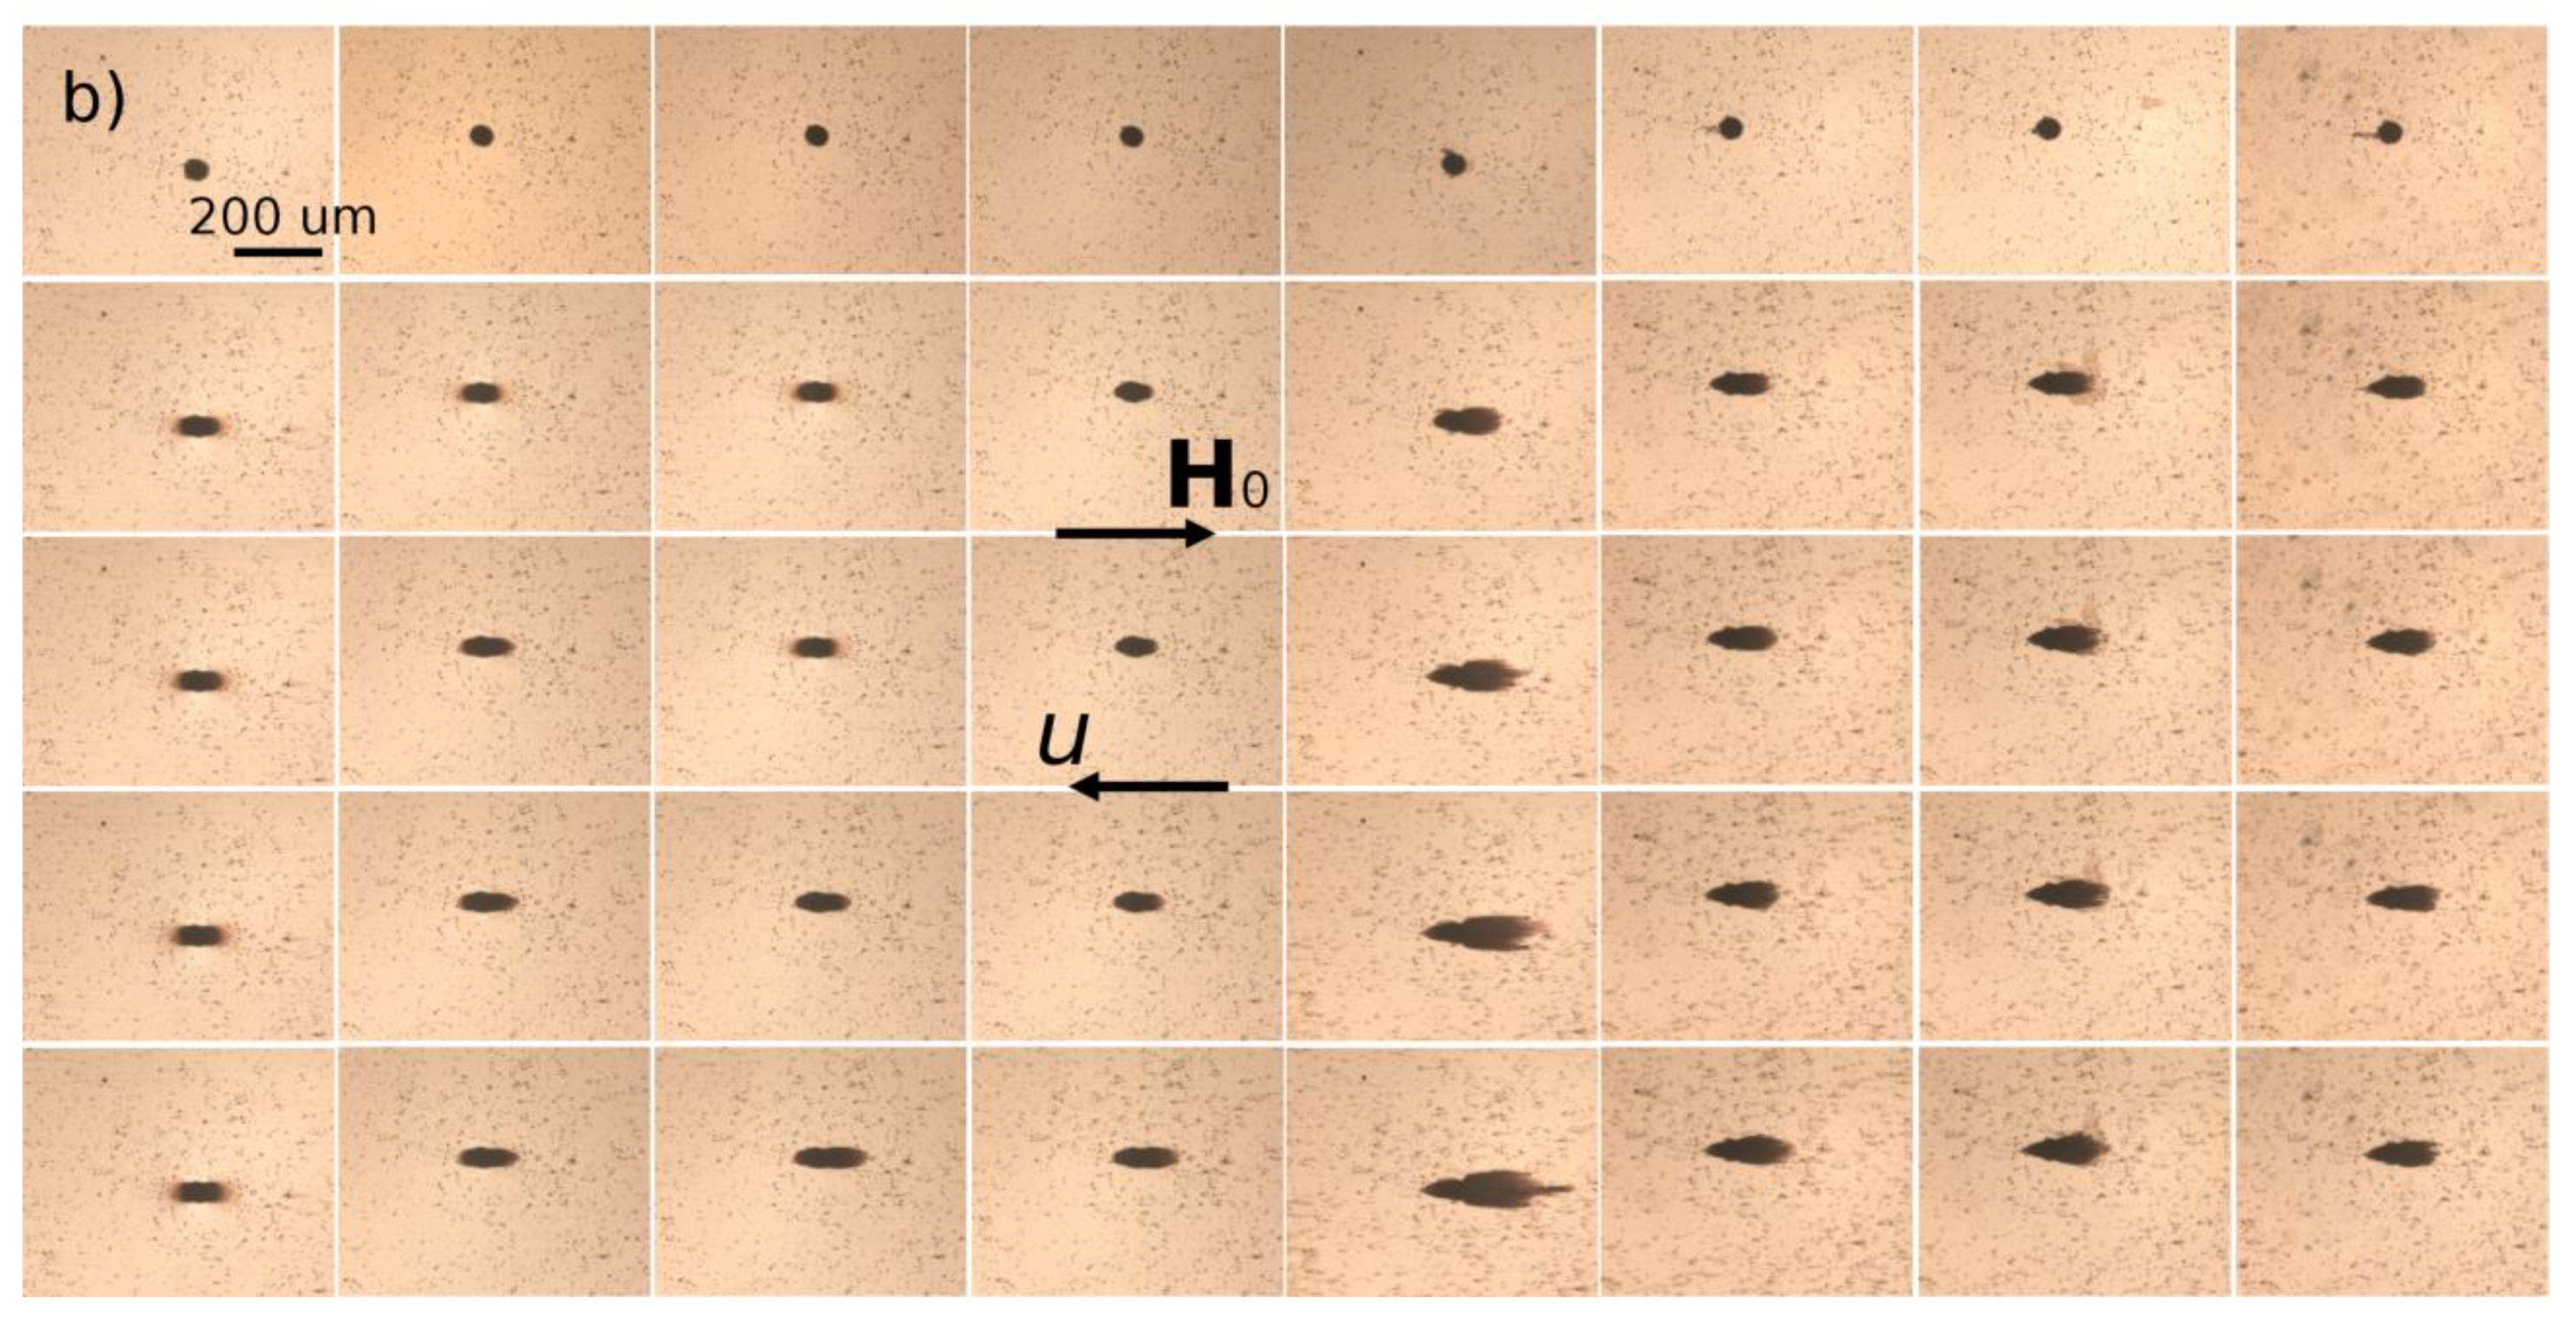
hm = 50 µm. Magnetically soft iron microbeads allow reversible magnetization of the micropillar by applying external magnetic fields. When the external magnetic field is applied, either parallel or antiparallel ((with no difference between these two orientations) to the hydrodynamic flow, the micropillar gets magnetized and starts attracting the nanoparticles. The snapshots illustrating accumulation of IONPs around the micropillar under applied magnetic field
H0 = 13.5 kA/m are shown on
Figure 6a,b for Cit and PEG samples, respectively. Each column corresponds to different values of the flow speed
u ranging from 0 to 10 mm/s from the left to the right column. The first row shows the initial state with a homogeneous nanoparticle suspension around a bare micropillar at the moment when the magnetic field is switched on (
t = 0). Other rows show progressive accumulation of IONPs with the elapsed time ranging from 10 to 60 min from the second to the bottom row.
The nanoparticles of both samples are accumulated around the magnetic poles of the micropillar and over time they form thick deposits extended along the applied magnetic field and having a size comparable and even larger than the micropillar size. At low flow speeds (
u < 0.714 mm/s and
u < 2.85 mm/s for the Cit and PEG samples, respectively), the deposits have a rounded shape and a diffuse layer with a smaller particle concentration is observed around their extremities. The diffuse layer disappears at higher speeds and the deposit shape becomes sharper. Spikes on the surface of the rear deposit (situated on the micropillar side opposite to the flow) are detected for the Cit sample at intermediate speeds (0.714 ≤
u ≤ 2.85 mm/s). Such behaviors qualitatively agree with those observed for particles deposits around a magnetizable microbead [
24] and are interpreted as follows. Since the IONPs suspension has a certain degree of polydispersity (
Figure 1), diffuse layer at low speeds likely corresponds to accumulation of smaller IONPs around thick deposits composed of larger particles. This layer provides continuous variation of the magnetic field and of the hydrodynamic pressure on the deposit surface; this favors rounded deposit shapes and excludes surface instabilities. At higher speeds, the diffuse layers are expected to be “squeezed” by the flow, this likely causes discontinuity of the magnetic field and hydrodynamic pressure, which results in sharp deposit shape and possible surface instabilities. It is also remarkable that at all moments of time, the front deposit (facing the flow) is always larger than the rear one. This can be explained by the fact that the front deposit surface is mostly subjected to compressive hydrodynamic force, while the rear deposit is mostly subjected to a tensile hydrodynamic force, so the flux of particles ruptured from the rear deposit is expected to be higher on average than that for the front deposit.
The deposit size shows a non-monotonic dependency on the hydrodynamic flow speed: it increases, reaches a maximum at u ≈ 0.714 mm/s and 2.85 mm/s for the Cit and the PEG samples, respectively, and decreases at higher speeds. Such behavior may have different origins for two different samples. Needle-like aggregates were observed in the Cit sample at all speeds except for the quiescent suspension (u = 0). At zero and very low flow speeds, the aggregates are expected to settle under gravity and be immobilized at the bottom of the channel before arriving to the micropillar. The aggregates forming in the vicinity of the micropillar were absorbed by the nanoparticle deposits, thus no settled aggregate was observed in the observation window at u = 0. We checked that there were a lot of settled aggregates outside the observation window on the left and the right side of the micropillar. At higher speeds, the aggregates were transported by the flow and their fate depended on the compromise between the travel and settling times. Since the aggregates usually had unequal sizes, thicker aggregates settled faster and had less chance to reach the micropillar than thinner ones. With increasing flow speed, the traveling time got shorter and larger aggregates had more chances to touch the micropillar. This explains the growth of the deposit size at low velocity. With a further increase of the speed, hydrodynamic drag forces detaching nanoparticles from the deposit surface increased, and the deposit size decreased.
In addition, the snapshots show that the size of nanoparticle aggregates decreased with increasing flow speed, which could be explained by the fact that the aggregates had less time to grow when traveling from the channel inlet to the micropillar at high speeds. Therefore, the magnetophoretic flux of aggregates is expected to decrease and induce a decrease of the deposit size with increasing flow speed. In fact, the travelling time
t =
Vs/
Q varies from about 0.5 to 7 min in our experiments, where
Q is the flowrate and
Vs is the suspension volume downstream to the micropillar (including a part of the tubing connecting the syringe pump with the microfluidic channel) exposed to the external magnetic field. During this time, in the quiescent suspension the aggregates achieved sizes ranging between about 50 and 300 µm for citrated IONPs. The size was below 50 µm (the micropillar size) for PEGylated IONPs, as inferred from the study of kinetics of aggregation (
Figure 5). As a result, the faster particle aggregation in the Cit sample seems to significantly enhance the accumulation of nanoparticles around the micropillar, as compared to the PEG sample.
In the PEG sample, smaller aggregates were expected to sediment slower, such that the maximum deposit volume was expected at lower hydrodynamic speeds than for the Cit sample, as opposed to what is observed in experiments. However, a smaller magnetophoretic flux of smaller aggregates could result in longer times to build the deposits. It is therefore likely that the steady state was not achieved for the PEG sample at the maximum observation time of 60 min. In other words, the deposits would likely have continued to grow at low speeds and reached their maximum size at t > 60 min.
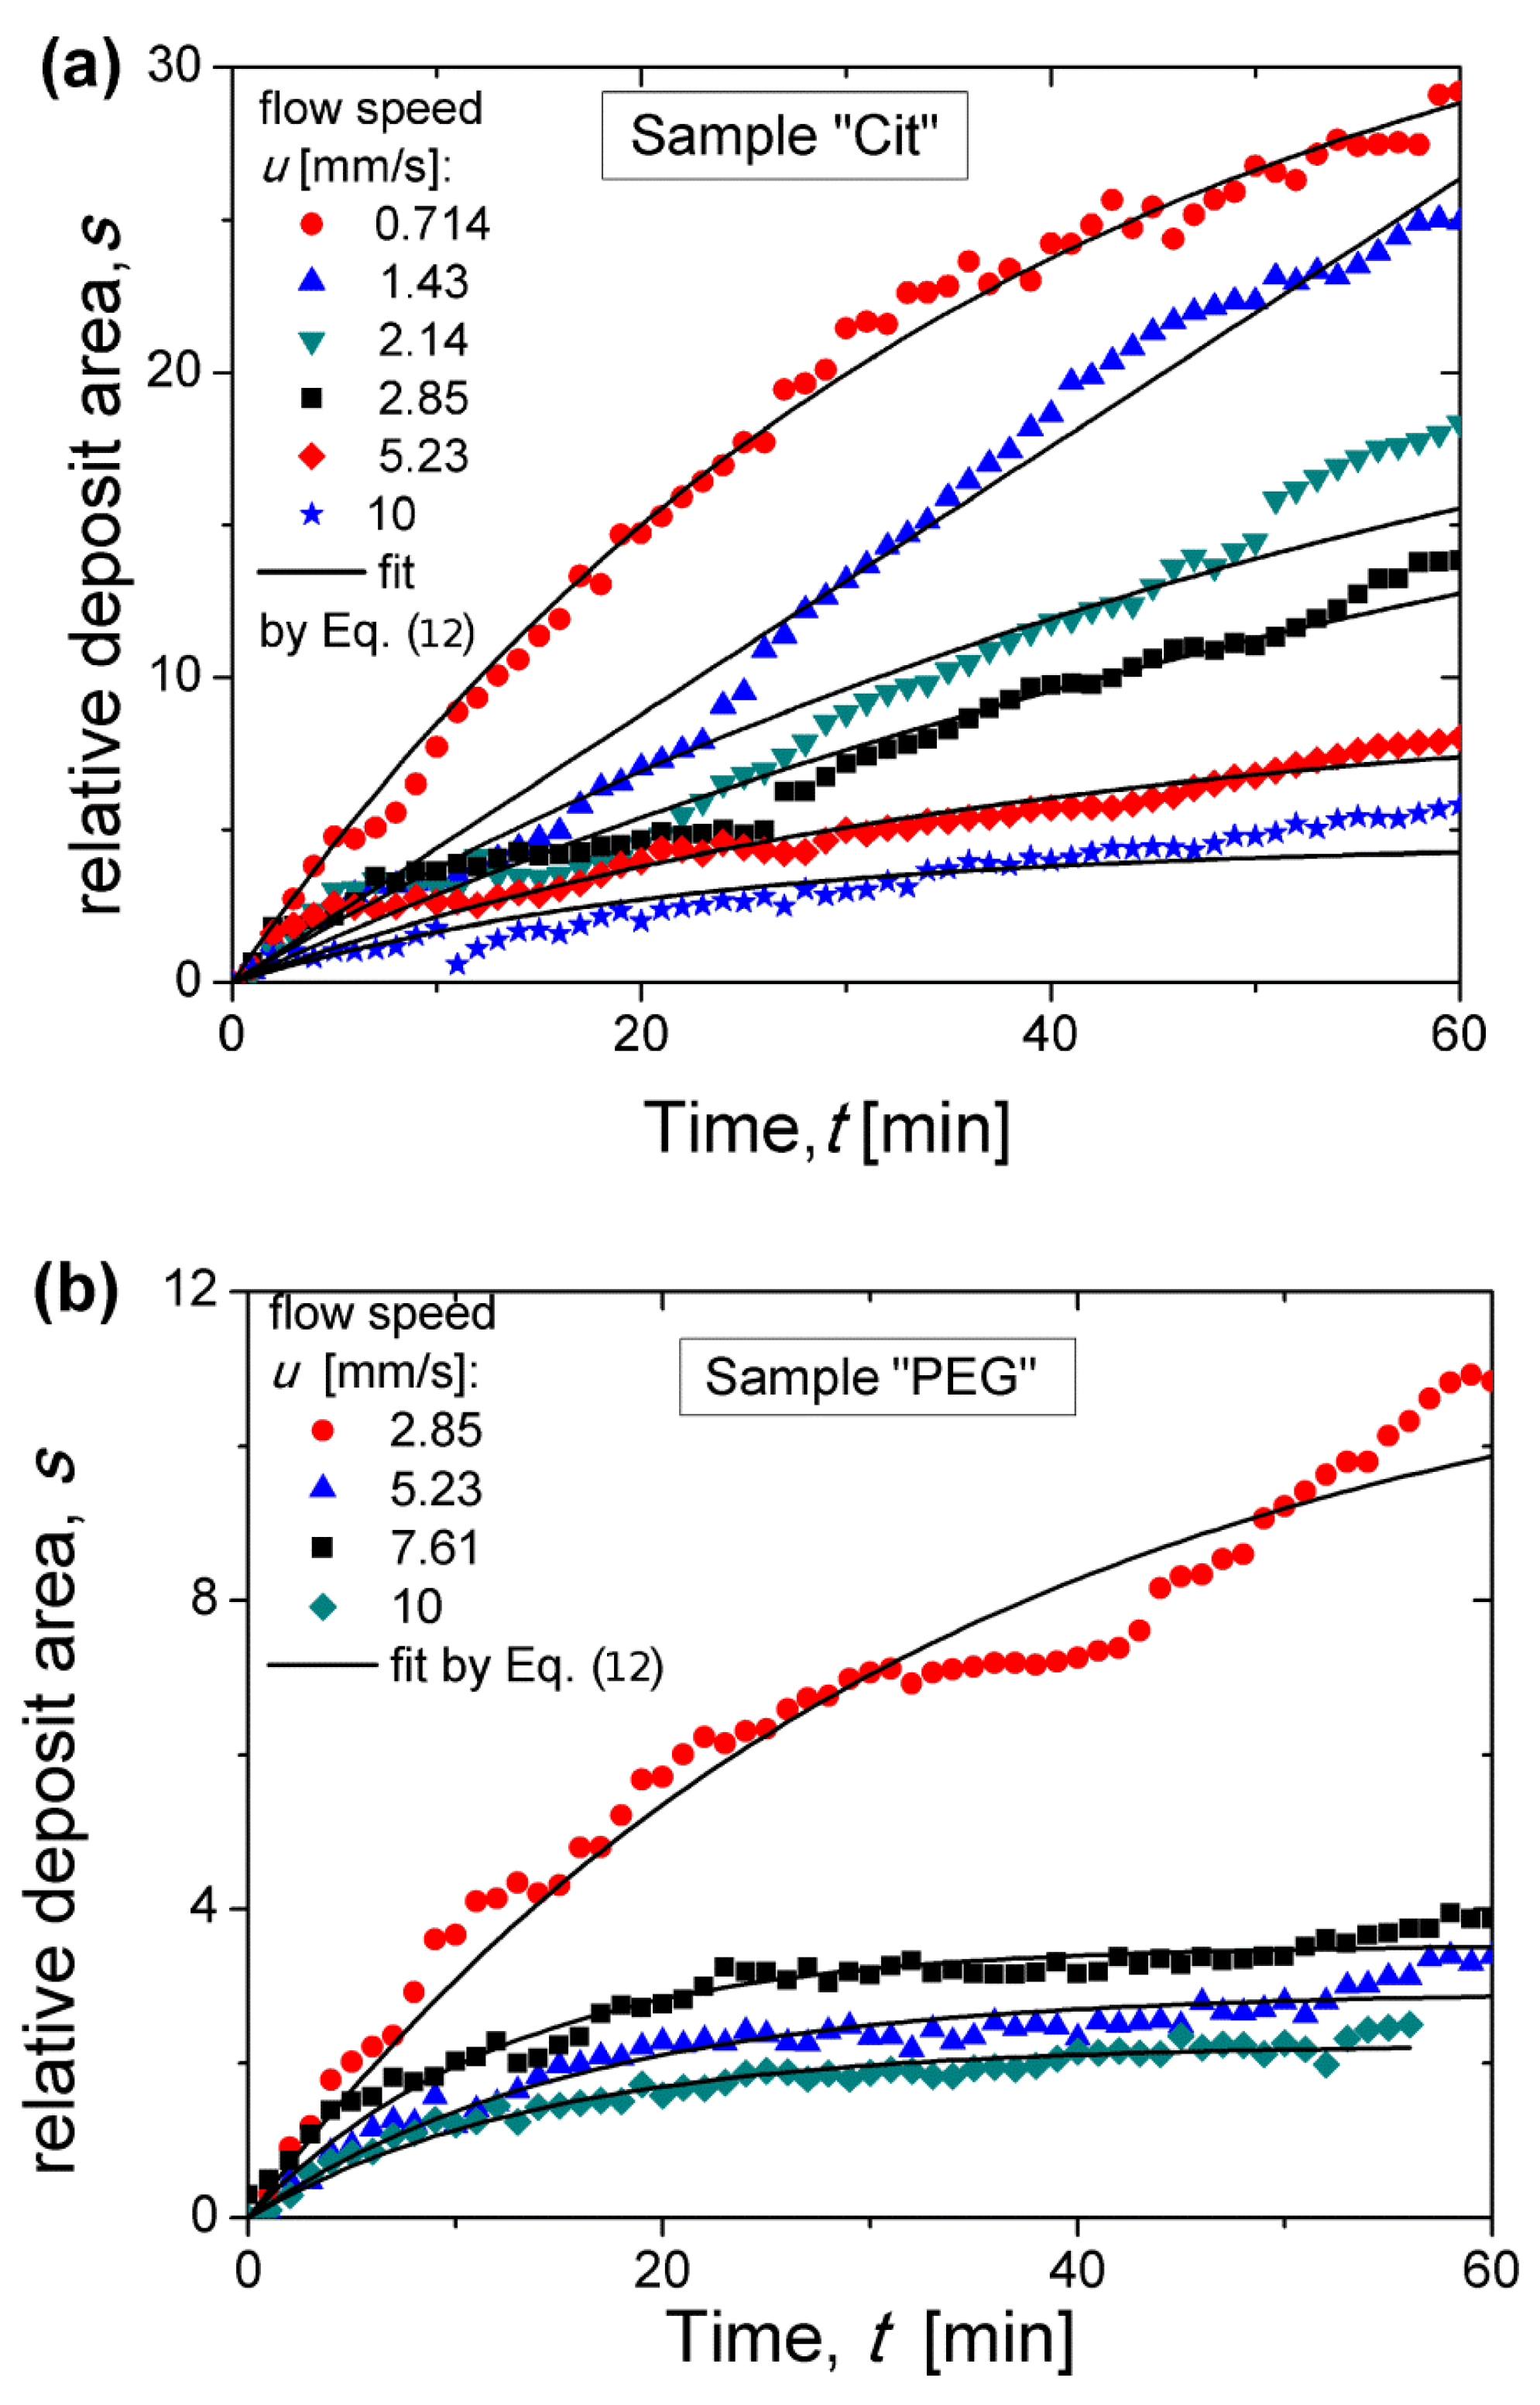
3.4. Magnetic Separation: Deposit Growth
To quantify the process of nanoparticle accumulation, the relative deposits area (surface area normalized by the micropillar cross-section
πdm2/4) was measured at each elapsed time as described in detail in
Section 2.6. Experimental dependencies of the relative deposit area
s on the elapsed time
t are shown in
Figure 7a,b for the Cit and PEG samples, respectively at different flow speeds. At relatively high flow speeds, the
s(
t) curves seem to achieve a final plateau corresponding to the maximum quantity of nanoparticles that the micropillar was able to retain; the value
at the plateau is hereinafter called the retention capacity. At relatively low speeds, such a plateau was not achieved and the deposits are expected to grow at
t > 60 min, as suggested in
Section 3.3.
To extract valuable quantitative information from these curves, we have to find an appropriate function fitting the experimental
s(
t) curves. A physically relevant fitting function can be found from the balance of the total volume of captured nanoparticles requiring that the growth rate of the deposit area
S = π
dm2s/4 is equal to the volume particle flux
Js of particles captured by unit height of the micropillar:
where
is the volume fraction of inorganic nanoflowers of diameter
in the deposit, approximately equal to a random close packing fraction taking into account for the thickness
of the grafted molecular layer on the multicore surface,
J0 is the particle flux at the beginning of the filtration process (
t = 0), and
f(
s) is an empirical function taking into account the decrease of the flux
Js of captured particles as the deposit area increases. The capture efficiency Λ at the beginning of the magnetic separation is conventionally introduced as the ratio of the particle flux
J0 to the convective flux of particles (by unit micropillar height) through a cross-section whose area is equal to the projected area of the micropillar to the plain perpendicular to the flow [
44]. Thus, the expression for the flux
J0 reads:
where
ϕ0 is the multicore IONP volume fraction far from the micropillar. It has been checked that the empirical function
, often used in filtration theory [
57], ensures a reliable fit of experimental data. Using this function and Equation (11) in Equation (10), we get the following semi-empirical
s(
t) dependency:
The experimental
s(
t) dependencies were fitted by Equation (12) using two adjustable parameters: the retention capacity
sm and the capture efficiency Λ related to the initial slope of the
s(
t) dependency. Note that the incertitude on Λ includes the error related to determination of the organic layer thickness on the citrated (0.2–1 nm) and PEGylated (3.4–7.8 nm) IONPs and intervening into
ϕd. This fit is shown by solid curves in
Figure 7. As expected, Equation (12) fits the experimental data reasonably well at relatively high speeds when the saturation plateau is well distinguishable. At lower speeds, the experimental curves are far from saturation and the fitted values of the retention capacity
sm may have not been correctly estimated. The capture efficiency and the retention capacity are analyzed in detail in the two next sections as functions of dimensionless parameters governing the capture process.
3.5. Magnetic Separation: Capture Efficiency
First, we intend to predict a scaling law of the capture efficiency as a function of Mason number, which then will be compared to experimental data. Visualization of magnetic separation suggests the existence of nanoparticle aggregates during the magnetic separation process that are well visible in the snapshots of the citrated sample (
Figure 6a) but not of PEGylated samples under flow (
Figure 6b) (just because they are much thinner and the exposure time of the camera of the microscope was likely insufficient to capture an image of these small objects under flow) but they became detectable if the flow was rapidly stopped. Thus, as the suspension flew along the pathway submitted to the applied magnetic field (including a part of the tubing connecting the syringe pump with the microfluidic channel), the nanoparticles aggregated. According to phase diagrams of dipolar colloids, during aggregation, the bulk needle-like aggregates coexisted with either individual nanoparticles or with single chain-like clusters [
58,
59]. Therefore, the capture efficiency of such a mixture is the sum of the capture efficiencies of the aggregates (Λ
a) and of the chain-like clusters (Λ
c) weighted by the relative volume of nanoparticles constituting the aggregates and the chains, respectively:
where
ϕ0 is the initial nanoparticle volume fraction in the suspension,
is the ratio of the total volume of nanoparticles constituting the aggregates to the suspension volume, Ф is the volume fraction of aggregates in the suspension at a given moment of time, and
ϕd is the nanoparticle volume fraction inside the aggregates. Note that individual nanoparticles can be regarded as a limiting case of the chain-like clusters with the average number of particles equal to one.
The capture efficiency of chain-like clusters has been evaluated in our previous work [
56]. The chains were supposed to be relatively fragile and ruptured into parts by tensile hydrodynamic forces in the vicinity of the micropillar. The chain length was estimated from the balance of hydrodynamic and magnetic forces exerted to the constitutive nanoparticles. The following scaling relationship for the capture efficiency Λ
c has been found in the limit of high Mason numbers valid in the present work:
where 2 <
N < 10 is the number of nanoparticles per chain and the Mason number
Ma is introduced as a characteristic ratio of hydrodynamic to magnetic forces exerted to individual multicore nanoparticles.
We have now to evaluate the capture efficiency
of bulk needle-like aggregates. This magnitude is related to the initial volume flux
J0 of nanoparticles constituting the aggregates (Equation (11)) on the micropillar surface, which is related to the volume flux of aggregates
Ja through
. Since the aggregates were micron-sized, they were non-Brownian, and on the micropillar surface (where non-slip hydrodynamic boundary condition applied) the only non-zero flux was the magnetophoretic flux whose magnitude by unit micropillar height is given by the following formula [
56]:
where
ba is the aggregate hydrodynamic mobility perpendicular to the aggregate main axis;
F is the radial component of the magnetic attraction force between the aggregate and the micropillar,
P~
dm is the micropillar perimeter; the integration is performed over the part Ω of the micropillar perimeter along which the aggregates are captured. It has been shown that, in the limit of high Mason numbers, Ω tends to
P and is almost independent of the Mason number [
60]. Since the aggregates with a high length-to-diameter ratio,
L/
da, are typically observed from the very beginning of the capture process (
Figure 6a), the aggregate hydrodynamic mobility scales as
~
, neglecting the logarithmic term on
L/
da [
61]. The absolute value of the magnetic force exerted to the aggregates is
, with the aggregate magnetic moment estimated as
~
and the magnetic field gradient on the micropillar surface scaling as
~
, where
Nd is the average number of nanoparticles constituting the aggregate. This gives us the following scaling law for the magnetic force:
~
. Combining all the terms together and making use of Equation (11), in which the volume fraction
ϕ0 of all particles has to be replaced by the volume fraction
ϕa of the particles constituting the aggregates, we get the following scaling relationship for the capture efficiency of the aggregates:
Supposing that the aggregate shape is defined by the minimum of its free energy, the aggregate diameter is related to its dimensionless volume
(defined in
Section 3.2) through the following approximate relationship [
18]:
Since the moment when IONPs enter the region of the applied magnetic field, they are expected to form aggregates whose size increases progressively along their pathway before they arrive at the surface of the deposit on the micropillar. Unlike fragile chain-like-clusters, the bulk aggregates are supposed not to be destroyed by hydrodynamic forces in the vicinity of the micropillar provided that their size is comparable to the characteristic length-scale of the velocity variation equal to the micropillar diameter. Thus, their size at the location of the micropillar is defined by the travel time
t =
Vs/
Q =
Lc/
u corresponding to a characteristic length
Lc of their pathway subjected to the external magnetic field. As mentioned in
Section 3.3, the travel time of the nanoparticle aggregates before arriving at the micropillar varies from about 0.5 to 7 min. During this time interval, the experimental
s(
t) dependences remain approximately linear, as inferred from
Figure 7, such that the travel time can be safely used for evaluating the initial slope of the
s(
t) curves related to the capture efficiency. To evaluate the aggregate volume at the time equal to the travel time, we suppose that the aggregate growth in the flowing suspension is descried by the same equation as in the quiescent one, i.e., by Equation (5), which takes the following approximate form (setting
~1 and neglecting logarithmic terms and numerical constants) in the considered interval of travel times 0.5 <
t < 7 min:
where
is the maximum value of the dimensionless volume of the aggregate growth stage corresponding to the plateau of the
curve [
18];
and
are supersaturations at the beginning of the nucleation and aggregate growth stages, respectively; the Péclet number
Pe is introduced as the ratio of characteristic convective to diffusive fluxes of individual nanoparticles and is shown to be proportional to the product of the Langevin parameter (Equation (7)) and the Mason number (Equation (15)). Using Equations (18) and (19) in Equation (17), the expression for the capture efficiency of aggregates takes the final form as follows:
The mixture rule (Equation (13)) for the capture efficiency of all nanoparticles (belonging to both bulk aggregates and chain-like clusters) gives the Mason number behavior with the exponent varying from 1.7 (Equation (14)) when all the nanoparticles are gathered into chain-like clusters to 11/7 ≈ 1.57 (Equation (21)) when all the nanoparticles constitute aggregates. The exponent n varies therefore in a quite narrow interval between two limiting cases and we expect the experimental exponent to fall into this interval.
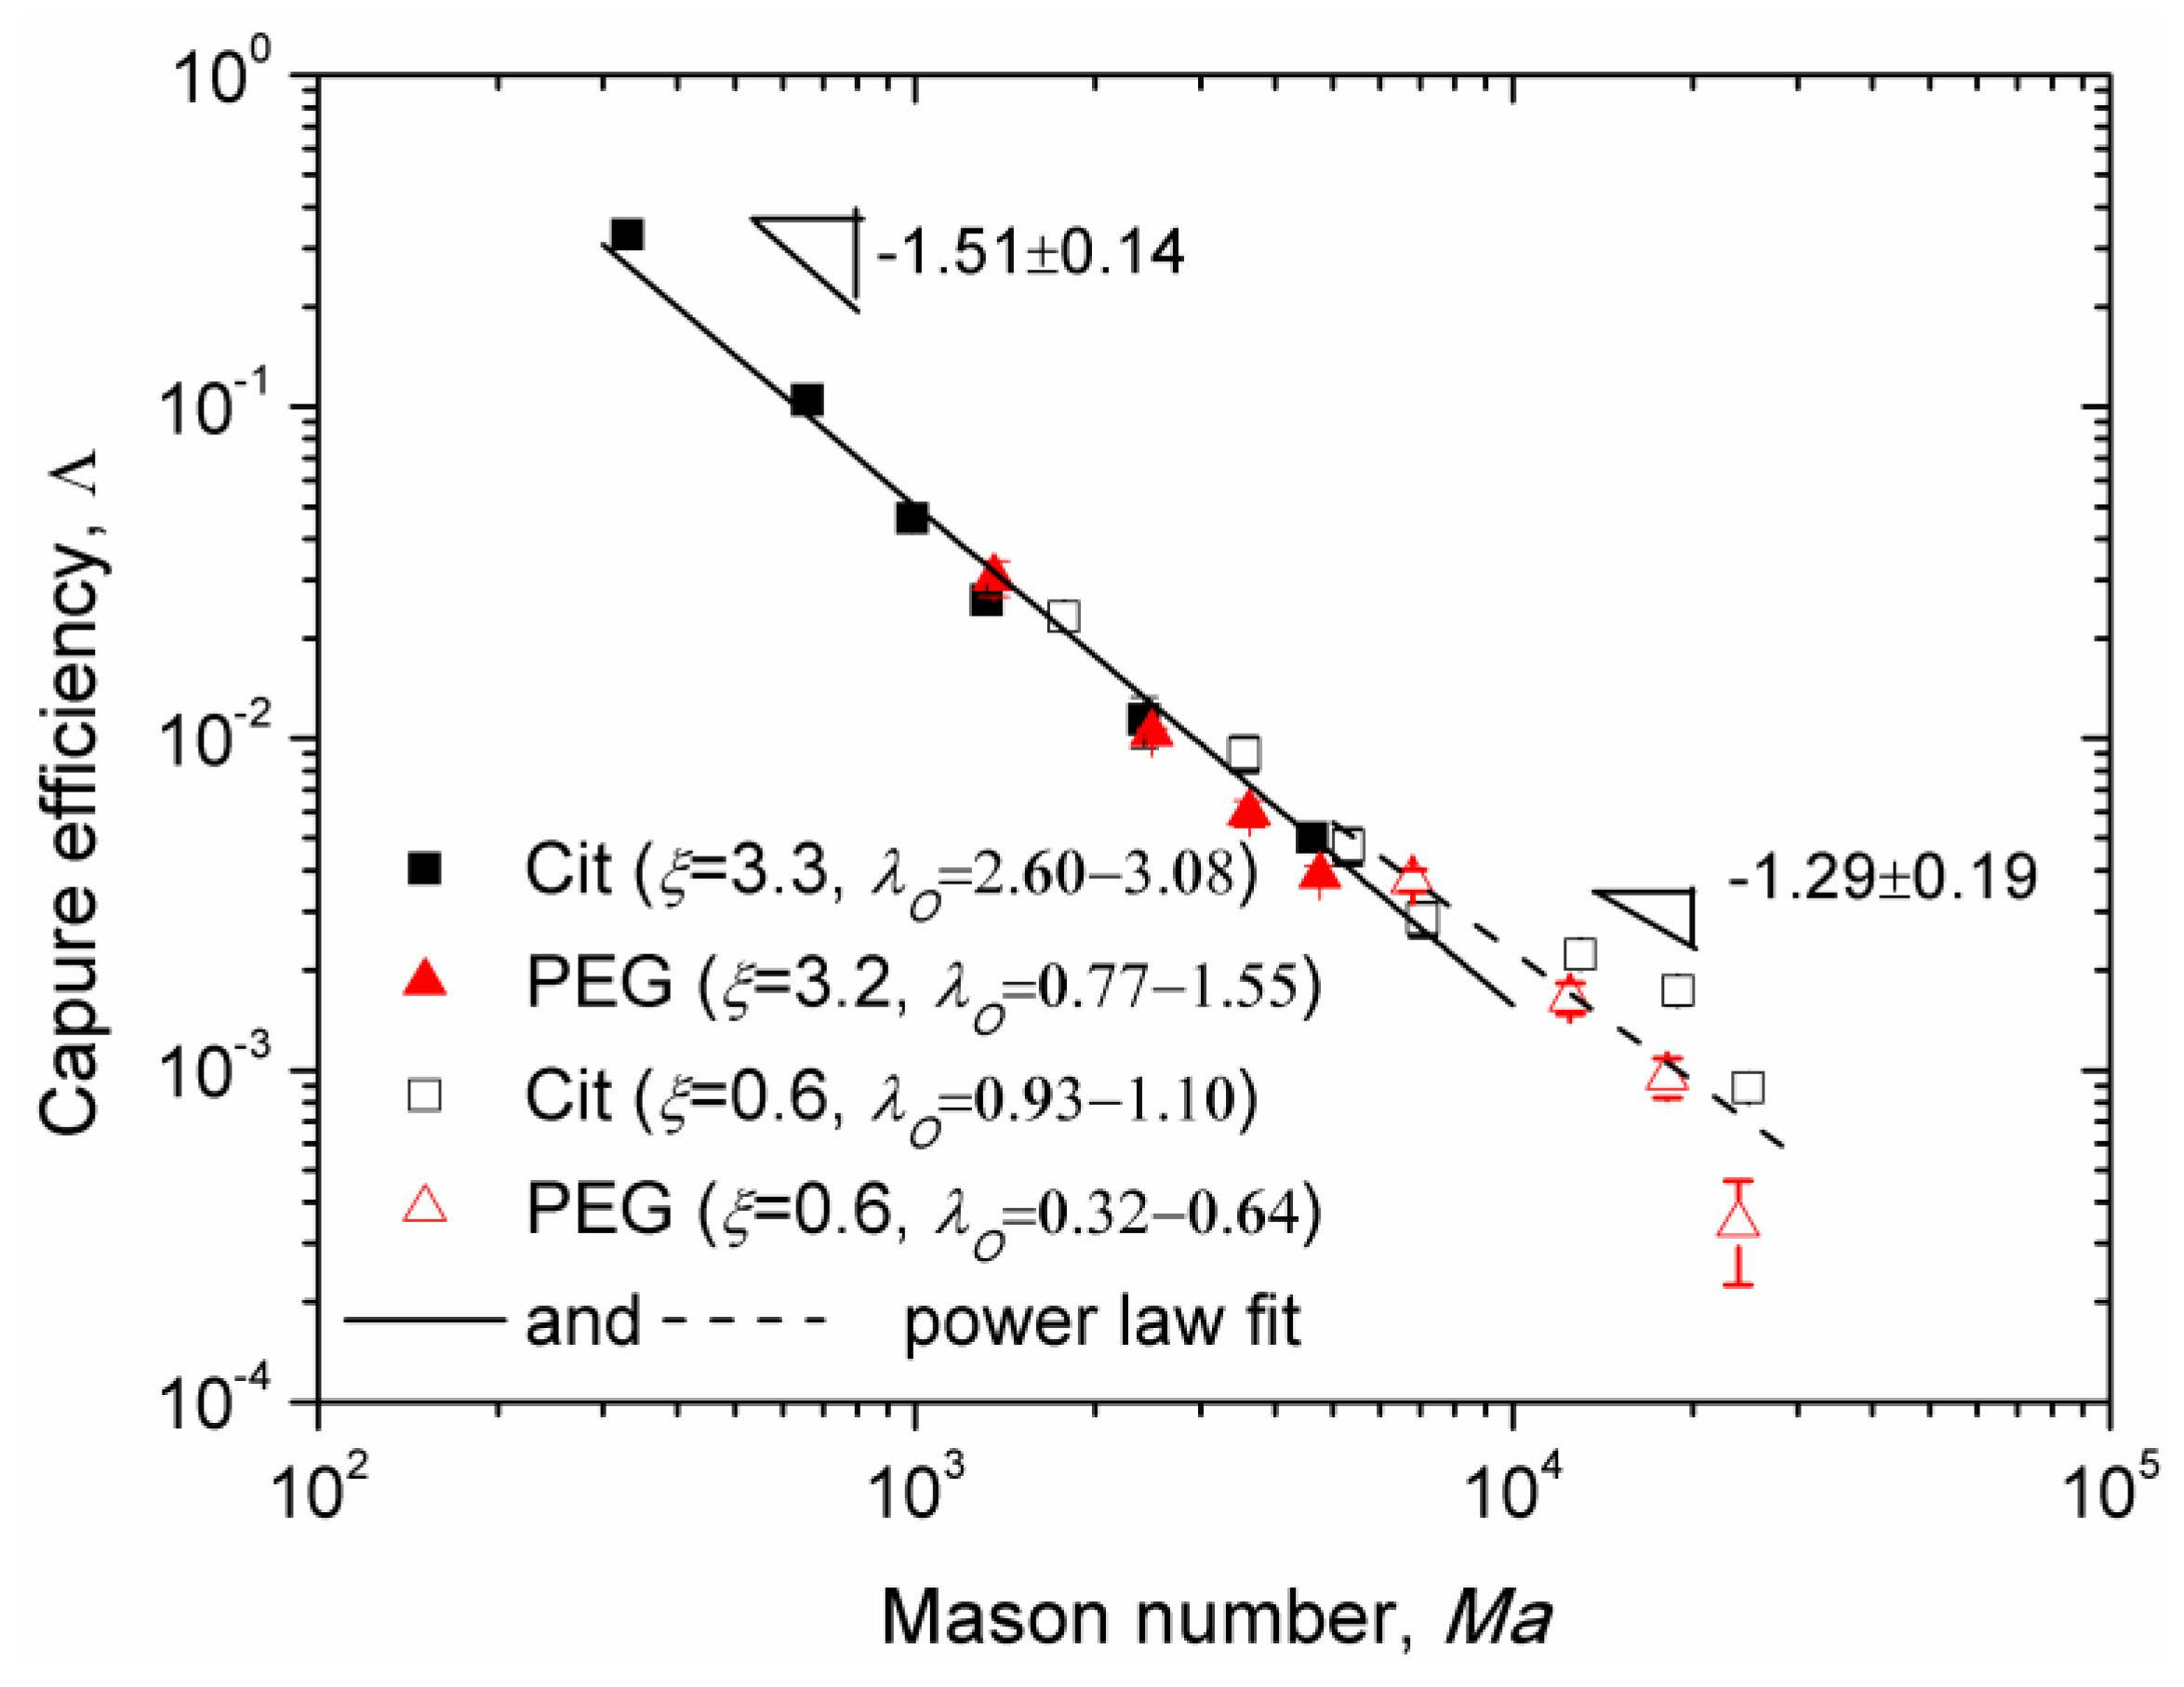
Experimental Mason number dependences of the capture efficiency are shown in
Figure 8 for the Cit and the PEG samples for two values of the applied magnetic field corresponding to different values of the parameters
λI,
λO, and
ξ. Here, we excluded the data obtained at low flow speeds for which the majority of nanoparticle aggregates settled on the channel bottom before arriving to the micropillar. All the data for
Ma < 10
4 appear to collapse around a single master curve (solid line in
Figure 8) showing a power law dependency on Mason number,
, with the exponent
n = 1.51 ± 0.14, whose interval (1.37; 1.65) overlaps with the theoretical interval (1.57; 1.7). At Mason numbers
Ma > 10
4, the Mason number effect becomes weaker and the best fit (dashed line in
Figure 8) is ensured with a lower absolute value
n = 1.29 ± 0.19 of the exponent not falling into the predicted interval (1.57; 1.7). This is likely because the flow is too intense at such high Mason numbers and the chain-like clusters are destroyed to individual nanoparticles in the vicinity of the micropillar. The capture efficiency
of individual nanoparticles is obtained by setting
N = 1 in Equation (14):
. The bulk needle-like aggregates are still observed at these high Mason numbers, at least for the Cit sample. Thus, the mixture rule (Equation (13)), in which
should be replaced by
, will give us a theoretical exponent
n belonging to the interval (1; 1.57). At this condition, the experimental interval (1.10; 1.48), obtained at
Ma > 10
4 falls into the theoretical one.
According to our model, the adsorbed layer thickness influences the capture efficiency through the term , which increases with the dipolar coupling parameter and therefore decreases with the adsorbed layer thickness. This seems to be only confirmed for the value (corresponding to ξ ≈ 0.6), for which the experimental points of the Cit sample lie in average slightly above the points of the PEG sample. In what concerns the effect of the Langevin parameter ξ, according to our model, it affects the capture efficiency through the term . However, the experimental data for two rather different values of ξ (0.6 and 3.2–3.3) seem to gather along a single master curve whose slope in the log-log scale changes progressively from −1.51 to −1.29 as the Mason number increases. Such data collapse would not occur if the Langevin parameter strongly influenced the capture efficiency.
A small difference between both samples and insignificant effect of the Langevin parameter can be explained by the fact that in the beginning of the intermediate aggregate growth stage of aggregation, only a small portion of nanoparticles composes aggregates, while the rest of the nanoparticles are expected to form chains very quickly during the fast nucleation stage. The capture efficiency of the chain-like clusters does not depend (in the wide Ma and λO ranges) on λO and ξ but solely on the Mason number. According to the mixture rule of capture efficiency (Equation (13)), at small fraction of aggregates, , the contribution of chain-like clusters to the capture efficiency could become dominant and masking the effect of λO and ξ parameters on the capture efficiency.
Note that the highest capture efficiency
has been obtained for the citrated samples at the flow speed
u = 0.714 mm/s and at a relatively low magnetic field (13.5 kA/m) relevant for microfluidic applications such as magnetic immunoassays [
11]. Reliable data for the PEGylated sample has not been obtained for this speed because of unreliable fit of the experimental
s(
t) dependencies. However, as Λ(
Ma) dependencies for PEGylated and citrated samples are almost superimposed on a wide range of Mason numbers (and speeds) as seen on
Figure 8, we would expect a nearly similar capture efficiency for the PEGylated sample at
u = 0.714 mm/s. The value of
corresponds to capture of 30% of nanoparticles transported by the suspending liquid through the cross section equal to the projected area of the micropillar. In a realistic microfluidic device, a single micropillar should be replaced by an array of micropillars spanning the entire channel width, thereby significantly increasing the capture efficiency and allowing capturing most of nanoparticles entering the microchannel, as has been recently shown for oleate covered iron oxide nanoclusters [
56] of an average size comparable to that of the multicore IONPs used in the current study.
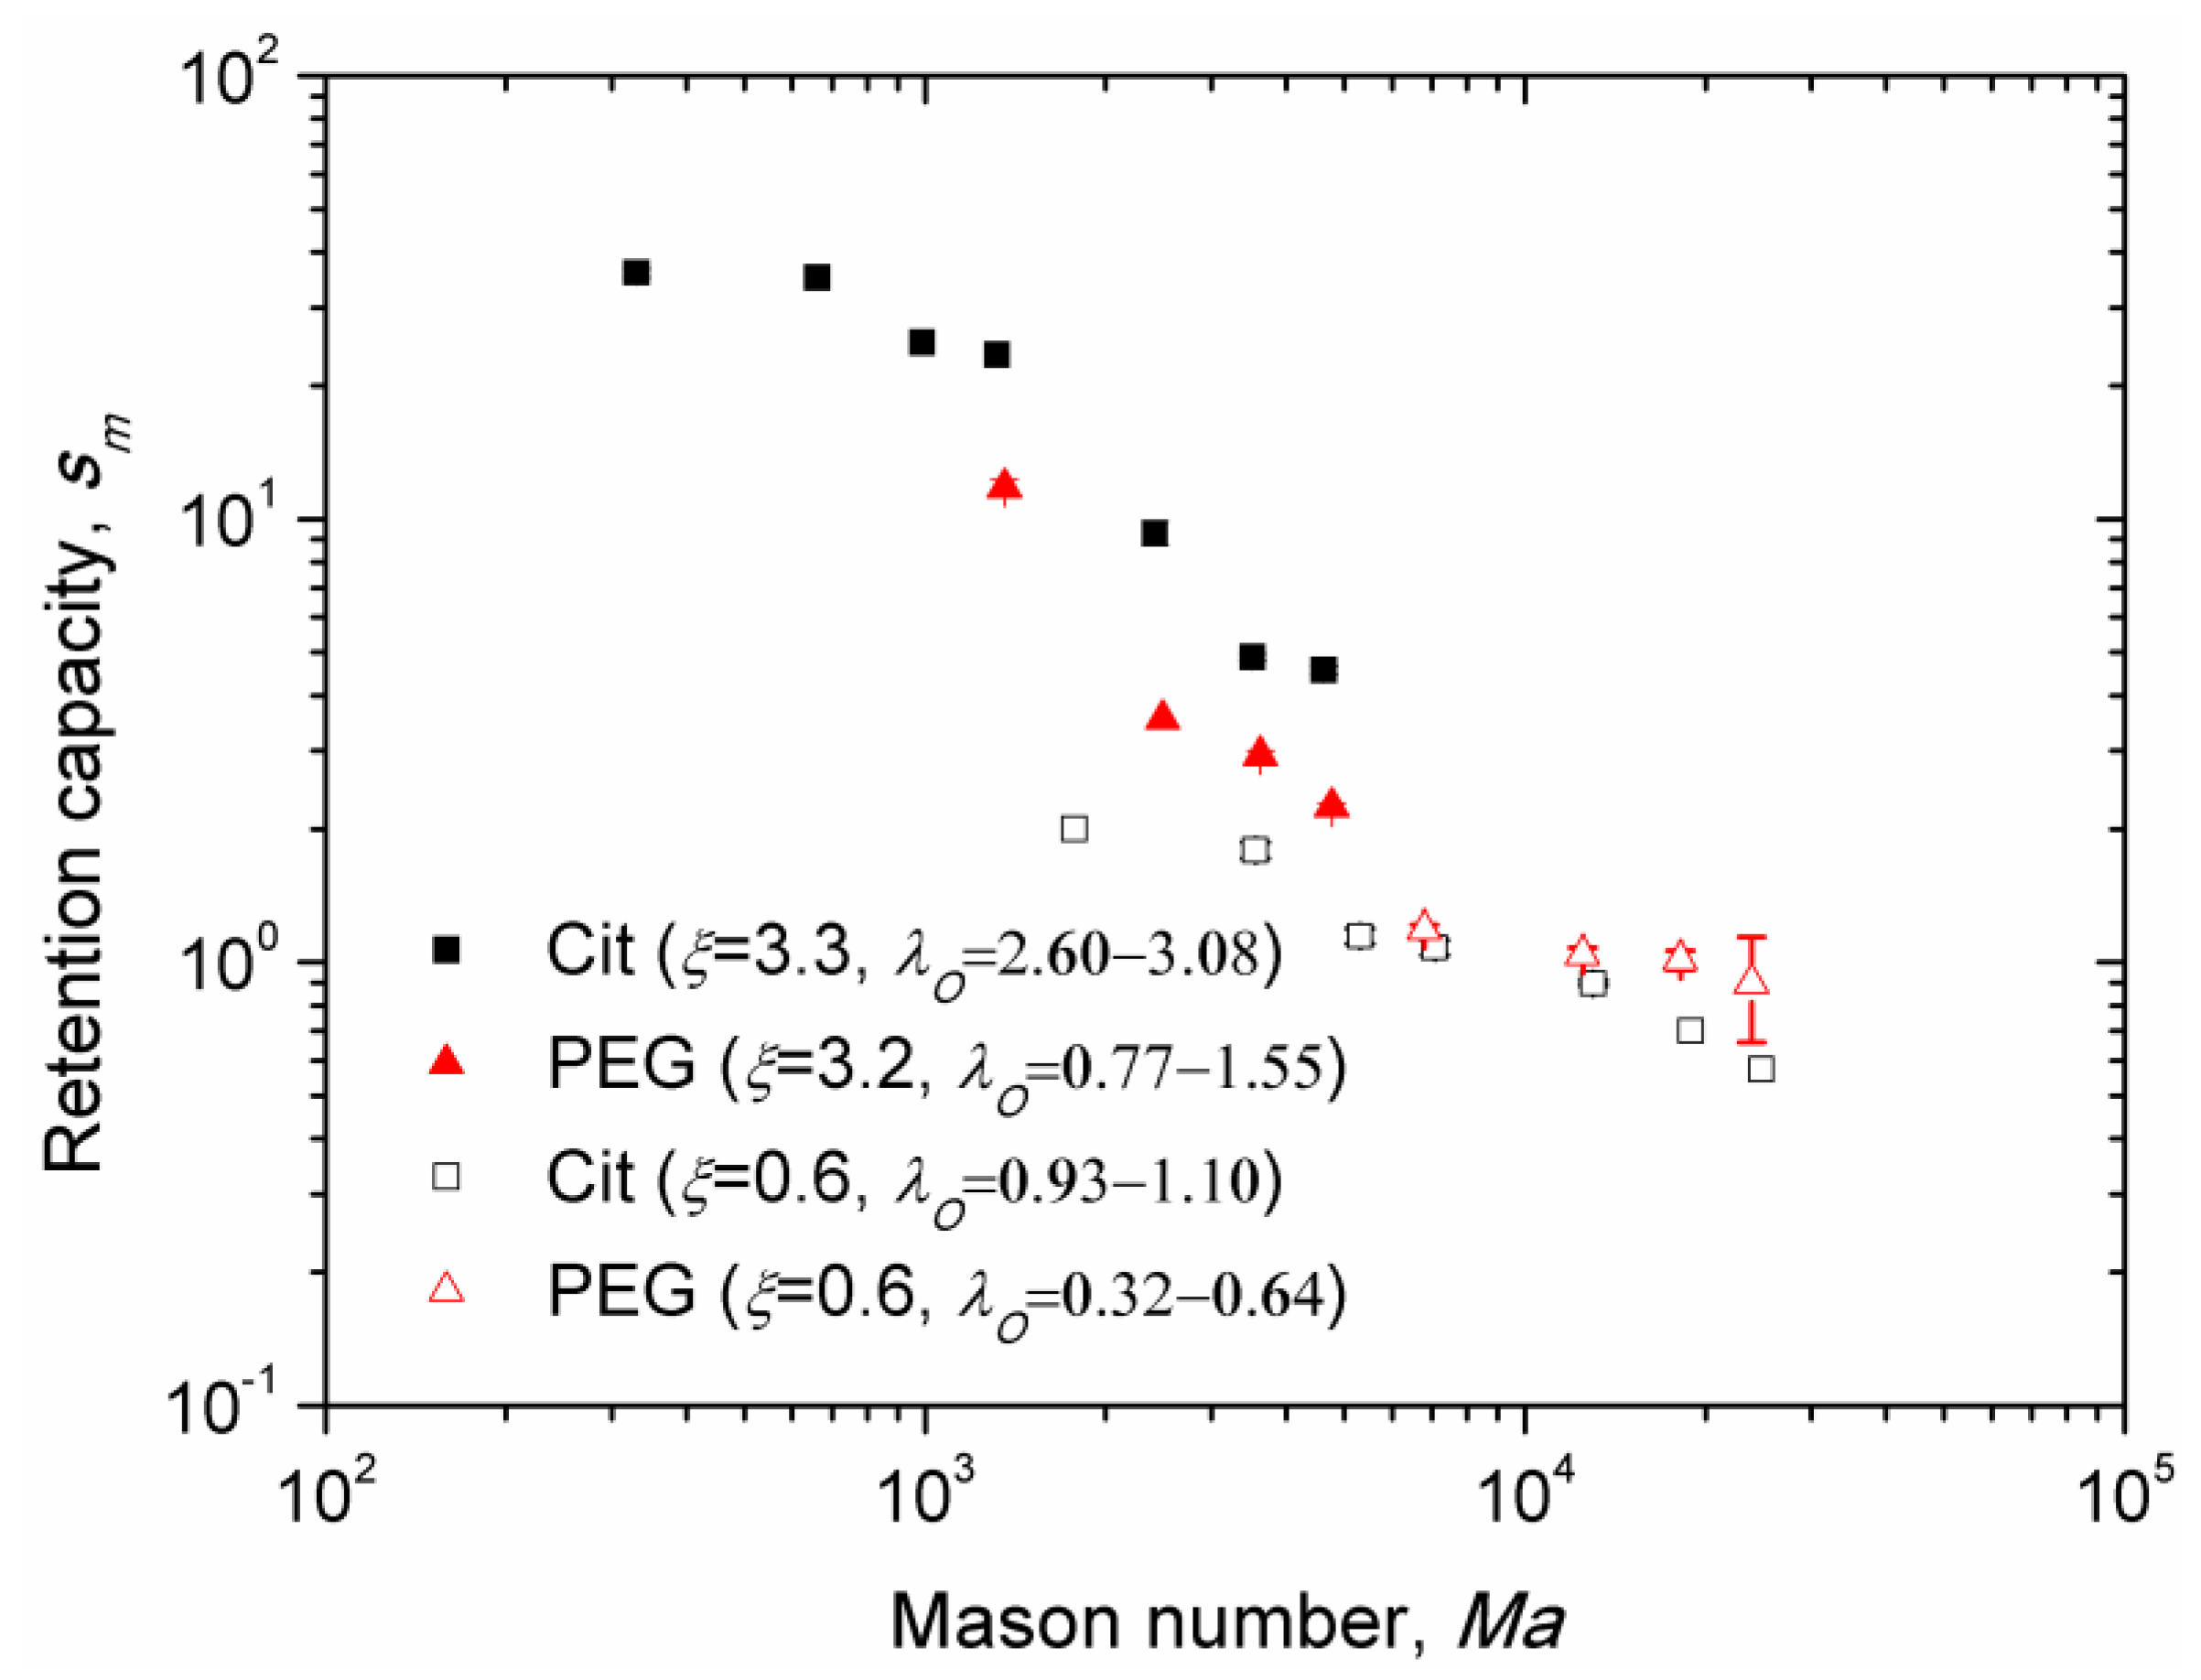
3.6. Magnetic Separation: Retention Capacity
Experimental dependences of the retention capacity versus Mason number are shown on
Figure 9 for the Cit and the PEG samples and for different values of the parameters
ξ and
λO, recalling that the latter parameter is defined for sample at an uncertainty related to determination of the thickness of the adsorbed citrate and PEG layer (
Section 2.4). Similar to
Figure 8, we excluded from
Figure 9 the data for which the nanoparticle aggregates settled on the channel bottom before arriving to the micropillar. Note that the retention capacity corresponds to the steady-state deposit size at infinite elapsed times. Unlike the Mason number dependency of the capture efficiency, the data of the retention capacity no longer gather onto a single master curve for the PEG and Cit samples. In all cases, the retention capacity is found to progressively decrease with the Mason number, which is confirmed by visualization of the nanoparticle deposits at long elapsed times. At stronger fields
H0 and lower flow speeds
u, both corresponding to lower Mason numbers
, larger deposits were generally observed (
Figure 6).
In the case of the Cit sample, the retention capacity appears to be about five times higher for the Langevin parameter ξ = 3.3 than for ξ = 0.6 in the range of the Mason numbers 103 < Ma < 5 × 10³. Furthermore, at nearly the same Langevin parameter, ξ = 3.2–3.3, i.e., at the same applied magnetic field, the Cit sample (characterized by the dipolar coupling parameter λO = 2.60–3.08) exhibits a retention capacity about twice larger than the PEG sample (with λO = 0.77–1.55) in the same range of Mason numbers. These two effects are ascribed to an increase of magnetic interactions between nanoparticles and the micropillar as well as between nanoparticles themselves within the deposit, with increasing ξ and λO parameters. Stronger magnetic dipolar interactions allow nanoparticles to better resist against rupturing hydrodynamic forces on the deposit surface. Thus, with increasing ξ and λO parameters, the force equilibrium (defining the location of the deposit surface) was shifted further from the micropillar surface, thereby increasing the deposit volume.
However, the data for the PEG sample at ξ = 0.6 does not seem to follow this trend; they show higher retention capacity than for the Cit sample at the same ξ. Analyses of the snapshots of magnetic separation of these both samples at ξ = 0.6 shows that the deposits of citrated particles were much denser than those of PEGylated ones. This is probably because the magnetic interactions between PEGylated particles (described by the parameter λO = 0.32–0.64) are not strong enough and the Brownian motion along with hydrodynamic flow around the micropillar makes the deposits much sparser and more diffuse than the deposits of citrated particles exhibiting a stronger dipolar interaction parameter λO = 0.93–1.10. In this case, a clear interface of the deposit does not exist for the PEGylated sample, and the deposit size is rather defined by a characteristic length scale of the concentration variation around the micropillar, which could be larger than the size of the concentrated deposit of the Cit sample. It is very likely that the amount of nanoparticles retained in the dense deposit of the Cit sample is larger than that retained in the sparse deposit of the PEG sample. Unfortunately, we are unable at the present time to evaluate this amount quantitatively.
Finally, it is important to note that at the lowest flow speed (at which nanoparticle aggregates arrive at the micropillar before settling onto the bottom) and at the magnetic field intensity
H0 = 13.5 kA/m, we achieve a steady-state volume of the nanoparticle deposits of about 40 and 10 times of the micropillar volume for the citrated and PEGylated samples respectively. This shows high retention capacity of these nanoparticles at realistic flow rates and relatively low magnetic field, relevant to on-chip applications to immunoassays [
11].


 and
and 


